Scholars' Mine Scholars' Mine
Masters Theses Student Theses and Dissertations
Spring 2009
Investment shell cracking Investment shell cracking
Edward A. Druschitz
Follow this and additional works at: https://scholarsmine.mst.edu/masters_theses
Part of the Materials Science and Engineering Commons
Department: Department:
Recommended Citation Recommended Citation Druschitz, Edward A., "Investment shell cracking" (2009). Masters Theses. 5003. https://scholarsmine.mst.edu/masters_theses/5003
This thesis is brought to you by Scholars' Mine, a service of the Missouri S&T Library and Learning Resources. This work is protected by U. S. Copyright Law. Unauthorized use including reproduction for redistribution requires the permission of the copyright holder. For more information, please contact [email protected].
i
INVESTMENT SHELL CRACKING
by
EDWARD ALAN DRUSCHITZ
A THESIS
Presented to the Faculty of the Graduate School of the
MISSOURI UNIVERSITY OF SCIENCE AND TECHNOLOGY
In Partial Fulfillment of the Requirements for the Degree
MASTER OF SCIENCE IN MATERIALS ENGINEERING
2009
Approved by:
Dr. Von L. Richards, Advisor Dr. Ronald Kohser
Dr. Frank Liou
iii
PUBLICATION THESIS OPTION
This dissertation consists of three articles submitted for publication as follows. Each
article is prepared according to the respective style of the publication. Pages 3-17 have
been submitted for publication in the International Journal of Cast Materials. Pages 18-
32 have been published by The Minerals, Metals, and Materials Society. Pages 33-45
have been published by the Investment Cast Institute.
iv
ABSTRACT
Shell cracking is the single greatest problem affecting investment casters. A
clearer understanding of the factors affecting the melt profile of the wax can be gained
using computational fluid dynamics (CFD) to model the interaction among 1) the thermal
conductivity of the wax, 2) the thermal conductivity of the shell, and 3) the temperature
of the autoclave during the autoclave de-waxing cycle. The most favorable melt profile
results from a high autoclave temperature (438°K to 458°K) and saturated thermal
conductivity of the shell (1.36 to 1.40 Wm-1k-1) in conjunction with a low wax thermal
conductivity (0.33 Wm-1k-1). These parameters reduce the likelihood of shell cracking as
a result of wax bulk expansion.
Thin wall ice patterns can be invested by coating patterns with a tridecane
interface agent, using a 20 wt% ethyl silicate binder with 20 wt% fiber-containing fused
silica flour added after the primary coat, delaying the application of the catalyst by 4
hours, and maintaining a -10°C environment. A -10°C or lower environment increased
shell strength and improved surface finish. It also found that tridecane resulted in a 7%
loss of thickness in ice 3.175mm (0.125 inches) and thicker.
Oxidation along the leading edge of cast Fe-15Cr-4.5Ni-3Cu (15-5 PH) stainless
steel marine propellers leads to costly non-value added finishing. The addition of an
extra seal coat of slurry after autoclaving and a slower cooling rate can reduce oxidation
by 1.7 to 1.4mm2mm-1 of oxidation per millimeter of blade length.
v
ACKNOWLEDGMENTS
First and foremost, I would like to thank Dr. Von Richards; without him none of
this would have been possible. He has been more patient then I could ever have hoped as
I have stumbled to gain a foothold in metallurgy. His time and patience have been
greatly appreciated during my struggle to understand materials engineering.
Next, I would like to thank my committee members, Professor Ronald Kohser and
Professor Frank Liou for their guidance and time. They have helped me gain a
fundamental understanding of key issues important to this research.
I would also like to thank my family, Alan, Lori, and Laurel. Without my father’s
constant guidance, patience, and undying support I may not have seen this through to the
end; he is a constant inspiration for me. He is my role model as a developing professional
in the metallurgical field. My mother and sister have been constant pillars of support,
and I cannot thank them enough.
In addition, I would like to thank a few professors who have also helped me
greatly during my time here: David Van Aken, Greg Hilmas, Jeffrey Smith, William
Fahrenholtz, and Mary Reidmeyer, your constant words of encouragement have helped
me more then any of you know.
I would also like to thank a few graduate students who have helped me stay on
track and at times reminded me to never give up: Hank Rawlins, Ryan Howell, and
William Dewy Peach, you have truly helped me find myself as a graduate student and a
person.
vi
TABLE OF CONTENTS
Page
PUBLICATION THESIS OPTION .............................................................................. iii
ABSTRACT…………………………………………………………………………...iv
ACKNOWLEDGMENTS .............................................................................................. v
LIST OF ILLUSTRATIONS ...................................................................................... viii
SECTION
1. INTRODUCTION ........................................................................................ 1
PAPER
I. Parametric Modeling of the Autoclave De-waxing Process ....................................... 3
1. ABSTRACT .................................................................................................. 4
2. INTRODUCTION ........................................................................................ 4
3. BOUNDARY CONDITIONS AND PARAMETERS ................................. 8
4. COMPUTATIONAL PROCEDURES ....................................................... 12
5. RESULTS ................................................................................................... 14
6. DISCUSSION ............................................................................................ 15
7. CONCLUSIONS......................................................................................... 16
8. FUTURE WORK ........................................................................................ 16
9. REFERENCES ........................................................................................... 17
II. Investment Shell Building on Ice Patterns ............................................................... 18
1. ABSTRACT ................................................................................................ 19
2. INTRODUCTION ...................................................................................... 19
3. EXPERIMENTAL PROCEDURE ............................................................. 24
3.1. PATTERN LOSS ................................................................................ 24
3.2. DELAYED CATALYST APPLICATION ......................................... 25
4. RESULTS ................................................................................................... 26
4.1. PATTERN LOSS ................................................................................ 26
4.2. DELAYED CATALYST APPLICATION ......................................... 29
5. DISCUSSION ............................................................................................. 30
5.1. PATTERN LOSS ................................................................................ 30
vii
5.2. DELAYED CATALYST APPLICATION ......................................... 30
6. CONCLUSION ........................................................................................... 30
7. FUTURE WORK ........................................................................................ 31
8. REFERENCES ........................................................................................... 32
III. Oxidation During Solidification of 15.5 PH Marine Propellers ............................. 33
1. ABSTRACT ................................................................................................ 34
2. INTRODUCTION ...................................................................................... 34
3. EXPERIMENTAL PROCEDURE ............................................................. 40
3.1. SHELL STRENGTHENING .............................................................. 40
3.2. COOLING RATE EFFECTS .............................................................. 42
4. RESULTS ................................................................................................... 42
4.1. SHELL STRENGTHENING .............................................................. 42
4.2. COOLING RATE EFFECTS .............................................................. 43
5. DISCUSSION ............................................................................................. 43
5.1. SHELL STRENGTHENING .............................................................. 43
5.2. COOLING RATE EFFECTS .............................................................. 44
6. CONCLUSION ........................................................................................... 44
7. FUTURE WORK ........................................................................................ 44
8. REFERENCES ........................................................................................... 45
SECTION
APPENDIX…………………………………………………………………………...46
VITA………………………………………………………………………………….68
viii
LIST OF ILLUSTRATIONS
Figure Page
PAPER I 2.1. Schematic of heat transfer in the autoclave. Steam condenses on the shell’s surface and saturates the shell. Heat is transferred through the shell to the under lying wax, resulting in melting [Gebelin, 2001]. ......................................................... 6 3.1. Wax block surrounded by ceramic investment casting shell with boundary condition Tw (temperature at wall). .............................................................................. 9 3.2. Melt profiles of the wax as a result of the calculated distribution of the liquid fraction at 480s (left) and 640s (right). ...................................................................... 12 PAPER II 2.1. Rapid freeze prototyping (RFP) machine inside a deep freezer. Water is deposited on the liquid nitrogen chilled substrate, which is moved by the XY table. 20 2.2. Schematic of slurry tank system. It is driven by an electric motor with built-in
reducing gears (16rpm) rotating a five gallon bucket using a ½ inch drive belt. ....... 22 2.3. Step plate test article used for ice pattern, thin wall, investment casting trials (units are inches). ....................................................................................................... 23 2.4. Diagram of shell coats: The primary coat determines surface finish, detail coats build pattern detail, backup coats provide strength, and the seal coat holds the last backup layer’s stucco in place. ...................................................................... 23 4.1. Ice pattern loss and resulting shell cavity thicknesses. Samples one through six were tridecane coated, samples seven, ten, and eleven were not coated. Delamination of the primary coat caused cavities to show a net increase in thickness.
.................................................................................................................................... 27 4.2. Percentage loss based on step thickness. Samples one through six (tridecane coated) experienced minimal loss of thickness compared to non-coated step plates. .................................................................................................................. 28 4.3. Investment shell exhibiting primary coat delamination. ............................................ 28 4.4. Step plate shells with and without tridecane coating. Tridecane coating increased retention of the primary coat. Step plate thickness increases from left to right. ....................................................................................................................... 29 PAPER III 2.1. Oxidation along the leading edge of a cast marine propeller. .................................... 34
ix
2.2 Effect of particle shape and volume fraction on fracture toughness [Richardson,
2006]. ......................................................................................................................... 36 2.3. Diagram of shell coats, the primary coat determines surface finish, detail coats build pattern detail, backup coats provide strength, and the seal coat holds the last backup layer’s stucco in place. ...................................................................... 37 2.4. Illustration of cooling rate based on position. The inside propeller blades are
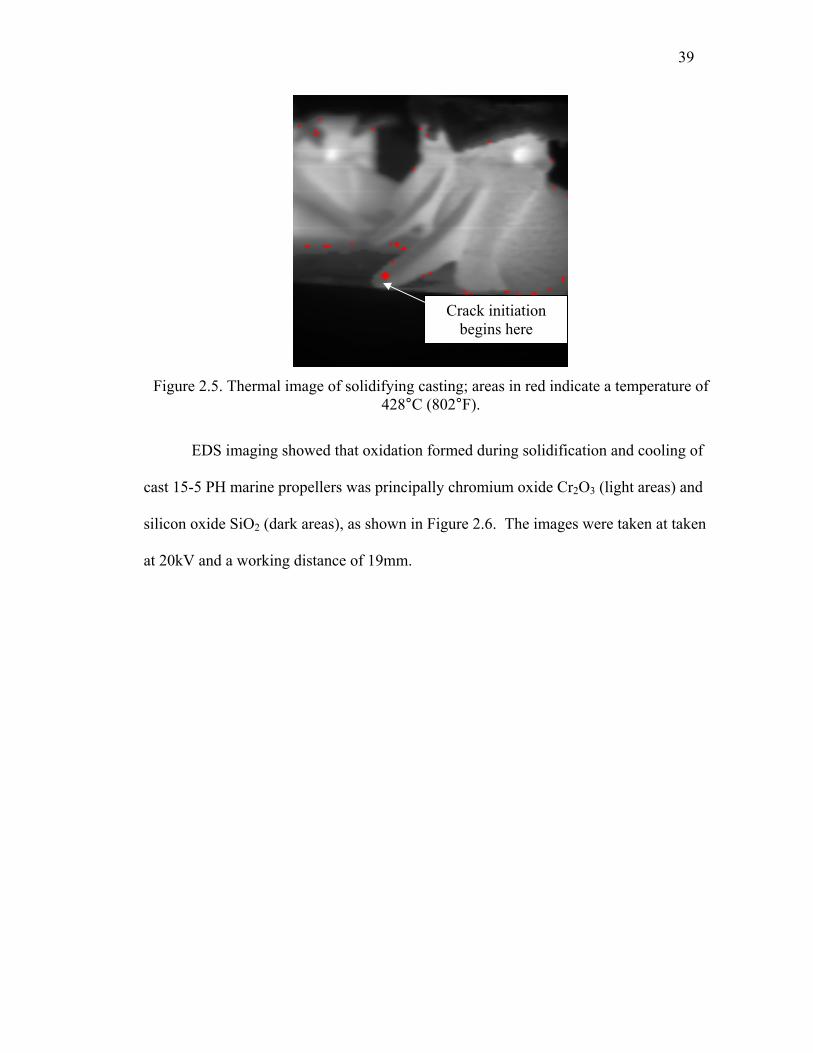
surrounded by hot castings and will therefore cool slower. ....................................... 38 2.5. Thermal image of solidifying casting; areas in red indicate a temperature of 428°C (802°F). ....................................................................................................... 39 2.6. EDS image of leading edge oxidation of cast 15-5PH Stainless. .............................. 40 3.1. Oxidation on leading edge of propeller blade. ........................................................... 41 3.2. Image analysis representation of oxidation on leading edge of propeller blade. ....... 41
x
LIST OF TABLES Table Page
PAPER I 3.1. Parameters used to determine the influence of shell and wax conductivity and
autoclave temperature on the melt profiles of wax during autoclaving. .................... 10 3.2. Additional properties of the wax and shell required for the completion of the
parametric simulation. ................................................................................................ 11 5.1. Times required for melting given varying shell and wax conductivities and autoclave temperatures. Increased autoclave temperature, saturated shell
conductivity, and low wax thermal conductivity resulted in the highest DT time of 48 seconds. ..................................................................................................... 14 PAPER II 4.1. Four-point bend test results for delayed catalyst application. A four hour delay
resulted in the highest average strength (16.4 N/cm2). .............................................. 29 PAPER III 4.1. Oxidation per unit length of blade (mm2mm-1). ......................................................... 42 4.2. Oxidation (mm2mm-1) as a function of position ........................................................ 43
1. INTRODUCTION
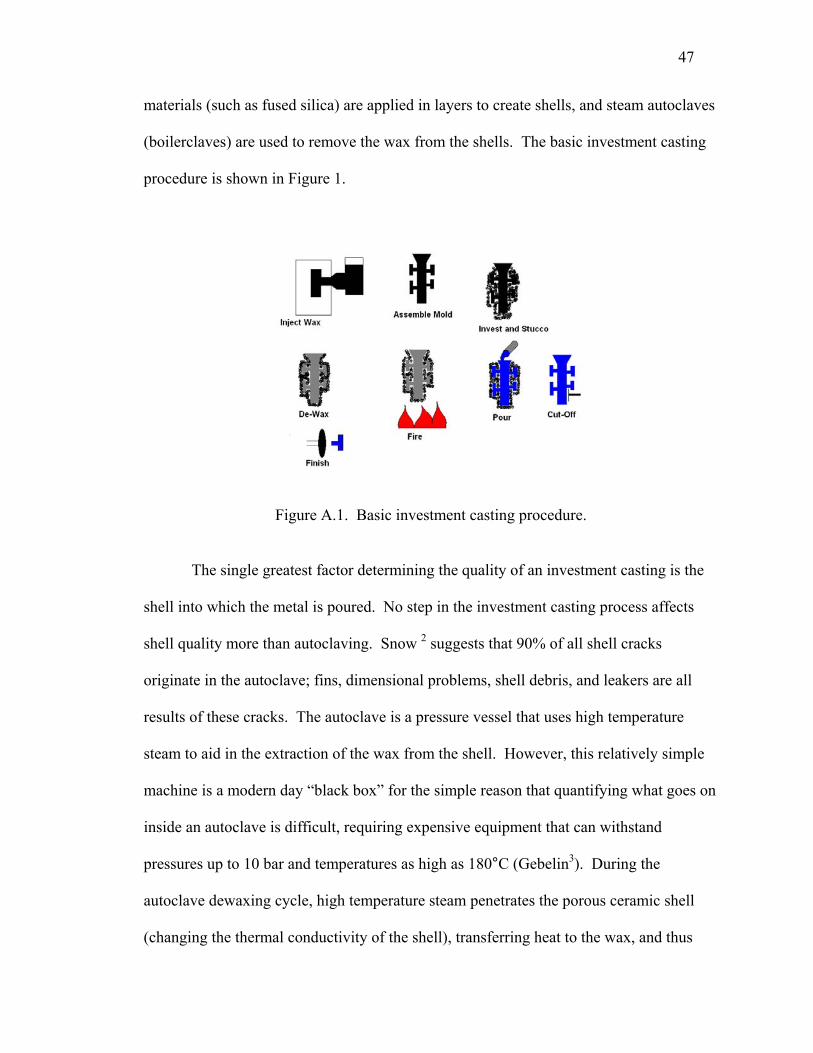
Investment casting can be considered either a new or an old technology,
depending on one’s perspective on industrial history and genealogy. Industrial
investment casting began with the need for intricate turbine blades during World War II.
However, the process of lost wax dates back to pre-Christian Egypt and Chinese
dynasties as early as 4,000 BC. Older pots, vases, wine goblets, and religious artifacts
display intricacy achieved using lost wax. Older methods of investing the wax involved
packing clay around bee’s wax patterns before firing, creating castings devoid of parting
lines. However, advances in ceramics and shell building dramatically changed the
investment casting industry. Corning Glass Works patented and marketed a technique
called Glascast in 1957; simultaneously, Watertown Arsenal introduced a process called
sintered alumina mold. Both processes are recognized as the original ceramic shell,
nonflask, investment casting technique [AFS, 1993]. Investment casting begins with the
creation of a wax part by injection. The part is assembled into a tree wherein numerous
parts share a single downsprue. The tree is invested and stuccoed before removing the
wax using an autoclave or boilerclave. The shell is fired to add strength before filling
with molten metal. The metal is allowed to cool before removing the castings for
finishing.
The primary goal of this research was to reduce or eliminate shell cracking in
investment castings. This project involved: 1) continuing efforts to develop a predictive
parametric model of autoclave dewaxing, since cracking often occurs in the autoclave
process, 2) building thin wall shells for the casting of aluminum metal matrix composites
using ice patterns in association with rapid freeze prototyping (RFP) technology, and 3)
2
reducing cracking during solidification after pouring, resulting in increased casting
quality in cast 15-5 PH marine propellers.
Parametric studies on heat flow and melt front progression should be conducted to
determine real world boundary conditions via computer modeling of autoclave
temperature, shell thermal conductivity, and wax conductivity.
Many problems arise from the volumetric expansion of wax during the autoclave
de-waxing cycle. Extensive research has sought to alleviate or eliminate these issues;
however, most remain unresolved. As a result, RFP and freeze casting have a bright
future. However, numerous avenues of research remain open: Parameters must be
developed for building thin wall shells, and interface agents are needed to limit
binder/water interactions. In addition, shell strength and casting surface finishes could be
improved. Finally, pattern loss must be addressed.
To reduce premature cracking during cooling (post pouring) at Mercury Marine,
ceramic strengthening techniques and binder systems (e.g. colloidal silica) were modified
to increase shell toughness. Four-point bend test bars enabled quantitative comparison of
changes made to the shell mold system. Quantitative image analysis allowed for the
comparison of oxidation amounts normalized by blade length.
3
I. Parametric Modeling of the Autoclave De-waxing Process
Edward A. Druschitz
Missouri University of Science and Technology, Rolla, Missouri
Keywords: Investment Casting, Autoclave, Shell Cracking
4
1. ABSTRACT
Snow [1998] suggested that up to 90% of all shell cracking is a result of the
autoclave dewaxing cycle. The majority of cracks are caused by bulk expansion of the
wax as it is heated. The expanding wax stresses the shell, and if the stress intensity
becomes greater than the shell’s strength, the shell cracks. Minimizing the expansion of
the wax during melting eliminates these cracks. A clearer understanding of the factors
affecting the melt profile of the wax can be gained by using computational fluid
dynamics (CFD) to model the interaction among 1) the thermal conductivity of the wax,
2) the thermal conductivity of the shell, and 3) the temperature of the autoclave. The
most favorable melt profile results from a high autoclave temperature (438°K to 458°K)
and saturated thermal conductivity of the shell (1.36 to 1.40 Wm-1k-1) in conjunction with
a low wax thermal conductivity (0.33 Wm-1k-1). These parameters reduce the likelihood
of shell cracking as a result of wax bulk expansion.
2. INTRODUCTION
Investment casting foundries use a saturated steam autoclave to remove wax
patterns from ceramic shells made of fused silica. Cracks nucleated by the autoclave may
result in leakers (run-outs), dimensional distortion, surface defects, and inclusions. The
majority of these cracks are caused by the bulk expansion of the wax during melting.
Minimization of this expansion would drastically reduce shell cracking and associated
defects. Figure 2.1 illustrates the autoclave de-waxing cycle.
5
The autoclave process occurs in the following steps:
1. The shells are placed inside the autoclave.
2. Water is flash boiled into steam and injected into the autoclave.
3. Steam condenses on surfaces of sub-superheated steam temperatures.
4. Water permeates the shells (increasing thermal conductivity).
5. Wax begins to melt at the shell/wax interface causing a volumetric
expansion.
Cracking is a nucleation and growth process. Cracks form in the autoclave when
stresses caused by the bulk expansion of the wax exceed the strength of the shell. Cracks
grow along the path of least resistance in order to alleviate the stress caused by bulk
expansion. Stresses can be relieved by the lateral flow of liquefied wax through vents
and gating.
6
Figure 2.1. Schematic of heat transfer in the autoclave. Steam condenses on the shell’s surface and saturates the shell. Heat is transferred through the shell to the under
lying wax, resulting in melting [Gebelin, 2001].
Snow [1998] estimated that a dry fused silica shell has a thermal conductivity of
2.00 X 10⁻⁵ BTUsec-1in°F (1.5 Wm-1K-1). He also estimated that a shell with 25%
porosity filled with water would have a conductivity of 4.21 X 10⁻⁵ BTUsec-1in°F (3.15
Wm-1K-1). Kruse and Richards [2005B] measured the dry shell’s thermal conductivity at
0.5 Wm-1K-1 and the saturated shell’s thermal conductivity at 1.4Wm-1K-1.
Once the shell surface is saturated with water, the pressure inside the autoclave
puts the shell in a compressive state of stress until the wax expands volumetrically.
Fused silica undergoes negligible expansion as it is heated from room temperature to the
autoclave operating temperature.
In early instrumented autoclave trials, Jones et al. [2001] found that the interior of
an autoclave reaches its maximum temperature and pressure in less than ten seconds.
7
Later work conducted by Kruse and Richards [2005A] showed that within forty seconds
the outer surface of the shell reached ambient autoclave temperature. In either case,
during the de-waxing process the environmental temperature boundary condition occurs
quickly at the surface of the shell. This is considered in modeling in that, the rapid
development of this condition allows the modeler to ignore the remainder of the
autoclave and apply a constant temperature boundary condition at the shell surface when
constructing the model.
Mathematical models for estimating the thermal conductivity of ceramic-water
porous phase composite structures include: Maxwell, Sson–Frey, Russel, and Bruggeman
[Kruse and Richards 2005B]. These methods result in a dry shell thermal conductivity
range of 0.05 to 0.20 Wm-1K-1 and a water saturated thermal conductivity range of 0.20 to
0.80 Wm-1K-1 [Kruse and Richards, 2005B]. Kruse and Richards [2005B] determined
that dry and water saturated shell thermal conductivities are 0.5 and 1.4 Wm-1K-1,
respectively. They interpreted the discrepancy between modeled conductivity and
measured results stemmed from the inability of previous models to account for a
combination of continuous and non-continuous phases within the shell. Snow [1998]
assumed condensed water from the steam was pulled into the shell via capillary action
due to high pressures. Kruse [2005] and Kruse and Richards [2005B] proposed a
modified Maxwell model that accounted for the change in the thermal conductivity of a
continuous phase as a function of temperature. This model best fit the experimentally
measured data.
These data were used to generate a parametric model to determine the heat flow
through the shell and melt front progression through the wax. The wax pattern’s thermal
8
absorption consists of a sensible heat increase, Cp∆T, and a latent heat of fusion during
melting, mliq∆Hf [Kruse and Richards, 2005B].
The main focus of the work presented here is the development of a parametric
thermal model to evaluate for the influence of 1) pattern wax thermal conductivity, 2)
investment shell thermal conductivity, and 3) autoclave temperature on melt front
progression and its resulting effects on the bulk expansion of the wax.
3. BOUNDARY CONDITIONS AND PARAMETERS
A rectangular block of wax (10 mm×100 mm×100 mm) was chosen for the
current study to allow for an infinite plate approximation and to reduce the edge effects.
The shell was set at 12 mm thick (the average of shells from three industrial sources).
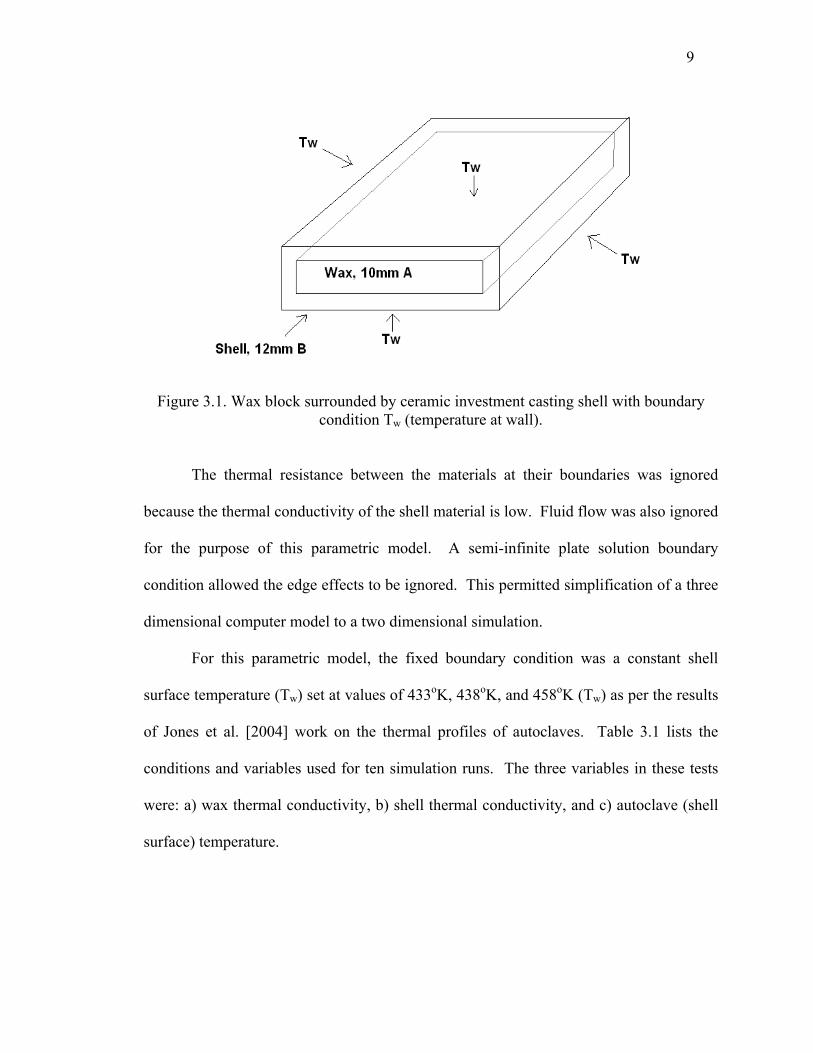
The shell surrounded the entire wax block, as shown in Figure 3.1. Heat transferred
through the shell to the underlying wax resulted in melting and a thermal gradient
through the wax.
9
Figure 3.1. Wax block surrounded by ceramic investment casting shell with boundary
condition Tw (temperature at wall).
The thermal resistance between the materials at their boundaries was ignored
because the thermal conductivity of the shell material is low. Fluid flow was also ignored
for the purpose of this parametric model. A semi-infinite plate solution boundary
condition allowed the edge effects to be ignored. This permitted simplification of a three
dimensional computer model to a two dimensional simulation.
For this parametric model, the fixed boundary condition was a constant shell
surface temperature (Tw) set at values of 433oK, 438oK, and 458oK (Tw) as per the results
of Jones et al. [2004] work on the thermal profiles of autoclaves. Table 3.1 lists the
conditions and variables used for ten simulation runs. The three variables in these tests
were: a) wax thermal conductivity, b) shell thermal conductivity, and c) autoclave (shell
surface) temperature.
10
Table 3.1. Parameters used to determine the influence of shell and wax conductivity and autoclave temperature on the melt profiles of wax during autoclaving.
Name
Shell Thermal Conductivity
(Wm-1K-1)
Wax Thermal Conductivity
(Wm-1K-1)
Autoclave Temperature
(°K)
Model 1 0.55 0.33 438
Model 2 0.55 0.5 438
Model 3 1.36 0.33 438
Model 4 1.36 0.5 438
Model 5 1.4 0.33 438
Model 6 1.4 0.5 438
Model 7 1.36 0.33 433
Model 8 1.36 0.5 433
Model 9 1.36 0.33 458
Model 10 1.36 0.5 458
The shell’s thermal conductivity was varied between three different values: 0.55,
1.36, and 1.4 Wm-1K-1, representing a “dry” (model one and two) and a fully water
saturated shell respectively. The last two values (1.36 and 1.4) were chosen to determine
the sensitivity of the modeled system to small changes in wax thermal conductivity. The
typical autoclave cycle is 30 to 40 minutes. Backup coats saturate 15 seconds after the
door is closed. The primary coat saturates in 80 seconds. Therefore, saturated shell
conductivity was used in the remaining simulations. Wax thermal conductivity was
varied between 0.33 Wm-1K-1 (for low density polyvinyl ether polymer) and 0.5 Wm-1K-1
(for high density polyvinyl ether polymer). Additional properties required for the
simulation are summarized in Table 3.2; the additional properties of the low density
polyvinyl wax were held constant regardless of thermal conductivity to eliminate their
impact on the results.
11
Table 3.2. Additional properties of the wax and shell required for the completion of the parametric simulation.
A quadrilateral face with a three-node edge and both tetrahedral and cubic
volumes was used to mesh the shell and wax respectively. All calculations were
conducted assuming an unsteady state with segregated calculations. Each time step was
recorded in Fluent at 2.0 seconds, with a computational time step of 0.01 seconds. At
each time step, the thickness of the melt front was calculated and saved in an Excel
spreadsheet. Complete melting was defined as a liquid fraction greater than 85%. Figure
3.2 is an example of the 2D slice generated by Fluent software and used to predict the
thickness of the wax melt front. In this figure, blue indicates solid material and red
indicates melted material. Melt front thickness was determined by measuring the
thickness of the red area at a cross-section of the plate’s center. Heat was transferred
through the shell to the underlying wax, causing it to melt. This transfer resulted in a
thermal gradient due to low thermal conductivity of the wax.
12
Figure 3.2. Melt profiles of the wax as a result of the calculated distribution of the liquid fraction at 480s (left) and 640s (right).
4. COMPUTATIONAL PROCEDURES
The enthalpy-porosity technique was used to model the phase change process.
The melt interface was not tracked explicitly; instead, the liquid fraction associated with
each control volume in the domain and computed each iteration. The liquid fraction,
therefore, varied between zero (solid) and one (liquid). The energy equation is written in
terms of sensible enthalpy, h, defined as equation 1
ref
T
ref pTh h c dT= + ∫ (1)
where href in J is the reference enthalpy, Tref in K is the reference temperature, and cp is
specific heat at constant pressure in Jkg-1K-1, and is a function of temperature T. The
enthalpy can be computed as the sum of the sensible enthalpy h and the latent heat ΔH
(equation 2)
Shell
Melted Wax
Un-melted Wax
13
HhH Δ+= (2)
In addition, the latent heat content ( HΔ ) may vary between zero (solid) and L (liquid),
the latent heat of the material. As a result, the liquid fraction (β ) can be defined as
equation 3 if TSolidus≤T≤TLiqudus.
solidusliquidus
solidus
TTT
LH
−−
=Δ
=β (3)
For phase change problems, the energy equation is written as equation 4
( ) ( ) ( ) ( ) STkx
hux
Ht
ht i
ii
+∇∂∂
=∂∂
+Δ∂∂
+∂∂ ρρρ (4)
where H, h , and HΔ in (J) is the enthalpy of the wax, ρ (kgm-3) is the density of the wax,
k (Wm-1K-1) is the thermal conductivity, T (K) is the temperature, and S is the source
term, t is the time in seconds, ui is the fluid velocity in ms-1, and xi is Cartesian coordinate
directions. Fluid flow is irrelevant, thus the velocity term ( )hux i
i
ρ∂∂ is reduced to zero.
Using Equation 3, the sensible enthalpy (h) and the latent heat content ( HΔ ) equal the
enthalpy (H). As such, equation 4 can be reduced to Equation 5.
( ) ( )i
H k Tt xρ∂ ∂
= ∇∂ ∂
(5)
14
This leaves five unknown variables: H, T, h, ΔH, β and five equations (Eq.1-3 and 5).
5. RESULTS
Reporting the results requires the definition of several critical times:
Tms: the time required for melting to begin on the outer surface of the wax.
Tmo: the time required for melting to finish on the outer surface.
Tmc: the time required for melting to begin in the center of the wax.
Tmi: the time required for melting to finish half way to the center.
Tmf: the time required for melting to finish at the center of the sample.
DT: the time difference between the completion of melting on the outer wax surface and
the beginning of melting at the center.
The results of all simulations are shown in Table 5.1. Low conductivity shells
resulted in negative DT times (-72 and -134). Saturated shell conductivity resulted in a
positive DT time. Increased autoclave temperature, saturated shell conductivity, and low
wax thermal conductivity resulted in the highest DT time of 48 seconds.
Table 5.1. Times required for melting given varying shell and wax conductivities and autoclave temperatures. Increased autoclave temperature, saturated shell conductivity,
and low wax thermal conductivity resulted in the highest DT time of 48 seconds.
Tms Tmo Tmc Tmi Tmf DT1 0.55 0.33 438 154 352 280 662 878 -722 0.55 0.5 438 156 374 240 648 802 -1343 1.36 0.33 438 60 138 178 312 484 404 1.36 0.50 438 62 138 144 286 412 65 1.40 0.33 438 58 134 174 306 476 406 1.40 0.50 438 60 134 142 278 404 87 1.36 0.33 433 62 144 180 328 504 368 1.36 0.50 433 64 144 146 300 430 29 1.36 0.33 458 54 118 166 266 416 48
10 1.36 0.50 458 54 118 134 242 354 16
Elapsed Time to Event (sec)Model
Shell Thermal Conducivity (W/(m*K))
Wax Thermal Conducivity (W/(m*K))
Autoclave Temperature (K)
15
6. DISCUSSION
A high DT value will reduce the stress on the shell caused by the bulk expansion
of the remaining wax. Therefore, the outer layer of the wax should ideally finish melting
(Tmo) prior to significant temperature increase at the center of the pattern (Tmc).
The first set of simulations (model one and two) studied the effect of the waxes’
thermal conductivity on melt times. When the thermal conductivity of the shells and the
autoclave temperature were held constant at 0.55 Wm-1K-1 (dry) and 438°K respectively,
the low conductivity of the shell limited the amount of heat transferred to the wax. In
both cases, the wax began to melt at its center before it finished melting at its surface.
The low thermal conductivity of the shell is unfavorable since it will lead to a large bulk
expansion (indicated by a negative DT time).
Models three through six demonstrate that saturated shell conductivities lessen the
effect of wax thermal conductivity on the time required for melting to begin and finish on
the surface (Tms and Tmo). However, the higher thermal conductivity wax (models four
and six) began to melt in the center six seconds after it finished melting at the surface.
The higher shell thermal conductivity in conjunction with lower conductivity wax
(models three and five) result in a more favorable melt profile (larger DT), reducing the
likelihood that the wax will undergo bulk expansion and result in shell cracking.
The last of the simulations (models seven through ten) determined the impact of
autoclave temperature. Wax thermal conductivity did not affect the time required for
initiation and completion of melting on the surface. The increased autoclave temperature
and low conductivity wax resulted in the greatest DT time of 48 seconds.
16
7. CONCLUSIONS
Favorable profiles are defined as having the greatest possible time delay between
completion of melting on the wax’s surface and beginning of melting at the wax’s center
(DT). These profiles should limit the bulk expansion of the wax and thereby reduce the
likelihood of shell cracking. Low thermal conductivity dry shells (0.55 Wm-1K-1) in
conjunction with high wax conductivity (0.5 Wm-1K-1) produced the least favorable
melting profiles (DT of -134 seconds). High autoclave temperatures (438-458°K), high
conductivity saturated shells (1.36-1.40 Wm-1K-1), and low conductivity wax (0.33 Wm-
1K-1) resulted in the most favorable melt profiles (DT of 48 seconds).
8. FUTURE WORK
Future work should include the addition of wax expansion data in order to
calculate the stress applied to the shell. Data on the flow of fluid out of the shell should
also be added to the simulation in order to calculate the alleviation of stress.
17
9. REFERENCES
American Foundrymen’s Society. Handbook on the Investment Casting Process. Des Plaines, Illinois: American Foundrymen’s Society, 1993.
Gebelin, J. & Jones, S. “Modeling of the De-Waxing of Investment Cast Shells”. TMS 2001.
Jones, S. Jolly, M. Blackburn, S. Gebelin, J. Cendrowicz, A. and Lewis, K.
“Measurements of autoclave thermal profiles during high pressure steam de-waxing of investment shells: Part 1 – Vessel profiles.” Materials Science and Technology, May 2005. Vol. 20.
Jones, S. Jolly, M. Gebelin, A. Cendrowicz, A. & Lewis, K. “To Boldly Go Where No
Woman Has Gone Before: Dewaxing Results From FOCAST.” ICI 49th Annual Meeting, 2001.
Kruse, B. “Mold and Metal Interactions in Highly Alloyed Steels”, M.S. thesis,
University of Missouri-Rolla, 2005. Kruse, B. & Richards, V. “Success of a Data Acquisition System Designed to Measure
Thermal, Moisture and Pressure Profiles in Production Autoclaves”. ICI 53rd Annual meeting, Paper #15, 2005.
Kruse, B. & Richards, V. “Thermal and Moisture Characterization During Autoclave
Dewaxing in Investment Casting.” SFSA T&O Conference, Paper # 5.5, 2005. Snow, J. “What Happens During Autoclave Dewaxing”. Investment Casting Institute
46th Annual Technical Meeting. 1998.
18
II. Investment Shell Building on Ice Patterns
Edward A. Druschitz
Missouri University of Science and Technology, Rolla, Missouri
Keywords: Investment Casting, Rapid Freeze Prototyping, Ice Casting
19
1. ABSTRACT
This work developed shell building techniques for rapid freeze prototyping (RFP). Thin
wall ice patterns were invested by coating patterns with a tridecane interface agent, using
a 20 wt% ethyl silicate binder with 20 wt% fiber-containing fused silica flour added after
the primary coat, delaying the application of the catalyst by 4 hours, and maintaining a -
10°C environment. Finished shells were quantitatively evaluated by determining mold
cavity dimensional reproducibility and shell strength. Tridecane proved an effective
interface agent and resulted in stronger surface coats. It was particularly beneficial when
combined with greater pattern thermal mass, which delays melting for a longer period of
time. A -10°C or lower environment increased shell strength and surface finish.
Tridecane resulted in a 7% loss of thickness in ice 3.175mm (0.125 inches) and thicker.
2. INTRODUCTION
Water does not undergo volumetric expansion as it melts. Yodice [1991, 1998,
1999] first proposed water (ice) as a pattern material for investment casting. Rapid freeze
prototyping is a solid freeform fabrication technique wherein water droplets form frozen
layers of ice that generate thin-wall investment casting patterns. This method and
material combination allows investment casters to produce prototype patterns rapidly,
and it obviates the disadvantages of previous technologies.
Wax undergoes a volumetric expansion during melting, which can result in shell
stresses great enough to cause shell cracking. Commercially available rapid prototyping
polymers undergo a greater volumetric expansion than typical pattern waxes, increasing
the likelihood of shell cracking.
20
Rapid prototyping, or solid freeform fabrication (SFF), is a commercialized
method for quickly producing three-dimensional parts via layer-by-layer deposition. This
technique allows manufacturers to produce prototype parts rapidly, while decreasing
development time and reducing cost, and increasing quality. Typical rapid prototyping
materials undergo greater volumetric expansion than standard pattern wax or demonstrate
such poor fluidity compared to industrial pattern waxes that additional drain offs must be
cut into the ceramic mold, adding man hours and reducing overall part quality.
Figure 2.1. is an image of RFP equipment; the XY table moves, allowing the
nozzle to deposit water droplets on the liquid nitrogen chilled substrate. A freezer houses
the entire unit; water is pumped to the nozzle via an external pump. Continuing
development of this process for industrial use focused on taking thin-walled ice patterns,
building investment shells on them, determining ice pattern thickness reproducibility and
producing metal-matrix-composite (MMC) aluminum castings.
Figure 2.1. Rapid freeze prototyping (RFP) machine inside a deep freezer. Water is deposited on the liquid nitrogen chilled substrate, which is moved by the XY table.
Elevator
Freezer
Nozzle XY Table
Substrate
Pipe
Pump
Motor Driver
21
Can molding involves pouring slurry around a pattern contained in a rigid
structure (i.e., a can). After the slurry hardens, the pattern is melted out and metal is cast
into the remaining void. Jose’s [2005] research applied can molding and casting to
threaded test articles and dental fixtures for dimensional analysis using ice patterns. He
maintained a constant freezer temperature of -16°C. Water based colloidal silica binder
systems could not be used to prevent ice pattern melting, so an ethyl silicate binder was
chosen. Alumino-silicate flours and a triethanolamine catalyst were used to create
investment casting molds. Particle size was 0.075 mm for the alumino-silicate flour,
which was dried at 100°C for one hour before use. Ten weight percent ethyl silicate
binder was diluted by 50% with ethanol to improve moldability. Jose found 46% solids
loading was optimal for can molds. Jose [2005] used Grey Matter, a commercial
alumino-silicate flour with small inorganic glass fibers premixed to increase strength and
improve resistance to cracking during layered shell building.
Investment casters use mechanical mixing slurry tanks rotating at 15 to 18 rpm to
prevent settling of the slurry. Past studies at Missouri University of Science and
Technology noted that mixing slurry before dipping resulted in an increase in slurry
temperatures of up to 10°C due to particle friction. This increase promoted pattern loss
due to melting. A slurry tank was designed and built to fit inside a freezer, allowing the
slurry to maintain proper suspension (i.e., preventing settling) and temperature (-15°C).
The initial design of the slurry tank system is shown in Figure 2.2. A five gallon
bucket was rotated at 16 RPM. A cover reduced alcohol evaporation by increasing the
local vapor pressure a K-type thermocouple monitored slurry temperature. An image of
the system at work inside the freezer is also shown in Figure 2.2.
22
Figure 2.2. Schematic of slurry tank system. It is driven by an electric motor with built-
in reducing gears (16rpm) rotating a five gallon bucket using a ½ inch drive belt.
A step plate pattern allowed for quantitative analysis of shell quality (surface
finish) and pattern loss. The step plate’s length and width allowed each step to be viewed
as a semi-infinite plate. Step thickness varied between 0.38 mm (0.015 inches) and 6.35
mm (0.25 inches) thick, as shown in Figure 2.3.
23
Figure 2.3. Step plate test article used for ice pattern, thin wall, investment casting trials
(units are inches).
The shell was built in seven layers (Figure 2.4). The first layer (primary coat)
determined the casting’s surface finish and quality. The second and third layers (detail
layers) build part detail. The fourth, fifth, and sixth layers (backup layers) produced the
shell’s strength. The final layer (a seal coat) was not stuccoed, and serves to bind the
previous layer of stucco.
Figure 2.4. Diagram of shell coats: The primary coat determines surface finish, detail
coats build pattern detail, backup coats provide strength, and the seal coat holds the last backup layer’s stucco in place.
Ice Pattern
Primary Coat
Detail Coat
Backup Coat
Seal Coat
24
3. EXPERIMENTAL PROCEDURE
The interaction between pattern melt off (water) during the shell building process
dilutes the primary coat, reducing the silica chain length and weakens the primary coat.
Delaying catalyst application allows the ethanol carrier to evaporate, resulting in less
dilution. Industry best practices delay catalyst application by 0.75 to 1.5 hours at room
temperature for wax patterns; allowing ethanol to evaporate.
3.1. PATTERN LOSS
The goal of the pattern loss test was to determine if tridecane would reduce the
interaction between the pattern and the slurry, thus reducing pattern loss. Twelve ice
step-plates were produced for this test. Six of the plates received a double coating of
tridecane; applied by dipping. The other six received no tridecane coating.
The primary coat consisted of 6900 mL of 10 wt.% ethyl silicate and 17
kilograms of a 50/50 mixture of alumino-silicate and fused silica flour. Remaining layers
included 10% fiber to reinforce the fused silica flour. Primary coats did not contain
fibers due to their potentially detrimental effect on surface quality. Step plate patterns
were dipped in slurry, stuccoed with alumino-silicate sand, sprayed with catalyst (a 50/50
mixture of triethanolamine and ethanol), and cured for six hours. Stuccoing sand varied
according to coat. Primary coat stucco was alumino-silicate 0-15 percent in sieve 150,
70-86 percent USS sieve 100, and 5-10 percent in sieve 50. Detail stucco was alumino-
silicate of 9-22 percent sieve 100, 30-44 percent sieve 70, and 30-48 percent sieve 50.
Backup stucco was alumino-silicate 27-37 percent sieve 40, 32-47 percent sieve 30, and
15-25 percent sieve 20. The seal coat was not stuccoed.
25
Images were taken of ice patterns prior to and after shell building and dewatering.
Image analysis software was used to determine the initial thickness of the ice pattern
steps and the final thickness of the shell cavity. Images were converted to grayscale for
thresholding and adjusted so only the ice pattern (before) or shell cavity (after) was
visible. Height measurements taken in 50 pixel increments were used to determine
pattern loss as a function of initial thickness.
3.2. DELAYED CATALYST APPLICATION
A second test determined how long to delay catalyst application to maximize shell
strength. Twelve four-point bend test bars were produced for each of three conditions.
After stuccoing, catalyst was applied to shells with delays of zero, two, and four hours for
each condition respectively and cured for a minimum of six hours. The primary coat
slurry consisted of 17 kilograms of 200 mesh fused silica and 6900 ml of 20 wt% pre-
hydrolyzed ethyl silicate. The remaining layers included fused silica flour, which
contained ten percent fiber by weight. Slurry temperature was maintained at -13°C
during shell building. Stuccoing was performed as described in section 3.1. The test bars
were strengthened at 800°C for two hours. Test dimensions were approximately 3.8
inches (96.5 mm) long by 0.7 inches (18.5 mm) wide. Samples were tested using a
Simpson Universal Sand Testing Machine and a four-point bend testing fixture. Load-at-
failure was recorded in Newtons. Four-point bend strength was determined using
Equation 1 [Baratta, 1982]:
243bdPLS = (1)
26
where P = force, L = distance between supports, d = sample thickness, and b = sample
width. This equation holds true only if the wedge stress is negligible between the support
points and the loading points. This was achieved by minimizing the distance between the
loading and support points in relation to sample thickness (typically a ratio of 1.2 to 1.4)
and the almost negligible deflection of the bar before failure.
4. RESULTS
4.1. PATTERN LOSS
Three ice patterns (eight, nine, and twelve), which had not received a tridecane
coating, broke during shelling. Samples one through six (tridecane coated) and samples
seven, ten, and eleven (uncoated) survived shell building and dewatering. Figure 4.1
compares ice pattern starting thicknesses and resulting cavity thicknesses; Figure 4.2
illustrates the percentage loss for each step. Step one was the thickest step; thickness
decreased for steps two and three. Step three was unquantifiable in samples four and five
due to taper. The average coated step thickness of the ice was 7.56mm for step one,
4.87mm for step two, and 2.83mm for step three. Resulting cavity thickness was 7.00mm
for step one, 4.08mm for step two, and 2.56mm for step three. A net loss of seven,
sixteen, and five percent was found for each step respectively.
The average uncoated step thickness was 6.80mm for step one, 4.27mm for step
two, and 1.83mm for step three. Cavity thickness for uncoated plates was 6.85mm for
step one, 4.13mm for step two, and 2.43mm for step three. This resulted in a three
percent net gain for step one, a three percent net loss for step two, and a 43% gain in
thickness for step three. Careful examination of the mold cavities showed the
27
delamination of the primary coat in the third step of the uncoated plates, accounting for
their increased size over the original pattern as shown in figure 4.3.
0
1
2
3
4
5
6
7
8
9
10
1 2 3 4 5 6 7 10 11
Aver
age Tr
idec
ane
Averag
e with
out
Sample
Heig
ht
of
Ste
p (
mm
)
Ice step 1 Shell step 1
Ice step 2 Shell step 2
Ice step 3 Shell Step 3
Figure 4.1. Ice pattern loss and resulting shell cavity thicknesses. Samples one through
six were tridecane coated, samples seven, ten, and eleven were not coated. Delamination of the primary coat caused cavities to show a net increase in thickness.
28
-120%
-100%
-80%
-60%
-40%
-20%
0%
20%
40%
60%
1 2 3 4 5 6 7 10 11
AVG T
ridec
ane
Aver
age Tr
idec
ane
Sample
Pe
rce
nt
Patt
ern
Lo
ss
Step 1 "0.25 inches" 0.635cmStep 2 "0.125 inches" 0.3175 cmStep 3 "0.06 inches" 0.1524 cm
Figure 4.2. Percentage loss based on step thickness. Samples one through six (tridecane
coated) experienced minimal loss of thickness compared to non-coated step plates.
Figure 4.3. Investment shell exhibiting primary coat delamination.
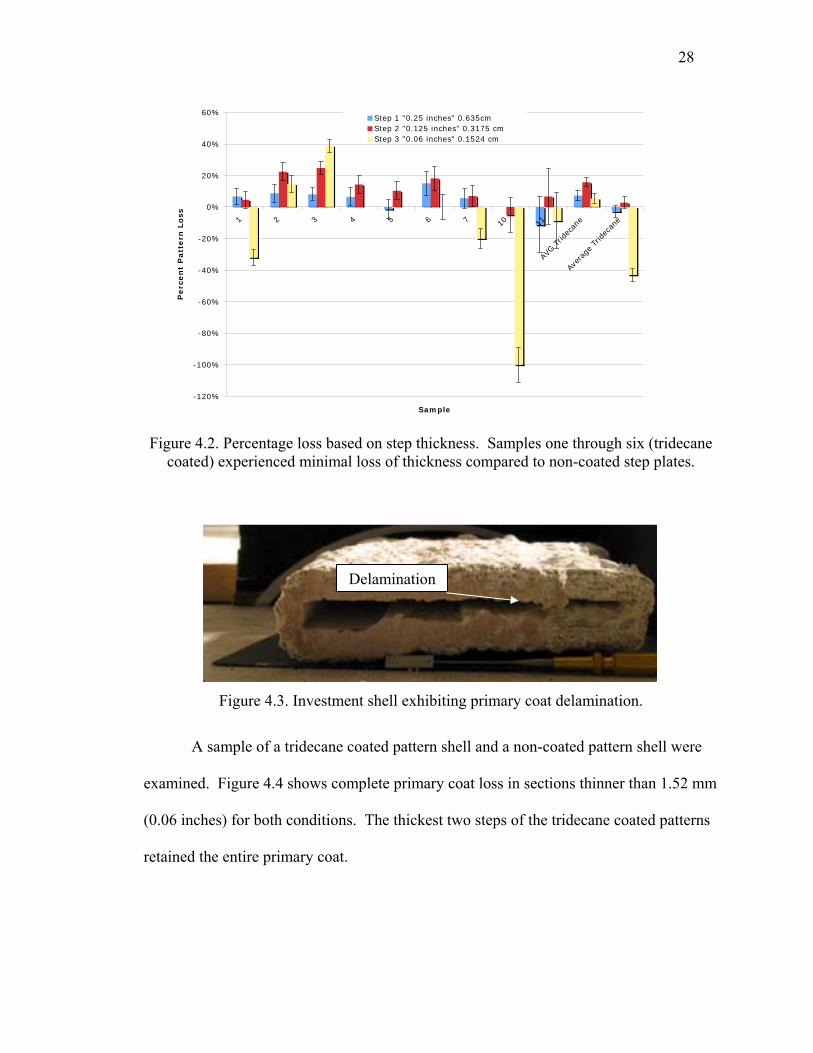
A sample of a tridecane coated pattern shell and a non-coated pattern shell were
examined. Figure 4.4 shows complete primary coat loss in sections thinner than 1.52 mm
(0.06 inches) for both conditions. The thickest two steps of the tridecane coated patterns
retained the entire primary coat.
Delamination
29
Figure 4.4. Step plate shells with and without tridecane coating. Tridecane coating
increased retention of the primary coat. Step plate thickness increases from left to right.
4.2. DELAYED CATALYST APPLICATION
Initially, twelve four-point bend test bars were produced for each delay time.
Several samples broke during sample preparation. Since the ice patterns were not coated
with tridecane, this was presumably caused by the interaction of ethanol and ice. Any
samples that broke during preparation or outside test fixtures inner supports were
considered invalid. Table 4.1 contains the results for zero, two, and four hour delayed
catalyst application times. Each column lists bar number and calculated strength
(N/cm2). There is an 88% probability that delaying catalyst application for four hours
produced stronger shells (16.4 N/cm2) compared to zero and two hours (11.7 and 14.5
N/cm2 respectively).
Table 4.1. Four-point bend test results for delayed catalyst application. A four hour delay resulted in the highest average strength (16.4 N/cm2).
Time Delay One Two Three Four Five Six Seven Eight Average STDEV0 - Hours 10.1 18.2 9.8 10.9 11.4 9.9 11.7 3.22 - Hours 18.3 10.0 22.3 11.1 10.6 14.5 5.54 - Hours 12.3 10.9 9.8 28.0 10.9 15.7 20.3 23.5 16.4 6.8
Sample Number and Strength (N/cm^2)
Solid primary
Coat
Delamination of
Primary Coat
30
5. DISCUSSION
5.1. PATTERN LOSS
Tridecane was not effective in preventing ice pattern loss for thicknesses of 1.52
mm (0.06 inches) and smaller. Thicker steps lost an average of seven percent of their
starting thickness. Tridecane resulted in improved primary coat retention for the two
thickest steps. Greater thermal mass increased the resistance to melting; presumably,
thicker sections require greater heat input to cause melting and were, therefore, less
affected by time outside the freezer during shell building. Increasing ice thickness
required increased heat input to induce melting. Ice at -15°C and 0.40 mm thick was
calculated to begin melting after 31 seconds at room temperature (25°C), whereas ice at -
15°C and 6.35 mm thick will not begin melting for 360 seconds. Increasing the time
delay before melting occurs would reduce pattern loss. The likelihood of water
interacting with the primary coat would also be reduced, thereby increasing the primary
coat strength.
5.2. DELAYED CATALYST APPLICATION
By delaying catalyst application for four hours after stuccoing, shell strength was
increased from 11.7 N/cm2 to 16.4 N/cm2. Providing time for ethanol to evaporate before
catalyst application resulted in higher silica chain lengths and increased strength.
6. CONCLUSION
Shells built on ice patterns suitable for counter gravity casting of metal-matrix
aluminum composites can be produced using:
31
• tridecane interface agent coating
• 20 wt% ethyl silicate binder
• 20 wt% fiber-containing fused silica flour added after the primary coat
• Delay catalyst application by four hours
• -10°C environment.
Tridecane is an effective interface agent that produced stronger surface coats,
particularly when combined with greater pattern thermal mass, which delays melting for
a longer period of time. A -10°C or lower environment increased shell strength and
improved surface finish. Tridecane resulted in reproducible minimization of ice pattern
loss in ice 3.175mm (0.125 inches) thick.
7. FUTURE WORK
Future work should be conducted inside a freezer because ice pattern melting
reduces pattern accuracy and shell strength. Additional methods of tridecane application
should be explored. Further, emphasis should be placed on using RFP shells to produce
actual castings. Finally, the pattern loss versus starting thickness experiment should be
duplicated on rapid prototyped parts.
32
8. REFERENCES
Baratta, F. “Requirements for Flexure Testing of Brittle Materials.” AMMRC TR 82-20, Army Materials and Mechanics Research Center, Watertown, MA, 1982.
Jose, H. “Investment Casting Using Ice Patterns: Solid Mold and Shell Mold Methods”
University of Missouri-Rolla: Thesis, 2005. Yodice, A. “Freeze cast process ready for licensing”, INCAST: International Magazine of the Investment Casting Institute, 11(12), 19-21, 1998. Yodice, A. “Freeze cast process”, US patent 5,072,770,1991. Yodice, A. “Freeze process cuts casting costs”, Advanced Materials and Processes, 155 (4), 35-36, 1999.
33
III. Oxidation During Solidification of 15.5 PH Marine Propellers
Edward A. Druschitz
Missouri University of Science and Technology, Rolla, Missouri
Keywords: Investment Casting, Oxidation Formation, Shell Strengthening
34
1. ABSTRACT
Oxidation along the leading edge of cast Fe-15Cr-4.5Ni-3Cu (15-5 PH) stainless
steel marine propellers requires costly non-value added finishing. The addition of an
extra seal coat of slurry after autoclaving and a slower cooling rate can reduce this
oxidation from 1.7 to 1.4mm2mm-1 of oxidation per millimeter of blade length. This
work showed that a seal coat applied after autoclaving re-saturated the shell filling in
surface micro-cracking with slurry, delaying cracking and allowing the casting to cool
adequately before exposure to an oxidizing atmosphere.
2. INTRODUCTION
The goal of this investigation was to reduce the amount and severity of oxidation
along the leading edge of cast Fe-15Cr-4.5Ni-3Cu stainless steel (15-5 PH) marine
propellers (Figure 2.1.) (Unless otherwise noted all chemistries are in weight percent).
Figure 2.1. Oxidation along the leading edge of a cast marine propeller.
According to Sosman [1927], the principal crystalline phases of silica are quartz,
tridymite, crystobalite, and fused silica. When fused silica shells are heated above
1470°C (2678°F) they undergo devitrification to form a high temperature phase,
Severe oxidation along a propellers leading edge
35
crystobalite. Sosman [1927] states that crystobalite undergoes a displacive
transformation when cooled to temperatures of 200-275°C (392-522°F) at atmospheric
pressure. Shells are formulated to develop fine cracking structure during cooling,
resulting in easy removal. Transformation to crystobalite is controlled by mineralizer and
time at temperature; typically sodium aids this transformation.
Lehman et al. [1995] notes that fiber additions date back to adobe, a dried clay
reinforced with straw, to increase strength and toughness. A more modern example is
concrete reinforced with steel rebar. Previous work conducted by Richards and Mascreen
[2002] found fibers increased the strength of 4-point bend samples by causing crack
deflection, wherein crack planes tilt and twist around surrounding grains and fibers.
According to Richardson [2006], brittle cracks propagate in low fracture
toughness materials and result in high flaw sensitivity (low flaw tolerance). More recent
work in fracture toughness, discussed by Richardson [2006], found dispersion of
reinforcement materials of a higher elastic modulus will aid the material in carrying loads
without fracturing.
According to Richardson [2006], cracking in a polycrystalline material can be
broken down into three stages: 1) Stress induced energy is stored within the material, 2)
crack nucleation occurs at the critical load on the largest flaw, and 3) stored energy drives
crack propagation. Failure can be avoided by stress delocalization, accomplished by fiber
reinforcement. Richardson [2006] suggests that the elastic modulus of fibers be two
times that of the matrix. Short or “chopped” fibers of random orientation have gained
wide acceptance within the ceramic industry and are utilized in investment casting
foundries in such products as Grey Matter (fused silica flour containing small inorganic
36
fibers) [Nalco, 2004]. Typically, a fiber length-to-diameter ratio of 8:1 is the minimum
necessary to allow proper modulus transfer from matrix to fiber. Randomly arranged
chopped fibers can cause crack deflection and crack bridging, resulting in increased
fracture toughness [Richardson, 2006].
Crack deflection depends on particle (i.e., grain or fiber) shape. Spherical
particles increase toughness two-fold, whereas a disk can result in three-fold gains in
toughness. Rods result in four-fold toughness improvements [Richardson, 2006].
Volume percentage of reinforcement particles is also important, as shown in Figure 2.2.
which indicates that maximum effectiveness is achieved at 0.5 volume fraction regardless
of shape [Richardson, 2006]. Brittle fiber achieved increased toughness via pull-outs, the
expending of matrix energy resulting in reduced available crack propagation energy
[Richardson, 2006].
Figure 2.2 Effect of particle shape and volume fraction on fracture toughness
[Richardson, 2006].
Ceramic shell building in most investment casting foundries follows similar
procedural steps [AFS, 1993]. Patterns and gating are assembled and dipped into
colloidal silica slurry and stuccoed with coarse refractory particles (typically fused silica).
37
Stucco is applied via “rain fall” sanders or by dipping into a fluidized bed [AFS, 1993].
Shell building typically consists of seven layers (Figure 2.3) [AFS, 1993]. The first layer
(primary coat) determines the casting’s surface finish and quality. The second and third
layers (detail layers) build part detail. The fourth, fifth, and sixth layers (backup layers)
produce the shell’s strength. The final layer (a seal coat) is not stuccoed; it binds the
previous layer of stucco.
Figure 2.3. Diagram of shell coats, the primary coat determines surface finish, detail
coats build pattern detail, backup coats provide strength, and the seal coat holds the last backup layer’s stucco in place.
Shells are dried for 24 hours before autoclaving to remove pattern wax.
Autoclaves use high temperature, high pressure steam at eight atmospheres and 170°C
(338°F) to melt wax patterns. Shells are then fired at 871-1093°C (1600-2000°F) to
increase strength and remove residual organics before pouring in batches of three [AFS,
1993]. Shells are removed from firing three at a time, placed on a refractory brick lined
cooling cart, and poured before placing the next batch. This process is repeated until all
Wax Pattern
Primary Coat
Detail Coat
Backup Coat
Seal Coat
38
shells have been cast. Post pouring, castings are cooled on the same cart on which they
were poured. During cooling, the fused silica shell undergoes a displacive transformation
resulting in cracking, allowing for easy removal of the shell from the thin metal casting.
Oxidation severity depends on composition, temperature, air flow, and exposure
time [Lankford et al., 1985]. Blades on the outside of cart are surrounded by cooler air.
Blades inside the cart cool slower, next to another blade of similar temperature (Figure
2.4). Slower cooling delays crystobalite inversion cracking, reducing exposure of the
casting to air. Faster cooling causes the ceramic shells to crack sooner.
Figure 2.4. Illustration of cooling rate based on position. The inside propeller blades are
surrounded by hot castings and will therefore cool slower.
Thermal images were taken and analyzed of castings poured at 1632°C (2970°F),
which cracked at 428-460°C (802-860°F), as indicated in Figure 2.5 by red spots.
Fast Cool
Fast Cool
Fast
Cool Fast
Cool Slow
Cool
39
Figure 2.5. Thermal image of solidifying casting; areas in red indicate a temperature of
428°C (802°F).
EDS imaging showed that oxidation formed during solidification and cooling of
cast 15-5 PH marine propellers was principally chromium oxide Cr2O3 (light areas) and
silicon oxide SiO2 (dark areas), as shown in Figure 2.6. The images were taken at taken
at 20kV and a working distance of 19mm.
Crack initiation begins here
40
Figure 2.6. EDS image of leading edge oxidation of cast 15-5PH Stainless.
3. EXPERIMENTAL PROCEDURE
3.1. SHELL STRENGTHENING
Post autoclave seal coatings were tested as a method of delaying cracking onset
during solidification. Six conditions were examined for this study, including baseline
production, which received no seal coating. A seal coat of non-fiber-modified slurry and
four fiber-modified slurry seal coats. De-waxed four blade propeller shells were utilized
for these tests. An individual sample was defined as a single propeller blade. Two
propellers (eight blades) were tested for each of the following conditions:
1. Baseline -- standard production (no modifications)
2. Extra seal coat of slurry (no fibers)
3. Extra seal coat with 0.3 wt% fibers
4. Extra seal coat with 0.8 wt% fibers
5. Extra seal coat with 1.1 wt% fibers
6. Extra seal coat with 1.5 wt% fibers
41
Images of each blade were taken with a high resolution digital camera after shake-
out. Quantitative image analysis of oxidation was conducted using image analysis
software. The leading edge length and oxidation area were determined (see Figures 3.1
and 3.2). These measurements permitted quantitative comparison of oxidation between
blades by normalizing the data resulting in oxidation area per blade length (mm2/mm ±
one standard deviation).
Figure 3.1. Oxidation on leading edge of propeller blade.
Figure 3.2. Image analysis representation of oxidation on leading edge of propeller blade.
42
3.2. COOLING RATE EFFECTS
Eight autoclaved shells were given an extra seal coat and twenty-four hours to dry
before burnout and pouring. These molds were placed in the middle row of the cooling
cart (slow cooling). Eight production (non-modified) shells were also cooled on the
middle of the cooling cart and thirty blades were cooled along the outside of the cooling
cart as a control group. Quantitative image analysis was conducted in an identical
manner to that of section 3.1.
4. RESULTS
4.1. SHELL STRENGTHENING
Table 4.1 contains the results of the shell strengthening test. Standard production
shells resulted in 3.0 ± 0.6 mm2/mm of oxidation per unit blade length on the leading
edge of the propeller castings. An extra seal coat reduced oxidation per unit length to 2.6
± 0.9mm2mm-1 and 1.1 wt% fiber addition reduced oxidation to 2.6 ± 0.8mm2mm-1.
Table 4.1. Oxidation per unit length of blade (mm2mm-1).
Blade 1 Blade 2 Blade 3 Blade 4 Blade 5 Blade 6 Blade 7 Blade 8 Average STDEV Min MaxProduction 1.99 2.75 3.92 3.89 3.11 2.58 2.96 3.03 3.03 0.64 1.99 3.92Extra Coat 1.63 3.01 3.73 1.36 1.83 3.25 2.98 2.96 2.60 0.86 1.36 3.730.3 wt% 1.97 3.81 5.03 5.26 5.41 2.52 3.55 4.39 3.99 1.27 1.97 5.410.8 wt% 3.51 2.94 1.73 7.27 3.28 1.85 1.83 4.30 3.34 1.84 1.73 7.271.1 wt% 3.24 2.85 3.65 1.98 2.20 1.26 2.08 3.14 2.55 0.80 1.26 3.651.5 wt% 2.30 1.92 2.97 3.01 2.49 3.22 3.71 3.37 2.87 0.59 1.92 3.71
Oxidation per unit of Blade LengthPropeller 1 Propeller 2
Based on Chauvenet’s criterion, a statistical means of assessing data outliers, one
data point was removed from the 0.8 wt% fiber data set, reducing oxidation from 3.3 ±
1.8mm2mm-1 to 2.8 ± 1.0mm2mm-1.
43
4.2. COOLING RATE EFFECTS
The average oxidation for production castings on the outside of the cooling cart is
1.7±0.7mm2mm-1 compared to 1.5 ± 0.5mm2mm-1 for inside cooling. As shown in Table
4.2, propellers that received a seal coat and cooled slower had the least oxidation at 1.4 ±
0.5mm2mm-1 (0.3 mm2mm-1 less oxidation per mm of blade length when compared to
outside cooled production castings). Cooling rate was never measured specifically.
Oxidation per unit blade length was 0.2mm2mm-1 lower for production molds cooled
slowly inside rather than outside cooling.
Table 4.2. Oxidation (mm2mm-1) as a function of position
Average 1.7 1.5 1.4STDV 0.7 0.5 0.5Minimum 0.5 0.8 0.4Maximum 2.9 2.6 2.6Sample Size 32 40 32
Test Conditionmm2/mm of
oxidation Outside InsideInside +Seal
5. DISCUSSION
5.1. SHELL STRENGTHENING
Because a non-fiber reinforced seal coat reduced oxidation to 2.6mm2mm-1 per
unit blade length compared to 2.6-3.9 mm2mm-1 for fiber additions it did not appear that
fibers aided in strengthening the shells. There is a 72 percent probability that an extra
seal coat reduced the oxidation versus standard production based on recorded data. Also,
the 1.1 percent fiber addition showed a 78 percent probability of improvement compared
to production shells. It appears as though a seal coat applied after autoclaving re-
saturated the shell, filling in surface micro-cracking with slurry and adding thickness.
44
The additional seal coat increased the shells’ overall load-bearing capacity which likely
delayed cracking and allowed the casting to cool adequately before exposure to an
oxidizing atmosphere.
5.2. COOLING RATE EFFECTS
There is a 70 percent probability that castings cooled more slowly inside have
0.2mm2mm-1 less oxidation than quickly cooled outside castings. Presumably, the
decreased oxidation is a result of allowing the casting to cool below 800°C before being
exposed to oxygen. There is also a 95 percent probability that casting of shells receiving
an extra seal coat and cooled slower experienced 0.3mm2mm-1 less oxidation compared
to production castings cooled faster.
6. CONCLUSION
By increasing the shell’s load bearing capacity, toughness, the onset of cracking is
delayed, and castings are able to cool enough to prevent severe oxidation (800°C) before
cracking. These factors reduce the amount of oxidation per unit blade length by as much
as 0.3mm2mm-1.
7. FUTURE WORK
A cooling cart surrounded by refractory or encased by insulating fiber boards,
should slow cooling sufficiently. Inert atmosphere during cooling may also reduce oxide
formation. Modeling could determine optimal rates of cooling. Cooling rate and oxygen
content of the air surrounding the castings should also be measured.
45
8. REFERENCES
American Foundrymen’s Society. Handbook on the Investment Casting Process. Des Plaines, Illinois: American Foundrymen’s Society, 1993.
Lankford, W.T., Jr., Samways, N.L., Craven, R.F., McGannon, H.E., editors, “The
Making, Shaping, and Treating of Steel”, 10th edition, Association of Iron and Steel Engineers, Pittsburgh, PA, 2985.
Lehman, R. L., El-Rahaiby, S. K., Wachtman, J. B. Jr., “Handbook on Continuous Fiber-
Reinforced Ceramic Matrix Composites.” Ceramics Infromation Analysis Center, West Lafayette, IN, 1995.
Nalco Company, “Grey Matter”, Naperville, IL, 2003. Richards, V. L., Mascreen, S., “Thermal Expansion of Investment Casting Pattern Wax”,
AFS Transactions, 2003. Richardson, D. Modern Ceramic Engineering, Taylor and Francis Group, Boca Raton,
FL, 2006. Sosman, R. B., “The Phases of Silica”, New Brunswick, Rutgers University Press, 1965.
46
APPENDIX
Modeling of Heat Transfer through Investment Casting Shells:
Method of Determining Shell Thermal Conductivity
Edward A. Druschitz
Simon Lekakh
Dr. Von Richards
1. ABSTRACT
This work demonstrates a simple and inexpensive method for measuring thermal
conductivity of investment casting shells. Reducing shell cracking during the autoclave-
dewaxing cycle is a goal of all investment casting foundries. However, before cracking
can be reduced, the factors that contribute to crack initiation and propagation must be
established. Shell cracking can lead to many surface defects, including heavy oxidation
resulting in pitting. These discontinuities can be removed only by non value-added
manual labor, increasing the overall cost of a casting. Although extensive work on
modeling the autoclave dewaxing process has been conducted at a number of universities
and by numerous research facilities, most of this work has either relied on assumptions
regarding thermal conductivity of the shells or measured shell thermal conductivity using
expensive and bulky equipment plus, including a production autoclave. Such
measurements require production downtime.
2. INTRODUCTION
The investment casting process is similar to that used in the ancient world:
Modern investment casting foundries use robots to dip wax pattern trees, ceramic
47
materials (such as fused silica) are applied in layers to create shells, and steam autoclaves
(boilerclaves) are used to remove the wax from the shells. The basic investment casting
procedure is shown in Figure 1.
Figure A.1. Basic investment casting procedure.
The single greatest factor determining the quality of an investment casting is the
shell into which the metal is poured. No step in the investment casting process affects
shell quality more than autoclaving. Snow 2 suggests that 90% of all shell cracks
originate in the autoclave; fins, dimensional problems, shell debris, and leakers are all
results of these cracks. The autoclave is a pressure vessel that uses high temperature
steam to aid in the extraction of the wax from the shell. However, this relatively simple
machine is a modern day “black box” for the simple reason that quantifying what goes on
inside an autoclave is difficult, requiring expensive equipment that can withstand
pressures up to 10 bar and temperatures as high as 180°C (Gebelin3). During the
autoclave dewaxing cycle, high temperature steam penetrates the porous ceramic shell
(changing the thermal conductivity of the shell), transferring heat to the wax, and thus
48
causing the wax to melt and run out of the shell cavity (Gebelin J-C4). Work conducted
by Connolly5 suggests that the specific heat of a ceramic shell could be calculated using
the rule of mixtures. This equation, which treats each shell component (stucco and
slurry) as an individual element, is labeled below as Equation 1.
Equation 1. (Connolly5)
...332211 CpFCpFCpFCpShell ++=
where:
CpShell = Specific heat capacity of the investment shell as a whole
F1 = Fractional mass of material 1
Cp1 = Specific heat capacity of material 1
Connolly5 used a differential scanning calorimeter (DSC) and Equation 2 to
determine the specific heat capacity of each shell component, i.e., the primary coat slurry,
primary coat stucco, and so on
Equation 2. (Connolly5)
( )βδδ
δδ
RsR
RS
sRSSR CpCpt
TCpt
TCp −=−=Θ−Θ=ΔΘ
where:
SRΔΘ = Differential heat flow rate
49
SΘ = Heat flow from sample
RΘ = Heat flow from reference
CpS = Sample specific heat capacity
STδ = Temperature change in sample
CpR = Reference specific heat capacity
RTδ = Temperature change in reference
tδ = Change in time
β = Average heating rate
Connaly5 applied the specific heat capacity values generated for the individual
components using the DSC to Equation 1 to calculate the overall specific heat capacity
for the shell. He then compared those values to a measured Cp of the whole shell. The
results were very similar, thus proving that the Rule of Mixtures can be used to calculate
the Cp value of an investment shell. However, this procedure did not consider the effects
of water infiltration or condensation in the shell.
Although Connolly’s5 work explained the speed with which the investment shell
heated up in an autoclave, it failed to address the heat transfer through the shell to the
underlying wax. Jones6 corrected this deficiency by building a shell around a copper
plate of known size and heating it in both wet and dry conditions. For the wet tests, the
shelled plate was submerged in cold and hot water, and the temperature change of the
copper plate over time was recorded. Following this procedure, the shell was removed
and the average shell thickness was determined. Rearranging Equation 3 to find the
50
shell’s thermal conductivity, Jones6 was able to determine the thermal conductivity of the
shell based on the heat flow through it.
Equation 3. (Jones 6)
( )⎟⎟⎟⎟
⎠
⎞
⎜⎜⎜⎜
⎝
⎛
−
⎟⎠⎞
⎜⎝⎛
⎟⎟⎠
⎞⎜⎜⎝
⎛=
flCu
Cu
S
SCupCus TT
tT
AlCM
K δδ
,
Analysis of the data showed that the thermal conductivity of the shell was
approximately 0.4 – 0.55 W/moK in the dry condition and 0.9 – 1.1 W/moK in the wet
condition. This result demonstrated that the thermal conductivity doubled when water
filled the porous ceramic shell (Jones 6). This dramatic increase in thermal conductivity
is favorable since it would create a smaller thermal gradient across the shell, thus
decreasing the depth of the wax melt front and reducing the amount of bulk wax
expansion that might cause the shell to crack.
Sabau7 expanded on the work of Heames and Geiger (1978), Huang et al. (1989)
and Hendricks and Engelhardt (1993) by further developing the theory of packed beds as
a useful model to explain the thermal conductivity of sintered (fired) fused silica shells.
Sabau’s7 research examined two methods to measure the thermal conductivity of the
shells, the hot-wire method (ASTM C1113) and laser-flash (ASTM C714). After
preliminary experimentation, Sabau found that the Laser-Flash method was too sensitive
to the shell’s thickness and yielded inconsistent results; therefore, he settled on a form of
the hot-wire test to determine shell thermal conductivity. This work demonstrated that
the hot wire method can determine shell thermal conductivity and emissivity, which
51
could aid in the modeling of shell thermal properties during cooling. A semi-empirical
correlation for thermal conductivity indicated that the radiative component of the thermal
conductivity can, be expressed as Equation 4 (Sabau7).
Equation 4. (Sabau7)
34)( TdETK pr Β=
where:
Kr = Radiative component of thermal conductivity
E = Factor of order correlated to radiation properties
Β = Stefan-Boltzman constant
dp = Particle size
T = Absolute temperature (K)
Sabau used this equation as a basis to determine emissivity, which he would later
use to determine the heat transfer coefficient (HTC) from the shell to the ambient air.
Until research progressed to this point, thermal conductivity of the shells was largely
based on lab experiments that had yet to be verified by actual instrumented autoclave
trials. Using a specially built high temperature test cell, Kruse8 was able to invest a
copper plate and actually record the temperature increase during a typical autoclave
cycle. This data was used to calculate, for the first time, the thermal conductivity of the
shell during the autoclave process using:
52
Equation 5. (Kruse 8)
( )CuSp TT
XAk
tTMC
−⎟⎠⎞
⎜⎝⎛=
Δ
Using this equation, Kruse 8 calculated the thermal conductivity and pressure of a
foundry's shells to be 0.5 W/moK dry and 1.4 W/moK wet. For dry shells, this trial
yielded the same results as published by Jones6 but it showed that high temperature
pressurized steam resulted in a higher thermal conductivity. According to Kruse8, during
the autoclave cycle, the air is compressed 87.5 percent, and the condensed steam is pulled
into the underlying shell by capillary action. During Kruse’s8 tests, the thermal
conductivity increased by 2.0 – 2.5 times depending on shell structure and composition.
Presumably, this increase occurs because the conductivity of the shell changes with both
saturation and temperature, indicating that existing models of two-phase structures did
not adequately represent the shell’s thermal conductivity. Kruse8 proposed a revised
Maxwell model in which the thermal conductivity of the continuous phase (ceramic and
polymer) was also affected by the moisture content. The underlying physics used to
justify this approach was that the polymer and colloidal silica at the contact points of the
refractory grains absorb water and thus change both the cross-sectional area and the
properties of the contact points. This assumption would be important later when Sabau7
adopted the hot wire method to create an inexpensive and non-intrusive test to determine
the thermal conductivity of shells.
Various mechanisms of heat transfer may be involved during shell bulging in the
investment casting process. The shell, which is a highly porous structure, could transfer
53
heat by: 1) thermal conductivity through a skeleton of solid fused silica particles, 2) by
air conductivity in closed pores, with 3) additional air convection in open interconnected
pores and, finally, 4) radiation during firing and pouring at high temperature. In addition,
wax removal in the autoclave is assisted by water vapor, which could also dramatically
change the rate of heat transfer as a result of the high thermal conductivity of water and
heat of condensation liberation. It is difficult to develop a theory that takes into account
all these possibilities. The experimental methods typically used to measure heat transfer
have been based on steady state measurement techniques. These measurements require
that samples be placed between a heat source and a heat sink, and the temperature
gradient reflects the value of the coefficient of thermal conductivity. Unfortunately,
steady state methods do not accurately reflect real non-steady-state industrial processes,
such as shell dewaxing in an autoclave. Non-steady-state measurement techniques are
more attractive because they can provide data representing combined variables, including
temperature, thermal conductivity, heat capacity, and thermal diffusivity.
Thermal diffusivity is a material’s ability to adjust its temperature to the
surroundings quickly; it is expressed in Equation 6. Heat diffusivity is the ability of the
shell to absorb heat (heat diffusivity = kρCp) (Poirier10). Equation 7 shows the heat flux
into a mold. The rate at which latent heat is evolved is shown in equation 8 (Poirier10).
During the solidification of a casting, the amount of solidified material depends on the
characteristics of the metal’s (Tm, To, p and Hf) and the heat diffusivity of the mold
materials (k, p and Cp) (Poirier10). During the autoclave dewaxing process, liquefaction
occurs. The same information needed to determine solidification times is also required to
54
model the autoclave process; however, the parameters for melting wax are used in place
of those for solidifying metal.
Equation 6: (Poirier 10)
pCk
ρα =
Equation 7: (Poirier 10)
( )00
* TTtCk
q mp
X
−=∫= π
ρ
Equation 8: (Poirier 10)
⎟⎠⎞
⎜⎝⎛=∫
= tMHq f
X δδρ
0
Equation 9: (Poirier 10)
tCkH
TTM Pf
M ρρπ ⎟
⎟⎠
⎞⎜⎜⎝
⎛ −= 0(*2
Two standard methods are used for non-steady-state heat transfer measurements.
The first, called the hot wire method, creates a known value of heat energy inside the
media using a micro heater. A K-type thermocouple is used to determine the temperature
55
curve, and the thermal conductivity (k) can be determined from the temperature versus
time curve. The thermal conductivity of the sample can be derived as follows:
Equation 10: (Carlsaw 11)
( )Atk
QTs
+⎟⎟⎠
⎞⎜⎜⎝
⎛=Δ )ln(*
4π
Equation 11: (Yamasue 12)
...2
4ln 2 ++⎟⎟⎠
⎞⎜⎜⎝
⎛=
w
s
e
S
kk
CrA α
where r is the radius of the wire, Ce is Euler’s constant, and α is the thermal duffusivity
of the sample. Typically, the thermal conductivity of the sample is the slope of the linear
relationship between TΔ and ln(t), calculated as:
Equation 12: (Yamasue 12)
1
)ln(4
−
⎟⎠
⎞⎜⎝
⎛ Δ⎟⎠⎞
⎜⎝⎛=
tTQks δ
δπ
The second method is a transient technique, the laser flash method. This method
measures heat diffusivity and requires additional measurements or assumptions in terms
of the value of specific heat capacity.
56
3. EXPERIMENTAL PROCEDURE
The present work has developed a novel method for dynamic measurement of
thermal processes in unsteady thin shells and bulk sand media. This method is based on
the generation of a stable and known value for an energy impulse created by passing
direct current through a wire microheater, combined with temperature measurements
inside the media near the heat source. The micro impulse of heat has minimal influence
on existing thermal processes and properties of the sand media. The relaxation time after
the current is turned off is short and therefore permits the reproduction of cyclic
measurements of the thermal properties in rapidly changing conditions. Also, the device
simultaneously measures the absolute temperature of the media.
The microheater was made from 0.38 mm Alomega wire and was approximately
15 mm long. The microheater was welded to thicker wire (0.8 mm) of the same material
to concentrate the heat impulse on the measured space. A type K thermocouple (0.38
mm wire for fast response) was used for temperature measurement. Alumina tube (05
mm in diameter) with four holes was used for the shell of the device. A high resolution,
24-bit data acquisition system and programmable power supply were connected to a PC.
Programming was done with LabView 8 software, which supplied precise
voltage/current/time parameters. A schematic of the device is shown in Figure 2.
57
ProgrammablePower Supply
Sand Media
Data AcquisitionSystem
PC
Micro Heater
Thermocouple
Figure A.2. Method of unsteady thermal conductivity measurements.
The new method was first tested using bulk dry sand. Temperature impulses at
various levels of impulse energy are shown in Figure 3. The measured amplitude of the
temperature impulse was increased with increasing electrical current and heating time.
The amplitude of temperature impulse had minimal variations in sequential
measurements when the same electrical impulse was applied. Full temperature relaxation
time increased from 1 minute for a 1A/3 sec heat impulse to 5 minutes for a 3A/60 sec
heat impulse. Relaxation time refers to the minimum possible time between sequential
measurements. The necessary test cycle can be designed with a programmable power
supply.
58
24.0
24.5
25.0
25.5
26.0
0 1 2 3 4 5 6
Time, min
Tem
pera
ture
, 0 C
1 A 5 sec
20.0
30.0
40.0
50.0
0 2 4 6 8 10 12
Time, min
Tem
pera
ture
, 0 C
3 A 60 sec
a) b)
Figure A.3. Measured temperature in bulk dry sand for a) 1A and 5 sec impulse and b) 3A and 60 sec impulse.
The sensitivity of this new method was tested using sand with varying moisture
contents. The last composition was chosen to evaluate the potential influence of media
electro-conductivity on measurement results. In addition, mixtures of dry sand and
mineral oil were tested to determine the potential influence of water on short circuiting
and heat generation. The applied electrical impulses were 2A for 120 seconds. The
initial measurement data is provided in Figure 4a, and the influence of the moisture and
oil additives on the amplitude of the temperature change is shown in Figure 4b. In both
cases, this method indicated that the temperature increase in the sand media with more
thermally conductive liquid (water or oil) was far less than without. The measurement
technique was not affected by the electrical conductivity of the liquid.
59
20
30
40
50
0 10 20 30 40 50 60 70
Time, min
Tem
pera
ture
, 0 C
Dry sand
+ 6% water
+ 1.5% water
0
4
8
12
16
20
0 2 4 6 8 10
Additions, %
Tem
pera
ture
incr
ease
, 0 C
Sand + waterSand + mineral oil
a) b)
Figure A.4. Influence of moisture and mineral oil additions to dry sand on the amplitude of the temperature increase.
4. COMPUTER MODELING
Fluent software was used to model unsteady heat transfer in 3D media with an
internal energy source (wire). Fluent is a finite element modeling package; for this work,
a 3-node edge, quadrilateral face, and hexahedral volume were used. The semicircle
picture in Figure 5a represents the internal energy source, which was operated in the open
position (2A) and closed position (0A) using a constant resistivity. The thermocouple
was located between the two legs of the semi-circle. The boundary and initial conditions
used in this preliminary modeling ignored the thermal resistance between the materials at
their boundaries because the thermal conductivity of the shell material was already very
low. The principle equation used by Fluent is shown in equation 13 (Fluent 13).
Temperature dependent values of heat capacity Cp are shown in equation 14; they were
applied to the wire heater and shell media without additional thermal resistance (Fluent
13).
60
Equation 13: (Fluent 13)
qxTk
xh
t ii
+⎟⎟⎠
⎞⎜⎜⎝
⎛=
δδ
δδρ
δδ
where: ρ is density, h is enthalpy (which equals dTCT
T pref∫ ), k is thermal conductivity, T
is temperature, and t is time.
Equation 14: (Fluent 13)
MediaMedia
WireWire x
TkxTk ⎟
⎠⎞
⎜⎝⎛=⎟
⎠⎞
⎜⎝⎛
δδ
δδ
The model used published thermal properties of bulk dry sand, and the results
were compared to experimentally measured temperature increases at 2A, as shown in
Figure 5.
0
4
8
12
16
0 100 200 300 400 500 600
Time, sec
Tem
pera
ture
incr
ease
, 0 C
MeasuredCalculated
a) b)
Figure A.5. Computed temperature field (a) and comparison of experimentally measured temperature increase with calculated data for dry bulk sand (b).
61
The calculated temperature increase was similar in media with different known
values of thermal conductivity as shown in Figure 6.
y = 11.291x-1.3571
R2 = 0.9966
0
0.5
1
1.5
2
2.5
3
0 4 8 12 16 20 24 28 32 36
Temperature increase, 0C
K, w
/mK
Figure A.6. Calculated temperature increase and K of materials
5. EXPERIMENTAL RESULTS
Three shell probes were created, and investment shells were built on them.
Sample 1 is a production built shell representing the entire shell building process
(primary coat and secondary coats) at a participating foundry. Samples 2 and 3 are from
different foundries; sample 2 received only primary coats, and sample 3 received only
backing coats. Pictures of these samples are shown in Figure 7.
62
Figure A.7. Completed thermal conductivity probes.
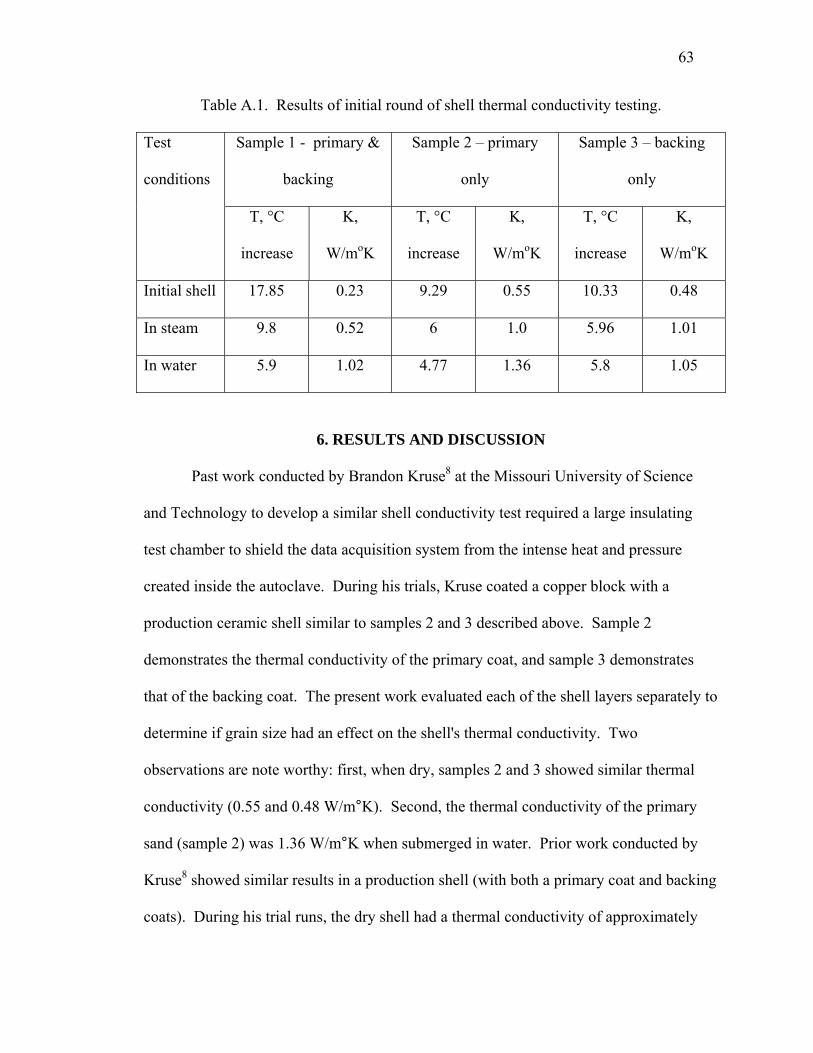
Three shells were tested using different conditions (specified in Table 1). The
shells were initially submerged in dry sand and tested. Tests were then conducted in
steam by isolating the samples in a Kaowool box and using a continuously working
steamer at 60-90°C and normal atmospheric pressure. The samples were also tested
while submerged in water for 20 minutes. The temperature increase (°C) was measured
and the thermal conductivity (k) calculated, results are shown in Table 1.
63
Table A.1. Results of initial round of shell thermal conductivity testing.
Test
conditions
Sample 1 - primary &
backing
Sample 2 – primary
only
Sample 3 – backing
only
T, °C
increase
K,
W/moK
T, °C
increase
K,
W/moK
T, °C
increase
K,
W/moK
Initial shell 17.85 0.23 9.29 0.55 10.33 0.48
In steam 9.8 0.52 6 1.0 5.96 1.01
In water 5.9 1.02 4.77 1.36 5.8 1.05
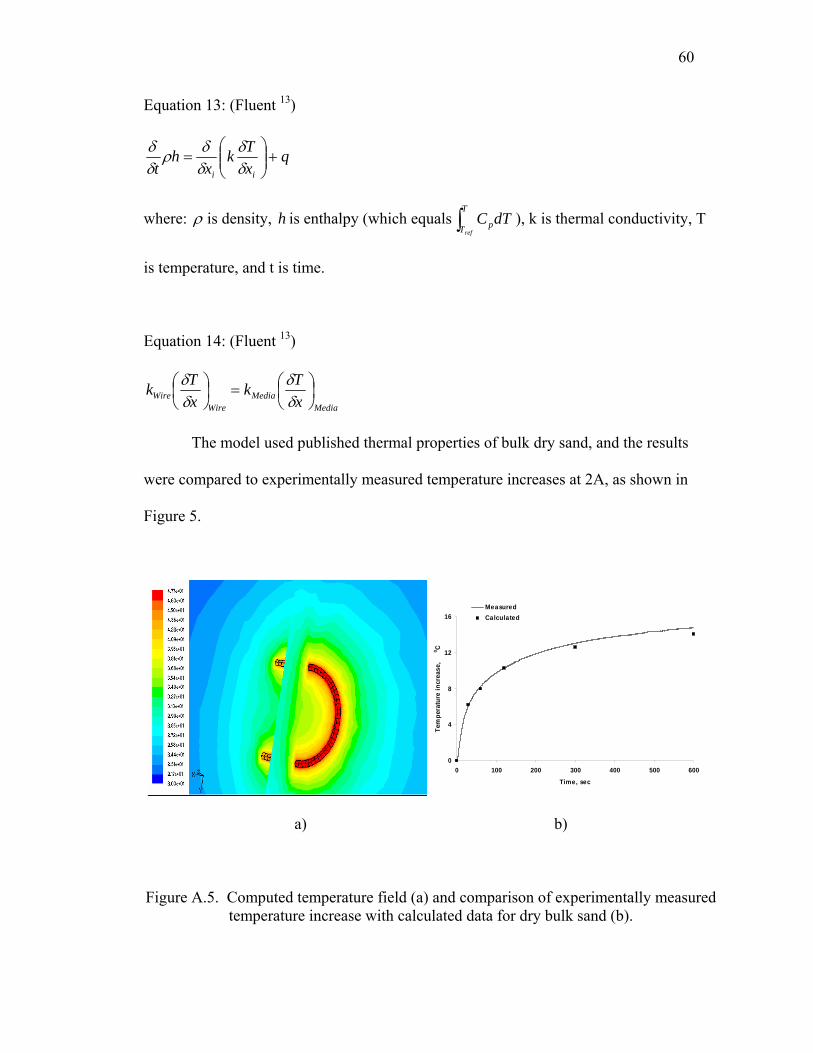
6. RESULTS AND DISCUSSION
Past work conducted by Brandon Kruse8 at the Missouri University of Science
and Technology to develop a similar shell conductivity test required a large insulating
test chamber to shield the data acquisition system from the intense heat and pressure
created inside the autoclave. During his trials, Kruse coated a copper block with a
production ceramic shell similar to samples 2 and 3 described above. Sample 2
demonstrates the thermal conductivity of the primary coat, and sample 3 demonstrates
that of the backing coat. The present work evaluated each of the shell layers separately to
determine if grain size had an effect on the shell's thermal conductivity. Two
observations are note worthy: first, when dry, samples 2 and 3 showed similar thermal
conductivity (0.55 and 0.48 W/m°K). Second, the thermal conductivity of the primary
sand (sample 2) was 1.36 W/m°K when submerged in water. Prior work conducted by
Kruse8 showed similar results in a production shell (with both a primary coat and backing
coats). During his trial runs, the dry shell had a thermal conductivity of approximately
64
0.64 W/m°K, and at saturation in the autoclave the thermal conductivity was
approximately 1.56 W/m°K using the Maxwell model (Kruse 8). The thermal
conductivity of the finer primary sand was 0.31 W/m°K higher than the backing sand
when saturated, likely because the smaller grain size led to high interconnectivity. Thus
heat was transferred through the backing faster by conduction. Also, the density of the
finer prime coat stucco was higher than that of the coarser backing stucco, and pore size
was greater in the backing stucco. Further, the difference between the saturated results of
the hot wire test and Kruse’s8 tests may be the pressure at which the autoclave operates.
At eight atmospheres of pressure, air in the autoclave would be compressed 87.5% and
the steam would be pulled through the shell by a capillary effect (Kruse 8).
7. CONCLUSIONS AND RECOMENDATIONS
The hotwire method permits accurate measurement of the thermal conductivity of
an investment shell without requiring a production autoclave in which to run tests. Also,
the small probes can easily be shipped to the foundry where the samples can be invested
in the materials of interest to the lab. Thus, there is no need for a lab technician to travel
to each location. Knowing the thermal conductivity of an investment casting shell will
permit more precise modeling of what happens inside the autoclave and thus aid in the
understanding and reduction of shell cracking.
Future work for this project will include the creation of numerous sample probes.
These probes will be sent to participating foundries to be shelled, and then mailed back
for testing. These tests will aid in both the development of a more accurate autoclave
model and clarify how various parameters, including shell slurry, stucco, and grain size,
65
affect the thermal conductivity of shells. In addition, this information will aid in the
further development of the autoclave model.
8. ACKNOWLEDGEMENTS
The authors would like to thank Mercury Marine Corporation and O’Fallon
Casting for their support of this project, and the Mercury Marine Propeller Division for
their time, patience, and dedication to this work.
This report is based upon work supported by the U.S. Department of Energy
under Award No. De-FC36-04GO14230. Any findings, opinions, conclusions, or
recommendations expressed here are those of the authors and do not necessarily reflect
the views of the Department of Energy.
66
9. BIBLIOGRAPHY
1. American Foundrymen’s Society, “Investment Casting Process”, American Foundrymen’s Society, 1993.
2. J. Snow, “What Happens During Autoclave Dewaxing,” Proc. 46th Annual Technical
Meeting of the Investment Casting Institute, 1998, paper 5. 3. Gebelin J-C, Jones S and Jolly M, “Modeling of the De-Waxing of Investment Cast
Shells”, computational Modelling of Materials, Minerals, and Metals Processing, TMS, 2001.
4. Gebelin J-C, Jolly M.R and Jones S. “Process Modelling Research for Investment
Casting,” Proc. 48th Annual Technical Metting of the Investment Casting Institute, 2000.
5. Connolly S, Jones S, Marquis P.M, Ford D.A. “Specific Heat of Investment Casting
Shells” 10th World Conference on Investment Casting, Paper 8. 6. Jones S. Jolly M.R. Blackburn S. Gebelin J-C. Cendrowicz A. and Lewis K. “Effect of
moisture upon mechanical properties of ceramic moulds during high pressure steam dewaxing,” Materials Science and Technology, July 2003, Vol. 19.
7. Sabau A.S. and Viswanathan S, “Thermophysical Properties of Zircon and Fused
Silica-Based Shells for Investment Casting,” AFS Transactions, 2004. 8. Kruse B. and Richards V. “Thermal and Moisture Characterization During Autoclave
Dewaxing in Investment Casting,” SFSA T&O Conference Paper No. 5.5: 2005.
9. Holman J.P. “Experimental Methods for Engineers,” McGraw-Hill. Hightstown, NJ. 1994.
10. Poirier D.R. and Geiger G.H. “Transport Phenomena in Materials Processing”, TMS 1994.
67
11. Carlsaw H. S. and Jaeger J. C. “Conduction of Heat in Solids”, Oxford at the Clarendon Press, 1947.
12. Yamasue E, Masharhiro S, Hiroyuki F and Kazuthiro N. “Nonstationary Hot Wire
Method with Silica-Coated Probe for Measuring Thermal Conductivities of Molten Metals.” Metallurgical and Materials Transactions A, Volume 30A, August 1999.
13. Fluent Incorporated. “Fluent 5 User’s Guide.” Fluent Incorporated, Volume 2, 1998.
68
VITA
Edward Alan Druschitz was born on June 8, 1983 in Michigan. He grew up in
Rochester Hills, Michigan, before moving to Troy, Michigan. In the eighth grade, he
moved to Lynchburg, Virginia where he lived until graduating from Jefferson Forest
High School in 2001. He earned his Bachelors degree in Mechanical Engineering
Technology from Central Washington University in 2005 before following his dream to
study metallurgical engineering technology at Missouri University of Science and
Technology (formerly University of Missouri-Rolla) where he earned his master’s degree
in 2009.