INVESTMENT SOLUTIONS INVESTMENT SOLUTIONS INVESTMENT SOLUTIONS INVESTMENT SOLUTIONS STRATEGIC GLOBAL FUND STRATEGIC GLOBAL FUND STRATEGIC GLOBAL FUND STRATEGIC GLOBAL FUND Interim Unaudited Interim Unaudited Interim Unaudited Interim Unaudited Report and Financial Statements Report and Financial Statements Report and Financial Statements Report and Financial Statements for the for the for the for the six months ended 30 September 2014 six months ended 30 September 2014 six months ended 30 September 2014 six months ended 30 September 2014
STRATEGIC GLOBAL FUNDSTRATEGIC GLOBAL FUNDSTRATEGIC GLOBAL FUNDSTRATEGIC GLOBAL FUND
Interim Unaudited Interim Unaudited Interim Unaudited Interim Unaudited Report and Financial Statements Report and Financial Statements Report and Financial Statements Report and Financial Statements for the for the for the for the six months ended 30 September 2014six months ended 30 September 2014six months ended 30 September 2014six months ended 30 September 2014
Statement of Responsibilities of the Manager and Trustee 19
Statement of Total Return 20 - 21
Statement of Change in Unitholders’ Funds 22 - 23
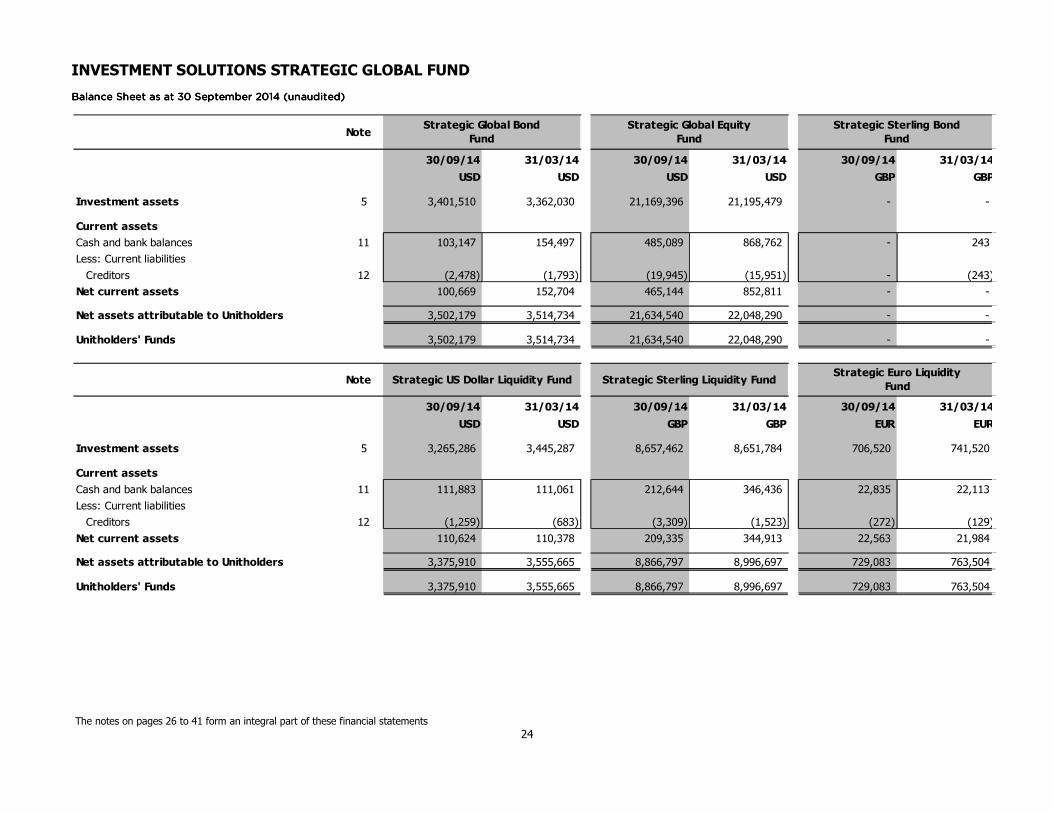
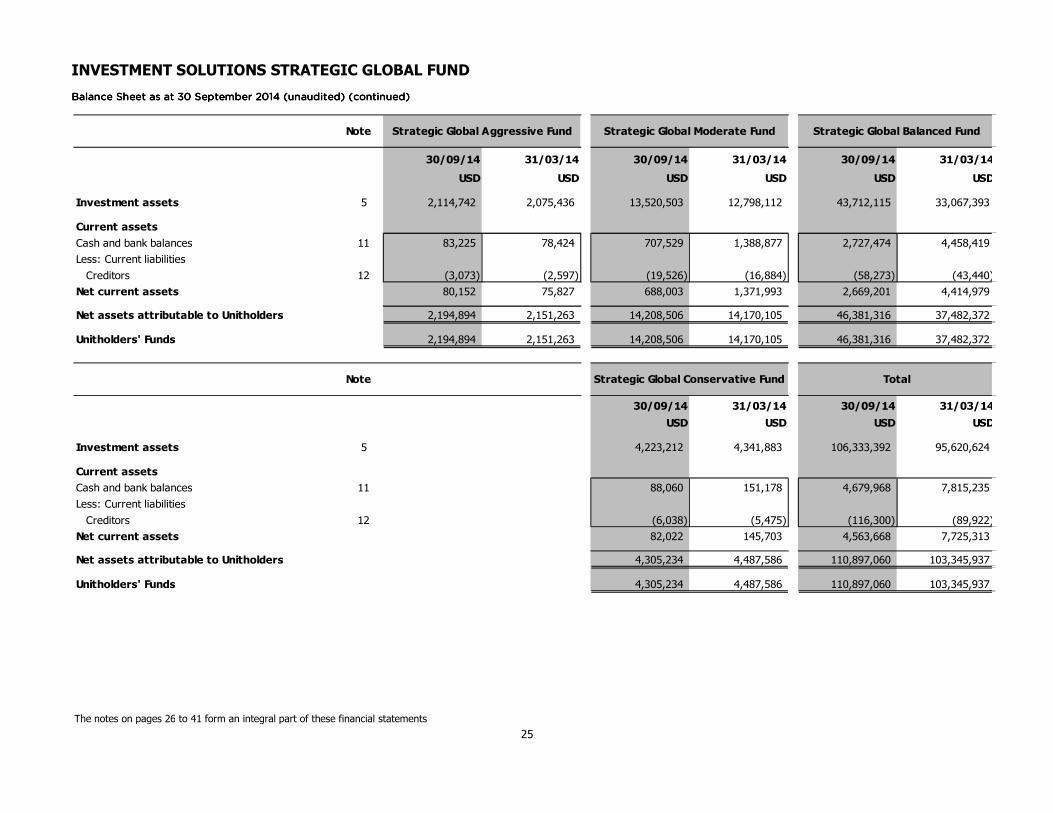
Balance Sheet 24 - 25
Notes to the Financial Statements 26 - 41
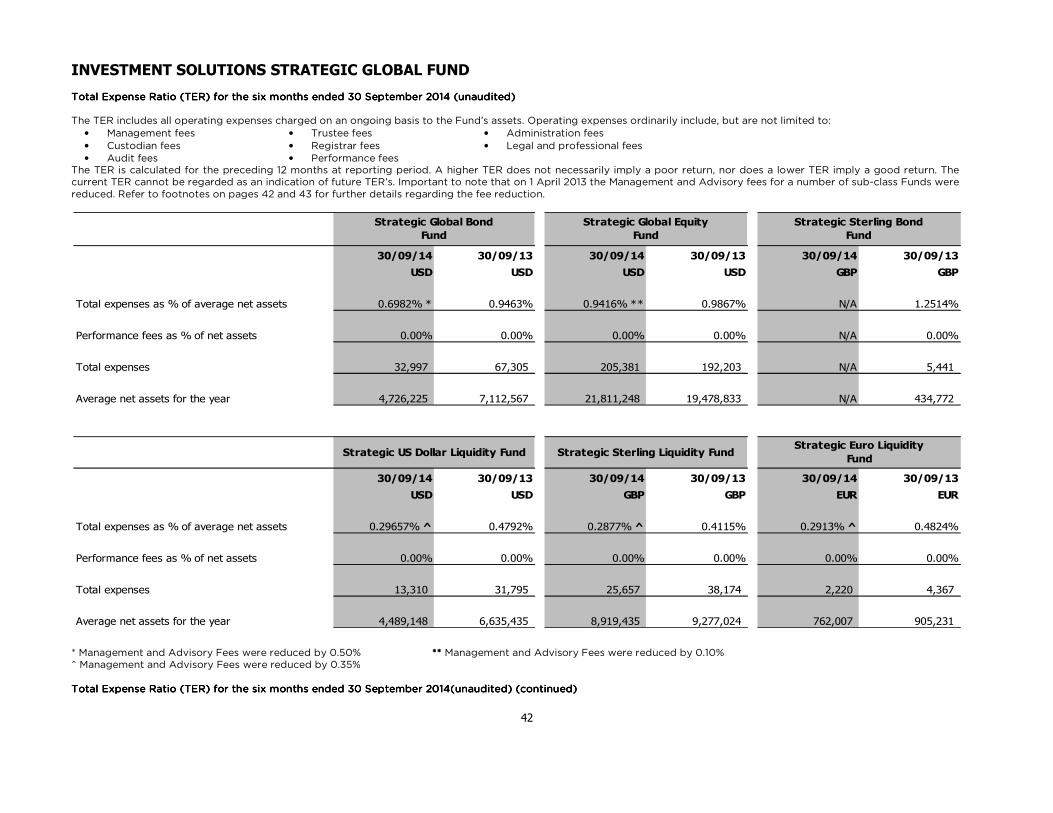
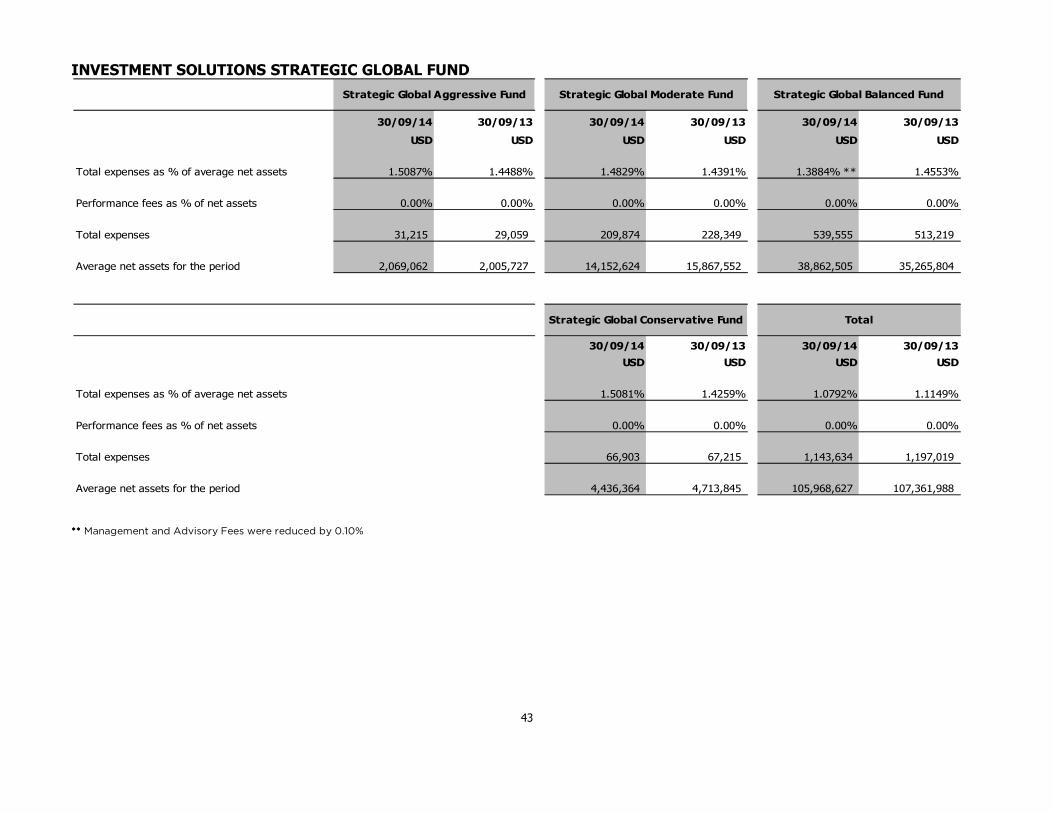
Total Expense Ratio (TER) 42 - 43
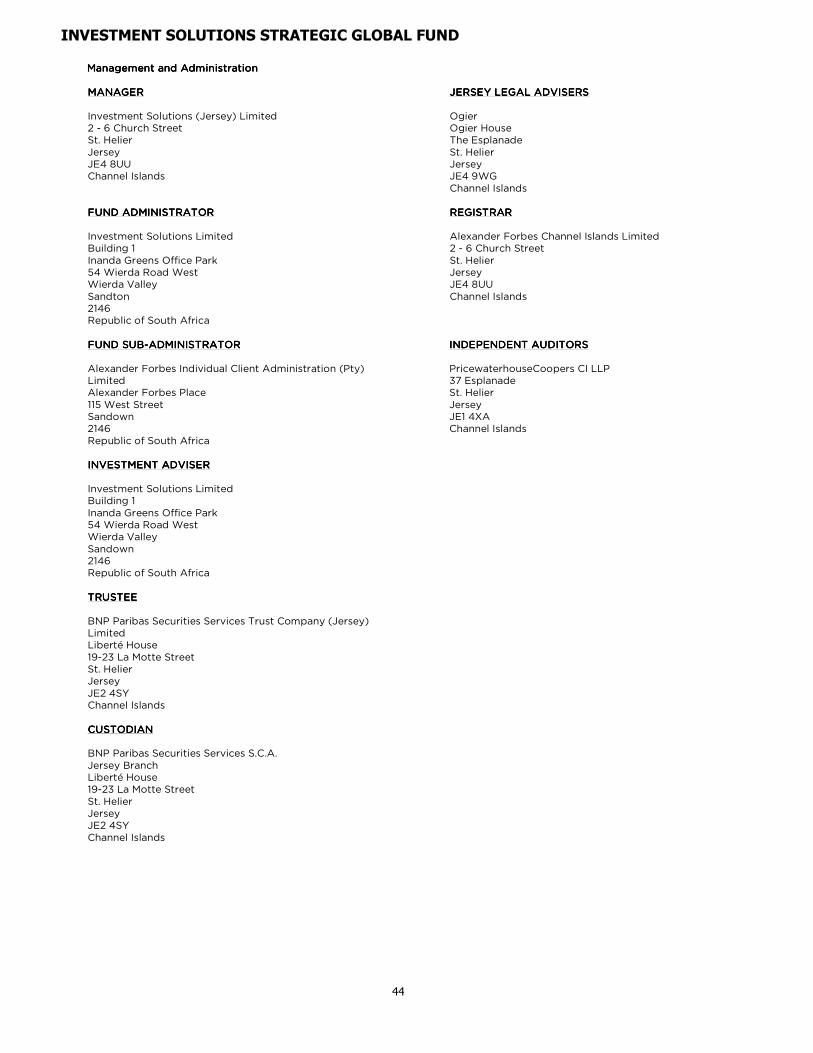
Management and Administration 44
Disclosure Statement 45
INVESTMENT SOLUTIONS STRATEGIC GLOBAL FUND
2
Investment Investment Investment Investment Advisers’Advisers’Advisers’Advisers’ Report Report Report Report for the for the for the for the six months ended 30 September 2014six months ended 30 September 2014six months ended 30 September 2014six months ended 30 September 2014 1111. . . . IntroductionIntroductionIntroductionIntroduction
Investment Solutions Limited (“Investment Solutions”) has been appointed as the investment adviser to Investment Solutions (Jersey) Limited (“ISJL”), the Manager of the Investment Solutions Strategic Global Fund (“ISSGF”). Investment Solutions advises ISJL on the manager selection within the ISSGF, evaluates performance, monitors significant changes within the underlying funds, advises on proposed changes to the ISSGF structure and manager line-up and performs strategic asset allocation to the Strategic Global Conservative Fund, the Strategic Global Moderate Fund, the Strategic Global Balanced Fund and the Strategic Global Aggressive Fund.
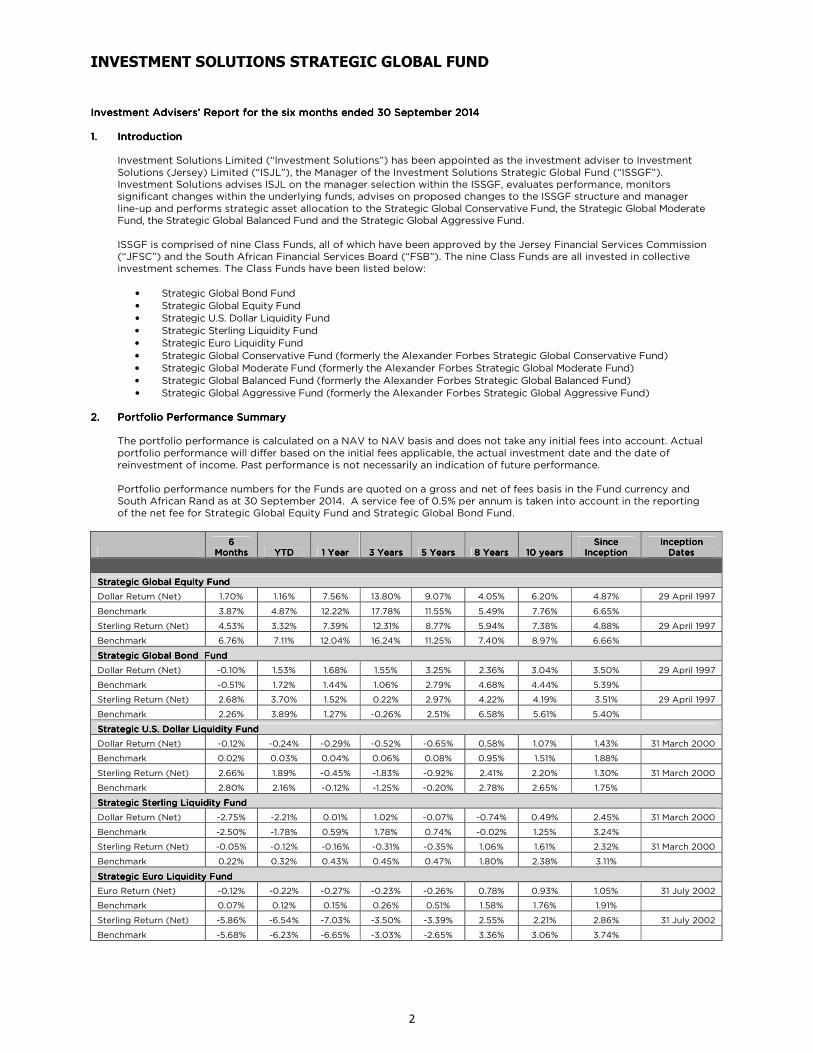
ISSGF is comprised of nine Class Funds, all of which have been approved by the Jersey Financial Services Commission (“JFSC”) and the South African Financial Services Board (“FSB”). The nine Class Funds are all invested in collective investment schemes. The Class Funds have been listed below:
• Strategic Global Bond Fund • Strategic Global Equity Fund • Strategic U.S. Dollar Liquidity Fund • Strategic Sterling Liquidity Fund • Strategic Euro Liquidity Fund
• Strategic Global Conservative Fund (formerly the Alexander Forbes Strategic Global Conservative Fund) • Strategic Global Moderate Fund (formerly the Alexander Forbes Strategic Global Moderate Fund) • Strategic Global Balanced Fund (formerly the Alexander Forbes Strategic Global Balanced Fund) • Strategic Global Aggressive Fund (formerly the Alexander Forbes Strategic Global Aggressive Fund)
The portfolio performance is calculated on a NAV to NAV basis and does not take any initial fees into account. Actual portfolio performance will differ based on the initial fees applicable, the actual investment date and the date of reinvestment of income. Past performance is not necessarily an indication of future performance. Portfolio performance numbers for the Funds are quoted on a gross and net of fees basis in the Fund currency and South African Rand as at 30 September 2014. A service fee of 0.5% per annum is taken into account in the reporting of the net fee for Strategic Global Equity Fund and Strategic Global Bond Fund.
6 6 6 6
MonthsMonthsMonthsMonths YTDYTDYTDYTD 1 Year1 Year1 Year1 Year 3 Years3 Years3 Years3 Years 5 Years5 Years5 Years5 Years 8 Years8 Years8 Years8 Years 10 years10 years10 years10 years Since Since Since Since
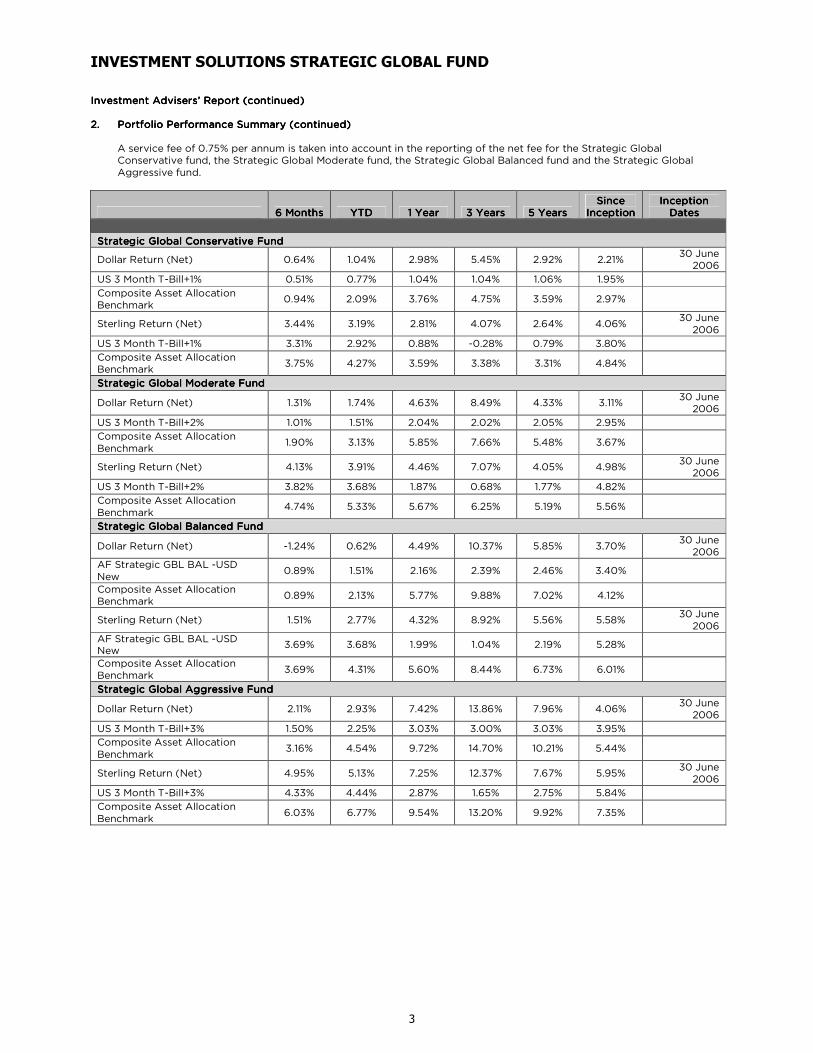
A service fee of 0.75% per annum is taken into account in the reporting of the net fee for the Strategic Global Conservative fund, the Strategic Global Moderate fund, the Strategic Global Balanced fund and the Strategic Global Aggressive fund.
6 Months6 Months6 Months6 Months YTDYTDYTDYTD 1 Year1 Year1 Year1 Year 3 Years3 Years3 Years3 Years 5 Years5 Years5 Years5 Years Since Since Since Since
3.3.3.3. Underlying Fund CommentaryUnderlying Fund CommentaryUnderlying Fund CommentaryUnderlying Fund Commentary 3.1 3.1 3.1 3.1 Strategic Global Equity FundStrategic Global Equity FundStrategic Global Equity FundStrategic Global Equity Fund Fund Structure and ChangesFund Structure and ChangesFund Structure and ChangesFund Structure and Changes
MandateMandateMandateMandate The investment objective of this Class Fund is to invest the assets of the Class Fund in the World Equity Fund (WEF), a sub-fund of the Russell Investment Company II Public Limited Company “(RIC II”), a UCITS scheme incorporated under the laws of Ireland. In its prospectus, which includes information about the WEF, it states that the WEF will seek to achieve capital appreciation over a 5-7 year time horizon by investing predominantly in equity securities, including common stock, convertibles and warrants, listed, traded or dealt in on any regulated market worldwide.
BenchmarkBenchmarkBenchmarkBenchmark MSCI World Index
Fund TypeFund TypeFund TypeFund Type Feeder Fund
Underlying Fund at reporting dateUnderlying Fund at reporting dateUnderlying Fund at reporting dateUnderlying Fund at reporting date World Equity Fund (within RIC II)
There have been no changes to the Fund structure during the period under review. Performance CommentPerformance CommentPerformance CommentPerformance Comment The Fund underperformed, with its underweight to stocks with the highest dividend yield hampering relative returns. Russell investments’ growth strategies enjoyed another difficult quarter in an environment which moderately favoured the value style. Value biased strategy Numeric outperformed, mitigating some of the negative relative returns. During the 2nd quarter Russell replaced their EM futures exposure with a Positioning Strategy consisting of three EM specialists. Russell’s objective is to fully exploit the breadth and opportunity of active management, and to provide a better complement to the EM exposure of their global strategies. Russell’s own positioning strategy finished ahead of the benchmark, as did market oriented strategy Numeric. However, their positive returns were more than offset by Harris, with an overweight positioning within Continental Europe and unsuccessful stock selection within the consumer discretionary and consumer staples sectors detracting. At the Fund level, positive stock selection in the financial sector and an overweight to IT stocks added value. However, stock selection in the consumer discretionary sector, luxury goods in particular, drove down performance overall. OutlookOutlookOutlookOutlook A recommendation to restructure this fund to include a minimum of 5 equity managers and thereby converting this fund to a fund of funds structure was presented to the board of ISJL during the period given that the current structure was lagging behind the benchmark. It is Investment Solutions’ view that a multi manager approach should improve performance. ConfirmationConfirmationConfirmationConfirmation We hereby confirm that there were no soft commission arrangements in operation during the period specified.
3.3.3.3. Underlying Fund Commentary (continued)Underlying Fund Commentary (continued)Underlying Fund Commentary (continued)Underlying Fund Commentary (continued) 3.1 3.1 3.1 3.1 Strategic Global Equity Fund (continued)Strategic Global Equity Fund (continued)Strategic Global Equity Fund (continued)Strategic Global Equity Fund (continued)
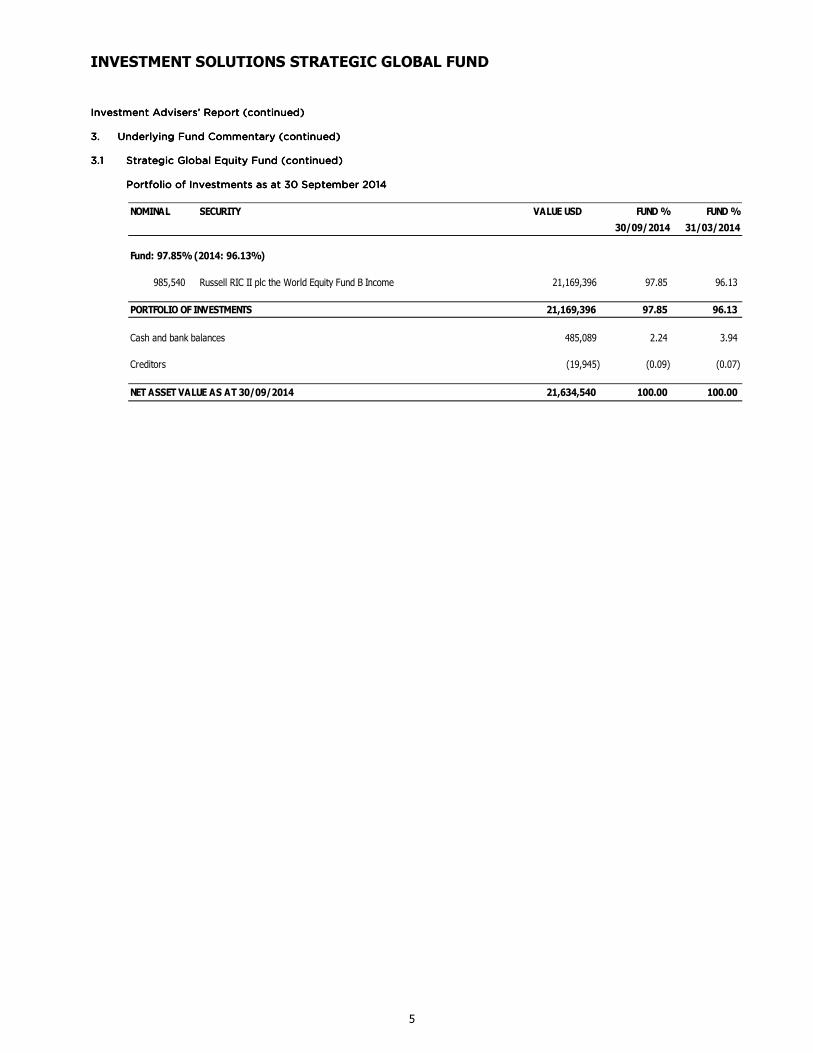
Portfolio of Investments as at Portfolio of Investments as at Portfolio of Investments as at Portfolio of Investments as at 30 September 201430 September 201430 September 201430 September 2014
NOMINAL SECURITY VALUE USD FUND % FUND %
30/09/2014 31/03/2014
Fund: 97.85% (2014: 96.13%)
985,540 Russell RIC II plc the World Equity Fund B Income 21,169,396 97.85 96.13
PORTFOLIO OF INVESTMENTS 21,169,396 97.85 96.13
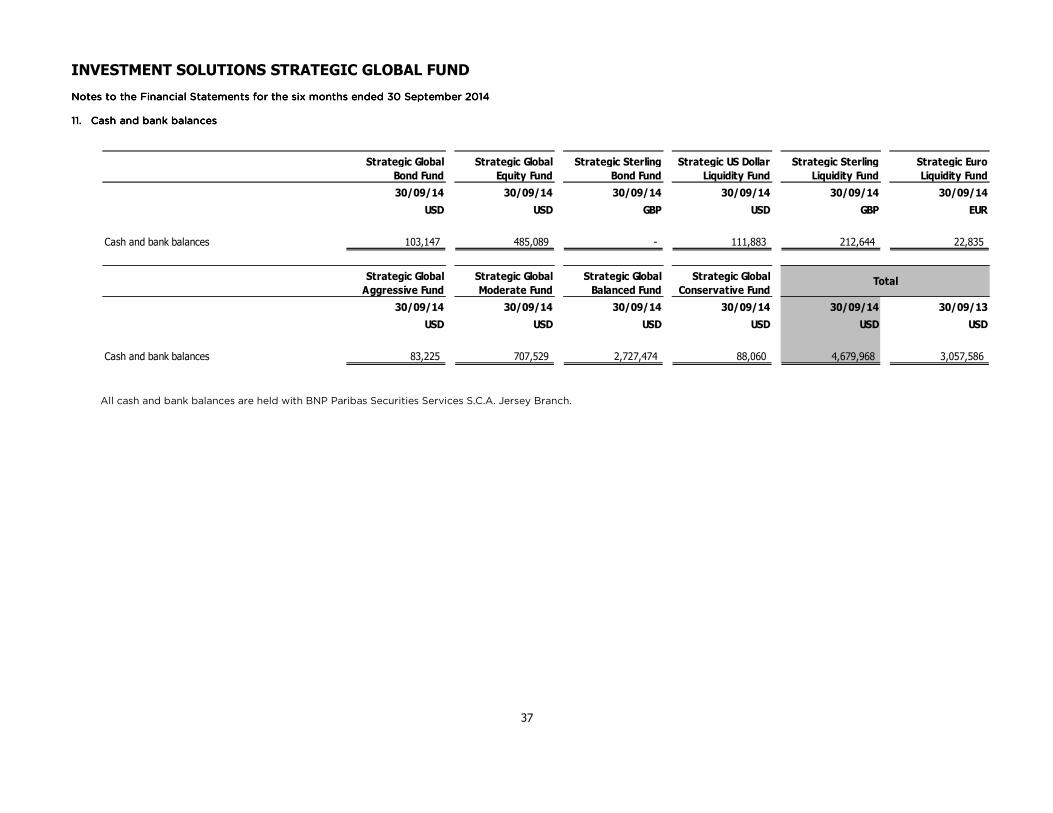
Cash and bank balances 485,089 2.24 3.94
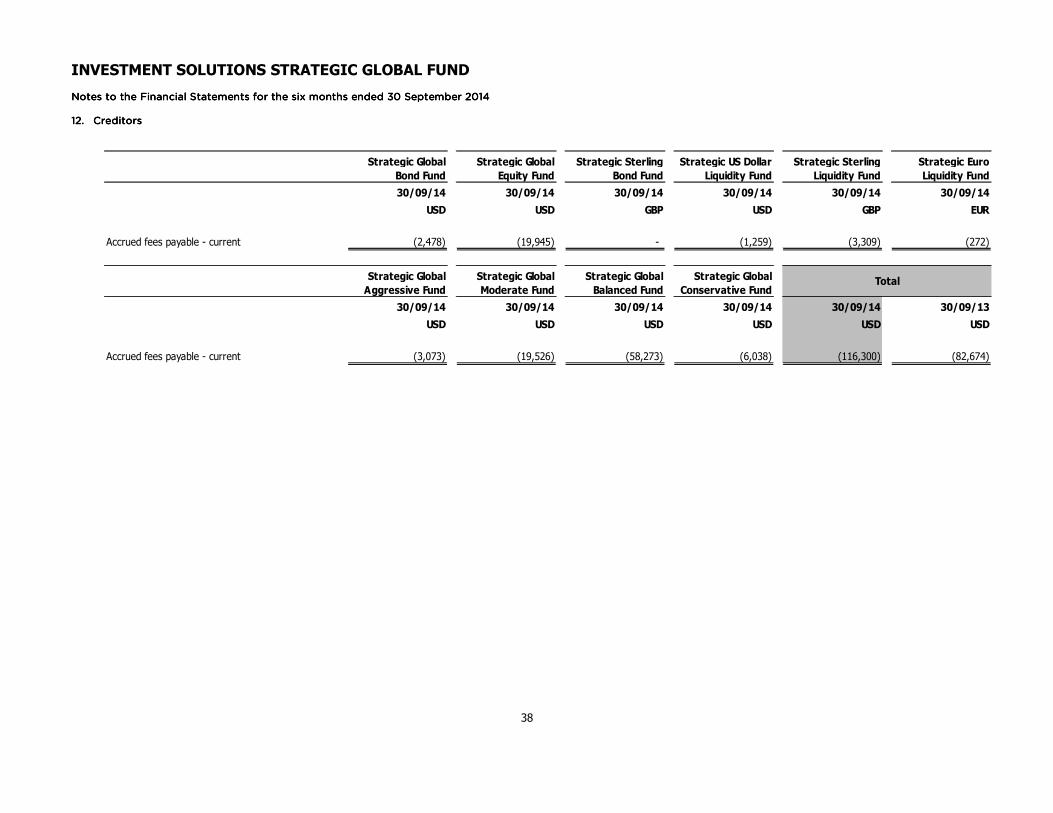
Creditors (19,945) (0.09) (0.07)
NET ASSET VALUE AS AT 30/09/2014 21,634,540 100.00 100.00
INVESTMENT SOLUTIONS STRATEGIC GLOBAL FUND
6
Investment Advisers’ Report (continued)Investment Advisers’ Report (continued)Investment Advisers’ Report (continued)Investment Advisers’ Report (continued) 3.3.3.3. Underlying Fund CommenUnderlying Fund CommenUnderlying Fund CommenUnderlying Fund Commentary (continued)tary (continued)tary (continued)tary (continued) 3.23.23.23.2 Strategic Global Bond FundStrategic Global Bond FundStrategic Global Bond FundStrategic Global Bond Fund
Fund Structure and ChangesFund Structure and ChangesFund Structure and ChangesFund Structure and Changes
MandateMandateMandateMandate The investment objective of this Class Fund is to invest in the Class A shares of the Global Bond Fund (“the Global Bond Fund”), a sub-fund of the Russell Investment Company Public Limited Company (“RIC”) and a UCITS scheme incorporated under the laws of Ireland. The RIC prospectus includes information about the Global Bond Fund, and states that the Global Bond Fund has the investment objective of providing income and capital growth over a period of 5-7 years with moderate volatility by investing primarily in transferable debt instruments denominated in a variety of currencies which include but are not limited to, municipal and government bonds, agency debt (being that issued by local authorities or public international bodies of which one or more governments is a member), mortgage related debt and corporate debt, that are listed, traded or dealt in on a regulated market in the OECD and which may have fixed or floating interest rates.
BenchmarkBenchmarkBenchmarkBenchmark Barclays Capital Global Aggregate Bond Index
Fund TypeFund TypeFund TypeFund Type Feeder Fund
Underlying Fund at reporting dateUnderlying Fund at reporting dateUnderlying Fund at reporting dateUnderlying Fund at reporting date Global Bond Fund (within RIC)
There have been no changes to the Fund structure during the period under review. Performance CPerformance CPerformance CPerformance Commentommentommentomment The Russell Global Bond Fund outperformed its benchmark over the second quarter of the financial year, benefiting largely through an overweight to EMD and high yield, as well as an underweight to government debt. An overall duration underweight detracted as yields fell, however the Fund benefited from an overweight to Mexico, Ireland and Italy. Currency positions detracted through an underweight to the Australian dollar, Norwegian krone and Swedish krona. Russell continue to expect higher rates over the intermediate term due to improving economic sentiment, BoE and Fed central bank policy evolution and the low nominal yield levels. The Fund outperformed the benchmark over the second quarter of the financial year, with all of underlying managers finishing in positive territory. A duration underweight detracted, but was mitigated through rates positioning within peripheral market. Currency exposures benefited via an underweight to JPY and EUR and commodity linked currencies: AUD and NZD. Divergent central bank policies (Fed and BoE versus ECB and BoJ) will continue to impact rates markets for the foreseeable future, with rates volatility potentially increasing. As such, we expect more tactical positing within the governments sector around US treasuries, UK gilts and German bunds. OutlookOutlookOutlookOutlook For the time being the Global Bond Fund remains an appropriate investment for the Fund to achieve its investment objectives and will remain under review. ConfirmationConfirmationConfirmationConfirmation We hereby confirm that there were no soft commission arrangements in operation during the period specified.
INVESTMENT SOLUTIONS STRATEGIC GLOBAL FUND
7
Investment Advisers’ Report (continued)Investment Advisers’ Report (continued)Investment Advisers’ Report (continued)Investment Advisers’ Report (continued) 3.3.3.3. Underlying Fund Commentary (continued)Underlying Fund Commentary (continued)Underlying Fund Commentary (continued)Underlying Fund Commentary (continued) 3.23.23.23.2 Strategic Global Bond Fund (continued)Strategic Global Bond Fund (continued)Strategic Global Bond Fund (continued)Strategic Global Bond Fund (continued)
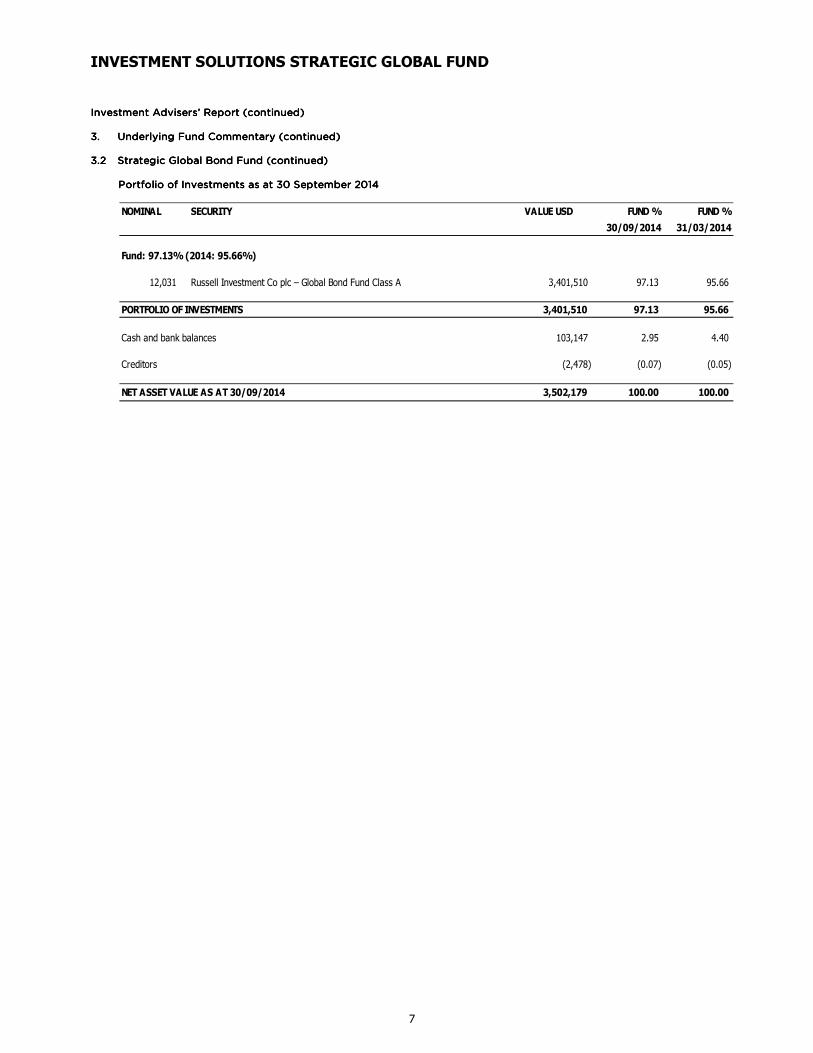
Portfolio of Investments as at Portfolio of Investments as at Portfolio of Investments as at Portfolio of Investments as at 30 September30 September30 September30 September 2014201420142014
NOMINAL SECURITY VALUE USD FUND % FUND %
30/09/2014 31/03/2014
Fund: 97.13% (2014: 95.66%)
12,031 Russell Investment Co plc – Global Bond Fund Class A 3,401,510 97.13 95.66
PORTFOLIO OF INVESTMENTS 3,401,510 97.13 95.66
Cash and bank balances 103,147 2.95 4.40
Creditors (2,478) (0.07) (0.05)
NET ASSET VALUE AS AT 30/09/2014 3,502,179 100.00 100.00
INVESTMENT SOLUTIONS STRATEGIC GLOBAL FUND
8
InInInInvestment Advisers’ Report (continued)vestment Advisers’ Report (continued)vestment Advisers’ Report (continued)vestment Advisers’ Report (continued) 3.3.3.3. Underlying Fund Commentary (continued)Underlying Fund Commentary (continued)Underlying Fund Commentary (continued)Underlying Fund Commentary (continued) 3.3.3.3.3333 Strategic Strategic Strategic Strategic U.S.U.S.U.S.U.S. Dollar Liquidity FundDollar Liquidity FundDollar Liquidity FundDollar Liquidity Fund Fund Structure and ChangesFund Structure and ChangesFund Structure and ChangesFund Structure and Changes
MandateMandateMandateMandate The investment objective of this Class Fund is to invest in shares of the U.S. Dollar Liquidity Fund II (previously The U.S. Dollar Cash Plus Fund) (“the U.S. Dollar Liquidity Fund II”), a sub-fund of the Russell Investment Company III Public Limited Company (“RIC III”), a UCITS scheme incorporated under the laws of Ireland. In the prospectus for RIC III, organised in the form of an umbrella fund, which includes information about the U.S. Dollar Liquidity Fund II, RIC III states that the investment objective of the U.S. Dollar Liquidity Fund II is to provide the maximum current income that is consistent with the preservation of capital and liquidity by investing in short-term, high-grade debt and debt-related instruments.
BenchmarkBenchmarkBenchmarkBenchmark 90-day US Treasury Bill
Fund typeFund typeFund typeFund type Feeder Fund
Underlying Fund at reporting dateUnderlying Fund at reporting dateUnderlying Fund at reporting dateUnderlying Fund at reporting date U.S. Dollar Liquidity Fund II (within RIC III)
There have been no changes to the Fund structure during the period under review. Performance CommentPerformance CommentPerformance CommentPerformance Comment Although the year-on-year growth rate has remained above 2% in quarter one of the financial year, the quarter-on-quarter growth indicated that the US economy for the second quarter of the financial year almost came to a halt. Due to the winter months which proved to be the coldest and snowiest in decades, GDP grew at the slowest pace since late 2012. However, consumer spending has remained strong as household confidence levels have improved. Industrial production growth also added to growth. CPI inflation remains well below the 2% target level which could rise in further months as the economy picks up. In US government bonds, the 10-year yield reached fresh lows during July and August. However, economic data proved strong over the full quarter and yields rose strongly during the first half of September. GDP growth in the second quarter was revised up to an annualised rate of 4.6%. The Manufacturing Purchasing Manager’s Index (PMI) moved up to 59 in August from 57.1 in July, while the services PMI reached its highest level since 2005. Furthermore, unemployment continued to fall, reaching 6.1%, in data released for August. Meanwhile, the Fed chair, Janet Yellen, announced that quantitative easing (QE) would end in October, although rates would remain low for a “considerable time” afterwards. The Fed remained concerned that the economic rebound was not fully filtering through to the jobs market, as wages have lagged behind other data points. US Treasuries rose and the 10-year yield fell 4 basis points (bps) over the quarter to 2.49%. Interest rates globally remain low and as a result, returns on cash funds net of fees are expected to be low. OutlookOutlookOutlookOutlook The benchmark for this fund remains appropriate. The U.S. Dollar Liquidity Fund II remains an appropriate investment for the Fund to achieve its investment objectives. ConfirmationConfirmationConfirmationConfirmation We hereby confirm that there were no soft commission arrangements in operation during the period specified.
INVESTMENT SOLUTIONS STRATEGIC GLOBAL FUND
9
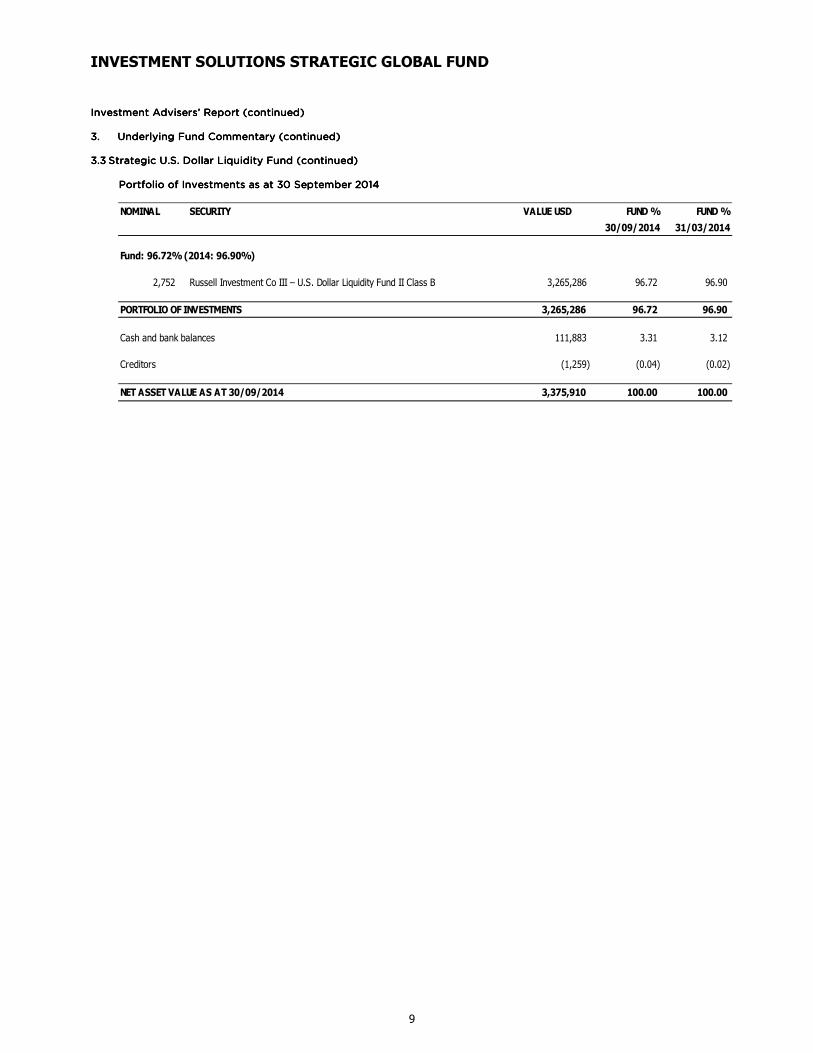
Investment Advisers’ Report (continued)Investment Advisers’ Report (continued)Investment Advisers’ Report (continued)Investment Advisers’ Report (continued) 3.3.3.3. Underlying Fund Commentary (continued)Underlying Fund Commentary (continued)Underlying Fund Commentary (continued)Underlying Fund Commentary (continued) 3.3.3.3.3333 Strategic Strategic Strategic Strategic U.S.U.S.U.S.U.S. Dollar Liquidity Fund (continued)Dollar Liquidity Fund (continued)Dollar Liquidity Fund (continued)Dollar Liquidity Fund (continued)
Portfolio of Investments as at Portfolio of Investments as at Portfolio of Investments as at Portfolio of Investments as at 30 September30 September30 September30 September 2014201420142014
NOMINAL SECURITY VALUE USD FUND % FUND %
30/09/2014 31/03/2014
Fund: 96.72% (2014: 96.90%)
2,752 Russell Investment Co III – U.S. Dollar Liquidity Fund II Class B 3,265,286 96.72 96.90
PORTFOLIO OF INVESTMENTS 3,265,286 96.72 96.90
Cash and bank balances 111,883 3.31 3.12
Creditors (1,259) (0.04) (0.02)
NET ASSET VALUE AS AT 30/09/2014 3,375,910 100.00 100.00
INVESTMENT SOLUTIONS STRATEGIC GLOBAL FUND
10
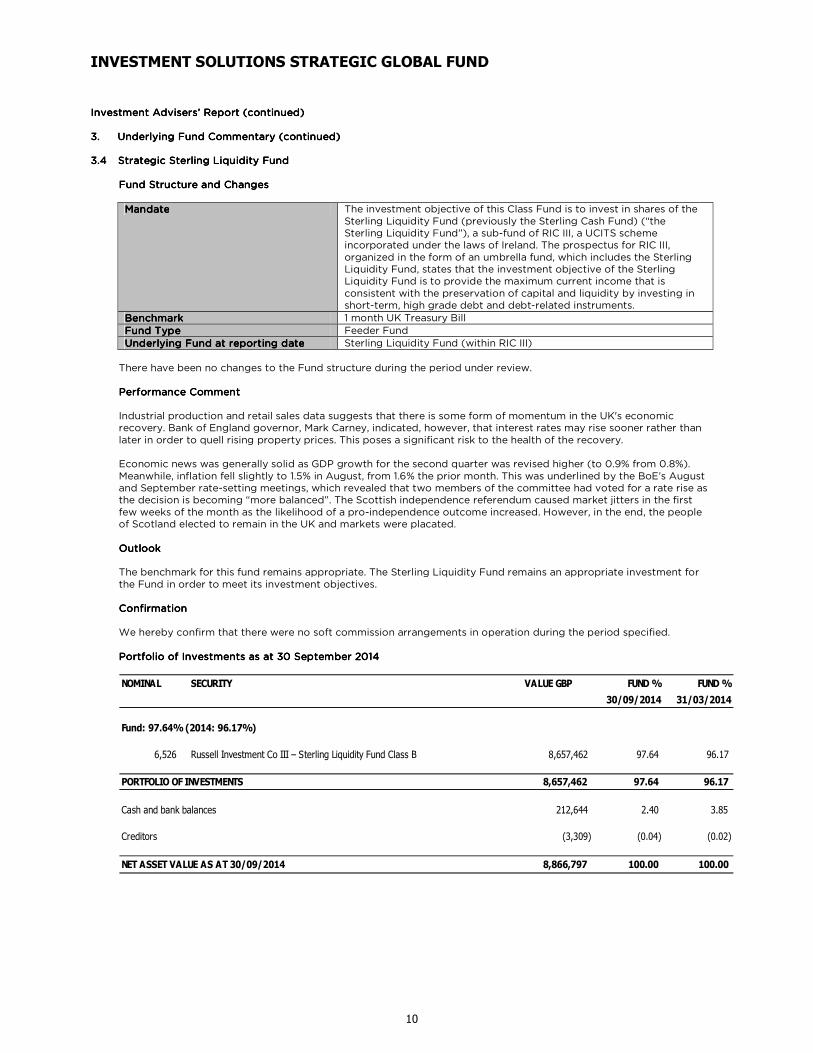
InvestmeInvestmeInvestmeInvestment Advisers’ Report (continued)nt Advisers’ Report (continued)nt Advisers’ Report (continued)nt Advisers’ Report (continued) 3.3.3.3. Underlying Fund Commentary (continued)Underlying Fund Commentary (continued)Underlying Fund Commentary (continued)Underlying Fund Commentary (continued) 3.3.3.3.4444 Strategic Sterling Liquidity FundStrategic Sterling Liquidity FundStrategic Sterling Liquidity FundStrategic Sterling Liquidity Fund
Fund Structure and ChangesFund Structure and ChangesFund Structure and ChangesFund Structure and Changes
MandateMandateMandateMandate The investment objective of this Class Fund is to invest in shares of the Sterling Liquidity Fund (previously the Sterling Cash Fund) (“the Sterling Liquidity Fund”), a sub-fund of RIC III, a UCITS scheme incorporated under the laws of Ireland. The prospectus for RIC III, organized in the form of an umbrella fund, which includes the Sterling Liquidity Fund, states that the investment objective of the Sterling Liquidity Fund is to provide the maximum current income that is consistent with the preservation of capital and liquidity by investing in short-term, high grade debt and debt-related instruments.
BenchmarkBenchmarkBenchmarkBenchmark 1 month UK Treasury Bill
Fund TypeFund TypeFund TypeFund Type Feeder Fund
Underlying Fund at reporting dateUnderlying Fund at reporting dateUnderlying Fund at reporting dateUnderlying Fund at reporting date Sterling Liquidity Fund (within RIC III)
There have been no changes to the Fund structure during the period under review. Performance CommentPerformance CommentPerformance CommentPerformance Comment Industrial production and retail sales data suggests that there is some form of momentum in the UK's economic recovery. Bank of England governor, Mark Carney, indicated, however, that interest rates may rise sooner rather than later in order to quell rising property prices. This poses a significant risk to the health of the recovery. Economic news was generally solid as GDP growth for the second quarter was revised higher (to 0.9% from 0.8%). Meanwhile, inflation fell slightly to 1.5% in August, from 1.6% the prior month. This was underlined by the BoE’s August and September rate-setting meetings, which revealed that two members of the committee had voted for a rate rise as the decision is becoming “more balanced”. The Scottish independence referendum caused market jitters in the first few weeks of the month as the likelihood of a pro-independence outcome increased. However, in the end, the people of Scotland elected to remain in the UK and markets were placated. OutlookOutlookOutlookOutlook The benchmark for this fund remains appropriate. The Sterling Liquidity Fund remains an appropriate investment for the Fund in order to meet its investment objectives. ConfirmationConfirmationConfirmationConfirmation We hereby confirm that there were no soft commission arrangements in operation during the period specified. Portfolio of InvPortfolio of InvPortfolio of InvPortfolio of Investments as at 30 September 2014estments as at 30 September 2014estments as at 30 September 2014estments as at 30 September 2014
NOMINAL SECURITY VALUE GBP FUND % FUND %
30/09/2014 31/03/2014
Fund: 97.64% (2014: 96.17%)
6,526 Russell Investment Co III – Sterling Liquidity Fund Class B 8,657,462 97.64 96.17
PORTFOLIO OF INVESTMENTS 8,657,462 97.64 96.17
Cash and bank balances 212,644 2.40 3.85
Creditors (3,309) (0.04) (0.02)
NET ASSET VALUE AS AT 30/09/2014 8,866,797 100.00 100.00
INVESTMENT SOLUTIONS STRATEGIC GLOBAL FUND
11
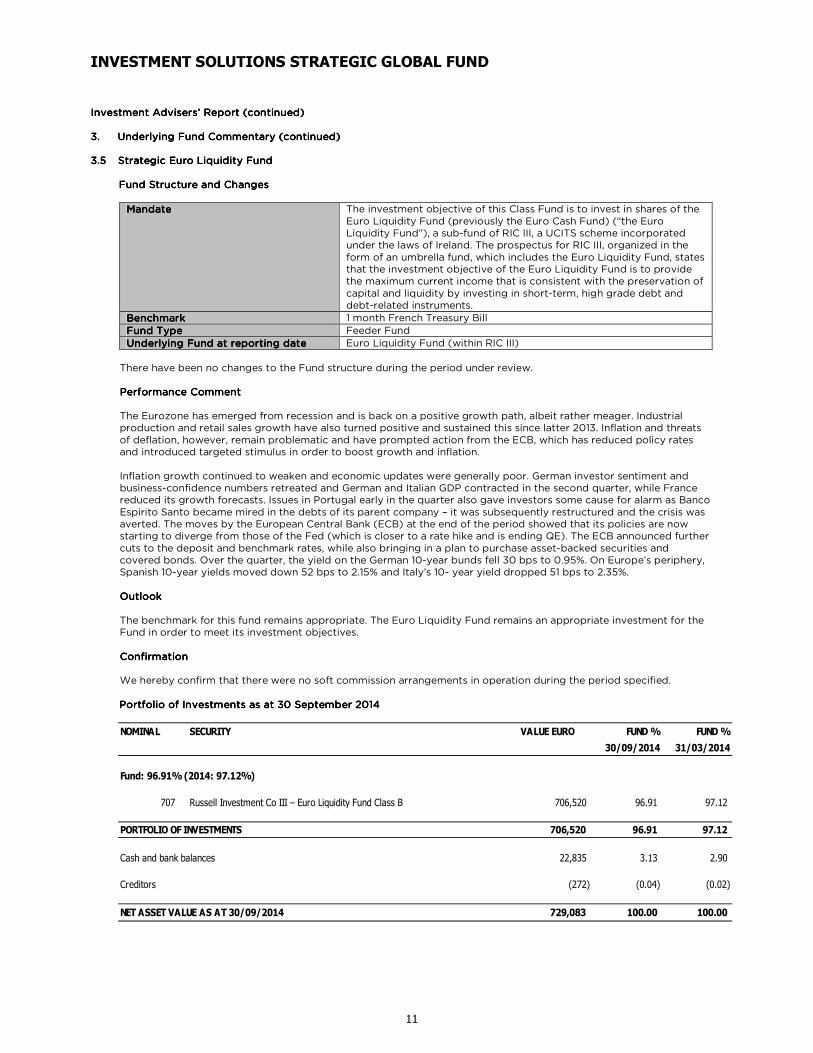
Investment Advisers’ Report (continued)Investment Advisers’ Report (continued)Investment Advisers’ Report (continued)Investment Advisers’ Report (continued) 3.3.3.3. Underlying Fund Commentary (continued)Underlying Fund Commentary (continued)Underlying Fund Commentary (continued)Underlying Fund Commentary (continued) 3.3.3.3.5555 Strategic Euro Liquidity FundStrategic Euro Liquidity FundStrategic Euro Liquidity FundStrategic Euro Liquidity Fund Fund Structure and ChangesFund Structure and ChangesFund Structure and ChangesFund Structure and Changes
MandateMandateMandateMandate The investment objective of this Class Fund is to invest in shares of the Euro Liquidity Fund (previously the Euro Cash Fund) (“the Euro Liquidity Fund”), a sub-fund of RIC III, a UCITS scheme incorporated under the laws of Ireland. The prospectus for RIC III, organized in the form of an umbrella fund, which includes the Euro Liquidity Fund, states that the investment objective of the Euro Liquidity Fund is to provide the maximum current income that is consistent with the preservation of capital and liquidity by investing in short-term, high grade debt and debt-related instruments.
BenchmarkBenchmarkBenchmarkBenchmark 1 month French Treasury Bill
Fund TypeFund TypeFund TypeFund Type Feeder Fund
Underlying Fund at reporting dateUnderlying Fund at reporting dateUnderlying Fund at reporting dateUnderlying Fund at reporting date Euro Liquidity Fund (within RIC III)
There have been no changes to the Fund structure during the period under review. PerPerPerPerformance Commentformance Commentformance Commentformance Comment The Eurozone has emerged from recession and is back on a positive growth path, albeit rather meager. Industrial production and retail sales growth have also turned positive and sustained this since latter 2013. Inflation and threats of deflation, however, remain problematic and have prompted action from the ECB, which has reduced policy rates and introduced targeted stimulus in order to boost growth and inflation. Inflation growth continued to weaken and economic updates were generally poor. German investor sentiment and business-confidence numbers retreated and German and Italian GDP contracted in the second quarter, while France reduced its growth forecasts. Issues in Portugal early in the quarter also gave investors some cause for alarm as Banco Espirito Santo became mired in the debts of its parent company – it was subsequently restructured and the crisis was averted. The moves by the European Central Bank (ECB) at the end of the period showed that its policies are now starting to diverge from those of the Fed (which is closer to a rate hike and is ending QE). The ECB announced further cuts to the deposit and benchmark rates, while also bringing in a plan to purchase asset-backed securities and covered bonds. Over the quarter, the yield on the German 10-year bunds fell 30 bps to 0.95%. On Europe’s periphery, Spanish 10-year yields moved down 52 bps to 2.15% and Italy’s 10- year yield dropped 51 bps to 2.35%. OutlookOutlookOutlookOutlook The benchmark for this fund remains appropriate. The Euro Liquidity Fund remains an appropriate investment for the Fund in order to meet its investment objectives. ConfirmationConfirmationConfirmationConfirmation We hereby confirm that there were no soft commission arrangements in operation during the period specified.
Portfolio of Investments as at Portfolio of Investments as at Portfolio of Investments as at Portfolio of Investments as at 30 S30 S30 S30 September 2014eptember 2014eptember 2014eptember 2014
NOMINAL SECURITY VALUE EURO FUND % FUND %
30/09/2014 31/03/2014
Fund: 96.91% (2014: 97.12%)
707 Russell Investment Co III – Euro Liquidity Fund Class B 706,520 96.91 97.12
PORTFOLIO OF INVESTMENTS 706,520 96.91 97.12
Cash and bank balances 22,835 3.13 2.90
Creditors (272) (0.04) (0.02)
NET ASSET VALUE AS AT 30/09/2014 729,083 100.00 100.00
INVESTMENT SOLUTIONS STRATEGIC GLOBAL FUND
12
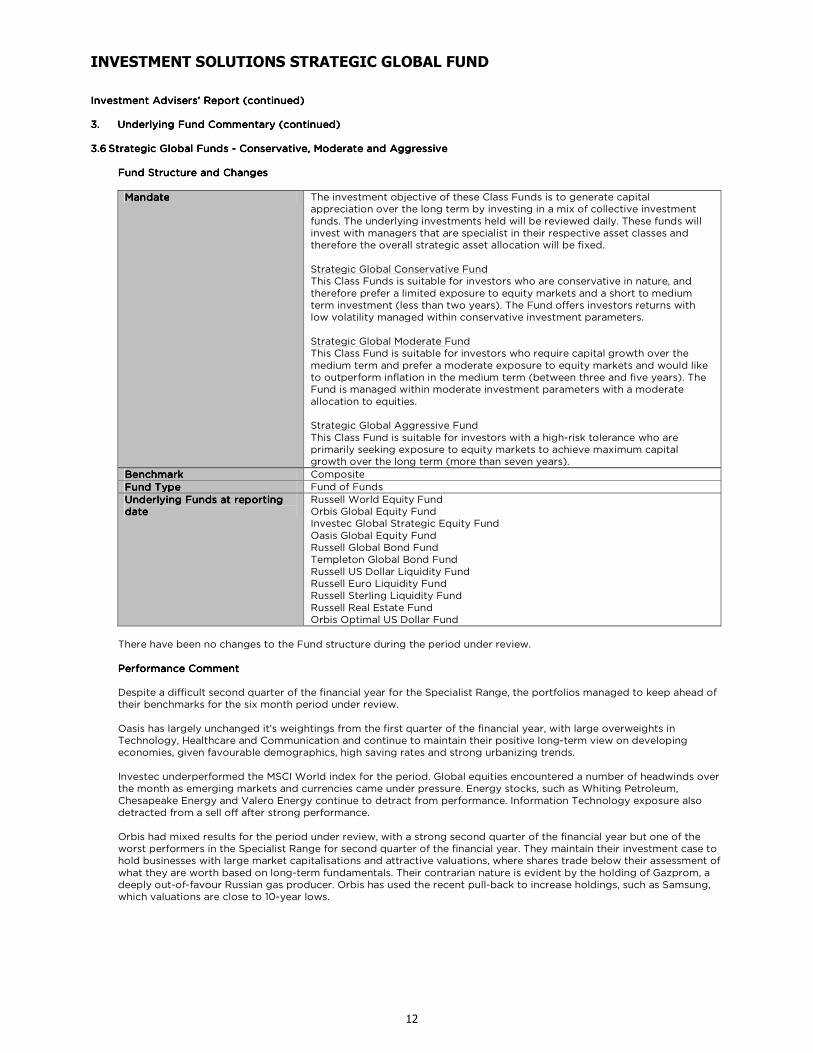
Investment Advisers’ Report (continued)Investment Advisers’ Report (continued)Investment Advisers’ Report (continued)Investment Advisers’ Report (continued) 3.3.3.3. Underlying Fund Commentary (continued)Underlying Fund Commentary (continued)Underlying Fund Commentary (continued)Underlying Fund Commentary (continued) 3333....6666 Strategic Global FundsStrategic Global FundsStrategic Global FundsStrategic Global Funds ---- Conservative, Moderate and AggressiveConservative, Moderate and AggressiveConservative, Moderate and AggressiveConservative, Moderate and Aggressive Fund Structure and ChangesFund Structure and ChangesFund Structure and ChangesFund Structure and Changes
MandateMandateMandateMandate The investment objective of these Class Funds is to generate capital appreciation over the long term by investing in a mix of collective investment funds. The underlying investments held will be reviewed daily. These funds will invest with managers that are specialist in their respective asset classes and therefore the overall strategic asset allocation will be fixed. Strategic Global Conservative Fund This Class Funds is suitable for investors who are conservative in nature, and therefore prefer a limited exposure to equity markets and a short to medium term investment (less than two years). The Fund offers investors returns with low volatility managed within conservative investment parameters. Strategic Global Moderate Fund This Class Fund is suitable for investors who require capital growth over the medium term and prefer a moderate exposure to equity markets and would like to outperform inflation in the medium term (between three and five years). The Fund is managed within moderate investment parameters with a moderate allocation to equities. Strategic Global Aggressive Fund This Class Fund is suitable for investors with a high-risk tolerance who are primarily seeking exposure to equity markets to achieve maximum capital growth over the long term (more than seven years).
BenchmarkBenchmarkBenchmarkBenchmark Composite
Fund TypeFund TypeFund TypeFund Type Fund of Funds
Underlying Funds at reporting Underlying Funds at reporting Underlying Funds at reporting Underlying Funds at reporting datedatedatedate
Russell World Equity Fund Orbis Global Equity Fund Investec Global Strategic Equity Fund Oasis Global Equity Fund Russell Global Bond Fund Templeton Global Bond Fund Russell US Dollar Liquidity Fund Russell Euro Liquidity Fund Russell Sterling Liquidity Fund Russell Real Estate Fund Orbis Optimal US Dollar Fund
There have been no changes to the Fund structure during the period under review. Performance CommentPerformance CommentPerformance CommentPerformance Comment Despite a difficult second quarter of the financial year for the Specialist Range, the portfolios managed to keep ahead of their benchmarks for the six month period under review. Oasis has largely unchanged it’s weightings from the first quarter of the financial year, with large overweights in Technology, Healthcare and Communication and continue to maintain their positive long-term view on developing economies, given favourable demographics, high saving rates and strong urbanizing trends. Investec underperformed the MSCI World index for the period. Global equities encountered a number of headwinds over the month as emerging markets and currencies came under pressure. Energy stocks, such as Whiting Petroleum, Chesapeake Energy and Valero Energy continue to detract from performance. Information Technology exposure also detracted from a sell off after strong performance. Orbis had mixed results for the period under review, with a strong second quarter of the financial year but one of the worst performers in the Specialist Range for second quarter of the financial year. They maintain their investment case to hold businesses with large market capitalisations and attractive valuations, where shares trade below their assessment of what they are worth based on long-term fundamentals. Their contrarian nature is evident by the holding of Gazprom, a deeply out-of-favour Russian gas producer. Orbis has used the recent pull-back to increase holdings, such as Samsung, which valuations are close to 10-year lows.
INVESTMENT SOLUTIONS STRATEGIC GLOBAL FUND
13
Investment Advisers’ Report (contInvestment Advisers’ Report (contInvestment Advisers’ Report (contInvestment Advisers’ Report (continued)inued)inued)inued) 3.3.3.3. Underlying Fund Commentary (continued)Underlying Fund Commentary (continued)Underlying Fund Commentary (continued)Underlying Fund Commentary (continued) 3.63.63.63.6 Strategic Global Funds Strategic Global Funds Strategic Global Funds Strategic Global Funds ---- Conservative, Moderate and Aggressive (continued)Conservative, Moderate and Aggressive (continued)Conservative, Moderate and Aggressive (continued)Conservative, Moderate and Aggressive (continued)
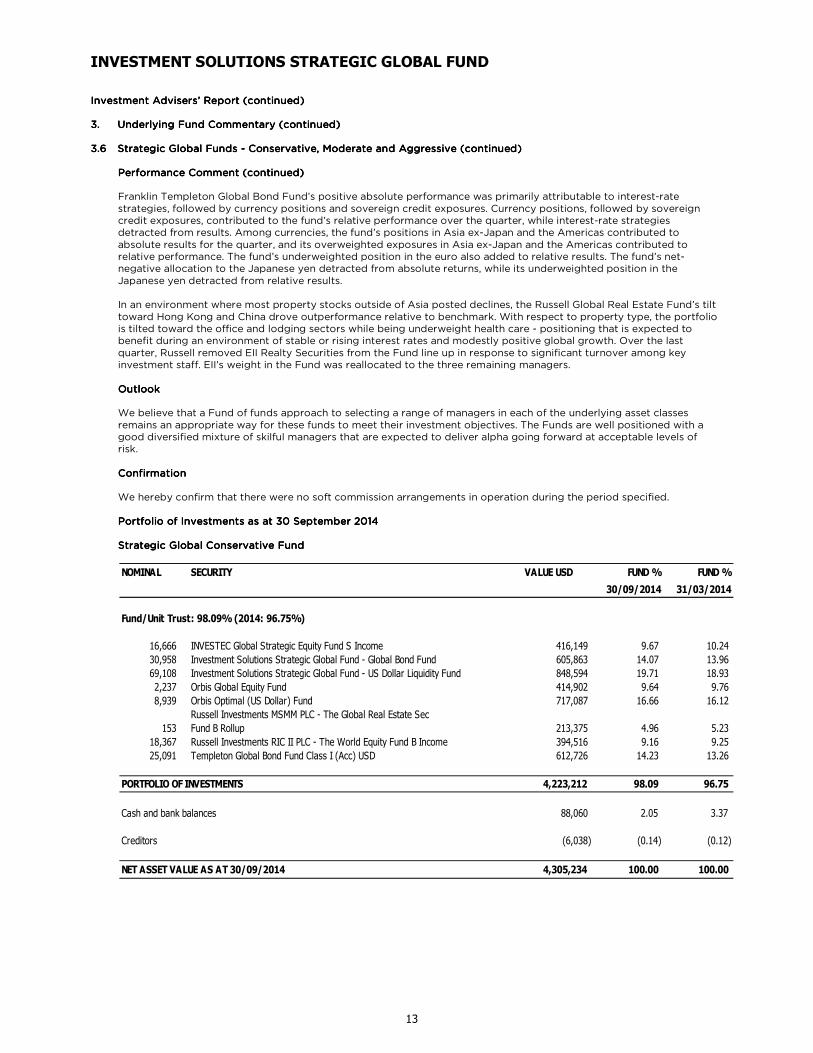
Performance Comment (continued)Performance Comment (continued)Performance Comment (continued)Performance Comment (continued) Franklin Templeton Global Bond Fund’s positive absolute performance was primarily attributable to interest-rate strategies, followed by currency positions and sovereign credit exposures. Currency positions, followed by sovereign credit exposures, contributed to the fund’s relative performance over the quarter, while interest-rate strategies detracted from results. Among currencies, the fund’s positions in Asia ex-Japan and the Americas contributed to absolute results for the quarter, and its overweighted exposures in Asia ex-Japan and the Americas contributed to relative performance. The fund’s underweighted position in the euro also added to relative results. The fund’s net-negative allocation to the Japanese yen detracted from absolute returns, while its underweighted position in the Japanese yen detracted from relative results. In an environment where most property stocks outside of Asia posted declines, the Russell Global Real Estate Fund’s tilt toward Hong Kong and China drove outperformance relative to benchmark. With respect to property type, the portfolio is tilted toward the office and lodging sectors while being underweight health care - positioning that is expected to benefit during an environment of stable or rising interest rates and modestly positive global growth. Over the last quarter, Russell removed EII Realty Securities from the Fund line up in response to significant turnover among key investment staff. EII’s weight in the Fund was reallocated to the three remaining managers. OutlookOutlookOutlookOutlook We believe that a Fund of funds approach to selecting a range of managers in each of the underlying asset classes remains an appropriate way for these funds to meet their investment objectives. The Funds are well positioned with a good diversified mixture of skilful managers that are expected to deliver alpha going forward at acceptable levels of risk. ConfirmationConfirmationConfirmationConfirmation We hereby confirm that there were no soft commission arrangements in operation during the period specified.
Portfolio of Investments as at 30 September 2014Portfolio of Investments as at 30 September 2014Portfolio of Investments as at 30 September 2014Portfolio of Investments as at 30 September 2014 Strategic Global Conservative FundStrategic Global Conservative FundStrategic Global Conservative FundStrategic Global Conservative Fund
NOMINAL SECURITY VALUE USD FUND % FUND %
30/09/2014 31/03/2014
Fund/Unit Trust: 98.09% (2014: 96.75%)
16,666 INVESTEC Global Strategic Equity Fund S Income 416,149 9.67 10.24
30,958 Investment Solutions Strategic Global Fund - Global Bond Fund 605,863 14.07 13.96
69,108 Investment Solutions Strategic Global Fund - US Dollar Liquidity Fund 848,594 19.71 18.93
2,237 Orbis Global Equity Fund 414,902 9.64 9.76
8,939 Orbis Optimal (US Dollar) Fund 717,087 16.66 16.12
153
Russell Investments MSMM PLC - The Global Real Estate Sec
Fund B Rollup 213,375 4.96 5.23
18,367 Russell Investments RIC II PLC - The World Equity Fund B Income 394,516 9.16 9.25
25,091 Templeton Global Bond Fund Class I (Acc) USD 612,726 14.23 13.26
PORTFOLIO OF INVESTMENTS 4,223,212 98.09 96.75
Cash and bank balances 88,060 2.05 3.37
Creditors (6,038) (0.14) (0.12)
NET ASSET VALUE AS AT 30/09/2014 4,305,234 100.00 100.00
INVESTMENT SOLUTIONS STRATEGIC GLOBAL FUND
14
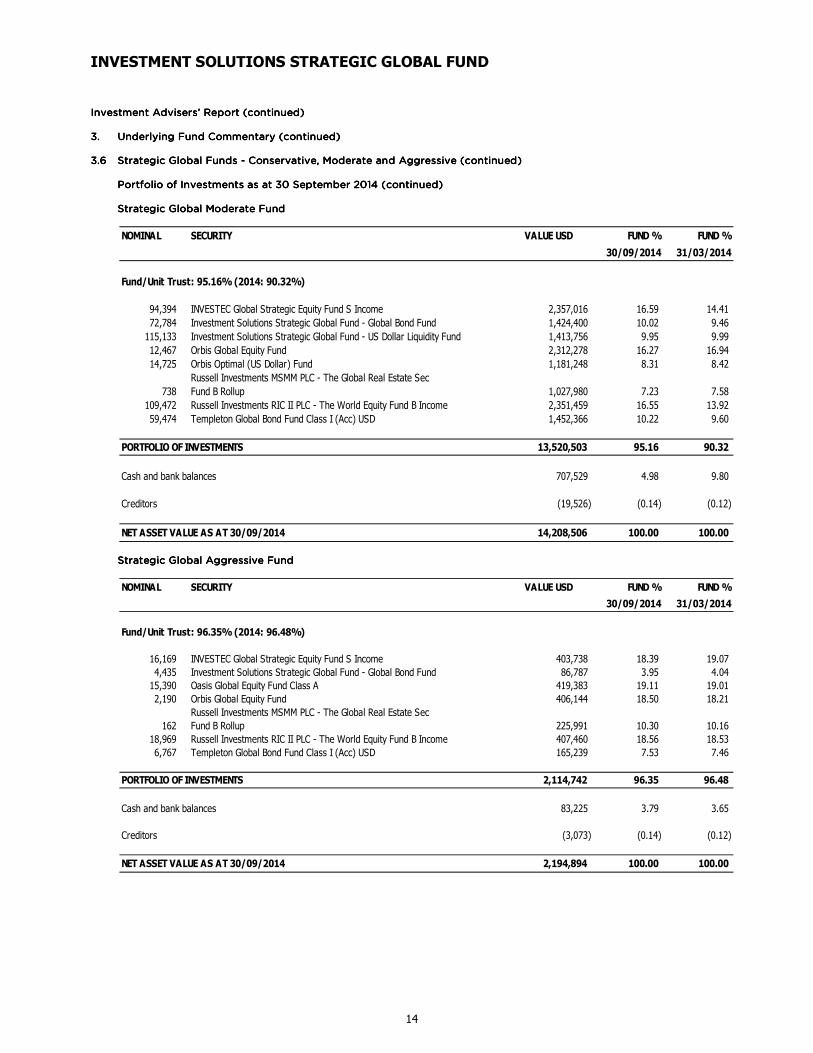
Investment Advisers’ Report (continInvestment Advisers’ Report (continInvestment Advisers’ Report (continInvestment Advisers’ Report (continued)ued)ued)ued) 3.3.3.3. Underlying Fund Commentary (continued)Underlying Fund Commentary (continued)Underlying Fund Commentary (continued)Underlying Fund Commentary (continued) 3.63.63.63.6 Strategic Global Funds Strategic Global Funds Strategic Global Funds Strategic Global Funds ---- Conservative, Moderate and Aggressive (continued)Conservative, Moderate and Aggressive (continued)Conservative, Moderate and Aggressive (continued)Conservative, Moderate and Aggressive (continued) Portfolio of Investments as at 30 September 2014 (continued)Portfolio of Investments as at 30 September 2014 (continued)Portfolio of Investments as at 30 September 2014 (continued)Portfolio of Investments as at 30 September 2014 (continued)
Strategic Global Moderate Strategic Global Moderate Strategic Global Moderate Strategic Global Moderate FundFundFundFund
Strategic Global Aggressive Strategic Global Aggressive Strategic Global Aggressive Strategic Global Aggressive FFFFundundundund
NOMINAL SECURITY VALUE USD FUND % FUND %
30/09/2014 31/03/2014
Fund/Unit Trust: 95.16% (2014: 90.32%)
94,394 INVESTEC Global Strategic Equity Fund S Income 2,357,016 16.59 14.41
72,784 Investment Solutions Strategic Global Fund - Global Bond Fund 1,424,400 10.02 9.46
115,133 Investment Solutions Strategic Global Fund - US Dollar Liquidity Fund 1,413,756 9.95 9.99
12,467 Orbis Global Equity Fund 2,312,278 16.27 16.94
14,725 Orbis Optimal (US Dollar) Fund 1,181,248 8.31 8.42
738
Russell Investments MSMM PLC - The Global Real Estate Sec
Fund B Rollup 1,027,980 7.23 7.58
109,472 Russell Investments RIC II PLC - The World Equity Fund B Income 2,351,459 16.55 13.92
59,474 Templeton Global Bond Fund Class I (Acc) USD 1,452,366 10.22 9.60
PORTFOLIO OF INVESTMENTS 13,520,503 95.16 90.32
Cash and bank balances 707,529 4.98 9.80
Creditors (19,526) (0.14) (0.12)
NET ASSET VALUE AS AT 30/09/2014 14,208,506 100.00 100.00
NOMINAL SECURITY VALUE USD FUND % FUND %
30/09/2014 31/03/2014
Fund/Unit Trust: 96.35% (2014: 96.48%)
16,169 INVESTEC Global Strategic Equity Fund S Income 403,738 18.39 19.07
4,435 Investment Solutions Strategic Global Fund - Global Bond Fund 86,787 3.95 4.04
15,390 Oasis Global Equity Fund Class A 419,383 19.11 19.01
2,190 Orbis Global Equity Fund 406,144 18.50 18.21
162
Russell Investments MSMM PLC - The Global Real Estate Sec
Fund B Rollup 225,991 10.30 10.16
18,969 Russell Investments RIC II PLC - The World Equity Fund B Income 407,460 18.56 18.53
6,767 Templeton Global Bond Fund Class I (Acc) USD 165,239 7.53 7.46
PORTFOLIO OF INVESTMENTS 2,114,742 96.35 96.48
Cash and bank balances 83,225 3.79 3.65
Creditors (3,073) (0.14) (0.12)
NET ASSET VALUE AS AT 30/09/2014 2,194,894 100.00 100.00
INVESTMENT SOLUTIONS STRATEGIC GLOBAL FUND
15
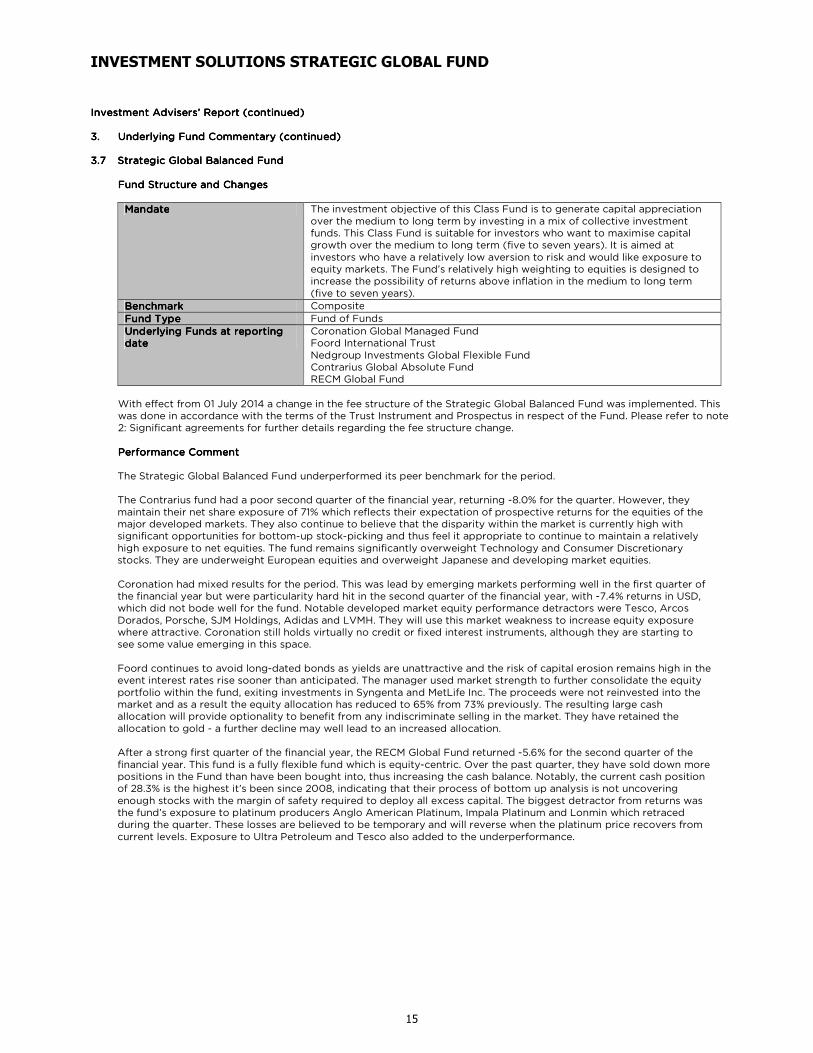
Investment Advisers’ Report (continued)Investment Advisers’ Report (continued)Investment Advisers’ Report (continued)Investment Advisers’ Report (continued) 3.3.3.3. Underlying Fund Commentary (continued)Underlying Fund Commentary (continued)Underlying Fund Commentary (continued)Underlying Fund Commentary (continued)
3.73.73.73.7 Strategic Global Balanced FundStrategic Global Balanced FundStrategic Global Balanced FundStrategic Global Balanced Fund
Fund Structure and ChangesFund Structure and ChangesFund Structure and ChangesFund Structure and Changes
MandateMandateMandateMandate The investment objective of this Class Fund is to generate capital appreciation over the medium to long term by investing in a mix of collective investment funds. This Class Fund is suitable for investors who want to maximise capital growth over the medium to long term (five to seven years). It is aimed at investors who have a relatively low aversion to risk and would like exposure to equity markets. The Fund’s relatively high weighting to equities is designed to increase the possibility of returns above inflation in the medium to long term (five to seven years).
BenchmarkBenchmarkBenchmarkBenchmark Composite
Fund TypeFund TypeFund TypeFund Type Fund of Funds
Underlying Funds at reporting Underlying Funds at reporting Underlying Funds at reporting Underlying Funds at reporting datedatedatedate
Coronation Global Managed Fund Foord International Trust Nedgroup Investments Global Flexible Fund Contrarius Global Absolute Fund RECM Global Fund
With effect from 01 July 2014 a change in the fee structure of the Strategic Global Balanced Fund was implemented. This was done in accordance with the terms of the Trust Instrument and Prospectus in respect of the Fund. Please refer to note 2: Significant agreements for further details regarding the fee structure change. Performance CommentPerformance CommentPerformance CommentPerformance Comment
The Strategic Global Balanced Fund underperformed its peer benchmark for the period. The Contrarius fund had a poor second quarter of the financial year, returning -8.0% for the quarter. However, they maintain their net share exposure of 71% which reflects their expectation of prospective returns for the equities of the major developed markets. They also continue to believe that the disparity within the market is currently high with significant opportunities for bottom-up stock-picking and thus feel it appropriate to continue to maintain a relatively high exposure to net equities. The fund remains significantly overweight Technology and Consumer Discretionary stocks. They are underweight European equities and overweight Japanese and developing market equities. Coronation had mixed results for the period. This was lead by emerging markets performing well in the first quarter of the financial year but were particularity hard hit in the second quarter of the financial year, with -7.4% returns in USD, which did not bode well for the fund. Notable developed market equity performance detractors were Tesco, Arcos Dorados, Porsche, SJM Holdings, Adidas and LVMH. They will use this market weakness to increase equity exposure where attractive. Coronation still holds virtually no credit or fixed interest instruments, although they are starting to see some value emerging in this space. Foord continues to avoid long-dated bonds as yields are unattractive and the risk of capital erosion remains high in the event interest rates rise sooner than anticipated. The manager used market strength to further consolidate the equity portfolio within the fund, exiting investments in Syngenta and MetLife Inc. The proceeds were not reinvested into the market and as a result the equity allocation has reduced to 65% from 73% previously. The resulting large cash allocation will provide optionality to benefit from any indiscriminate selling in the market. They have retained the allocation to gold - a further decline may well lead to an increased allocation. After a strong first quarter of the financial year, the RECM Global Fund returned -5.6% for the second quarter of the financial year. This fund is a fully flexible fund which is equity-centric. Over the past quarter, they have sold down more positions in the Fund than have been bought into, thus increasing the cash balance. Notably, the current cash position of 28.3% is the highest it’s been since 2008, indicating that their process of bottom up analysis is not uncovering enough stocks with the margin of safety required to deploy all excess capital. The biggest detractor from returns was the fund’s exposure to platinum producers Anglo American Platinum, Impala Platinum and Lonmin which retraced during the quarter. These losses are believed to be temporary and will reverse when the platinum price recovers from current levels. Exposure to Ultra Petroleum and Tesco also added to the underperformance.
INVESTMENT SOLUTIONS STRATEGIC GLOBAL FUND
16
Investment Advisers’ Report (continued)Investment Advisers’ Report (continued)Investment Advisers’ Report (continued)Investment Advisers’ Report (continued) 3.3.3.3. UnderlyinUnderlyinUnderlyinUnderlying Fund Commentary (continued)g Fund Commentary (continued)g Fund Commentary (continued)g Fund Commentary (continued)
3.73.73.73.7 Strategic Global Balanced Fund (continued)Strategic Global Balanced Fund (continued)Strategic Global Balanced Fund (continued)Strategic Global Balanced Fund (continued)
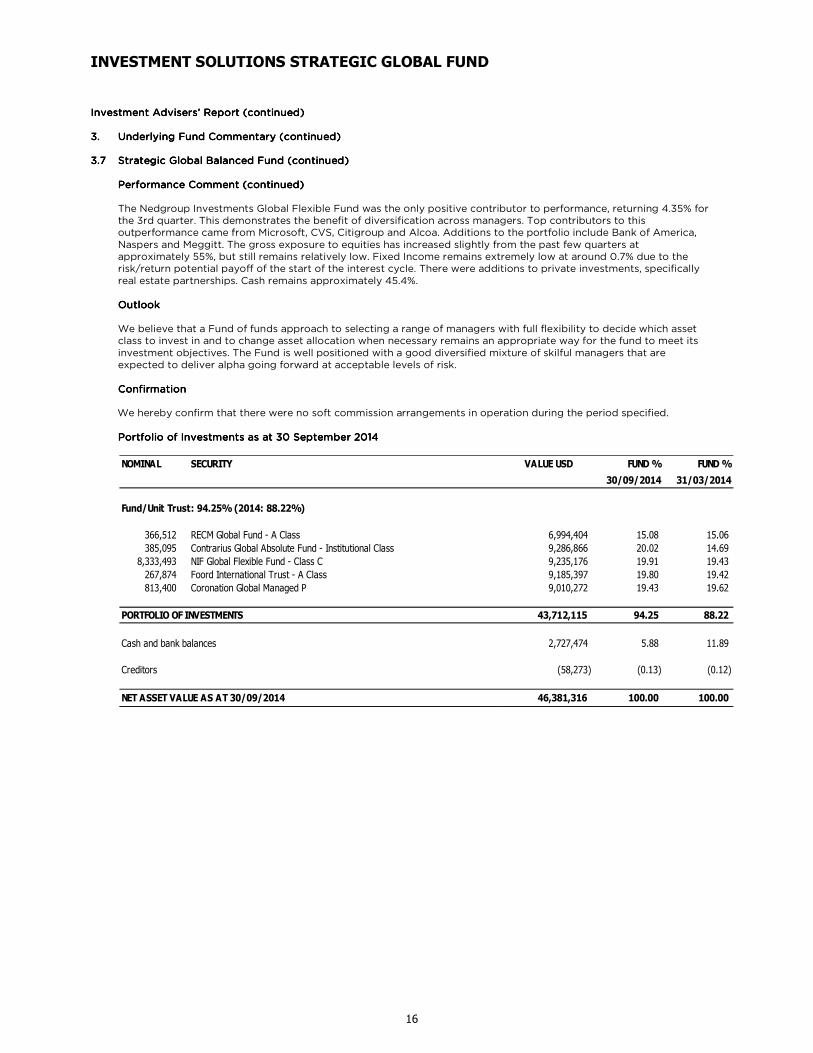
Performance Comment (continued)Performance Comment (continued)Performance Comment (continued)Performance Comment (continued) The Nedgroup Investments Global Flexible Fund was the only positive contributor to performance, returning 4.35% for the 3rd quarter. This demonstrates the benefit of diversification across managers. Top contributors to this outperformance came from Microsoft, CVS, Citigroup and Alcoa. Additions to the portfolio include Bank of America, Naspers and Meggitt. The gross exposure to equities has increased slightly from the past few quarters at approximately 55%, but still remains relatively low. Fixed Income remains extremely low at around 0.7% due to the risk/return potential payoff of the start of the interest cycle. There were additions to private investments, specifically real estate partnerships. Cash remains approximately 45.4%. OutlookOutlookOutlookOutlook We believe that a Fund of funds approach to selecting a range of managers with full flexibility to decide which asset class to invest in and to change asset allocation when necessary remains an appropriate way for the fund to meet its investment objectives. The Fund is well positioned with a good diversified mixture of skilful managers that are expected to deliver alpha going forward at acceptable levels of risk. ConfConfConfConfirmationirmationirmationirmation We hereby confirm that there were no soft commission arrangements in operation during the period specified. Portfolio of Investments as at Portfolio of Investments as at Portfolio of Investments as at Portfolio of Investments as at 30 September 201430 September 201430 September 201430 September 2014
NOMINAL SECURITY VALUE USD FUND % FUND %
30/09/2014 31/03/2014
Fund/Unit Trust: 94.25% (2014: 88.22%)
366,512 RECM Global Fund - A Class 6,994,404 15.08 15.06
385,095 Contrarius Global Absolute Fund - Institutional Class 9,286,866 20.02 14.69
8,333,493 NIF Global Flexible Fund - Class C 9,235,176 19.91 19.43
267,874 Foord International Trust - A Class 9,185,397 19.80 19.42
813,400 Coronation Global Managed P 9,010,272 19.43 19.62
PORTFOLIO OF INVESTMENTS 43,712,115 94.25 88.22
Cash and bank balances 2,727,474 5.88 11.89
Creditors (58,273) (0.13) (0.12)
NET ASSET VALUE AS AT 30/09/2014 46,381,316 100.00 100.00
INVESTMENT SOLUTIONS STRATEGIC GLOBAL FUND
17
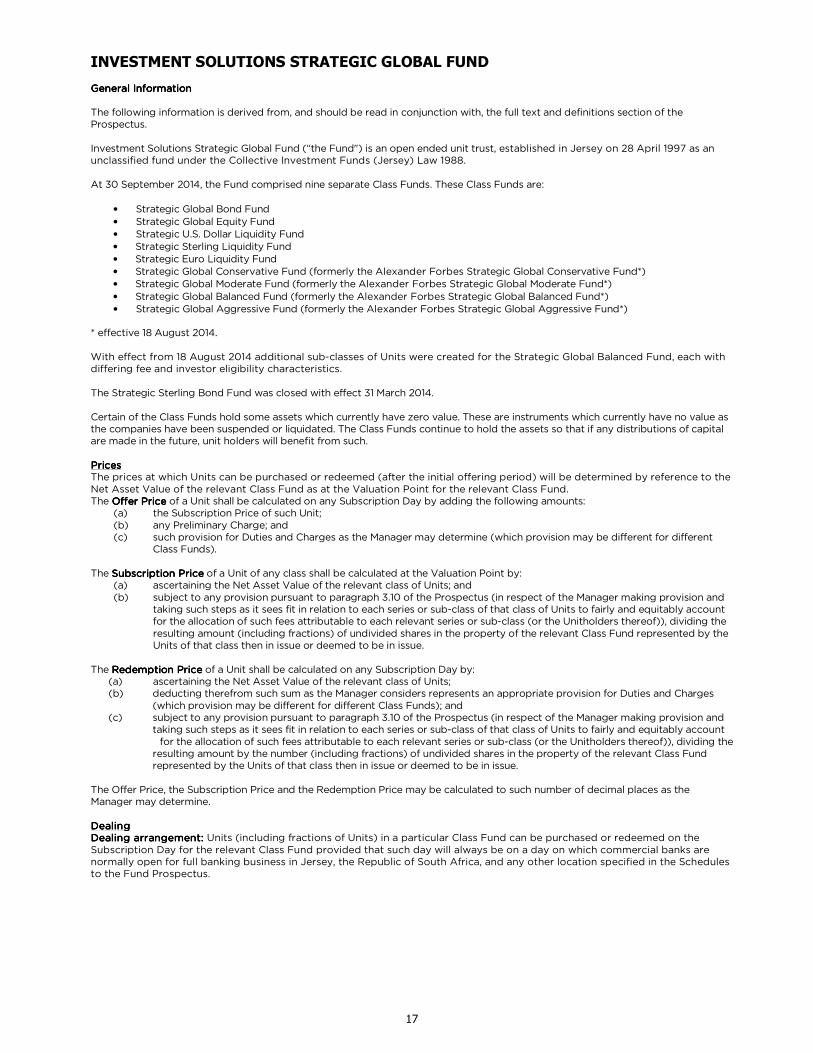
General InformationGeneral InformationGeneral InformationGeneral Information The following information is derived from, and should be read in conjunction with, the full text and definitions section of the Prospectus. Investment Solutions Strategic Global Fund (“the Fund") is an open ended unit trust, established in Jersey on 28 April 1997 as an unclassified fund under the Collective Investment Funds (Jersey) Law 1988. At 30 September 2014, the Fund comprised nine separate Class Funds. These Class Funds are:
• Strategic Global Bond Fund
• Strategic Global Equity Fund • Strategic U.S. Dollar Liquidity Fund • Strategic Sterling Liquidity Fund • Strategic Euro Liquidity Fund • Strategic Global Conservative Fund (formerly the Alexander Forbes Strategic Global Conservative Fund*) • Strategic Global Moderate Fund (formerly the Alexander Forbes Strategic Global Moderate Fund*)
• Strategic Global Balanced Fund (formerly the Alexander Forbes Strategic Global Balanced Fund*) • Strategic Global Aggressive Fund (formerly the Alexander Forbes Strategic Global Aggressive Fund*)
* effective 18 August 2014. With effect from 18 August 2014 additional sub-classes of Units were created for the Strategic Global Balanced Fund, each with differing fee and investor eligibility characteristics. The Strategic Sterling Bond Fund was closed with effect 31 March 2014. Certain of the Class Funds hold some assets which currently have zero value. These are instruments which currently have no value as the companies have been suspended or liquidated. The Class Funds continue to hold the assets so that if any distributions of capital are made in the future, unit holders will benefit from such. PPPPricesricesricesrices The prices at which Units can be purchased or redeemed (after the initial offering period) will be determined by reference to the Net Asset Value of the relevant Class Fund as at the Valuation Point for the relevant Class Fund. The Offer Offer Offer Offer PricePricePricePrice of a Unit shall be calculated on any Subscription Day by adding the following amounts: (a) the Subscription Price of such Unit; (b) any Preliminary Charge; and (c) such provision for Duties and Charges as the Manager may determine (which provision may be different for different
Class Funds). The Subscription PriceSubscription PriceSubscription PriceSubscription Price of a Unit of any class shall be calculated at the Valuation Point by:
(a) ascertaining the Net Asset Value of the relevant class of Units; and (b) subject to any provision pursuant to paragraph 3.10 of the Prospectus (in respect of the Manager making provision and
taking such steps as it sees fit in relation to each series or sub-class of that class of Units to fairly and equitably account for the allocation of such fees attributable to each relevant series or sub-class (or the Unitholders thereof)), dividing the resulting amount (including fractions) of undivided shares in the property of the relevant Class Fund represented by the Units of that class then in issue or deemed to be in issue.
The Redemption PriceRedemption PriceRedemption PriceRedemption Price of a Unit shall be calculated on any Subscription Day by:
(a) ascertaining the Net Asset Value of the relevant class of Units; (b) deducting therefrom such sum as the Manager considers represents an appropriate provision for Duties and Charges
(which provision may be different for different Class Funds); and (c) subject to any provision pursuant to paragraph 3.10 of the Prospectus (in respect of the Manager making provision and
taking such steps as it sees fit in relation to each series or sub-class of that class of Units to fairly and equitably account for the allocation of such fees attributable to each relevant series or sub-class (or the Unitholders thereof)), dividing the resulting amount by the number (including fractions) of undivided shares in the property of the relevant Class Fund represented by the Units of that class then in issue or deemed to be in issue.
The Offer Price, the Subscription Price and the Redemption Price may be calculated to such number of decimal places as the Manager may determine. DDDDealingealingealingealing Dealing arrangement:Dealing arrangement:Dealing arrangement:Dealing arrangement: Units (including fractions of Units) in a particular Class Fund can be purchased or redeemed on the Subscription Day for the relevant Class Fund provided that such day will always be on a day on which commercial banks are normally open for full banking business in Jersey, the Republic of South Africa, and any other location specified in the Schedules to the Fund Prospectus.
INVESTMENT SOLUTIONS STRATEGIC GLOBAL FUND
18
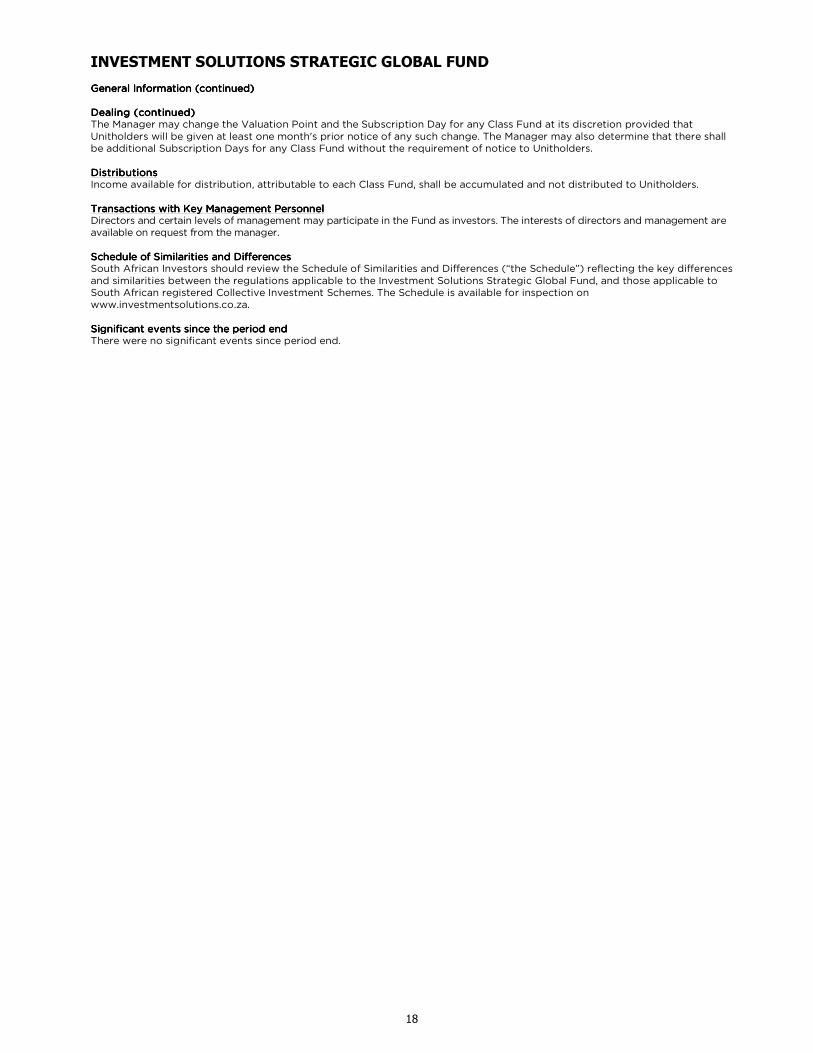
General Information (continued)General Information (continued)General Information (continued)General Information (continued) Dealing (continued)Dealing (continued)Dealing (continued)Dealing (continued) The Manager may change the Valuation Point and the Subscription Day for any Class Fund at its discretion provided that Unitholders will be given at least one month's prior notice of any such change. The Manager may also determine that there shall be additional Subscription Days for any Class Fund without the requirement of notice to Unitholders. DDDDistributionsistributionsistributionsistributions Income available for distribution, attributable to each Class Fund, shall be accumulated and not distributed to Unitholders. Transactions with Key Management Transactions with Key Management Transactions with Key Management Transactions with Key Management PersonnelPersonnelPersonnelPersonnel Directors and certain levels of management may participate in the Fund as investors. The interests of directors and management are available on request from the manager. Schedule of Similarities and Schedule of Similarities and Schedule of Similarities and Schedule of Similarities and DDDDifferencesifferencesifferencesifferences South African Investors should review the Schedule of Similarities and Differences (“the Schedule”) reflecting the key differences and similarities between the regulations applicable to the Investment Solutions Strategic Global Fund, and those applicable to South African registered Collective Investment Schemes. The Schedule is available for inspection on www.investmentsolutions.co.za. SSSSignificant events since the ignificant events since the ignificant events since the ignificant events since the periodperiodperiodperiod endendendend There were no significant events since period end.
INVESTMENT SOLUTIONS STRATEGIC GLOBAL FUND
19
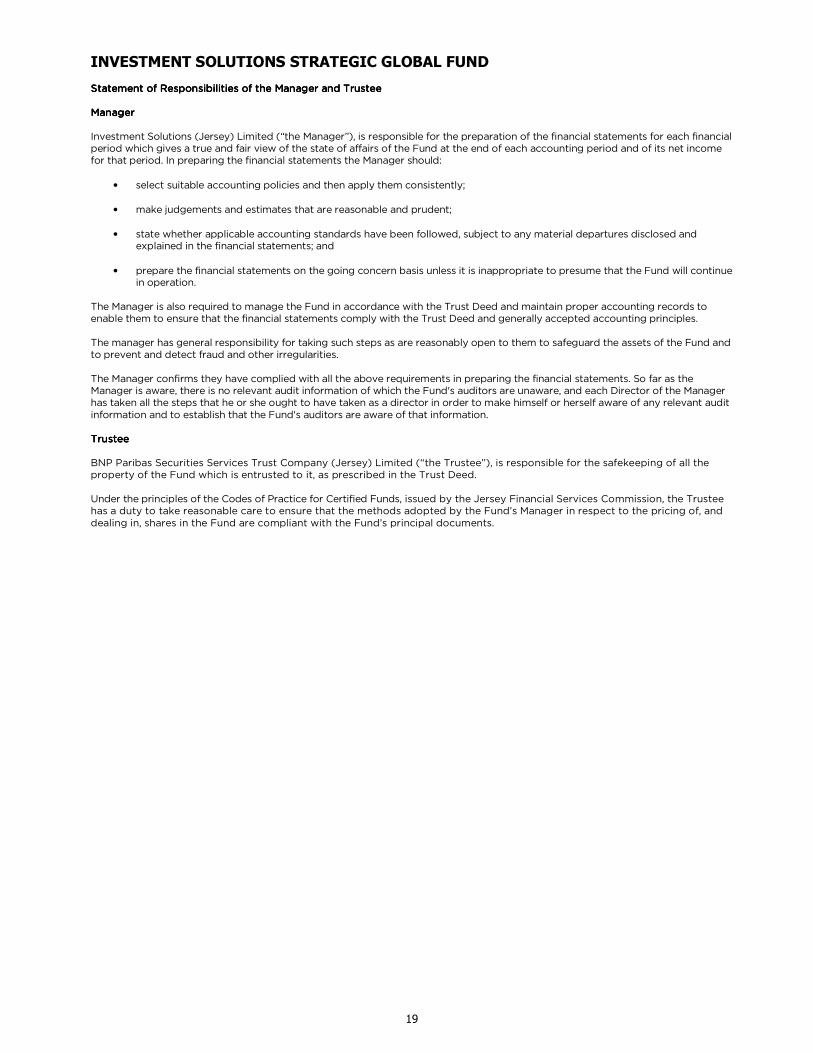
Statement of Statement of Statement of Statement of Responsibilities Responsibilities Responsibilities Responsibilities of the of the of the of the MMMManageranageranageranager and Trusteeand Trusteeand Trusteeand Trustee MaMaMaManagernagernagernager Investment Solutions (Jersey) Limited (“the Manager”), is responsible for the preparation of the financial statements for each financial period which gives a true and fair view of the state of affairs of the Fund at the end of each accounting period and of its net income for that period. In preparing the financial statements the Manager should:
• select suitable accounting policies and then apply them consistently;
• make judgements and estimates that are reasonable and prudent;
• state whether applicable accounting standards have been followed, subject to any material departures disclosed and explained in the financial statements; and
• prepare the financial statements on the going concern basis unless it is inappropriate to presume that the Fund will continue in operation.
The Manager is also required to manage the Fund in accordance with the Trust Deed and maintain proper accounting records to enable them to ensure that the financial statements comply with the Trust Deed and generally accepted accounting principles. The manager has general responsibility for taking such steps as are reasonably open to them to safeguard the assets of the Fund and to prevent and detect fraud and other irregularities. The Manager confirms they have complied with all the above requirements in preparing the financial statements. So far as the Manager is aware, there is no relevant audit information of which the Fund's auditors are unaware, and each Director of the Manager has taken all the steps that he or she ought to have taken as a director in order to make himself or herself aware of any relevant audit information and to establish that the Fund's auditors are aware of that information. TrusteeTrusteeTrusteeTrustee BNP Paribas Securities Services Trust Company (Jersey) Limited (“the Trustee”), is responsible for the safekeeping of all the property of the Fund which is entrusted to it, as prescribed in the Trust Deed. Under the principles of the Codes of Practice for Certified Funds, issued by the Jersey Financial Services Commission, the Trustee has a duty to take reasonable care to ensure that the methods adopted by the Fund’s Manager in respect to the pricing of, and dealing in, shares in the Fund are compliant with the Fund’s principal documents.
INVESTMENT SOLUTIONS STRATEGIC GLOBAL FUND
20
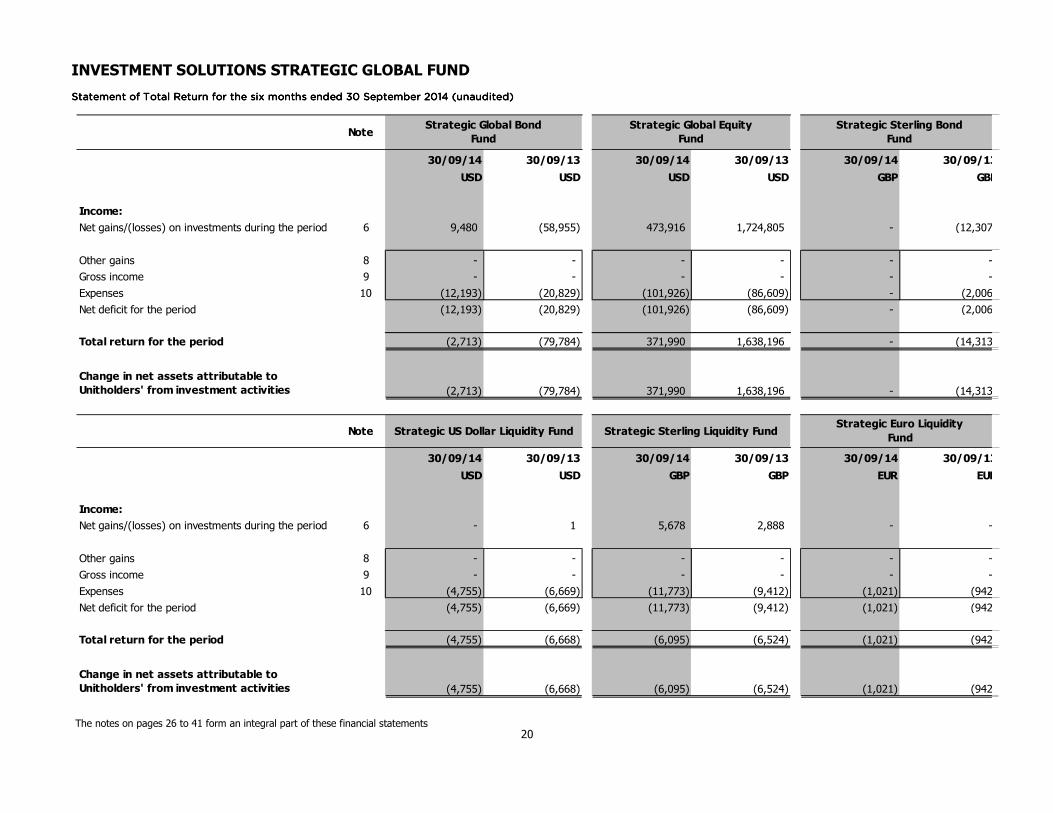
Statement of Total Return Statement of Total Return Statement of Total Return Statement of Total Return for the for the for the for the six six six six monthsmonthsmonthsmonths ended 3ended 3ended 3ended 30000 September September September September 2014201420142014 (unaudited)(unaudited)(unaudited)(unaudited)
Net deficit for the period (4,755) (6,669) (11,773) (9,412) (1,021) (942)
Total return for the period (4,755) (6,668) (6,095) (6,524) (1,021) (942)
Change in net assets attributable to
Unitholders' from investment activities (4,755) (6,668) (6,095) (6,524) (1,021) (942)
Strategic Global Bond
Fund
Strategic Global Equity
Fund
Strategic Sterling Bond
Fund
Strategic US Dollar Liquidity Fund Strategic Sterling Liquidity FundStrategic Euro Liquidity
Fund
The notes on pages 26 to 41 form an integral part of these financial statements
INVESTMENT SOLUTIONS STRATEGIC GLOBAL FUND
21
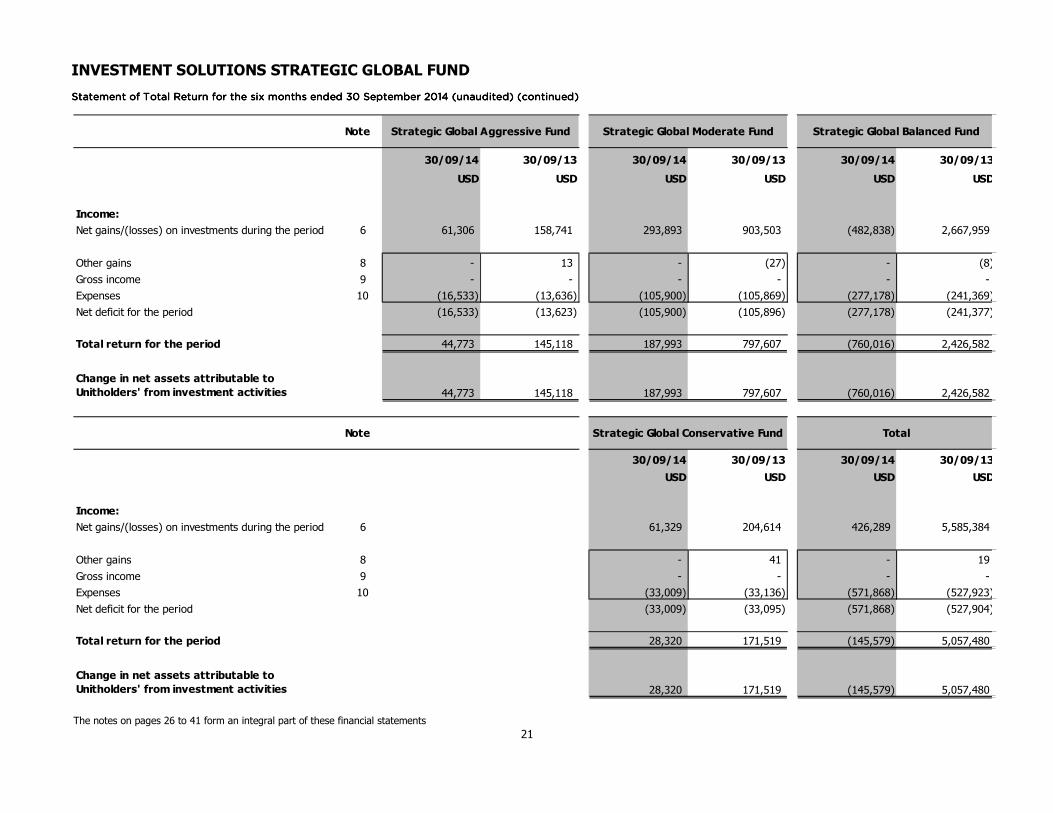
Statement of Total ReturnStatement of Total ReturnStatement of Total ReturnStatement of Total Return for the for the for the for the six months ended 30 September 2014six months ended 30 September 2014six months ended 30 September 2014six months ended 30 September 2014 (unaudited) (unaudited) (unaudited) (unaudited) (continued)(continued)(continued)(continued)
Net deficit for the period (16,533) (13,623) (105,900) (105,896) (277,178) (241,377)
Total return for the period 44,773 145,118 187,993 797,607 (760,016) 2,426,582
Change in net assets attributable to
Unitholders' from investment activities 44,773 145,118 187,993 797,607 (760,016) 2,426,582
Note
30/09/14 30/09/13 30/09/14 30/09/13
USD USD USD USD
Income:
Net gains/(losses) on investments during the period 6 61,329 204,614 426,289 5,585,384
Other gains 8 - 41 - 19
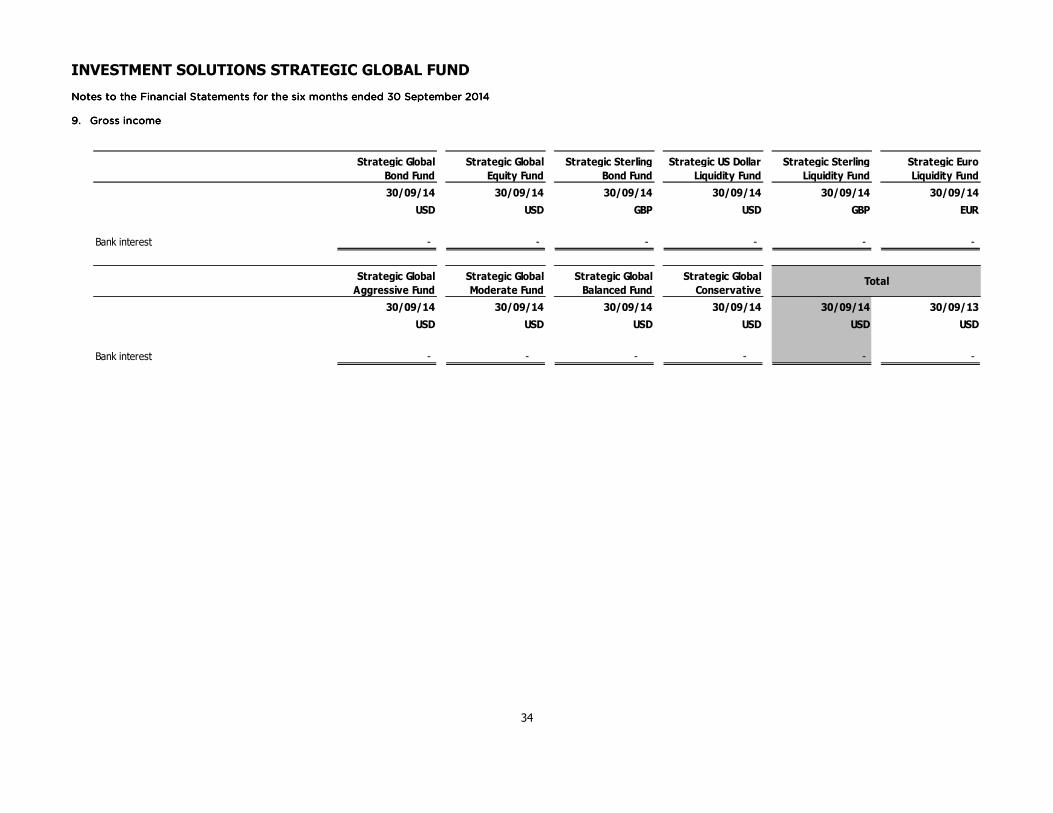
Gross income 9 - - - -
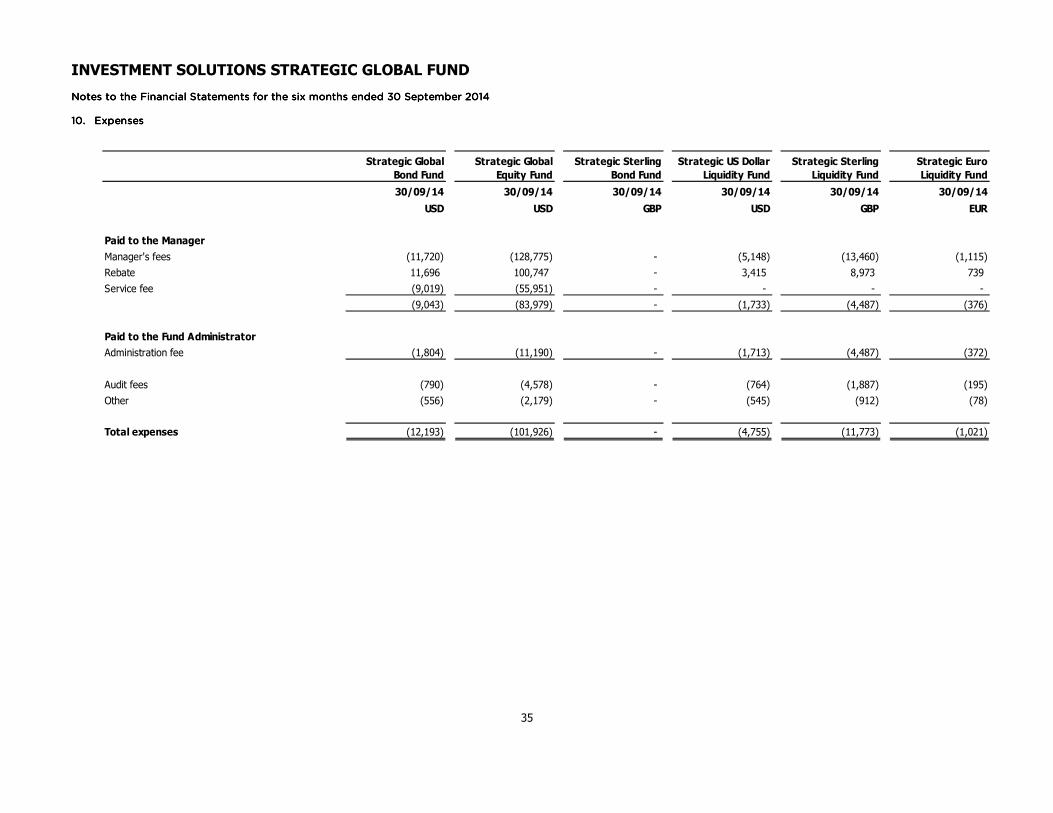
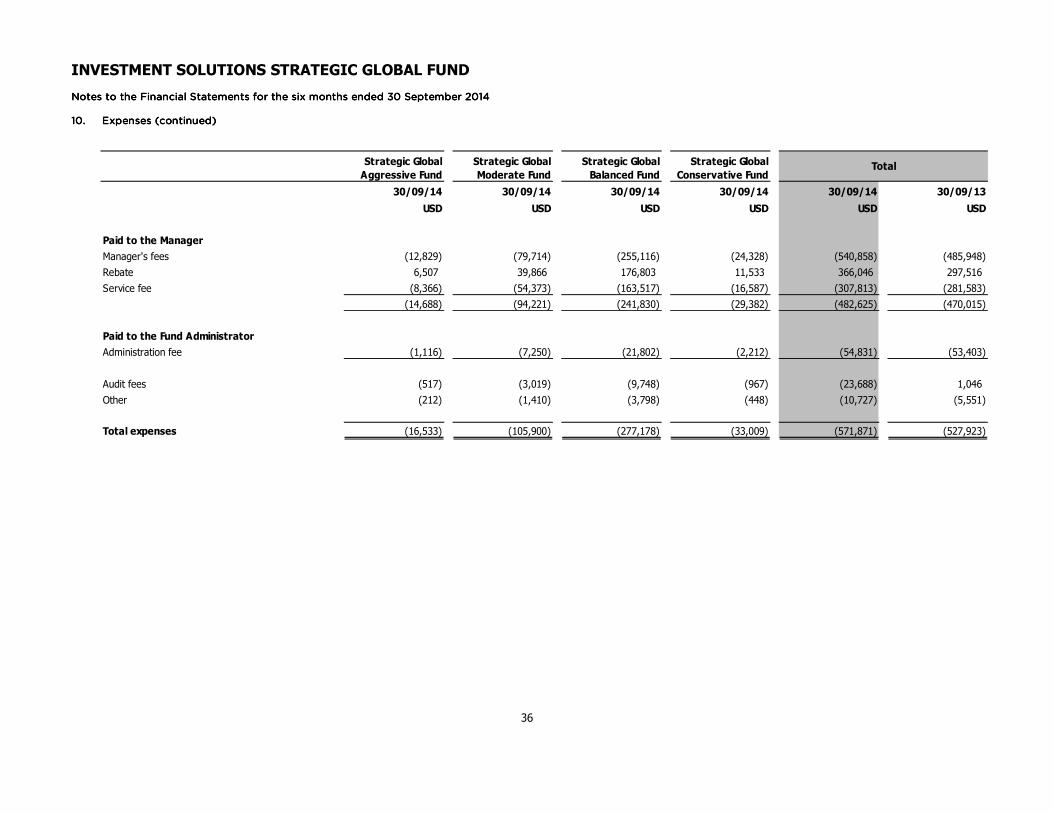
Expenses 10 (33,009) (33,136) (571,868) (527,923)
Net deficit for the period (33,009) (33,095) (571,868) (527,904)
Total return for the period 28,320 171,519 (145,579) 5,057,480
Change in net assets attributable to
Unitholders' from investment activities 28,320 171,519 (145,579) 5,057,480
Strategic Global Aggressive Fund Strategic Global Moderate Fund Strategic Global Balanced Fund
Strategic Global Conservative Fund Total
The notes on pages 26 to 41 form an integral part of these financial statements
INVESTMENT SOLUTIONS STRATEGIC GLOBAL FUND
22
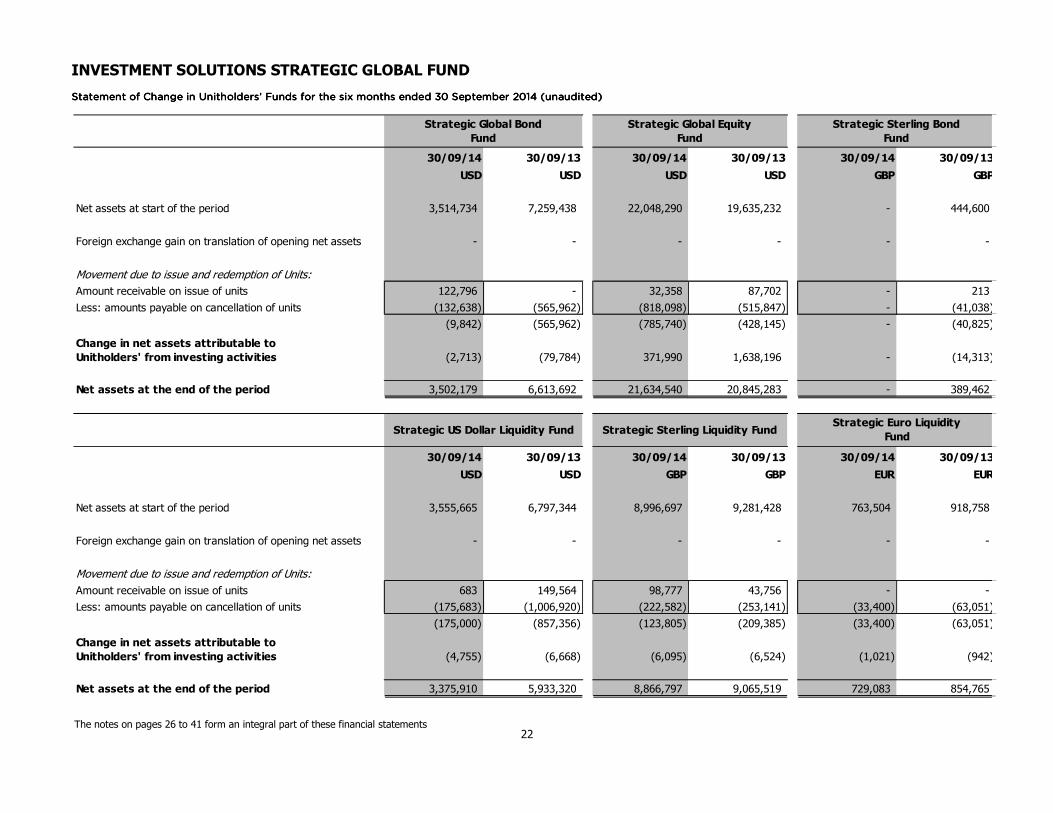
Statement of Change in Statement of Change in Statement of Change in Statement of Change in UUUUnitholdersnitholdersnitholdersnitholders’ Funds’ Funds’ Funds’ Funds for the for the for the for the sixsixsixsix months ended 30 September 2014 (unaudited)months ended 30 September 2014 (unaudited)months ended 30 September 2014 (unaudited)months ended 30 September 2014 (unaudited)
Unitholders' from investing activities (4,755) (6,668) (6,095) (6,524) (1,021) (942)
Net assets at the end of the period 3,375,910 5,933,320 8,866,797 9,065,519 729,083 854,765
Strategic Global Equity
Fund
Strategic Sterling Bond
Fund
Strategic US Dollar Liquidity Fund Strategic Sterling Liquidity FundStrategic Euro Liquidity
Fund
Strategic Global Bond
Fund
The notes on pages 26 to 41 form an integral part of these financial statements
INVESTMENT SOLUTIONS STRATEGIC GLOBAL FUND
23
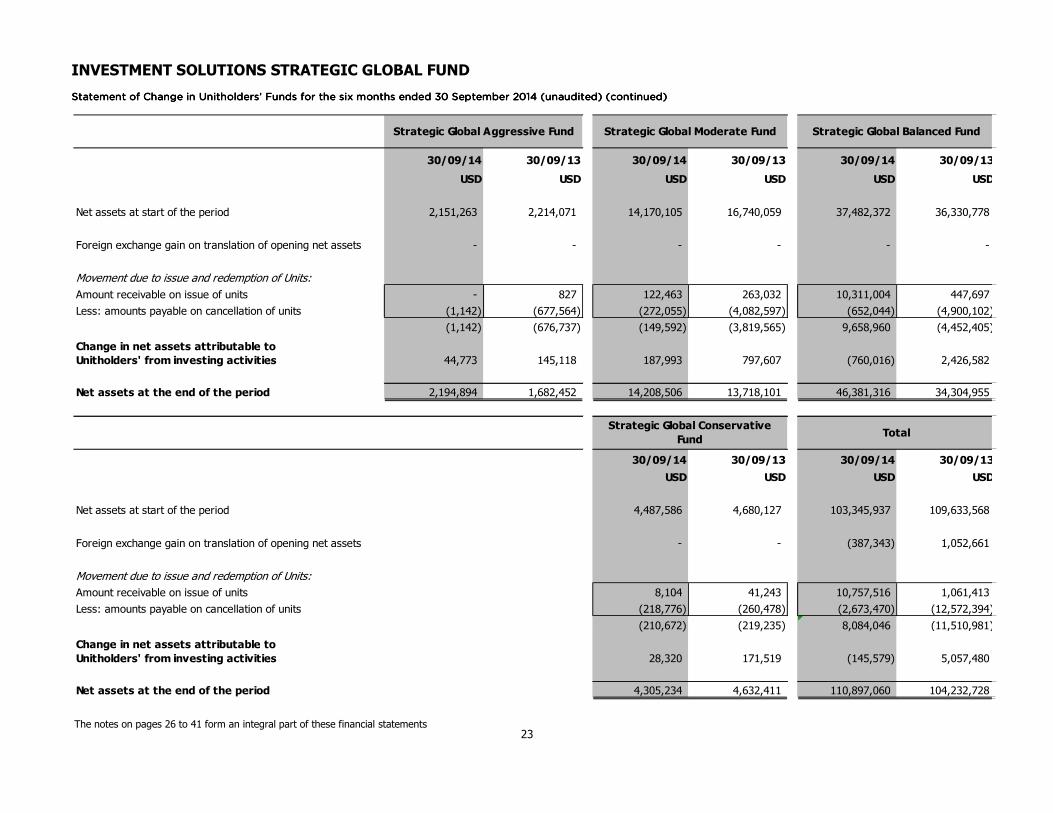
StaStaStaStatement of Change tement of Change tement of Change tement of Change in Uin Uin Uin Unitholdersnitholdersnitholdersnitholders’ Funds’ Funds’ Funds’ Funds for the for the for the for the six months ended 30 September 2014six months ended 30 September 2014six months ended 30 September 2014six months ended 30 September 2014 (unaudited) (unaudited) (unaudited) (unaudited) (continued)(continued)(continued)(continued)
Unitholders' from investing activities 44,773 145,118 187,993 797,607 (760,016) 2,426,582
Net assets at the end of the period 2,194,894 1,682,452 14,208,506 13,718,101 46,381,316 34,304,955
30/09/14 30/09/13 30/09/14 30/09/13
USD USD USD USD
Net assets at start of the period 4,487,586 4,680,127 103,345,937 109,633,568
Foreign exchange gain on translation of opening net assets - - (387,343) 1,052,661
Movement due to issue and redemption of Units:
Amount receivable on issue of units 8,104 41,243 10,757,516 1,061,413
Less: amounts payable on cancellation of units (218,776) (260,478) (2,673,470) (12,572,394)
(210,672) (219,235) 8,084,046 (11,510,981)
Change in net assets attributable to
Unitholders' from investing activities 28,320 171,519 (145,579) 5,057,480
Net assets at the end of the period 4,305,234 4,632,411 110,897,060 104,232,728
Strategic Global Moderate Fund Strategic Global Balanced Fund
Strategic Global Conservative
FundTotal
Strategic Global Aggressive Fund
The notes on pages 26 to 41 form an integral part of these financial statements
INVESTMENT SOLUTIONS STRATEGIC GLOBAL FUND
24
Balance Sheet as at Balance Sheet as at Balance Sheet as at Balance Sheet as at 30 September30 September30 September30 September 2014201420142014 (unaudited)(unaudited)(unaudited)(unaudited)
Strategic US Dollar Liquidity Fund Strategic Sterling Liquidity FundStrategic Euro Liquidity
Fund
The notes on pages 26 to 41 form an integral part of these financial statements
INVESTMENT SOLUTIONS STRATEGIC GLOBAL FUND
25
Balance Sheet as at Balance Sheet as at Balance Sheet as at Balance Sheet as at 30 September 201430 September 201430 September 201430 September 2014 (unaudited) (unaudited) (unaudited) (unaudited) (continued)(continued)(continued)(continued)
Strategic Global Aggressive Fund Strategic Global Moderate Fund Strategic Global Balanced Fund
Strategic Global Conservative Fund Total
The notes on pages 26 to 41 form an integral part of these financial statements
INVESTMENT SOLUTIONS STRATEGIC GLOBAL FUND
26
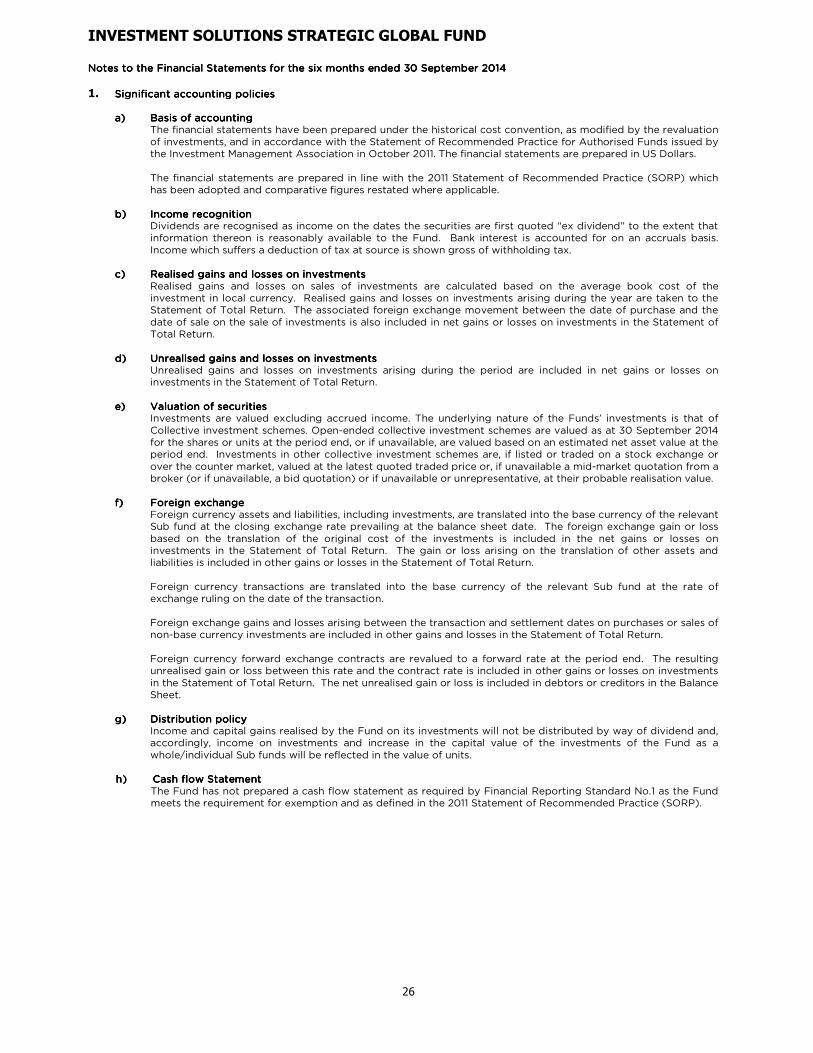
Notes to the Notes to the Notes to the Notes to the FinancFinancFinancFinancial Statementsial Statementsial Statementsial Statements for the for the for the for the six six six six months ended 30 September 2014months ended 30 September 2014months ended 30 September 2014months ended 30 September 2014
a)a)a)a) Basis of accountingBasis of accountingBasis of accountingBasis of accounting The financial statements have been prepared under the historical cost convention, as modified by the revaluation of investments, and in accordance with the Statement of Recommended Practice for Authorised Funds issued by the Investment Management Association in October 2011. The financial statements are prepared in US Dollars. The financial statements are prepared in line with the 2011 Statement of Recommended Practice (SORP) which has been adopted and comparative figures restated where applicable.
b)b)b)b) Income recognitionIncome recognitionIncome recognitionIncome recognition Dividends are recognised as income on the dates the securities are first quoted “ex dividend” to the extent that
information thereon is reasonably available to the Fund. Bank interest is accounted for on an accruals basis. Income which suffers a deduction of tax at source is shown gross of withholding tax.
c)c)c)c) Realised gains and losses on investmentsRealised gains and losses on investmentsRealised gains and losses on investmentsRealised gains and losses on investments Realised gains and losses on sales of investments are calculated based on the average book cost of the
investment in local currency. Realised gains and losses on investments arising during the year are taken to the Statement of Total Return. The associated foreign exchange movement between the date of purchase and the date of sale on the sale of investments is also included in net gains or losses on investments in the Statement of Total Return.
d)d)d)d) Unrealised gains and losses on investmentsUnrealised gains and losses on investmentsUnrealised gains and losses on investmentsUnrealised gains and losses on investments Unrealised gains and losses on investments arising during the period are included in net gains or losses on
investments in the Statement of Total Return. e)e)e)e) Valuation of securitiesValuation of securitiesValuation of securitiesValuation of securities Investments are valued excluding accrued income. The underlying nature of the Funds’ investments is that of
Collective investment schemes. Open-ended collective investment schemes are valued as at 30 September 2014 for the shares or units at the period end, or if unavailable, are valued based on an estimated net asset value at the period end. Investments in other collective investment schemes are, if listed or traded on a stock exchange or over the counter market, valued at the latest quoted traded price or, if unavailable a mid-market quotation from a broker (or if unavailable, a bid quotation) or if unavailable or unrepresentative, at their probable realisation value.
f)f)f)f) Foreign exchangeForeign exchangeForeign exchangeForeign exchange Foreign currency assets and liabilities, including investments, are translated into the base currency of the relevant
Sub fund at the closing exchange rate prevailing at the balance sheet date. The foreign exchange gain or loss based on the translation of the original cost of the investments is included in the net gains or losses on investments in the Statement of Total Return. The gain or loss arising on the translation of other assets and liabilities is included in other gains or losses in the Statement of Total Return.
Foreign currency transactions are translated into the base currency of the relevant Sub fund at the rate of
exchange ruling on the date of the transaction. Foreign exchange gains and losses arising between the transaction and settlement dates on purchases or sales of
non-base currency investments are included in other gains and losses in the Statement of Total Return.
Foreign currency forward exchange contracts are revalued to a forward rate at the period end. The resulting unrealised gain or loss between this rate and the contract rate is included in other gains or losses on investments in the Statement of Total Return. The net unrealised gain or loss is included in debtors or creditors in the Balance Sheet.
g)g)g)g) Distribution policyDistribution policyDistribution policyDistribution policy Income and capital gains realised by the Fund on its investments will not be distributed by way of dividend and,
accordingly, income on investments and increase in the capital value of the investments of the Fund as a whole/individual Sub funds will be reflected in the value of units.
The Fund has not prepared a cash flow statement as required by Financial Reporting Standard No.1 as the Fund meets the requirement for exemption and as defined in the 2011 Statement of Recommended Practice (SORP).
INVESTMENT SOLUTIONS STRATEGIC GLOBAL FUND
27
Notes to the Financial Statements Notes to the Financial Statements Notes to the Financial Statements Notes to the Financial Statements for the for the for the for the six six six six months ended 30 September 2014months ended 30 September 2014months ended 30 September 2014months ended 30 September 2014
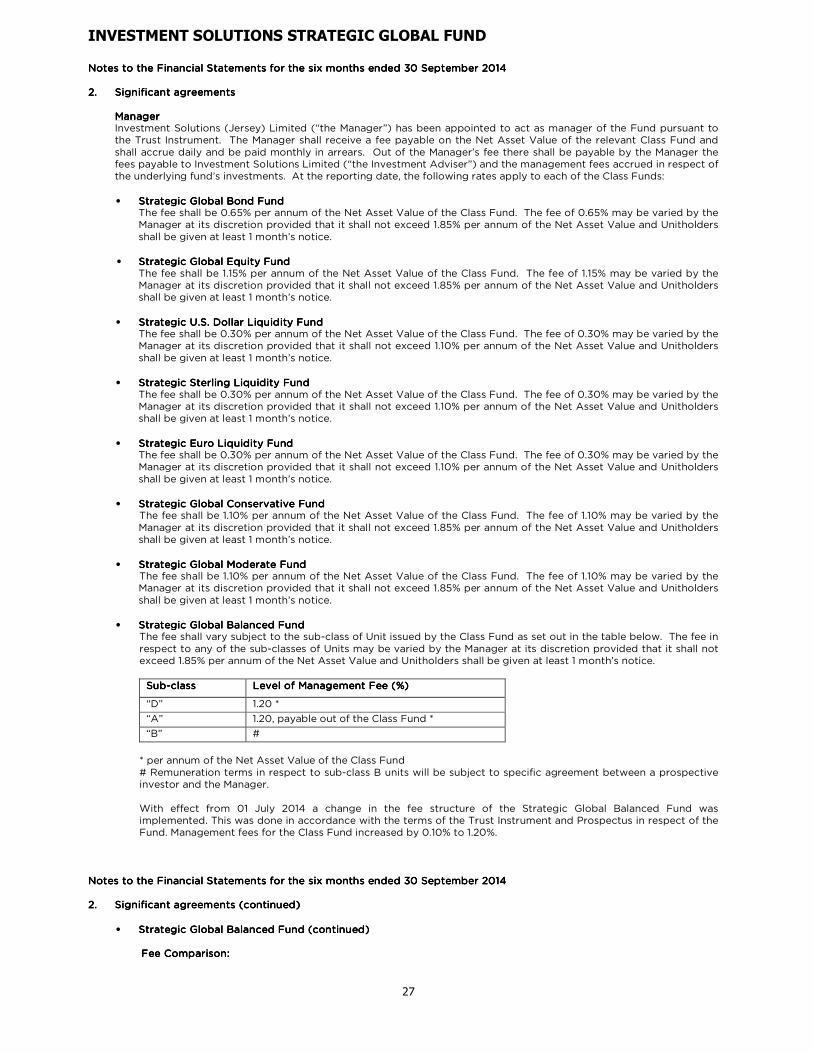
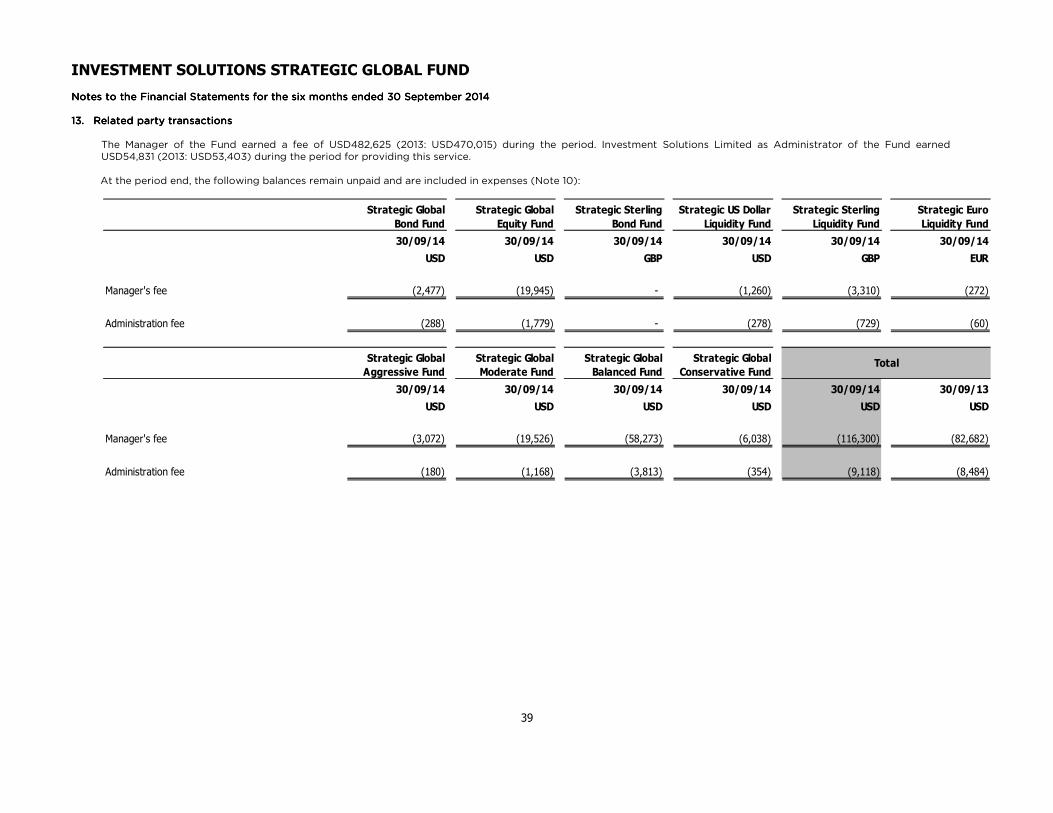
2.2.2.2. Significant agreementsSignificant agreementsSignificant agreementsSignificant agreements ManagerManagerManagerManager Investment Solutions (Jersey) Limited (“the Manager”) has been appointed to act as manager of the Fund pursuant to the Trust Instrument. The Manager shall receive a fee payable on the Net Asset Value of the relevant Class Fund and shall accrue daily and be paid monthly in arrears. Out of the Manager’s fee there shall be payable by the Manager the fees payable to Investment Solutions Limited (“the Investment Adviser”) and the management fees accrued in respect of the underlying fund’s investments. At the reporting date, the following rates apply to each of the Class Funds:
• Strategic Global Bond FundStrategic Global Bond FundStrategic Global Bond FundStrategic Global Bond Fund The fee shall be 0.65% per annum of the Net Asset Value of the Class Fund. The fee of 0.65% may be varied by the Manager at its discretion provided that it shall not exceed 1.85% per annum of the Net Asset Value and Unitholders shall be given at least 1 month’s notice.
• Strategic Global Equity FundStrategic Global Equity FundStrategic Global Equity FundStrategic Global Equity Fund The fee shall be 1.15% per annum of the Net Asset Value of the Class Fund. The fee of 1.15% may be varied by the Manager at its discretion provided that it shall not exceed 1.85% per annum of the Net Asset Value and Unitholders shall be given at least 1 month’s notice.
• Strategic Strategic Strategic Strategic U.S.U.S.U.S.U.S. Dollar Liquidity FundDollar Liquidity FundDollar Liquidity FundDollar Liquidity Fund The fee shall be 0.30% per annum of the Net Asset Value of the Class Fund. The fee of 0.30% may be varied by the Manager at its discretion provided that it shall not exceed 1.10% per annum of the Net Asset Value and Unitholders shall be given at least 1 month’s notice.
• Strategic Sterling Liquidity FundStrategic Sterling Liquidity FundStrategic Sterling Liquidity FundStrategic Sterling Liquidity Fund The fee shall be 0.30% per annum of the Net Asset Value of the Class Fund. The fee of 0.30% may be varied by the Manager at its discretion provided that it shall not exceed 1.10% per annum of the Net Asset Value and Unitholders shall be given at least 1 month’s notice.
• Strategic Euro Liquidity FundStrategic Euro Liquidity FundStrategic Euro Liquidity FundStrategic Euro Liquidity Fund The fee shall be 0.30% per annum of the Net Asset Value of the Class Fund. The fee of 0.30% may be varied by the Manager at its discretion provided that it shall not exceed 1.10% per annum of the Net Asset Value and Unitholders shall be given at least 1 month’s notice.
• Strategic Global Conservative Strategic Global Conservative Strategic Global Conservative Strategic Global Conservative FundFundFundFund The fee shall be 1.10% per annum of the Net Asset Value of the Class Fund. The fee of 1.10% may be varied by the Manager at its discretion provided that it shall not exceed 1.85% per annum of the Net Asset Value and Unitholders shall be given at least 1 month’s notice.
• Strategic Global Moderate Strategic Global Moderate Strategic Global Moderate Strategic Global Moderate FundFundFundFund The fee shall be 1.10% per annum of the Net Asset Value of the Class Fund. The fee of 1.10% may be varied by the Manager at its discretion provided that it shall not exceed 1.85% per annum of the Net Asset Value and Unitholders shall be given at least 1 month’s notice.
• Strategic Global Balanced Strategic Global Balanced Strategic Global Balanced Strategic Global Balanced FundFundFundFund The fee shall vary subject to the sub-class of Unit issued by the Class Fund as set out in the table below. The fee in respect to any of the sub-classes of Units may be varied by the Manager at its discretion provided that it shall not exceed 1.85% per annum of the Net Asset Value and Unitholders shall be given at least 1 month’s notice.
SubSubSubSub----classclassclassclass Level of ManagemenLevel of ManagemenLevel of ManagemenLevel of Management Fee (%)t Fee (%)t Fee (%)t Fee (%)
“D” 1.20 *
“A” 1.20, payable out of the Class Fund *
“B” #
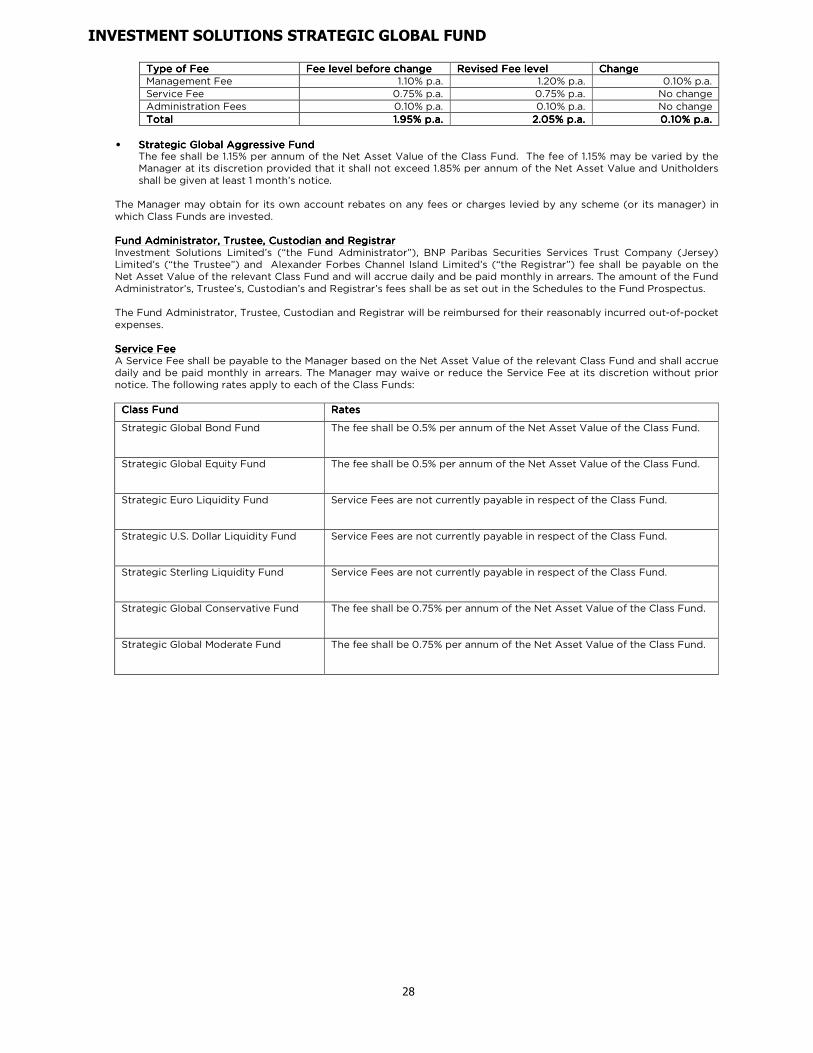
* per annum of the Net Asset Value of the Class Fund # Remuneration terms in respect to sub-class B units will be subject to specific agreement between a prospective investor and the Manager. With effect from 01 July 2014 a change in the fee structure of the Strategic Global Balanced Fund was implemented. This was done in accordance with the terms of the Trust Instrument and Prospectus in respect of the Fund. Management fees for the Class Fund increased by 0.10% to 1.20%.
Notes to the Financial Statements for the six Notes to the Financial Statements for the six Notes to the Financial Statements for the six Notes to the Financial Statements for the six months ended 30 September 2014months ended 30 September 2014months ended 30 September 2014months ended 30 September 2014
• Strategic Global Balanced Strategic Global Balanced Strategic Global Balanced Strategic Global Balanced Fund (continued)Fund (continued)Fund (continued)Fund (continued) Fee Comparison:Fee Comparison:Fee Comparison:Fee Comparison:
INVESTMENT SOLUTIONS STRATEGIC GLOBAL FUND
28
Type of FeeType of FeeType of FeeType of Fee Fee level before chFee level before chFee level before chFee level before changeangeangeange Revised Revised Revised Revised Fee levelFee levelFee levelFee level ChangeChangeChangeChange
Management Fee 1.10% p.a. 1.20% p.a. 0.10% p.a.
Service Fee 0.75% p.a. 0.75% p.a. No change
Administration Fees 0.10% p.a. 0.10% p.a. No change
• Strategic Global Aggressive Strategic Global Aggressive Strategic Global Aggressive Strategic Global Aggressive FundFundFundFund The fee shall be 1.15% per annum of the Net Asset Value of the Class Fund. The fee of 1.15% may be varied by the Manager at its discretion provided that it shall not exceed 1.85% per annum of the Net Asset Value and Unitholders shall be given at least 1 month’s notice.
The Manager may obtain for its own account rebates on any fees or charges levied by any scheme (or its manager) in which Class Funds are invested. Fund Administrator, TrusteeFund Administrator, TrusteeFund Administrator, TrusteeFund Administrator, Trustee, Custodian, Custodian, Custodian, Custodian and Registrar and Registrar and Registrar and Registrar Investment Solutions Limited’s (“the Fund Administrator”), BNP Paribas Securities Services Trust Company (Jersey) Limited’s (“the Trustee”) and Alexander Forbes Channel Island Limited’s (“the Registrar”) fee shall be payable on the Net Asset Value of the relevant Class Fund and will accrue daily and be paid monthly in arrears. The amount of the Fund Administrator’s, Trustee’s, Custodian’s and Registrar’s fees shall be as set out in the Schedules to the Fund Prospectus. The Fund Administrator, Trustee, Custodian and Registrar will be reimbursed for their reasonably incurred out-of-pocket expenses. Service FeeService FeeService FeeService Fee A Service Fee shall be payable to the Manager based on the Net Asset Value of the relevant Class Fund and shall accrue daily and be paid monthly in arrears. The Manager may waive or reduce the Service Fee at its discretion without prior notice. The following rates apply to each of the Class Funds:
Class FundClass FundClass FundClass Fund RatesRatesRatesRates
Strategic Global Bond Fund The fee shall be 0.5% per annum of the Net Asset Value of the Class Fund.
Strategic Global Equity Fund The fee shall be 0.5% per annum of the Net Asset Value of the Class Fund.
Strategic Euro Liquidity Fund Service Fees are not currently payable in respect of the Class Fund.
Strategic U.S. Dollar Liquidity Fund Service Fees are not currently payable in respect of the Class Fund.
Strategic Sterling Liquidity Fund Service Fees are not currently payable in respect of the Class Fund.
Strategic Global Conservative Fund The fee shall be 0.75% per annum of the Net Asset Value of the Class Fund.
Strategic Global Moderate Fund The fee shall be 0.75% per annum of the Net Asset Value of the Class Fund.
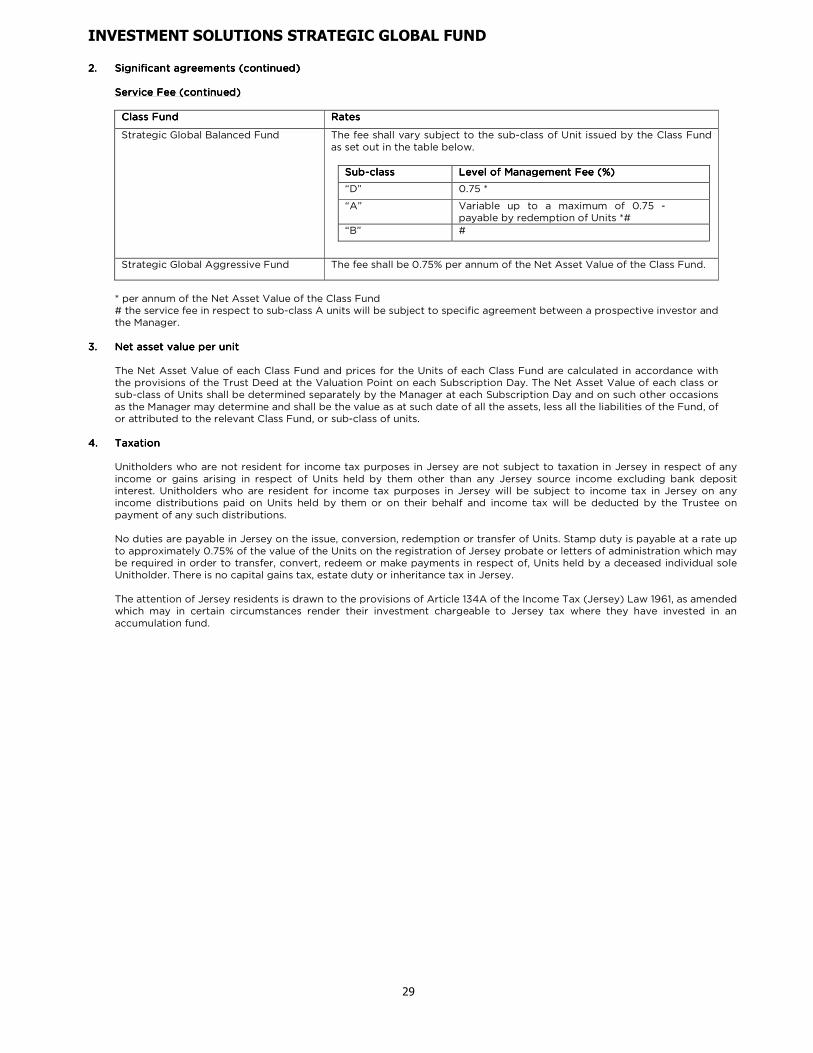
Service Fee (continued)Service Fee (continued)Service Fee (continued)Service Fee (continued)
Class FundClass FundClass FundClass Fund RatesRatesRatesRates
Strategic Global Balanced Fund The fee shall vary subject to the sub-class of Unit issued by the Class Fund as set out in the table below.
SubSubSubSub----classclassclassclass Level of Management Fee (%)Level of Management Fee (%)Level of Management Fee (%)Level of Management Fee (%)
“D” 0.75 *
“A” Variable up to a maximum of 0.75 - payable by redemption of Units *#
“B” #
Strategic Global Aggressive Fund The fee shall be 0.75% per annum of the Net Asset Value of the Class Fund.
* per annum of the Net Asset Value of the Class Fund # the service fee in respect to sub-class A units will be subject to specific agreement between a prospective investor and the Manager.
3.3.3.3. NetNetNetNet asset value per unit asset value per unit asset value per unit asset value per unit
The Net Asset Value of each Class Fund and prices for the Units of each Class Fund are calculated in accordance with the provisions of the Trust Deed at the Valuation Point on each Subscription Day. The Net Asset Value of each class or sub-class of Units shall be determined separately by the Manager at each Subscription Day and on such other occasions as the Manager may determine and shall be the value as at such date of all the assets, less all the liabilities of the Fund, of or attributed to the relevant Class Fund, or sub-class of units.
4.4.4.4. TaxationTaxationTaxationTaxation
Unitholders who are not resident for income tax purposes in Jersey are not subject to taxation in Jersey in respect of any income or gains arising in respect of Units held by them other than any Jersey source income excluding bank deposit interest. Unitholders who are resident for income tax purposes in Jersey will be subject to income tax in Jersey on any income distributions paid on Units held by them or on their behalf and income tax will be deducted by the Trustee on payment of any such distributions. No duties are payable in Jersey on the issue, conversion, redemption or transfer of Units. Stamp duty is payable at a rate up to approximately 0.75% of the value of the Units on the registration of Jersey probate or letters of administration which may be required in order to transfer, convert, redeem or make payments in respect of, Units held by a deceased individual sole Unitholder. There is no capital gains tax, estate duty or inheritance tax in Jersey.
The attention of Jersey residents is drawn to the provisions of Article 134A of the Income Tax (Jersey) Law 1961, as amended which may in certain circumstances render their investment chargeable to Jersey tax where they have invested in an accumulation fund.
INVESTMENT SOLUTIONS STRATEGIC GLOBAL FUND
30
Notes to the FiNotes to the FiNotes to the FiNotes to the Financinancinancinancial Statements al Statements al Statements al Statements for the for the for the for the six six six six months ended 30 September 2014months ended 30 September 2014months ended 30 September 2014months ended 30 September 2014
Notes to the Notes to the Notes to the Notes to the Financial StatementsFinancial StatementsFinancial StatementsFinancial Statements for the for the for the for the six six six six months ended 30 September 2014months ended 30 September 2014months ended 30 September 2014months ended 30 September 2014
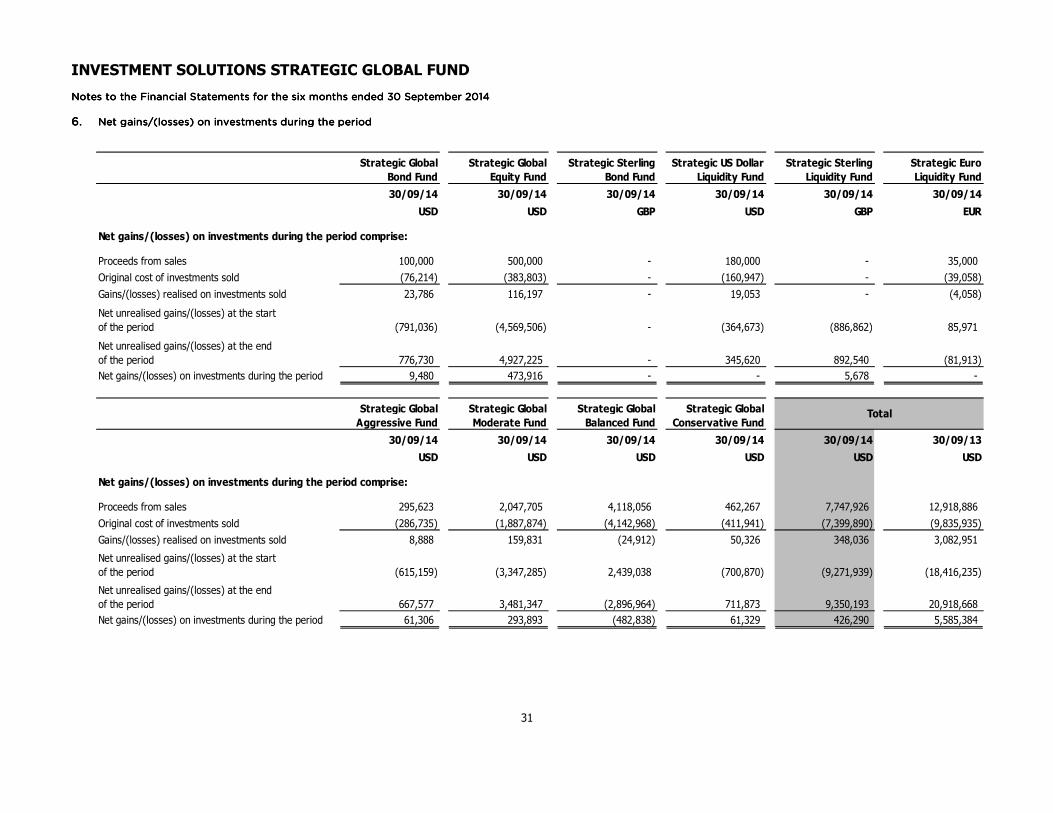
6.6.6.6. Net gainsNet gainsNet gainsNet gains////((((losses)losses)losses)losses) on investments during ton investments during ton investments during ton investments during the he he he periodperiodperiodperiod
Net gains/(losses) on investments during the period comprise:
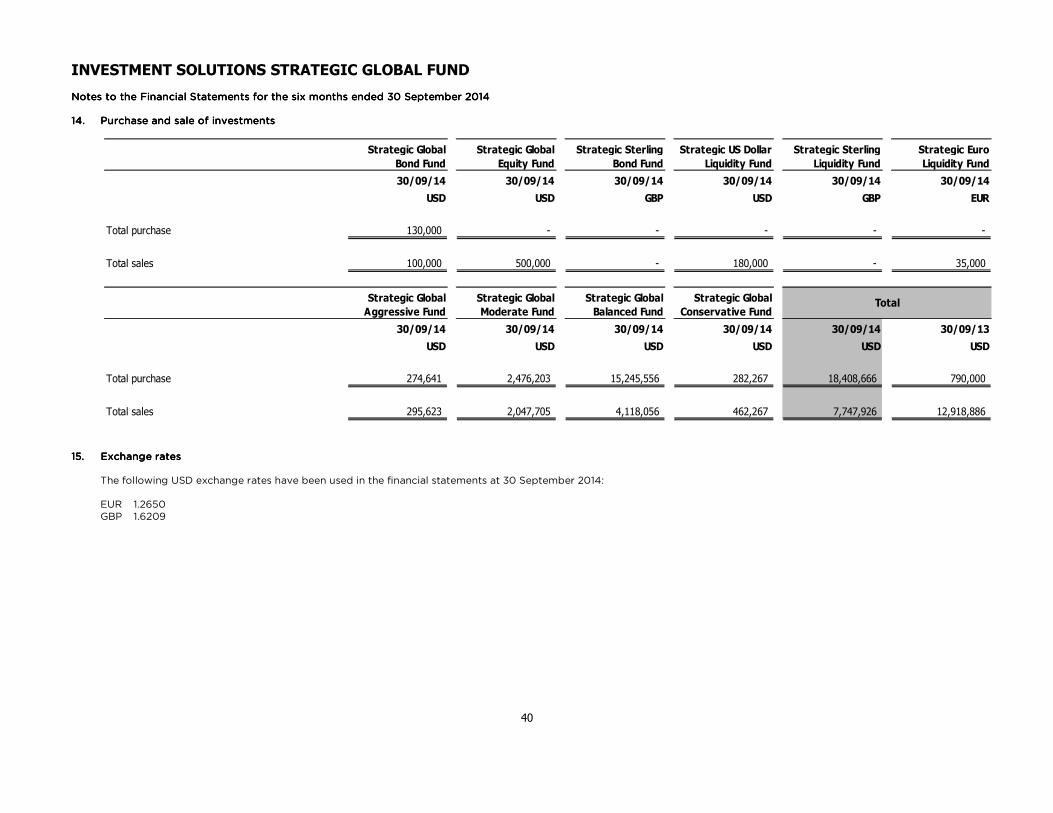
Proceeds from sales 295,623 2,047,705 4,118,056 462,267 7,747,926 12,918,886
Original cost of investments sold (286,735) (1,887,874) (4,142,968) (411,941) (7,399,890) (9,835,935)
Gains/(losses) realised on investments sold 8,888 159,831 (24,912) 50,326 348,036 3,082,951
Net unrealised gains/(losses) at the start
of the period (615,159) (3,347,285) 2,439,038 (700,870) (9,271,939) (18,416,235)
Net unrealised gains/(losses) at the end
of the period 667,577 3,481,347 (2,896,964) 711,873 9,350,193 20,918,668
Net gains/(losses) on investments during the period 61,306 293,893 (482,838) 61,329 426,290 5,585,384
Total
INVESTMENT SOLUTIONS STRATEGIC GLOBAL FUND
32
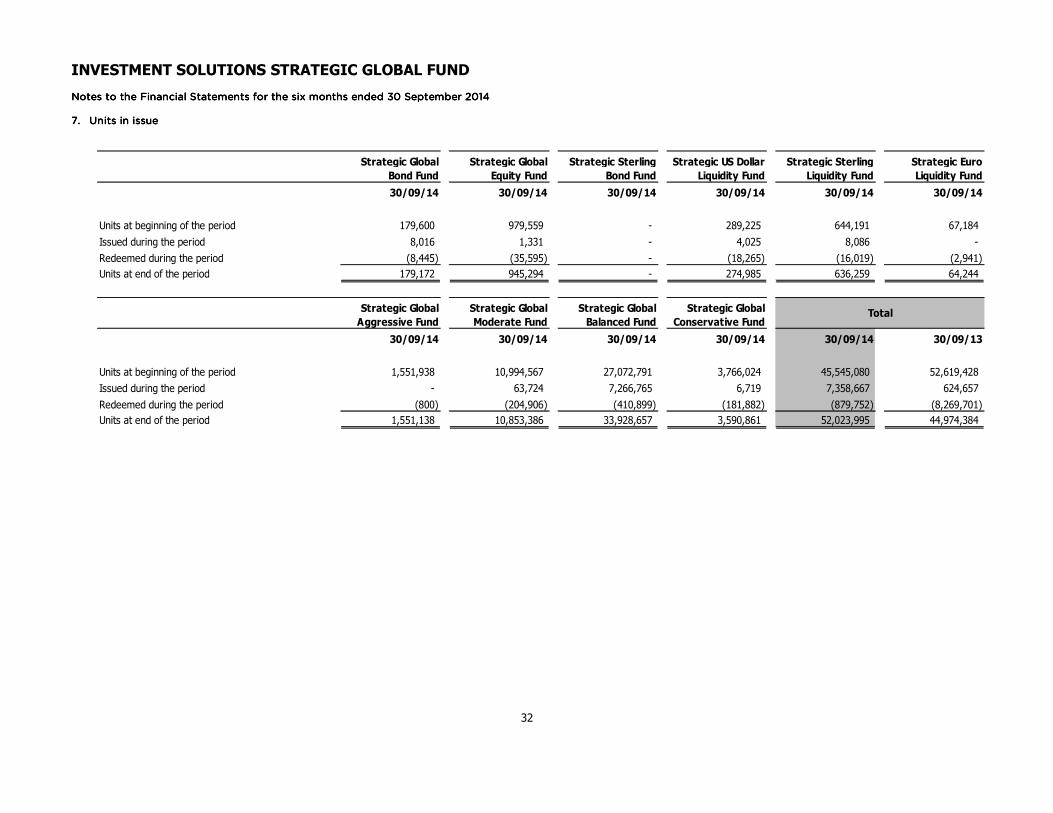
Notes to the FNotes to the FNotes to the FNotes to the Financial Statements inancial Statements inancial Statements inancial Statements for the for the for the for the six six six six months ended 30 September 2014months ended 30 September 2014months ended 30 September 2014months ended 30 September 2014 7777.... Units in issue Units in issue Units in issue Units in issue
Units at beginning of the period 1,551,938 10,994,567 27,072,791 3,766,024 45,545,080 52,619,428
Issued during the period - 63,724 7,266,765 6,719 7,358,667 624,657
Redeemed during the period (800) (204,906) (410,899) (181,882) (879,752) (8,269,701)
Units at end of the period 1,551,138 10,853,386 33,928,657 3,590,861 52,023,995 44,974,384
Total
INVESTMENT SOLUTIONS STRATEGIC GLOBAL FUND
33
Notes to the FNotes to the FNotes to the FNotes to the Financiinanciinanciinancial Statements al Statements al Statements al Statements for the for the for the for the six six six six months ended 30 September 2014months ended 30 September 2014months ended 30 September 2014months ended 30 September 2014 8888.... Other Other Other Other gainsgainsgainsgains
Notes to the FNotes to the FNotes to the FNotes to the Financial Stinancial Stinancial Stinancial Statements atements atements atements for the for the for the for the six six six six months ended 30 September 2014months ended 30 September 2014months ended 30 September 2014months ended 30 September 2014
9999.... Gross income Gross income Gross income Gross income
Notes to the Financial Statements Notes to the Financial Statements Notes to the Financial Statements Notes to the Financial Statements for the for the for the for the six six six six months ended 30 September 2014months ended 30 September 2014months ended 30 September 2014months ended 30 September 2014
Total expenses (12,193) (101,926) - (4,755) (11,773) (1,021)
INVESTMENT SOLUTIONS STRATEGIC GLOBAL FUND
36
Notes to the FNotes to the FNotes to the FNotes to the Financial Statements inancial Statements inancial Statements inancial Statements for the for the for the for the six six six six months ended 30 September 20months ended 30 September 20months ended 30 September 20months ended 30 September 2014141414 10.10.10.10. Expenses (continued)Expenses (continued)Expenses (continued)Expenses (continued)
Other (212) (1,410) (3,798) (448) (10,727) (5,551)
Total expenses (16,533) (105,900) (277,178) (33,009) (571,871) (527,923)
Total
INVESTMENT SOLUTIONS STRATEGIC GLOBAL FUND
37
Notes to the Financial Statements Notes to the Financial Statements Notes to the Financial Statements Notes to the Financial Statements for the for the for the for the six six six six months ended 30 September 2014months ended 30 September 2014months ended 30 September 2014months ended 30 September 2014 11111111.... Cash and bank balances Cash and bank balances Cash and bank balances Cash and bank balances
All cash and bank balances are held with BNP Paribas Securities Services S.C.A. Jersey Branch.
Cash and bank balances 83,225 707,529 2,727,474 88,060 4,679,968 3,057,586
Total
INVESTMENT SOLUTIONS STRATEGIC GLOBAL FUND
38
Notes to the Notes to the Notes to the Notes to the FFFFinancial Statements inancial Statements inancial Statements inancial Statements for the for the for the for the six six six six months ended 30 September 2014months ended 30 September 2014months ended 30 September 2014months ended 30 September 2014 11112222.... Creditors Creditors Creditors Creditors
Notes to the FNotes to the FNotes to the FNotes to the Financial Statements inancial Statements inancial Statements inancial Statements for the for the for the for the six six six six months ended 30 September 2014months ended 30 September 2014months ended 30 September 2014months ended 30 September 2014 11113333.... Related party transactions Related party transactions Related party transactions Related party transactions
The Manager of the Fund earned a fee of USD482,625 (2013: USD470,015) during the period. Investment Solutions Limited as Administrator of the Fund earned USD54,831 (2013: USD53,403) during the period for providing this service.
At the period end, the following balances remain unpaid and are included in expenses (Note 10):
Notes to the FNotes to the FNotes to the FNotes to the Financial Statements inancial Statements inancial Statements inancial Statements for the for the for the for the six six six six months ended 30 September 2014months ended 30 September 2014months ended 30 September 2014months ended 30 September 2014
14.14.14.14. Purchase and salePurchase and salePurchase and salePurchase and sale of investments of investments of investments of investments
Total purchase 274,641 2,476,203 15,245,556 282,267 18,408,666 790,000
Total sales 295,623 2,047,705 4,118,056 462,267 7,747,926 12,918,886
Total
INVESTMENT SOLUTIONS STRATEGIC GLOBAL FUND
41
Notes to the Financial Statements Notes to the Financial Statements Notes to the Financial Statements Notes to the Financial Statements for the for the for the for the six six six six months ended 30 September 2014months ended 30 September 2014months ended 30 September 2014months ended 30 September 2014
The main risks arising from the Fund’s financial instruments are general risk, credit and liquidity risk. The Investment Adviser reviews policies for managing these risks, which are set out below.
Market Market Market Market RisksRisksRisksRisks An investment in a Class Fund may be considered to be speculative. It is not intended as a complete investment program and is designed only for investors who can afford the loss of their investment. The Class Funds are not subject to the normal regulations and disclosure requirements for publicly offered mutual funds. General risks include leverage and performance risks.
• LeverageLeverageLeverageLeverage It is anticipated that some of the investment managers of the underlying funds in which a Class Fund invests may employ leverage. If the amount of leverage which an underlying fund employs at any one time is large in relation to its capital, fluctuations in the market value of its portfolio will have a disproportionately large effect in relation to its capital and the possibilities for profit and the risk of loss will therefore, be increased.
• Performance RisksPerformance RisksPerformance RisksPerformance Risks There can be no assurance that the Class Funds’ investment approach will be successful or that their investment objectives will be attained. No assurance can be given that the Class Funds’ investment portfolios will generate any income or will appreciate in value. While it is anticipated that the diverse portfolio of Underlying Funds and the selection process used by the Manager will minimise risks, the Class Funds could realise substantial losses, rather than gains, from their investments. The Net Asset Value of the Class Funds are directly related to the market value of the securities in the Class Funds’ portfolio which will fluctuate with general conditions in debt, equity or commodities markets, currency rates, political, economic or social developments, instability in the relevant capital markets or the financial performance of the issuers of securities that are, or underlie, investments in the Underlying Funds.
Credit riskCredit riskCredit riskCredit risk
Credit risk is the risk that a counterparty to a financial instrument will fail to discharge an obligation thereby causing the Fund to incur a financial loss.
The Fund may be exposed to a credit risk on parties with whom they trade and will bear the risk of settlement default. All underlying funds are governed by strict investment objectives and policies specifically set by the Fund Prospectus to meet the investment objectives of the respective unitholders and where appropriate, specify the minimum investment grading rating. There have been no significant changes in risk exposures and the way in which these are managed since the prior year.
Liquidity RiskLiquidity RiskLiquidity RiskLiquidity Risk Liquidity risk is the risk that the Fund will encounter difficulty in meeting obligations associated with financial liabilities that are settled by delivering cash or another financial asset.
It is anticipated that the Class Funds’ investments in some of the Underlying Funds will be subject to restrictions which allow redemptions only at specific times and subject to certain conditions. In addition, some Funds of Funds may provide broad, discretionary powers to suspend redemptions for a material period. Accordingly, the Class Funds may be limited with respect to their ability to diversify or otherwise change their portfolios promptly, including in response to performance of Funds of Funds, changes in the economy or the securities markets in general or in connection with redemptions. The Fund is managing liquidity risk through prescribed investment objectives and policies specifically set by the Fund Prospectus. There have been no significant changes in risk exposures and the way in which these are managed since the prior year.
INVESTMENT SOLUTIONS STRATEGIC GLOBAL FUND
42
Total Expense Ratio (TER) Total Expense Ratio (TER) Total Expense Ratio (TER) Total Expense Ratio (TER) for the for the for the for the six months ended 30 September 2014six months ended 30 September 2014six months ended 30 September 2014six months ended 30 September 2014 (unaudited)(unaudited)(unaudited)(unaudited) The TER includes all operating expenses charged on an ongoing basis to the Fund’s assets. Operating expenses ordinarily include, but are not limited to:
• Management fees
• Custodian fees • Audit fees
• Trustee fees
• Registrar fees • Performance fees
• Administration fees
• Legal and professional fees
The TER is calculated for the preceding 12 months at reporting period. A higher TER does not necessarily imply a poor return, nor does a lower TER imply a good return. The current TER cannot be regarded as an indication of future TER’s. Important to note that on 1 April 2013 the Management and Advisory fees for a number of sub-class Funds were reduced. Refer to footnotes on pages 42 and 43 for further details regarding the fee reduction.
* Management and Advisory Fees were reduced by 0.50% ** ** ** ** Management and Advisory Fees were reduced by 0.10% ^ Management and Advisory Fees were reduced by 0.35% Total Expense Ratio (Total Expense Ratio (Total Expense Ratio (Total Expense Ratio (TER) TER) TER) TER) for the for the for the for the six months ended 30 September 2014six months ended 30 September 2014six months ended 30 September 2014six months ended 30 September 2014(unaudited) (unaudited) (unaudited) (unaudited) (continued)(continued)(continued)(continued)
Total expenses as % of average net assets 1.5087% 1.4488% 1.4829% 1.4391% 1.3884% ** 1.4553%
Performance fees as % of net assets 0.00% 0.00% 0.00% 0.00% 0.00% 0.00%
Total expenses 31,215 29,059 209,874 228,349 539,555 513,219
Average net assets for the period 2,069,062 2,005,727 14,152,624 15,867,552 38,862,505 35,265,804
30/09/14 30/09/13 30/09/14 30/09/13
USD USD USD USD
Total expenses as % of average net assets 1.5081% 1.4259% 1.0792% 1.1149%
Performance fees as % of net assets 0.00% 0.00% 0.00% 0.00%
Total expenses 66,903 67,215 1,143,634 1,197,019
Average net assets for the period 4,436,364 4,713,845 105,968,627 107,361,988
Strategic Global Aggressive Fund Strategic Global Moderate Fund Strategic Global Balanced Fund
Strategic Global Conservative Fund Total
INVESTMENT SOLUTIONS STRATEGIC GLOBAL FUND
44
Management and AdministrationManagement and AdministrationManagement and AdministrationManagement and Administration
MANAGER MANAGER MANAGER MANAGER Investment Solutions (Jersey) Limited 2 - 6 Church Street St. Helier Jersey JE4 8UU Channel Islands
JERSEY LEGAL ADVISERSJERSEY LEGAL ADVISERSJERSEY LEGAL ADVISERSJERSEY LEGAL ADVISERS Ogier Ogier House The Esplanade St. Helier Jersey JE4 9WG Channel Islands
FUND ADMINISTRATORFUND ADMINISTRATORFUND ADMINISTRATORFUND ADMINISTRATOR Investment Solutions Limited Building 1 Inanda Greens Office Park 54 Wierda Road West Wierda Valley Sandton 2146 Republic of South Africa
REGISTRARREGISTRARREGISTRARREGISTRAR Alexander Forbes Channel Islands Limited 2 - 6 Church Street St. Helier Jersey JE4 8UU Channel Islands
FUND FUND FUND FUND SUBSUBSUBSUB----ADMINISTRATORADMINISTRATORADMINISTRATORADMINISTRATOR Alexander Forbes Individual Client Administration (Pty) Limited Alexander Forbes Place 115 West Street Sandown 2146 Republic of South Africa
INDEPENDENT AUDITORSINDEPENDENT AUDITORSINDEPENDENT AUDITORSINDEPENDENT AUDITORS PricewaterhouseCoopers CI LLP 37 Esplanade St. Helier Jersey JE1 4XA Channel Islands
INVESTMENT ADVISERINVESTMENT ADVISERINVESTMENT ADVISERINVESTMENT ADVISER Investment Solutions Limited Building 1 Inanda Greens Office Park 54 Wierda Road West Wierda Valley Sandown 2146 Republic of South Africa
TRUSTEETRUSTEETRUSTEETRUSTEE BNP Paribas Securities Services Trust Company (Jersey) Limited Liberté House 19-23 La Motte Street St. Helier Jersey JE2 4SY Channel Islands CUSTODIANCUSTODIANCUSTODIANCUSTODIAN BNP Paribas Securities Services S.C.A. Jersey Branch Liberté House 19-23 La Motte Street St. Helier Jersey JE2 4SY Channel Islands
This document is for information purposes only and it does not form part of the Investment Solutions Strategic Global Fund (the “Fund”) Prospectus, and does not constitute an invitation to subscribe for Units in the Fund. The matters set out herein should not be relied upon for the purposes of making an investment in the Fund. The Fund is an open-ended unit trust, which was established in Jersey on 28 April 1997 as an unclassified fund. The Fund is an unregulated collective investment scheme in the UK and its promotion in the UK is restricted by the Financial Services Act 1986. Unclassified funds are not covered by the Compensation for Investors (Jersey) Regulations 1988. Collective investment schemes (unit trusts) are generally medium- to long-term investments. There is no assurance that the investment objectives of the Fund will actually be achieved. The value of participatory interests (units) may go down as well as up and past investment returns are not necessarily indicative of future returns. The portfolio performance is calculated on a NAV to NAV basis and does not take any initial fees into account. Actual portfolio performance will differ based on the initial fees applicable, the actual investment date and the date of reinvestment of income. Past performance is not necessarily an indication of future performance. Investors are reminded that an investment in a currency other than their own may expose them to a foreign exchange risk. If an investment in the Fund is redeemed at an early stage, the preliminary charge paid upon purchase of Units may exceed any return on the investment in which case investors will not receive the full amount of their original investment. Unit trusts are traded at ruling prices and can engage in borrowing and securities lending. Forward pricing is used. Commission and incentives may be paid and, if so, would be included in the overall costs. The unit trust may borrow up to 10% of the Net Asset Value of the Class Fund to bridge insufficient liquidity. The unit trusts are valued at the end of the day and at their final closing prices. Unitholders may agree to pay additional ongoing advice fees to their appointed financial planners. Completed Application Forms and notification of deposits must be received before 11h00 Jersey time for the investment to be executed on that day. If received after the applicable cut-off time, the money will be invested at the buying price of the next day. The 11h00 Jersey time cut-off time also applies to redemptions and switches. The Class Funds that are Feeder Funds only invest in participatory interests of a single underlying collective investment scheme portfolio. The Class Funds that are Fund of Funds only invest in participatory interests of more than one underlying collective investment scheme portfolio, which levy their own charges, which could result in a higher fee structure. The Class Funds are accumulation funds and do not distribute income. At the time of going to press the above information was correct. However, the information is subject to change. A prospectus is available upon request from Investment Solutions (Jersey) Limited (“the Manager”). South African Investors should review the Schedule of Similarities and Differences (“the Schedule”), reflecting the key differences and similarities between the regulations applicable to the Investment Solutions Strategic Global Fund, and those applicable to South African registered Collective Investment Schemes. The Schedule is available for inspection on www.investmentsolutions.co.za. The interests of directors and management are available on request from the manager. The Manager and the Trustee are regulated by the Jersey Financial Services Commission for the conduct of fund services business. Investment Solutions Limited is a member of the Association for Savings and Investments in South Africa.