16
Putting Wealth To Work For Generations Prepared by the Equities Team Investment Strategy Group Equities February 2022
Putting Wealth To Work For Generations
Prepared by the Equities Team
Investment Strategy Group Equities
February 2022
Contents1. Equities Investment Philosophy 3
2. Domestic Equities Investment Process 4
3. How we define Quality 6
4. Valuation and Position Sizing 7
5. Portfolio Construction 7
6. Risk Management 8
7. JBWere Model Portfolios 9
8. International Model Portfolio InvestmentProcess
12
9. JBWere International Model Portfolio 13
10. Equities Team 14
3 JBWere Investment Strategy Group Equities
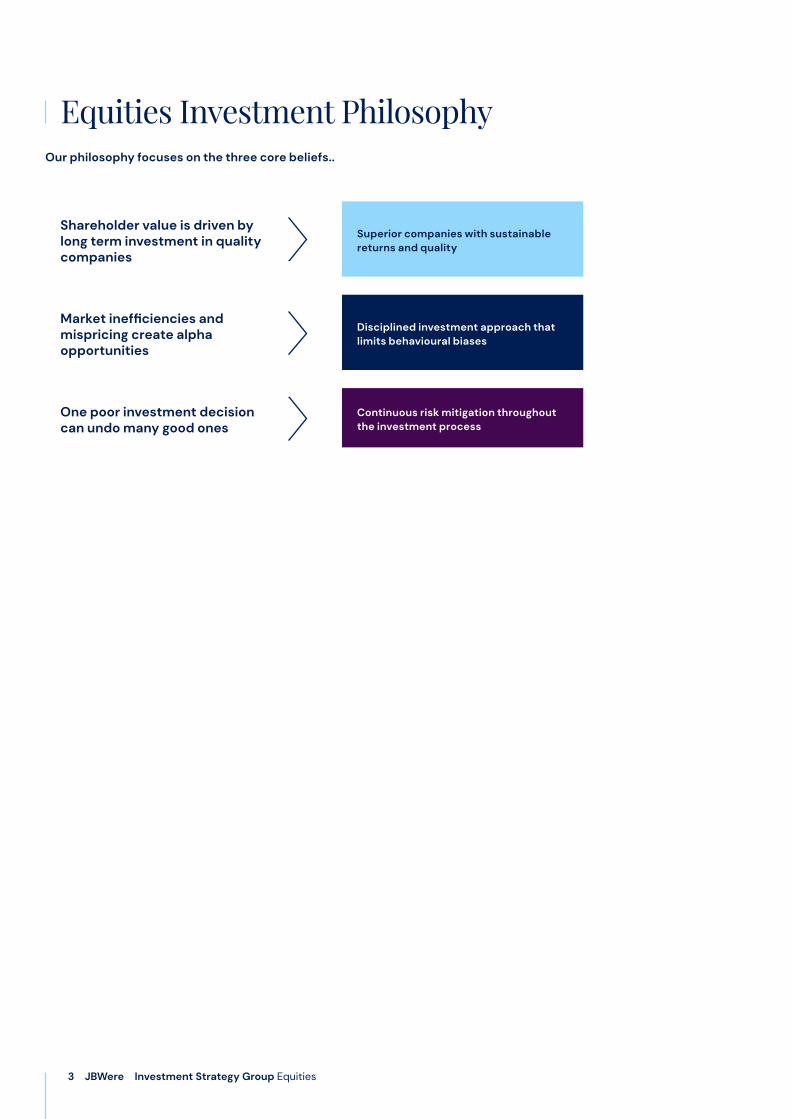
Equities Investment PhilosophyOur philosophy focuses on the three core beliefs..
Shareholder value is driven by long term investment in quality companies
Superior companies with sustainable returns and quality
Market inefficiencies and mispricing create alpha opportunities
Disciplined investment approach that limits behavioural biases
One poor investment decision can undo many good ones
Continuous risk mitigation throughout the investment process
4 JBWere Investment Strategy Group Equities
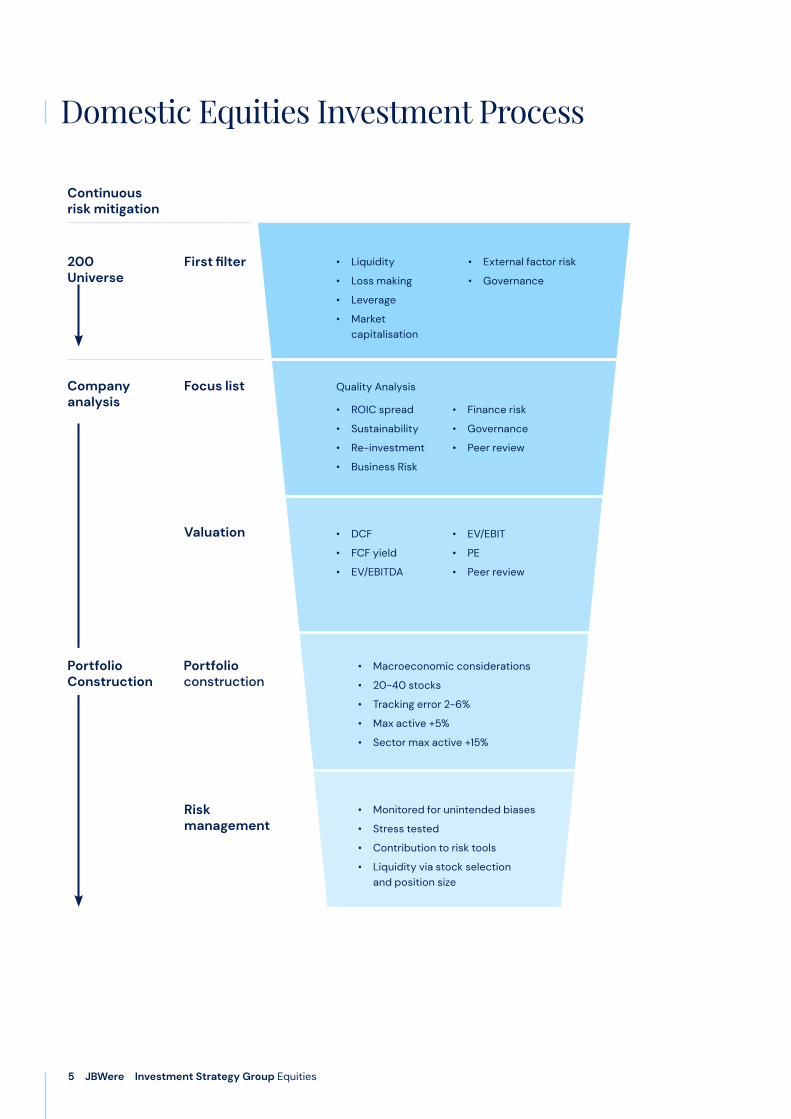
Domestic Equities Investment ProcessJBWere is an active stock picker and our investment philosophy focuses on three core beliefs. First, shareholder value is driven by long term investment in quality companies. Secondly, we believe the market is inefficient and emotive, requiring a disciplined investment approach, that limits behavioral biases. Finally, we believe one poor investment decision can undo many good ones, so we address capital preservation by working to reduce risk throughout each stage of the investment process. The process involves initial screening of securities based on liquidity, profitability, leverage, market capitalisation, governance and outsized external factor risks. Once these filters have been applied, we conduct in-depth analysis of the remaining stocks to assess whether a company meets our quality hurdle.
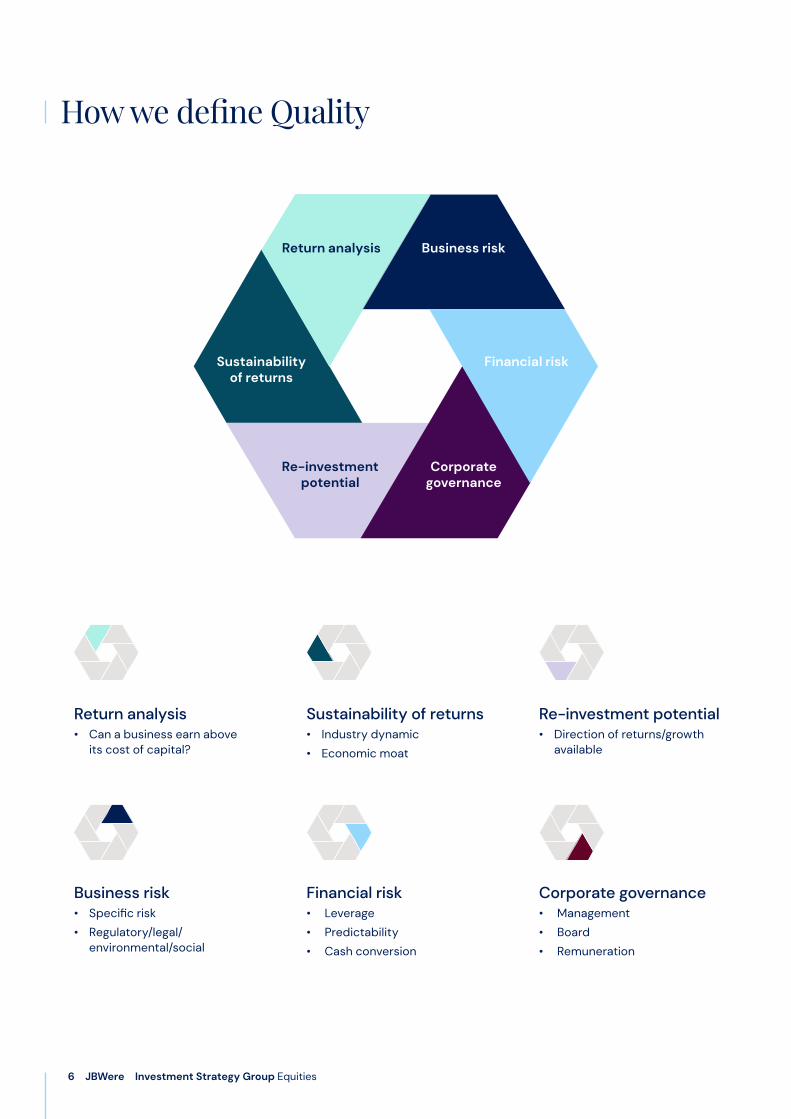
The six key factors used to determine quality are:1. Return on invested capital and whether through history it is above or below cost of capital.
2. The sustainability of these returns by considering the structure and dynamics of the industry and whether there is the existence of a competitive advantage.
3. Re-investment potential which is essentially the ability of a company to invest its capital going forward at above cost of capital returns coupled with the size of the growth opportunity. This step considers Porter’s Five Forces analysis, business model, business strategy and an assessment of competitive advantage to consider how these dynamics translate into the future earnings of the business.
4. Business risk considers risks specific to the company like execution or key man risk and also regulatory, legal, environmental and social risks.
5. Financial risk looks to the leverage of the balance sheet in concert with predictability of earnings and cash conversion.
6. Corporate governance includes Management track record and transparency but goes further and considers board structures, incentive structures, diversity and alignment consistency.
This results in the Focus List which is a superior subset of those stocks that pass the Quality hurdle and Peer Review by the Equities team. We then undertake a valuation assessment per focus list stock, derived for a combination of relevant tools including DCF (Discounted Cash Flows), EV/EBITDA (Enterprise Value/Earnings Before Interest, Tax, Depreciation and Amortisation), EV/EBIT (Enterprise Value/Earnings Before Interest and Tax), PER (Price Earnings Ratio) and other quantitative factors. Further Peer Review around valuation assumptions is conducted at this point.
Portfolio construction is derived as a combination of the quality and valuation described above coupled with our macro-economic view. Fundamental to our investment process is the recognition that the higher the quality of a company, the lower the return hurdle required to invest and vice versa. Adjustments to position sizing may be made based on conviction, liquidity and the impact on the overall portfolio, combined with our macroeconomic view.
We consider each company’s appropriateness in the context of its inclusion in the overall model portfolio (each of which are detailed later in this document), which is constructed to reduce downside volatility and aggregate inherent risks such as interest rate risk, macroeconomic event risk, FX risk and other portfolio biases. Our goal is to understand as much as possible the behavior of our portfolio under changing market conditions and avoid unintended biases. We stress test our portfolio under various scenarios to ensure the overall portfolio is not correlated to any one particular industry or sector and is not excessively exposed to any one macroeconomic factor and is relatively liquid.
5 JBWere Investment Strategy Group Equities
Domestic Equities Investment Process
200 Universe
Continuous risk mitigation
Portfolio Construction
Company analysis
• Monitored for unintended biases
• Stress tested
• Contribution to risk tools
• Liquidity via stock selection and position size
• Liquidity
• Loss making
• Leverage
• Market capitalisation
• External factor risk
• Governance
First filter
Focus list
Valuation
Portfolio construction
Quality Analysis
• ROIC spread
• Sustainability
• Re-investment
• Business Risk
• Finance risk
• Governance
• Peer review
• DCF
• FCF yield
• EV/EBITDA
• EV/EBIT
• PE
• Peer review
• Macroeconomic considerations
• 20-40 stocks
• Tracking error 2-6%
• Max active +5%
• Sector max active +15%
Risk management
6 JBWere Investment Strategy Group Equities
How we define Quality
Business riskReturn analysis
Financial risk
Corporate governance
Re-investment potential
Sustainability of returns
Return analysis• Can a business earn above
its cost of capital?
Business risk• Specific risk
• Regulatory/legal/ environmental/social
Sustainability of returns• Industry dynamic
• Economic moat
Financial risk• Leverage
• Predictability
• Cash conversion
Re-investment potential• Direction of returns/growth
available
Corporate governance• Management
• Board
• Remuneration
Valuation and Position Sizing
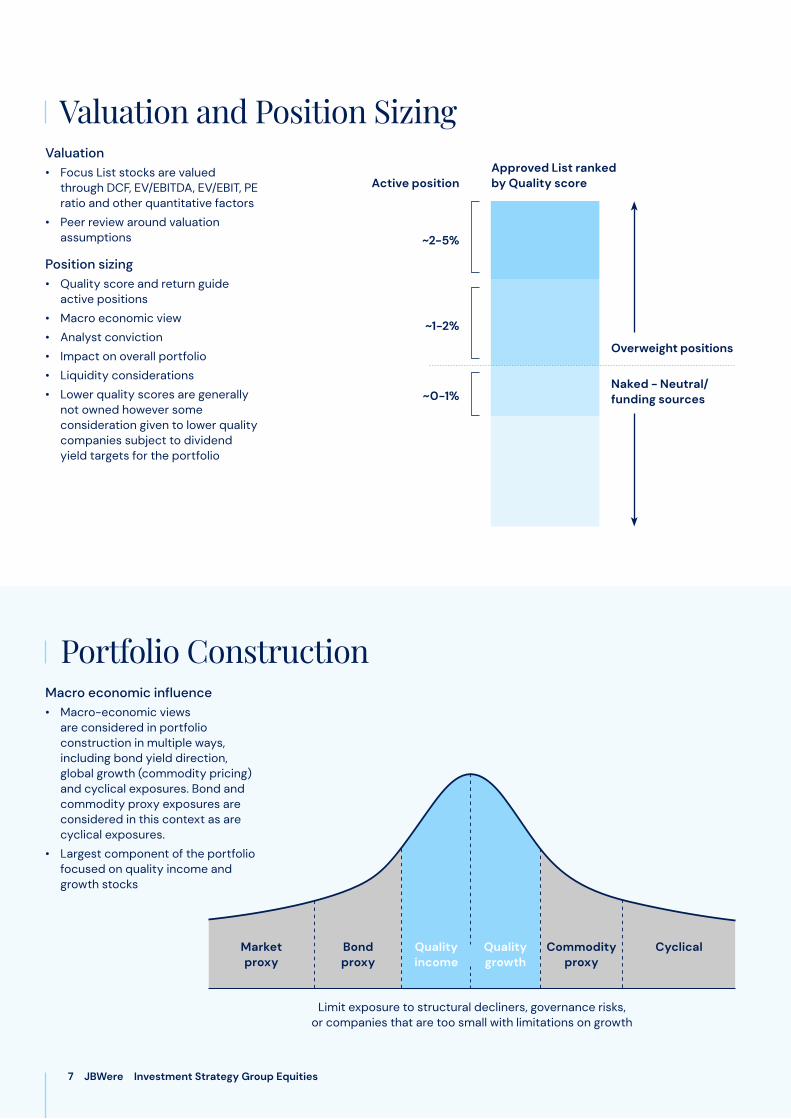
Portfolio ConstructionMacro economic influence• Macro-economic views
are considered in portfolio construction in multiple ways, including bond yield direction, global growth (commodity pricing) and cyclical exposures. Bond and commodity proxy exposures are considered in this context as are cyclical exposures.
• Largest component of the portfolio focused on quality income and growth stocks
Valuation• Focus List stocks are valued
through DCF, EV/EBITDA, EV/EBIT, PE ratio and other quantitative factors
• Peer review around valuation assumptions
Position sizing• Quality score and return guide
active positions
• Macro economic view
• Analyst conviction
• Impact on overall portfolio
• Liquidity considerations
• Lower quality scores are generally not owned however some consideration given to lower quality companies subject to dividend yield targets for the portfolio
~2-5%
~1-2%
~0-1%
Approved List ranked by Quality scoreActive position
Overweight positions
Naked - Neutral/funding sources
Limit exposure to structural decliners, governance risks, or companies that are too small with limitations on growth
Market proxy
Bond proxy
Quality income
Quality growth
Commodity proxy
Cyclical
7 JBWere Investment Strategy Group Equities
8 JBWere Investment Strategy Group Equities
Risk ManagementMulti-layered risk mitigation through each stage of the investment process to:• Seek to bypass poor quality companies
• Ensure valuation discipline so as to avoid overpaying for good quality companies
• Minimise negative surprises
• Avoid excessive exposure to any one factor
• Stress testing utilised
• Contribution to risk per stock considered
9 JBWere Investment Strategy Group Equities
JBWere Model Portfolios
Model Portfolio Investment Objective Investment Strategy Purpose
Stock Count
Tracking Error Turnover
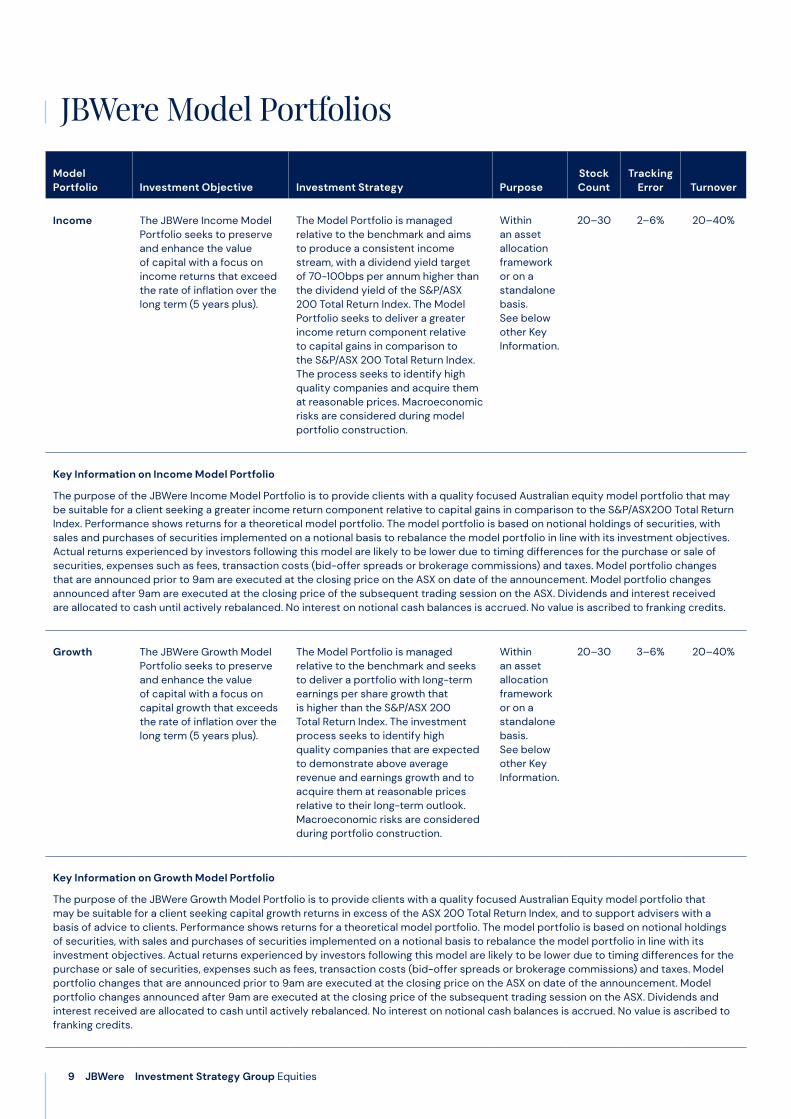
Income The JBWere Income Model Portfolio seeks to preserve and enhance the value of capital with a focus on income returns that exceed the rate of inflation over the long term (5 years plus).
The Model Portfolio is managed relative to the benchmark and aims to produce a consistent income stream, with a dividend yield target of 70-100bps per annum higher than the dividend yield of the S&P/ASX 200 Total Return Index. The Model Portfolio seeks to deliver a greater income return component relative to capital gains in comparison to the S&P/ASX 200 Total Return Index. The process seeks to identify high quality companies and acquire them at reasonable prices. Macroeconomic risks are considered during model portfolio construction.
Within an asset allocation framework or on a standalone basis. See below other Key Information.
20–30 2–6% 20–40%
Key Information on Income Model Portfolio
The purpose of the JBWere Income Model Portfolio is to provide clients with a quality focused Australian equity model portfolio that may be suitable for a client seeking a greater income return component relative to capital gains in comparison to the S&P/ASX200 Total Return Index. Performance shows returns for a theoretical model portfolio. The model portfolio is based on notional holdings of securities, with sales and purchases of securities implemented on a notional basis to rebalance the model portfolio in line with its investment objectives. Actual returns experienced by investors following this model are likely to be lower due to timing differences for the purchase or sale of securities, expenses such as fees, transaction costs (bid-offer spreads or brokerage commissions) and taxes. Model portfolio changes that are announced prior to 9am are executed at the closing price on the ASX on date of the announcement. Model portfolio changes announced after 9am are executed at the closing price of the subsequent trading session on the ASX. Dividends and interest received are allocated to cash until actively rebalanced. No interest on notional cash balances is accrued. No value is ascribed to franking credits.
Growth The JBWere Growth Model Portfolio seeks to preserve and enhance the value of capital with a focus on capital growth that exceeds the rate of inflation over the long term (5 years plus).
The Model Portfolio is managed relative to the benchmark and seeks to deliver a portfolio with long-term earnings per share growth that is higher than the S&P/ASX 200 Total Return Index. The investment process seeks to identify high quality companies that are expected to demonstrate above average revenue and earnings growth and to acquire them at reasonable prices relative to their long-term outlook. Macroeconomic risks are considered during portfolio construction.
Within an asset allocation framework or on a standalone basis. See below other Key Information.
20–30 3–6% 20–40%
Key Information on Growth Model Portfolio
The purpose of the JBWere Growth Model Portfolio is to provide clients with a quality focused Australian Equity model portfolio that may be suitable for a client seeking capital growth returns in excess of the ASX 200 Total Return Index, and to support advisers with a basis of advice to clients. Performance shows returns for a theoretical model portfolio. The model portfolio is based on notional holdings of securities, with sales and purchases of securities implemented on a notional basis to rebalance the model portfolio in line with its investment objectives. Actual returns experienced by investors following this model are likely to be lower due to timing differences for the purchase or sale of securities, expenses such as fees, transaction costs (bid-offer spreads or brokerage commissions) and taxes. Model portfolio changes that are announced prior to 9am are executed at the closing price on the ASX on date of the announcement. Model portfolio changes announced after 9am are executed at the closing price of the subsequent trading session on the ASX. Dividends and interest received are allocated to cash until actively rebalanced. No interest on notional cash balances is accrued. No value is ascribed to franking credits.
10 JBWere Investment Strategy Group Equities
Model Portfolio Investment Objective Investment Strategy Purpose
Stock Count
Tracking Error Turnover
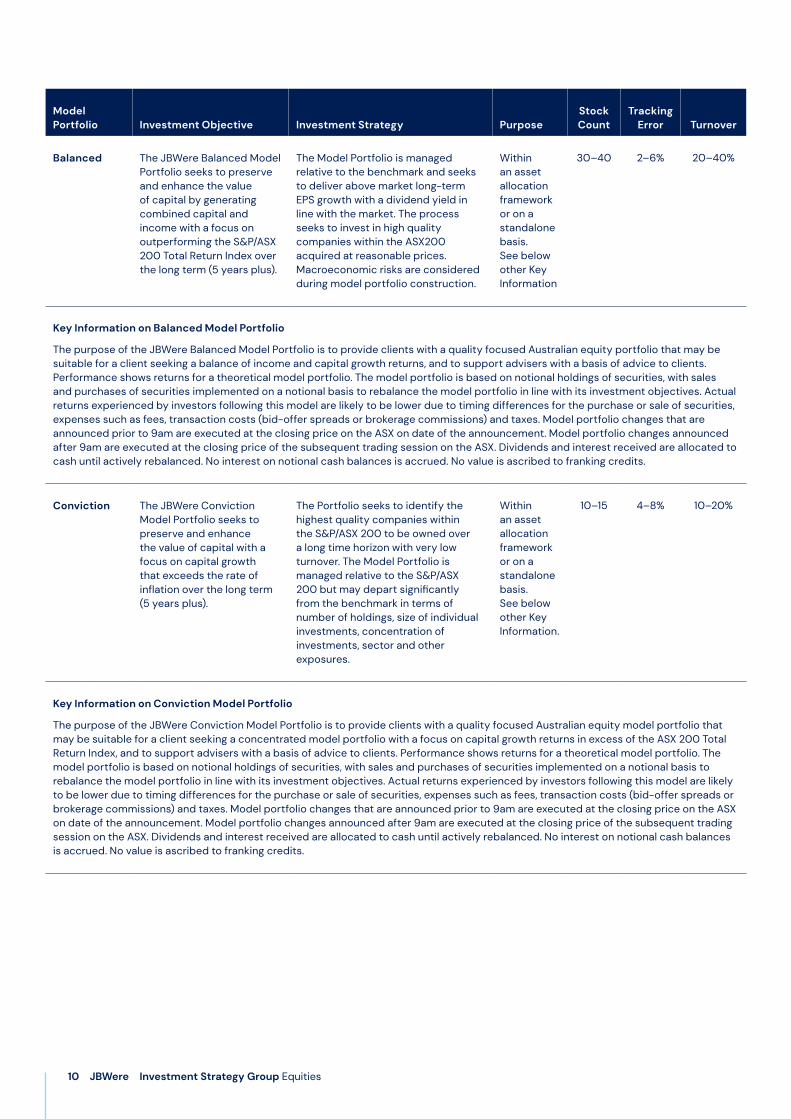
Balanced The JBWere Balanced Model Portfolio seeks to preserve and enhance the value of capital by generating combined capital and income with a focus on outperforming the S&P/ASX 200 Total Return Index over the long term (5 years plus).
The Model Portfolio is managed relative to the benchmark and seeks to deliver above market long-term EPS growth with a dividend yield in line with the market. The process seeks to invest in high quality companies within the ASX200 acquired at reasonable prices. Macroeconomic risks are considered during model portfolio construction.
Within an asset allocation framework or on a standalone basis. See below other Key Information
30–40 2–6% 20–40%
Key Information on Balanced Model Portfolio
The purpose of the JBWere Balanced Model Portfolio is to provide clients with a quality focused Australian equity portfolio that may be suitable for a client seeking a balance of income and capital growth returns, and to support advisers with a basis of advice to clients. Performance shows returns for a theoretical model portfolio. The model portfolio is based on notional holdings of securities, with sales and purchases of securities implemented on a notional basis to rebalance the model portfolio in line with its investment objectives. Actual returns experienced by investors following this model are likely to be lower due to timing differences for the purchase or sale of securities, expenses such as fees, transaction costs (bid-offer spreads or brokerage commissions) and taxes. Model portfolio changes that are announced prior to 9am are executed at the closing price on the ASX on date of the announcement. Model portfolio changes announced after 9am are executed at the closing price of the subsequent trading session on the ASX. Dividends and interest received are allocated to cash until actively rebalanced. No interest on notional cash balances is accrued. No value is ascribed to franking credits.
Conviction The JBWere Conviction Model Portfolio seeks to preserve and enhance the value of capital with a focus on capital growth that exceeds the rate of inflation over the long term (5 years plus).
The Portfolio seeks to identify the highest quality companies within the S&P/ASX 200 to be owned over a long time horizon with very low turnover. The Model Portfolio is managed relative to the S&P/ASX 200 but may depart significantly from the benchmark in terms of number of holdings, size of individual investments, concentration of investments, sector and other exposures.
Within an asset allocation framework or on a standalone basis. See below other Key Information.
10–15 4–8% 10–20%
Key Information on Conviction Model Portfolio
The purpose of the JBWere Conviction Model Portfolio is to provide clients with a quality focused Australian equity model portfolio that may be suitable for a client seeking a concentrated model portfolio with a focus on capital growth returns in excess of the ASX 200 Total Return Index, and to support advisers with a basis of advice to clients. Performance shows returns for a theoretical model portfolio. The model portfolio is based on notional holdings of securities, with sales and purchases of securities implemented on a notional basis to rebalance the model portfolio in line with its investment objectives. Actual returns experienced by investors following this model are likely to be lower due to timing differences for the purchase or sale of securities, expenses such as fees, transaction costs (bid-offer spreads or brokerage commissions) and taxes. Model portfolio changes that are announced prior to 9am are executed at the closing price on the ASX on date of the announcement. Model portfolio changes announced after 9am are executed at the closing price of the subsequent trading session on the ASX. Dividends and interest received are allocated to cash until actively rebalanced. No interest on notional cash balances is accrued. No value is ascribed to franking credits.
11 JBWere Investment Strategy Group Equities
Model Portfolio Investment Objective Investment Strategy Purpose
Stock Count
Tracking Error Turnover
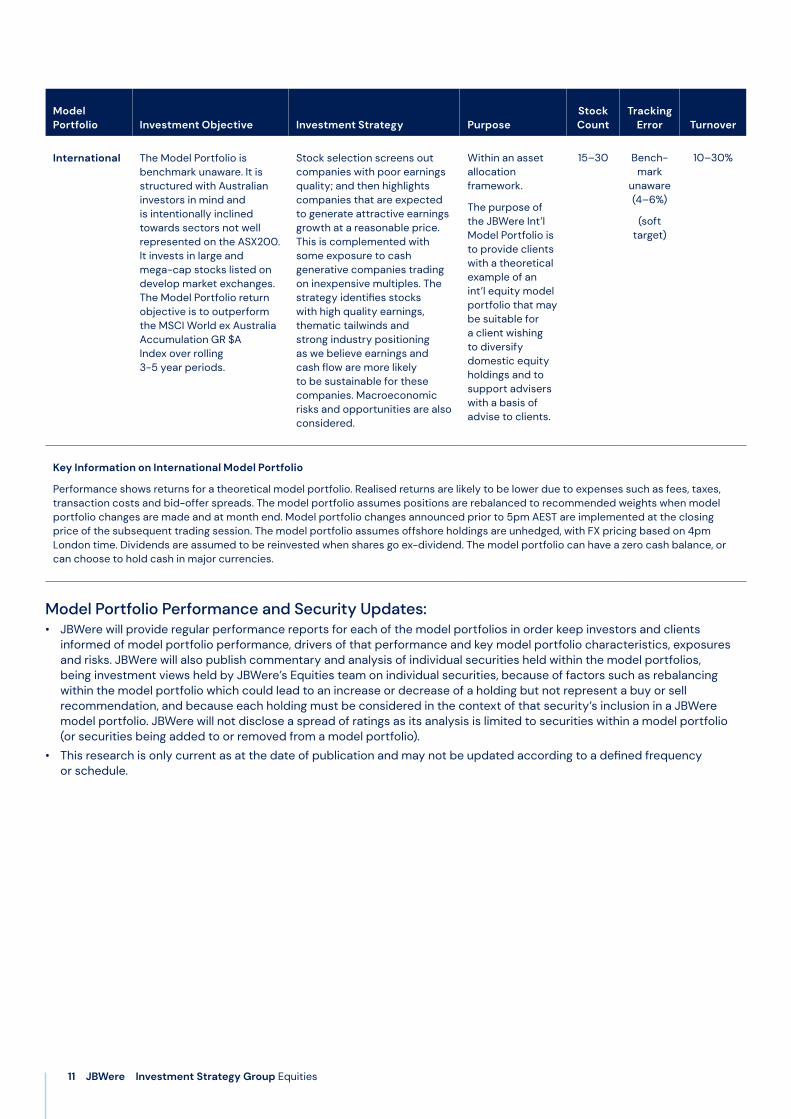
International The Model Portfolio is benchmark unaware. It is structured with Australian investors in mind and is intentionally inclined towards sectors not well represented on the ASX200. It invests in large and mega-cap stocks listed on develop market exchanges. The Model Portfolio return objective is to outperform the MSCI World ex Australia Accumulation GR $A Index over rolling 3-5 year periods.
Stock selection screens out companies with poor earnings quality; and then highlights companies that are expected to generate attractive earnings growth at a reasonable price. This is complemented with some exposure to cash generative companies trading on inexpensive multiples. The strategy identifies stocks with high quality earnings, thematic tailwinds and strong industry positioning as we believe earnings and cash flow are more likely to be sustainable for these companies. Macroeconomic risks and opportunities are also considered.
Within an asset allocation framework.
The purpose of the JBWere Int’l Model Portfolio is to provide clients with a theoretical example of an int’l equity model portfolio that may be suitable for a client wishing to diversify domestic equity holdings and to support advisers with a basis of advise to clients.
15–30 Bench- mark
unaware (4–6%)
(soft target)
10–30%
Key Information on International Model Portfolio
Performance shows returns for a theoretical model portfolio. Realised returns are likely to be lower due to expenses such as fees, taxes, transaction costs and bid-offer spreads. The model portfolio assumes positions are rebalanced to recommended weights when model portfolio changes are made and at month end. Model portfolio changes announced prior to 5pm AEST are implemented at the closing price of the subsequent trading session. The model portfolio assumes offshore holdings are unhedged, with FX pricing based on 4pm London time. Dividends are assumed to be reinvested when shares go ex-dividend. The model portfolio can have a zero cash balance, or can choose to hold cash in major currencies.
Model Portfolio Performance and Security Updates:• JBWere will provide regular performance reports for each of the model portfolios in order keep investors and clients
informed of model portfolio performance, drivers of that performance and key model portfolio characteristics, exposuresand risks. JBWere will also publish commentary and analysis of individual securities held within the model portfolios,being investment views held by JBWere’s Equities team on individual securities, because of factors such as rebalancingwithin the model portfolio which could lead to an increase or decrease of a holding but not represent a buy or sellrecommendation, and because each holding must be considered in the context of that security’s inclusion in a JBWeremodel portfolio. JBWere will not disclose a spread of ratings as its analysis is limited to securities within a model portfolio(or securities being added to or removed from a model portfolio).
• This research is only current as at the date of publication and may not be updated according to a defined frequencyor schedule.
12 JBWere Investment Strategy Group Equities
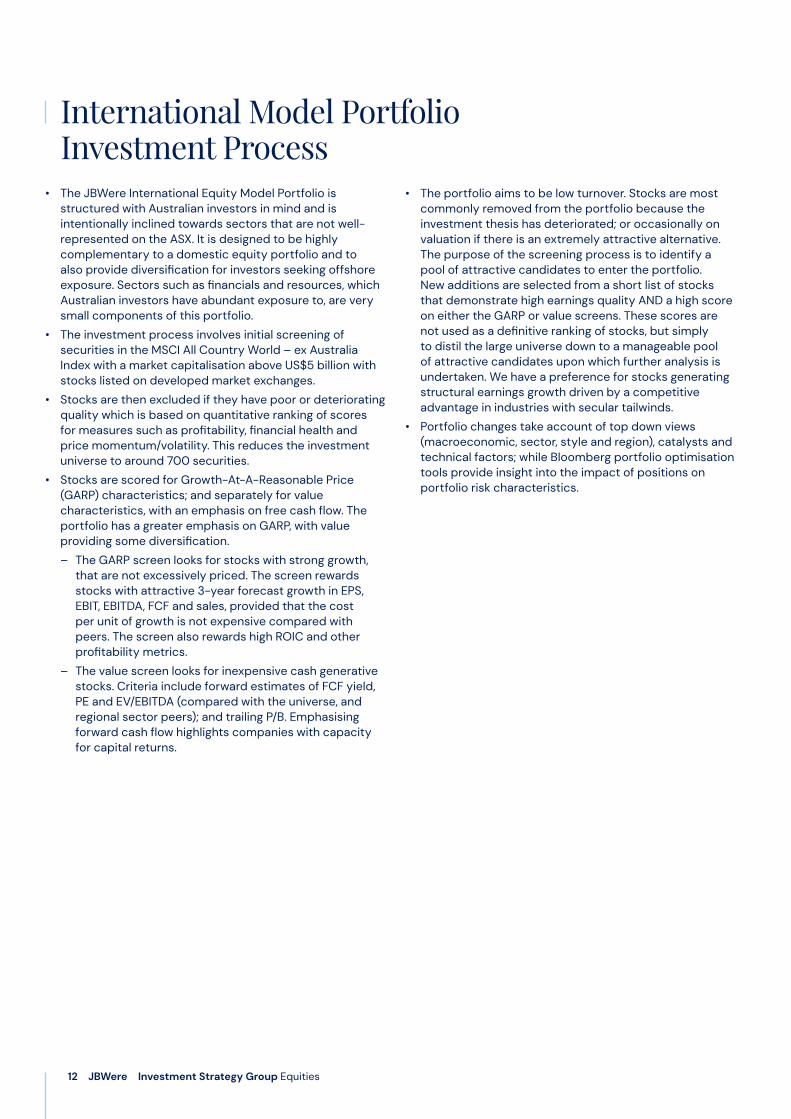
International Model Portfolio Investment Process
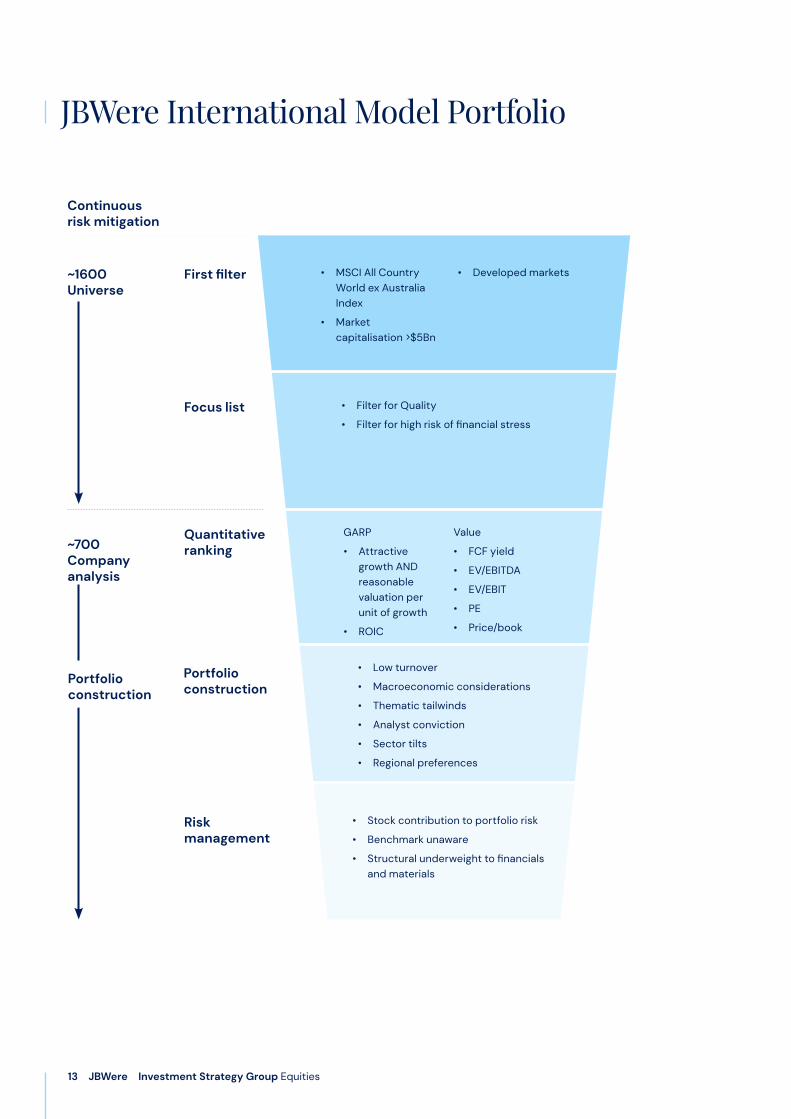
• The JBWere International Equity Model Portfolio is structured with Australian investors in mind and is intentionally inclined towards sectors that are not well-represented on the ASX. It is designed to be highly complementary to a domestic equity portfolio and to also provide diversification for investors seeking offshore exposure. Sectors such as financials and resources, which Australian investors have abundant exposure to, are very small components of this portfolio.
• The investment process involves initial screening of securities in the MSCI All Country World – ex Australia Index with a market capitalisation above US$5 billion with stocks listed on developed market exchanges.
• Stocks are then excluded if they have poor or deteriorating quality which is based on quantitative ranking of scores for measures such as profitability, financial health and price momentum/volatility. This reduces the investment universe to around 700 securities.
• Stocks are scored for Growth-At-A-Reasonable Price (GARP) characteristics; and separately for value characteristics, with an emphasis on free cash flow. The portfolio has a greater emphasis on GARP, with value providing some diversification.
– The GARP screen looks for stocks with strong growth, that are not excessively priced. The screen rewards stocks with attractive 3-year forecast growth in EPS, EBIT, EBITDA, FCF and sales, provided that the cost per unit of growth is not expensive compared with peers. The screen also rewards high ROIC and other profitability metrics.
– The value screen looks for inexpensive cash generative stocks. Criteria include forward estimates of FCF yield, PE and EV/EBITDA (compared with the universe, and regional sector peers); and trailing P/B. Emphasising forward cash flow highlights companies with capacity for capital returns.
• The portfolio aims to be low turnover. Stocks are most commonly removed from the portfolio because the investment thesis has deteriorated; or occasionally on valuation if there is an extremely attractive alternative. The purpose of the screening process is to identify a pool of attractive candidates to enter the portfolio. New additions are selected from a short list of stocks that demonstrate high earnings quality AND a high score on either the GARP or value screens. These scores are not used as a definitive ranking of stocks, but simply to distil the large universe down to a manageable pool of attractive candidates upon which further analysis is undertaken. We have a preference for stocks generating structural earnings growth driven by a competitive advantage in industries with secular tailwinds.
• Portfolio changes take account of top down views (macroeconomic, sector, style and region), catalysts and technical factors; while Bloomberg portfolio optimisation tools provide insight into the impact of positions on portfolio risk characteristics.
13 JBWere Investment Strategy Group Equities
~1600 Universe
Continuous risk mitigation
~700 Company analysis
• Stock contribution to portfolio risk
• Benchmark unaware
• Structural underweight to financialsand materials
• MSCI All CountryWorld ex AustraliaIndex
• Marketcapitalisation >$5Bn
• Developed marketsFirst filter
Focus list
Quantitative ranking
Portfolio construction
• Filter for Quality
• Filter for high risk of financial stress
GARP
• Attractivegrowth ANDreasonablevaluation perunit of growth
• ROIC
Value
• FCF yield
• EV/EBITDA
• EV/EBIT
• PE
• Price/book
• Low turnover
• Macroeconomic considerations
• Thematic tailwinds
• Analyst conviction
• Sector tilts
• Regional preferences
Risk management
JBWere International Model Portfolio
Portfolio construction
14 JBWere Investment Strategy Group Equities
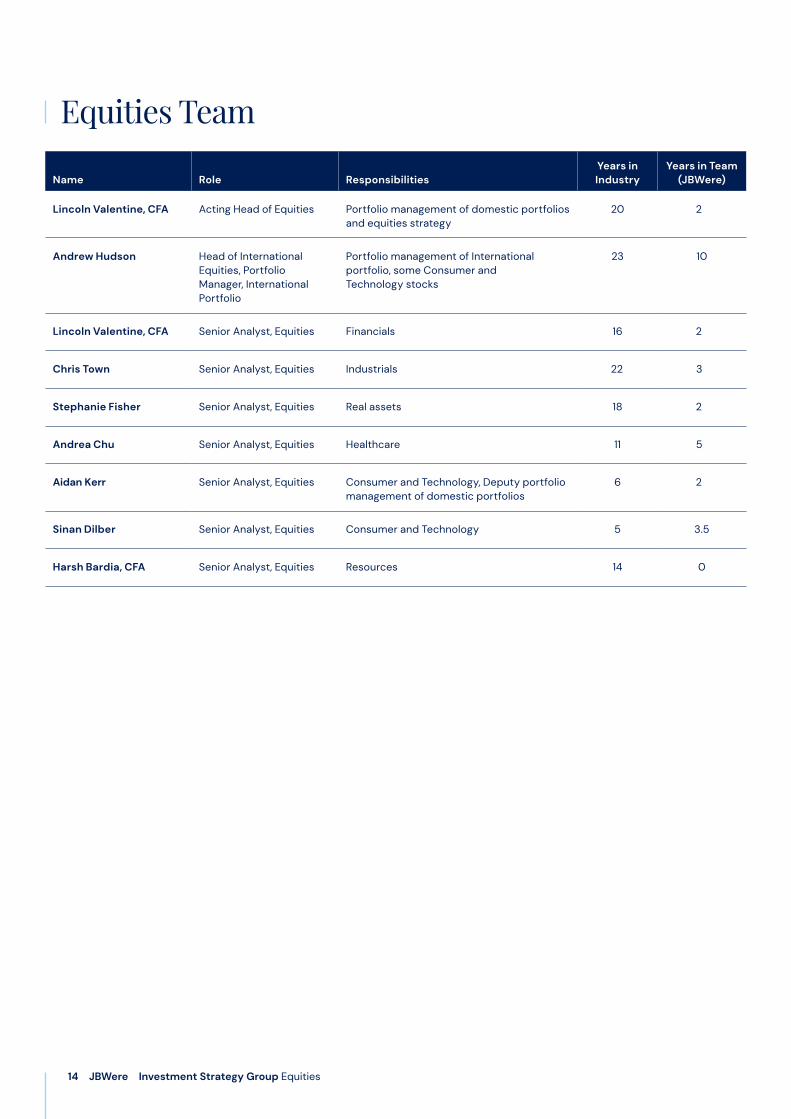
Equities Team
Name Role ResponsibilitiesYears in Industry
Years in Team (JBWere)
Lincoln Valentine, CFA Acting Head of Equities Portfolio management of domestic portfolios and equities strategy
20 2
Andrew Hudson Head of International Equities, Portfolio Manager, International Portfolio
Portfolio management of International portfolio, some Consumer and Technology stocks
23 10
Lincoln Valentine, CFA Senior Analyst, Equities Financials 16 2
Chris Town Senior Analyst, Equities Industrials 22 3
Stephanie Fisher Senior Analyst, Equities Real assets 18 2
Andrea Chu Senior Analyst, Equities Healthcare 11 5
Aidan Kerr Senior Analyst, Equities Consumer and Technology, Deputy portfolio management of domestic portfolios
6 2
Sinan Dilber Senior Analyst, Equities Consumer and Technology 5 3.5
Harsh Bardia, CFA Senior Analyst, Equities Resources 14 0
15 JBWere Investment Strategy Group Equities
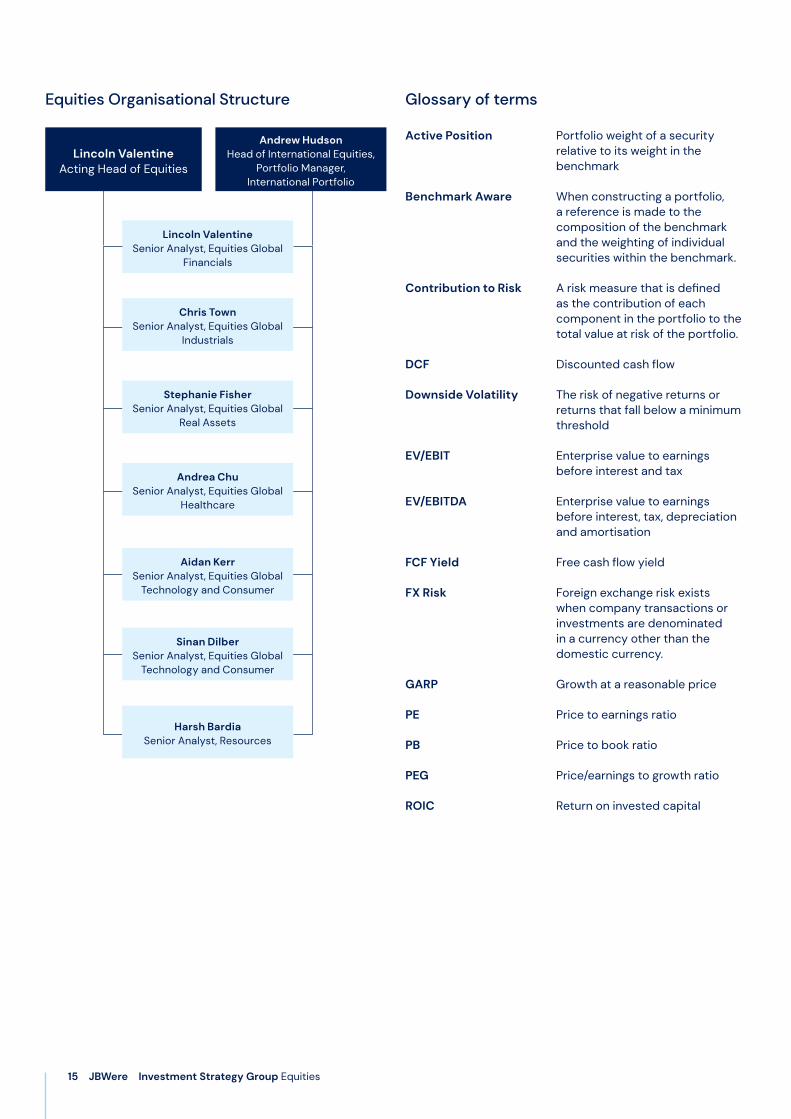
Andrew HudsonHead of International Equities,
Portfolio Manager, International Portfolio
Lincoln Valentine Senior Analyst, Equities Global
Financials
Equities Organisational Structure
Lincoln ValentineActing Head of Equities
Glossary of terms
Active Position Portfolio weight of a security relative to its weight in the benchmark
Benchmark Aware When constructing a portfolio, a reference is made to the composition of the benchmark and the weighting of individual securities within the benchmark.
Contribution to Risk A risk measure that is defined as the contribution of each component in the portfolio to the total value at risk of the portfolio.
DCF Discounted cash flow
Downside Volatility The risk of negative returns or returns that fall below a minimum threshold
EV/EBIT Enterprise value to earnings before interest and tax
EV/EBITDA Enterprise value to earnings before interest, tax, depreciation and amortisation
FCF Yield Free cash flow yield
FX Risk Foreign exchange risk exists when company transactions or investments are denominated in a currency other than the domestic currency.
GARP Growth at a reasonable price
PE Price to earnings ratio
PB Price to book ratio
PEG Price/earnings to growth ratio
ROIC Return on invested capital
Chris TownSenior Analyst, Equities Global
Industrials
Stephanie FisherSenior Analyst, Equities Global
Real Assets
Andrea ChuSenior Analyst, Equities Global
Healthcare
Aidan KerrSenior Analyst, Equities Global
Technology and Consumer
Sinan DilberSenior Analyst, Equities Global
Technology and Consumer
Harsh BardiaSenior Analyst, Resources
Important noticeThis document has been prepared by JBWere Limited (JBWere) and comprises general advice only. In preparing it, JBWere did not take into account your investment objectives, financial situation or particular needs (‘financial circumstances’). Accordingly, before acting on any advice contained in this report, you should consider whether the advice is appropriate in light of your financial circumstances or contact your adviser. JBWere recommends that you obtain and consider the relevant Product Disclosure Statement or other disclosure document, where relevant, before deciding whether to acquire or to continue to hold any particular product mentioned in this report.
Ownership and Material Conflicts of Interest
In the last twelve months, JBWere has played a role in transactions for certain entities which may be referred to in this report. For details, refer to JBWere’s Deal Flow Participation.
Further information about the Conflicts of Interest related to research reports, and how JBWere maintains integrity of research, please refer to the Managing Conflicts of Interest and Maintaining the Integrity of Research Policy.
General Disclosures
This document is not an offer to sell or the solicitation of an offer to buy any financial product or service in any jurisdiction where such an offer or solicitation would be illegal. The information contained in this report is subject to change without notice.
General Disclaimer
So far as laws and regulatory requirements permit, JBWere, its related companies, associated entities and any officer, employee, agent, adviser or contractor thereof (the “JBWere Group”) does not warrant or represent that the information, recommendations, opinions or conclusions contained in this report (“Information”) is accurate, reliable, complete or current and it should not be relied on as such. The Information is indicative and prepared for information purposes only and does not purport to contain all matters relevant to any particular investment or financial instrument. Subject to any terms implied by law and which cannot be excluded, the JBWere Group shall not be liable for any errors, omissions, defects or misrepresentations in this report (including by reasons of negligence, negligent misstatement or otherwise) or for any loss or damage (whether direct or indirect) suffered by persons who use or rely on the Information. If any law prohibits the exclusion of such liability, the JBWere Group limits its liability to the re-supply of the Information, provided that such limitation is permitted by law and is fair and reasonable.
Please refer to the full details of the important disclosures, available in the Disclosures section of the JBWere Limited website.
Issued by JBWere Ltd ABN 68 137 978 360 AFSL 341162 J10
070
5-0
222
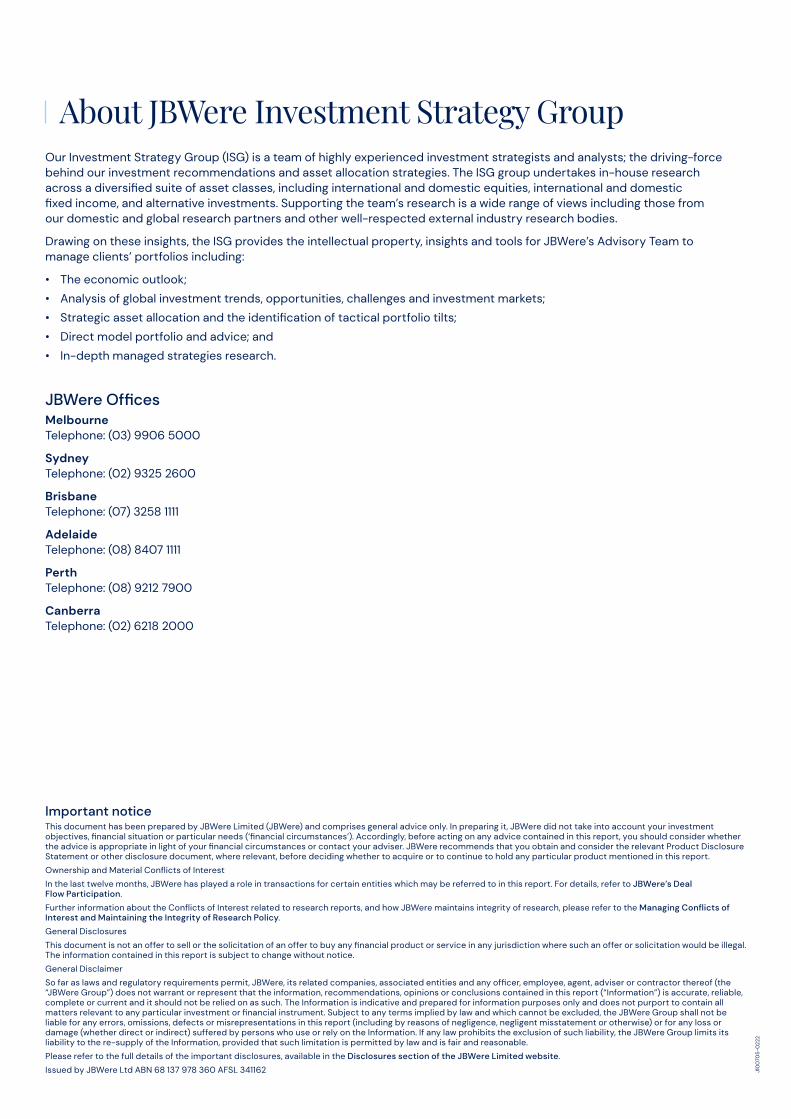
JBWere OfficesMelbourne Telephone: (03) 9906 5000
Sydney Telephone: (02) 9325 2600
Brisbane Telephone: (07) 3258 1111
Adelaide Telephone: (08) 8407 1111
Perth Telephone: (08) 9212 7900
Canberra Telephone: (02) 6218 2000
About JBWere Investment Strategy GroupOur Investment Strategy Group (ISG) is a team of highly experienced investment strategists and analysts; the driving-force behind our investment recommendations and asset allocation strategies. The ISG group undertakes in-house research across a diversified suite of asset classes, including international and domestic equities, international and domestic fixed income, and alternative investments. Supporting the team’s research is a wide range of views including those from our domestic and global research partners and other well-respected external industry research bodies.
Drawing on these insights, the ISG provides the intellectual property, insights and tools for JBWere’s Advisory Team to manage clients’ portfolios including:
• The economic outlook;
• Analysis of global investment trends, opportunities, challenges and investment markets;
• Strategic asset allocation and the identification of tactical portfolio tilts;
• Direct model portfolio and advice; and
• In-depth managed strategies research.


