- 1 - Investment Style and Performance in The Global Real Estate Mutual Fund Market Piet Eichholtz Maastricht University Nils Kok Maastricht University Milena Margaritova Redevco Europe Second Draft March 2009 Preliminary, not for quotation Abstract This paper investigates the performance of 402 real estate mutual funds worldwide during the period from March 1997 through April 2007. With the exception of funds targeting Asia, these funds generally adhere to their stated investment mandate, while global funds are mostly invested in the United States and the United Kingdom. Between 72 percent and 92 percent of the performance of these funds can be attributed to investment style. Grouped per region, real estate mutual funds exhibit excess returns that are significantly different from their global and regional benchmarks. Most notable, investment managers of North American and Australian real estate mutual funds have negative risk-adjusted returns, whereas investment managers of Asian, European and global funds are able to create value for investors. Acknowledgements We thank AME Capital and APREA for providing parts of the database. Eichholtz and Kok thank the Real Estate Research Institute for financial support. David Ling and Mark Roberts are thanked for their helpful comments. All remaining errors pertain to the authors. Please send all correspondence to Nils Kok at [email protected], Maastricht University, PO Box 616, 6200 MD Maastricht, The Netherlands. p: +31(0)43 3883838.
Transcript
- 1 -
Investment Style and Performance in The Global Real Estate Mutual Fund Market
Piet Eichholtz Maastricht University
Nils Kok
Maastricht University
Milena Margaritova Redevco Europe
Second Draft March 2009
Preliminary, not for quotation
Abstract This paper investigates the performance of 402 real estate mutual funds worldwide during the period from March 1997 through April 2007. With the exception of funds targeting Asia, these funds generally adhere to their stated investment mandate, while global funds are mostly invested in the United States and the United Kingdom. Between 72 percent and 92 percent of the performance of these funds can be attributed to investment style. Grouped per region, real estate mutual funds exhibit excess returns that are significantly different from their global and regional benchmarks. Most notable, investment managers of North American and Australian real estate mutual funds have negative risk-adjusted returns, whereas investment managers of Asian, European and global funds are able to create value for investors. Acknowledgements We thank AME Capital and APREA for providing parts of the database. Eichholtz and Kok thank the Real Estate Research Institute for financial support. David Ling and Mark Roberts are thanked for their helpful comments. All remaining errors pertain to the authors. Please send all correspondence to Nils Kok at [email protected], Maastricht University, PO Box 616, 6200 MD Maastricht, The Netherlands. p: +31(0)43 3883838.
- 2 -
1. Introduction
Investment in bricks and mortar has been shown to have many benefits, but direct real estate
investments are illiquid, require large capital commitments and considerable industry expertise. This
has created demand for new financial instruments. The Real Estate Investment Trust Act of 1960
made indirect real estate investment through Real Estate Investment Trusts (REITs) possible in the
United States. Similar legislation in numerous other countries has laid the foundation for a surging
global property share market; the market capitalization of which has quadrupled over the past
decade. This, in turn, has led to the appearance of real estate mutual funds some two decades ago,
representing a third-tier real estate investment vehicle. Essentially, the portfolios of these funds of
funds mostly contain shares of REITs and their international equivalents. To a lesser extent real
estate mutual funds also invest in other listed property companies and a very small fraction of the
funds invest capital in direct property, unlisted property funds, and other asset classes.
Real estate mutual funds offer liquid and diversified exposure to the real estate sector without a
minimum capital requirement and thereby offer two attributes that many indirect property investors
lack: resources and the ability to diversify effectively across equities. This is, of course, especially
beneficial for private investors, but also for small institutional investors, whose allocations to real
estate securities may not be large enough to allow for optimal diversification across a large number
of REITs or across international property share markets. By pooling assets in a fund, investors can
participate in a large share of the REIT market with only a small investment. In addition, some
investors realize that the performance evaluation of REITs is a resource-intensive process that
requires both considerable time and expertise. Therefore, these investors outsource this to a fund,
while keeping the determination of the investment strategy and the overall allocation decisions in-
house.
Given the rationale for third-tier real estate investment vehicles, it is not surprising that real estate
mutual funds have been experiencing strong growth. In less than twenty years, the number of funds
has increased from one US-based fund in 1989 to approximately 1,024 funds (including sub-share
classes) globally today. Figure 1 provides a visual representation of the rapid increase in the number
of real estate mutual funds over time. Each line in the graph corresponds to the geographic region
in which a fund invests. These funds can be grouped and distinguished based on a regional
investment mandate, which covers the four main continents (America, Asia, Australia, and
Europe)1, or on a global investment mandate. As can be seen in Figure 1, Australia and North
1 Accordingly, if a fund is referred to as Asian real estate mutual fund, for instance, it means that it invests in Asian REITs, not that the fund’s domicile is necessarily in Asia.
- 3 -
America have experienced steady growth in the number of funds, followed only from the late 1990s
onwards by funds with a European investment focus. The number of Asian funds started to grow
significantly after 2005. The most spectacular development, however, has been in funds with a
global mandate. Until the end of 2004, the size and growth of this market segment were in line with
that of European funds, but in 2005 and 2006, the number of global funds more than tripled, and it
is now the largest real estate mutual fund segment. To illustrate: assets under management of
globally investing funds have nearly quadrupled from US$15bn in the beginning of 2006 to
US$54bn one year later.
– Insert Figure 1 here –
For real estate mutual fund managers, every region represents a unique investment environment.
The Australian and North American REIT markets, for example, are very mature. Australian fund
managers must specifically distinguish between the management of wholesale and retail funds,
which are expected to be distinctly different due to the targeted investment community. The
managers of European real estate mutual funds are faced with a vast number of country-specific
REIT-like structures that differ in terms of legal and tax standards, but also in terms of financing,
managerial freedom, and focus (Eichholtz and Kok, 2007). In Asia, different REIT-like structures
are also emerging, but the property share market is still dominated by development companies,
which complicates a manager’s stock-picking process. Global real estate mutual fund managers
must take all of the above into account. However, there are two major advantages to a globally
focused investment approach, and both stem from the fact that a much larger universe of property
stocks is available when investing globally. First, a high degree of portfolio diversification can be
achieved, thus reducing risk given the same expected return. This follows from the relatively low
expected correlations in returns across geographical areas (Eichholtz, 1996). Second, the potential
for higher overall excess returns is increased by investment in real estate markets with different
levels of economic growth.
The benefits of global diversification, however, have a price: increased research and management
costs. In addition, if the underlying property share markets are not fully efficient, performance loss
due to informational disadvantages may occur. Indeed, Eichholtz, Koedijk and Schweitzer (2001)
show that going international is costly for indirect property investors. However, many dedicated
property share investment managers, such as Cohen & Steers, are now physically present in the
most important continents, which could overcome the informational disadvantages.
- 4 -
This paper investigates the geographic investment style and performance of 402 real estate mutual
funds between April 1997 and July 2007 for the four aforementioned regions, as well as global
funds. The remainder of the paper is structured as follows. The next section discusses the literature
regarding equity mutual fund style and performance in general, and of real estate mutual funds in
particular. Section 3 provides the data, method, and descriptive statistics. Section 4 presents results
for the style analysis and the performance analysis. Section 5 concludes and provides a summary of
the main findings.
2. Literature
An important motive for the empirical performance analysis of mutual funds is based on the
theoretical hypothesis of Grossman and Stiglitz (1980), who claim that investment managers can
possess superior information, which can be translated into abnormal returns when selecting assets
or timing transactions. However, the empirical literature has provided little evidence of the ability of
mutual fund managers to generate significantly positive abnormal returns. Indeed, a large number of
empirical studies discredit the practice of active portfolio management (Carhart, 1997, Gruber,
Equity mutual fund managers are required to maintain a well-diversified portfolio by investing in a
variety of equities according to their mandate, usually with little or no leverage. This limits the scope
of stock-picking activities and renders managers’ style choices the more important determinant of
performance. As a consequence, the important differences among mutual funds are to be found in
the asset mix of their portfolios. This implies that the value of active management can be
determined by analyzing a fund’s portfolio composition, i.e. its investment allocation style. If fund
managers indeed possess valuable information, their performance should be related to specific types
or weights of assets in their portfolios.
This phenomenon was first captured by Sharpe’s (1992) style regression approach, which showed
that only a limited number of major asset classes is required to successfully replicate the
performance of an extensive universe of U.S. mutual funds. Sharpe’s approach is now the most
widely used technique for style analysis, and the ability of investment style to explain mutual fund
performance has been confirmed by several more recent studies (Chan, Chen and Lakonishok,
2002, Chen, Narasimhan and Russ, 2000). Controlling for style effects, there is empirical evidence
to support the ability of fund managers to generate positive abnormal returns. These papers relate
the return anomalies to the funds’ investment style. The most common style dimensions that have
- 5 -
been investigated in the context of equity mutual funds are: stock size, value and momentum
(Brown and Goetzmann, 1997, Daniel et al., 1997, Jegadeesh and Titman, 1993).
Although the equity mutual fund literature is abundant, research on real estate mutual funds is
limited, despite the strong worldwide growth of this industry. Moreover, real estate is known for its
high degree of local segmentation and resulting information asymmetry (Garmaise and Moskowitz,
2004). These phenomena could allow better-informed active property fund managers to
significantly outperform passively managed portfolios, although evidence that direct or indirect real
estate investors can beat the market is weak at best (Ling, 2005, Peterson and Hsieh, 1997). It is not
clear whether the absence of abnormal returns for third-tier investment vehicles will also hold for
real estate mutual funds. The property share market is less liquid and possibly less efficient than the
general stock market. In the most comprehensive analysis to date, Kallberg et al. (2000) study the
returns of 44 US real estate mutual funds between 1987 and 1998 and compare risk-adjusted
performance to the NAREIT Equity REIT and Wilshire REIT indices. Compared to the former,
the funds are not found to generate positive average abnormal returns. However, real estate mutual
funds significantly outperform the Wilshire indices by approximately 2 percent per annum. This is
in line with evidence by Gallo et al. (2000), who document an outperformance of five percent per
year for a sample of 24 funds between 1991 and 1997, relative to the Wilshire REIT index.
However, the transparency, integration and informational efficiency within the real estate sector
have increased significantly over the past decades (JLL, 2008), rendering consistent outperformance
of the market less likely. In line with these developments, the remaining research on US funds
mostly contradicts the previous studies. Chiang et al. (2008) investigate the performance of 67 US
funds between 1996 and 2005 and conclude that, on average, real estate mutual funds do not
exhibit abnormal performance compared to the NAREIT Equity REIT index, regardless of
portfolio composition. Lin and Yung (2004) come to a similar conclusion in the analysis of the
performance of 83 funds between 1993 and 2001. Compared to the NAREIT Domestic index and
the broad equity market the authors document no evidence for superior managerial skill manifested
in abnormal returns.
The contrasting evidence on the value added from investment managers is solely focused on the US
market. However, the increased importance of real estate mutual funds as a venue of property
investment is mostly driven by the growth of funds in other continents, and especially the explosion
of global real estate mutual funds. To date, there have been no academic analyses of the
- 6 -
performance of pan-European, Asian and global funds, which is the motivation for the global scope
of this study.
Besides, investors are not solely concerned with the performance of a fund, but also with the
drivers of that performance. Despite the rapid growth of the particular real estate mutual fund
sector, surprisingly few studies have focused on the performance and style of real estate mutual
funds. In this respect, investment style explains US real estate portfolio returns in only one recent
study (Gallo et al., 2000). This paper investigates performance and performance drivers of real
estate mutual funds using Sharpe’s (1992) effective-mix style analysis method to infer the
geographic investment style and performance of real estate mutual funds around the globe.
3. Data and Method
3.1 Data
We compose our initial sample, which represents a proxy for the global universe of real estate
mutual funds between 1991 and 2007, using data from AME Capital, ReitaUK, RealPac, the Asian
Public Real Estate Association (APREA), Lipper and Morningstar. The initial sample contains 1,024
listed real estate mutual funds. Index funds, ETFs, as well as funds with real estate equity holdings
of less than 80 percent are eliminated from the sample, leaving only actively managed and real estate
related funds in the sample. In those cases where multiple share classes exist for a single fund
portfolio, the corresponding umbrella, i.e. main fund, is selected for the analysis. The main fund can
be identified by fee structure: Class A shares require a front-end load and other charges, rather than
back-end loads (Class B) or no charges (Class C). In the absence of an identifiable main fund, the
oldest fund class is chosen.
End-of-month net asset values (NAVs) with reinvested dividends are obtained from Morningstar,
Reuters and Datastream for the period between March 1997 and April 2007. We select 1997 as our
start date, as the number of real estate mutual funds before that date is too small for meaningful
statistical analyses. We calculate monthly total returns for each fund i in month t , resulting in a
maximum of 124 return observations per fund. All management fees and expenses covered by the
total expense ratio are already subtracted from the raw returns. Using spot exchange rates, all local
return series are converted into US dollars.
We only include funds in the sample that have a minimum of 12 months return data. While this
produces more meaningful empirical results, we acknowledge that this requirement will lead to a
look-ahead bias (Carhart, 1997). We leave 33 dead and suspended funds in the sample, which
- 7 -
eliminates survivorship bias in the performance results. As far as we can see, these are all the dead
funds in the universe.
The geographical investment focus is determined based on the regional allocation of a fund’s
holdings as reported by Morningstar. A fund enters a continental sub-sample if it holds a minimum
of 70 percent of its assets within the respective geographic region. If this condition is not met, a
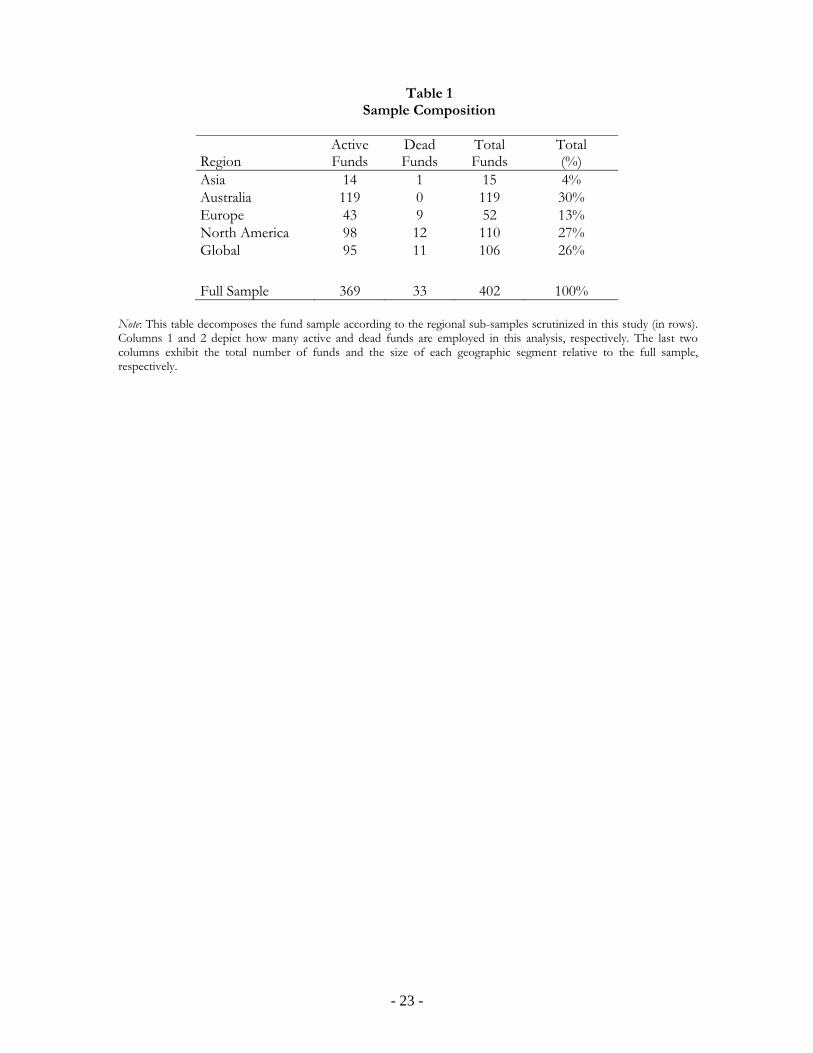
fund is considered to have global holdings. Table 1 provides an overview of the sample, the number
of funds and the size of each regional segment.
Our sample includes 93 funds at the beginning of the sample period, increasing to a total of 402 by
April 2007. As of April 2007, our sample consists of 15 Asian, 119 Australian, 52 European, 110
North American, and 106 global funds. Overall, the geographic distribution within the fund sample
closely represents the current relative size of each region’s real estate mutual fund sector as in
Figure 1.
– Insert Table 1 here –
In order to assess a fund’s geographic investment scope and relative performance, we use the global
index, continental indices and local indices of Global Property Research (GPR) as benchmarks. The
GPR total return index series covers all listed property companies worldwide with a market
capitalization of over 50 million US$ for at least two consecutive months. It is the index with the
broadest coverage of listed property companies, going back to 1984, and thus it is an excellent
proxy for the real estate equity universe from which real estate mutual fund managers can pick
stocks.2 For the micro style analysis, we use GPR national indices for Hong Kong, Japan, Malaysia,
Philippines, Singapore, and Thailand (Asia); Australia and New Zealand (Australia); Denmark,
Finland, France, Germany, Italy, Netherlands, Norway, Spain, Sweden, Switzerland, and the United
Kingdom (Europe); and Canada and the United States (North America).
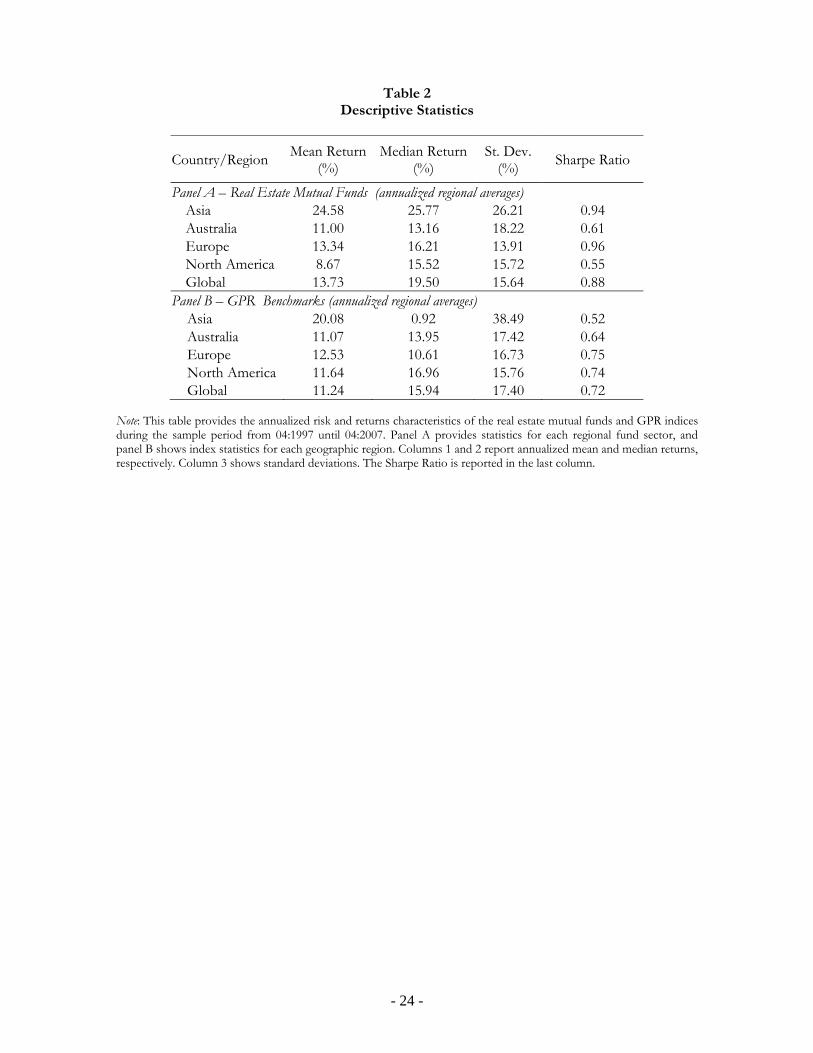
Table 2 provides descriptive statistics for the GPR return benchmarks and real estate mutual fund
returns in each region. Columns 1 and 2 report annualized mean and median returns, respectively.
Column 3 displays the annualized standard deviation of the returns. The last column provides the
Sharpe ratio. The fund averages are reported in Panel A, whereas the benchmark statistics can be
2 The correlation between the returns based on the GPR indices and returns based on the FTSE EPRA/NAREIT indices is 0.99. However, the FTSE EPRA/NAREIT indices are substantially more volatile, following different inclusion criteria. We therefore repeat our analysis using the FTSE EPRA/NAREIT indices to check for robustness. The results do not markedly differ from the results obtained with the GPR indices, but are available from the authors upon request.
- 8 -
found in Panel B. The figures are computed as the weighted average across funds (Panel A), or
across all country indices (Panel B) that correspond to a given region.
Overall, the Sharpe ratios indicate that the real estate mutual funds in Europe, Asia and with a
global mandate have outperformed their passive benchmarks. In contrast, US funds have a Sharpe
ratio of 0.55, which is substantially lower than the Sharpe ratio for the North American GPR index
(0.74). This difference is solely due to the difference in returns, since the standard deviation is 16
percent for both the GPR index and the real estate mutual fund sector. Asian funds have the
highest absolute return, but this is accompanied by strong fluctuations in returns. European funds,
on the other hand, show decent returns over the sample period, with modest volatility, leading to
the highest Sharpe ratio. However, this is not pure managerial skill: the continental GPR index with
the highest Sharpe ratio (0.75) is the European index, which is analogous to findings of Bond and
Glascock (2006).
– Insert Table 2 here –
3.2 Method
Performance evaluation of a mutual fund can be based on information regarding investment
strategy and holdings provided by the fund’s managers. Using a fund-specific passive style
benchmark, the value of active portfolio management can then be assessed by comparing a fund’s
return to that of the benchmark. However, there are two problems associated with this holdings-
based method. First, managers may not be willing or able to articulate their specific investment
approach, or to provide a detailed list of holdings. In addition, reports are subject to window
dressing (Donnelly, 1992). Moreover, fund returns can often not be reconciled with the style
benchmark constructed based on a manager’s claims (DiBartolomeo and Witkowski, 1997).
To examine the performance of the real estate mutual funds in our sample, we therefore first use a
simple multi-factor model, extending the model of Jensen (1968):
(1) Rp t p bi Fi p t
Where p measures a manager’s skill, or the difference between the return of the fund p and the
return that could have been achieved from holding a passively managed benchmark portfolio with
the same risk; tpR , is the risk-adjusted return on fund p; bi captures the average asset allocation
- 9 -
strategy adopted by each fund, i.e. the beta coefficients measure the exposure of a fund with a
particular geographic mandate to a set of continental or local real estate indices in continent or
region i. The one-month US Treasury Bill (T-Bill) rate obtained from Ibbotson Associates Inc. is
used as a proxy for the risk-free rate (Rf) to risk-adjust the dependent and independent variables.
We first estimate this model in an unconstrained form, thereby allowing for the evaluation of fund
performance relative to a passive style benchmark portfolio, representing a fund manager’s
investment universe. This is often referred to as the ‘weak’ performance analysis.
Second, in order for the index coefficients to be indicative of each region’s weight within the
portfolio, we constrain the beta coefficients to sum to unity. In estimating Model (2), we impose the
assumption that, net of borrowing and lending, a fund’s capital is fully invested. This is the ‘semi-
strong’ performance analysis:
(2) Rpt p bi Fi pt
i
iib
1
1
Finally, we employ Sharpe’s (1992) effective-mix method to determine real estate mutual fund
investment style. This is often referred to as the ‘strong’ style analysis. Mutual funds are in general
legally bound to long positions in any given asset as well as to no or minimum leverage. Therefore,
we constrain each estimated coefficient to be equal or greater than zero. Together with the unity
constraint, this implies that all coefficients must be less than or equal to one. If the portfolio and
positivity constraints are valid, the use of strong style analysis leads to more efficient estimates than
either the weak or the semi-strong style analysis.
(3) Rpt p bi Fi pt
i
iib
1
1
0ib
Fund style analysis in each region is assessed relative to two sets of benchmarks: a group of four
continental indices and a collection of country indices. The former analysis – the macro analysis –
shows whether real estate mutual funds indeed invest exclusively according to their geographic
mandate. If this is the case, than a US fund, for example, should be found to have a coefficient that
is close to one for the North American GPR index and coefficients that are close to zero for the
- 10 -
remaining regional indices. Second, regressing fund returns against a set of region-specific country
indices allows for a more in-depth, granular assessment of investment style relating to country
allocation – a micro analysis.
To assess the value added by real estate mutual fund investment managers, we first evaluate the
performance of each fund p using the intercept p in the style regressions of Models 1 and 2, which
is reminiscent of the Jensen measure for the fund. Second, we employ Sharpe’s (1992) effective-mix
style-based performance analysis. Each estimated coefficient (bi) in Model 3 represents the average
weight of the respective benchmark index in a given fund’s portfolio over the sample period. Using
these weights and the corresponding country index returns, fund-specific benchmark portfolios,
which mimic the geographic investment style of a given fund, are computed. Third, the return
vector of each fund is regressed against its mimicking portfolio in order to obtain the style-specific
Jensen’s alpha, which corresponds to the average tracking error from its style benchmark, i.e. the
incremental performance of the fund taking the style benchmark into account (see for instance
Lucas and Riepe, 1996 and Ter Horst, Nijman and De Roon, 2004). More specifically,
(4) tptiptp RbR ,,ˆ
where tiRb̂ is the return on the weighted mimicking portfolio and p is the expected excess return
of the fund relative to the mimicking portfolio.
4. Results
4.1 Investment Style
We first examine whether real estate mutual funds invest according to their geographic mandate by
estimating Models 1 and 2, while using the returns on the continental indices as benchmark factors.3
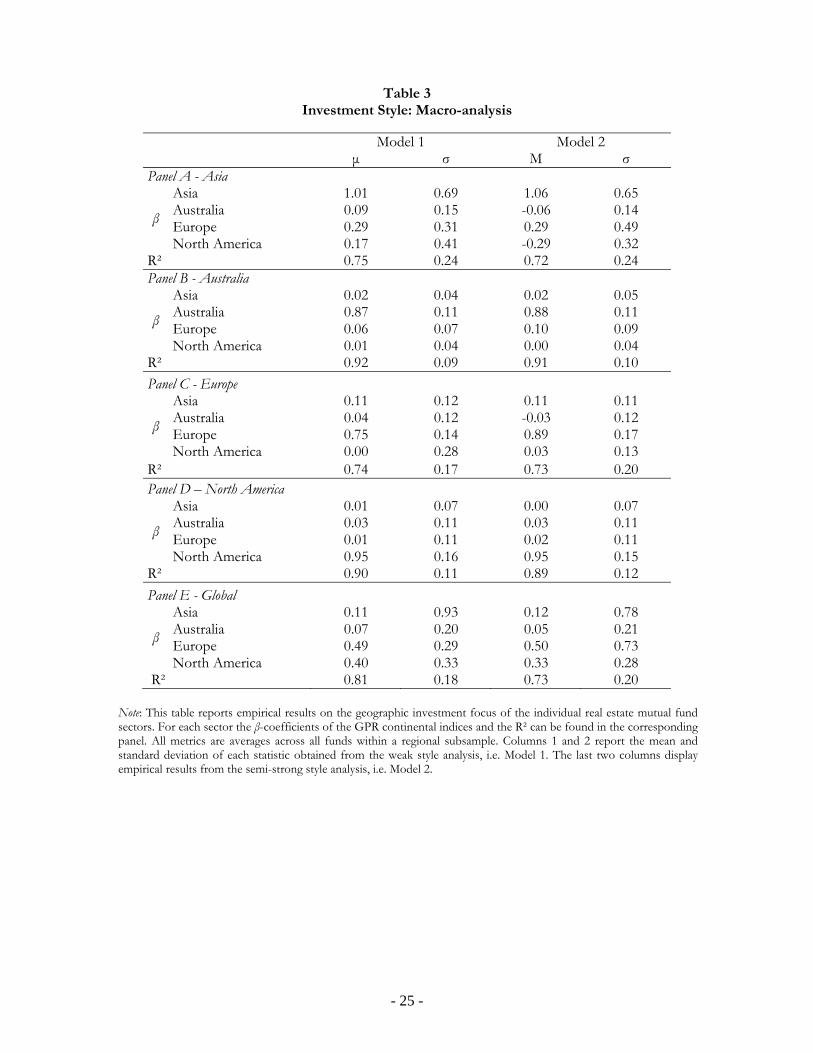
The empirical results from the macro-analysis of real estate mutual fund investment style are
presented in Table 3. Each panel in the Table corresponds to each individual geographical area. The
average beta coefficients for the continental indices across all funds and the average R²s are
reported for Model 1 and 2 in columns 1 and 3, respectively. Columns 2 and 4 exhibit the standard
deviations of the reported statistics. The results from both models are consistent and the
coefficients generally lead to conclude that real estate mutual fund managers invest according to
their geographical mandate, with the exception of funds targeted at Asia. 3 We do not report results for Model 3 here, as the interpretation of the coefficients does not make practical sense; forcing the coefficients to add up to one is not realistic using broad continental indices.
- 11 -
Considering the figures from the semi-strong style analysis of Model 2, the results for Australian,
European, and North American funds show average beta coefficients of 0.88, 0.89, and 0.95,
respectively, for their corresponding continental indices. The remaining coefficients are small, and
as a group not significantly different from zero (statistical significance not reported in table), which
implies that each region’s fund returns are almost solely sensitive to the returns of the regional real
estate securities industries in which they claim to invest.
With respect to funds with a continental focus, only the asset allocation of Asian funds seems to be
substantially different. The standard errors of the estimated β coefficients of the Asian real estate
mutual funds are high, indicating that these funds do not adhere very strongly to their reported
mandate. Judged by the high average β for Europe, there seem to be quite a few funds whose stated
investment mandate is Asia, but which allocate substantial capital to Europe. The global funds are
diversified across all four continents. However, judging by the average β’s, capital is mostly invested
in Europe (β = 0.50) and North America (β = 0.33). Global real estate mutual fund returns have a
very low sensitivity to the returns of the Australian listed property sector (β = 0.05). In the more
detailed analysis of portfolio holdings, we will further discuss these findings.
The R²s reported in the last row of each panel can be interpreted as the percentage of performance
for the portfolio of funds that is explained by property type allocation. The GPR continental indices
are able to explain most of the funds’ return variation, with R2s ranging from 0.72 to 0.92, which
suggests that real estate mutual funds indeed invest most of their assets in property shares covered
by the GPR indices. The unexplained variance is due to allocation to other asset classes, property
shares not covered by the indices, or underweighting or overweighting of specific property stocks in
the index.
– Insert Table 3 here –
Having established the broad geographic investment style of the funds in each region, the
subsequent microanalyses allow for a more granular assessment of the allocation of capital within
the region in which a fund operates. In this respect, the Asian, European and global funds are of
particular interest, as the large number of different local real estate property share markets within
those regions offers the opportunity for regional diversification within the continent. This is
obviously much harder in Australia and in North America.
- 12 -
For the microanalyses, the strong style analysis (Model 3) can be used to determine the effective
asset mix of the mutual fund portfolios, allowing us to draw more precise conclusions with respect
to the funds’ geographic capital allocation. The statistical evidence for each fund’s market segment
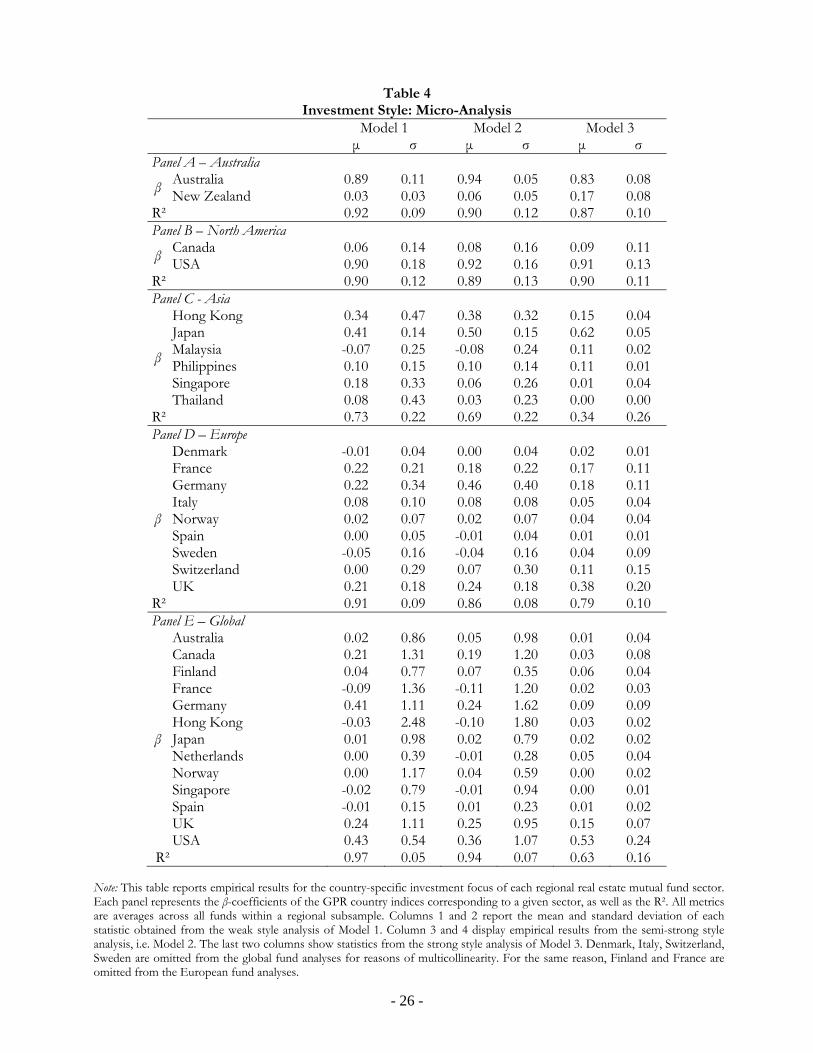
is presented in Table 4.4 As in Table 3, each panel in Table 4 corresponds to one of the geographic
real estate mutual fund sectors. The average beta coefficients across funds for each region’s country
indices are reported for Model 1, 2 and 3 in columns 1, 3 and 5, respectively. Columns 2, 4 and 6
exhibit the standard deviations of the reported statistics.
All three models provide evidence that the property share holdings of the regionally dedicated real
estate mutual funds are concentrated in a few countries only, which are the countries with the
largest listed property share markets: Australia for the Australian funds, Japan and Hong Kong for
the Asian funds, the United Kingdom, Germany and France for the European funds and the
United States for the North American funds. The funds with a global mandate appear to invest
mostly in the United States and the United Kingdom. We concentrate the discussion on the results
reported for Model 3, as these can directly be interpreted as the average country weights of the
funds during the sample period.5
The results in Panel A indicate that Australian real estate mutual fund managers on average invest a
significant 83 percent of their assets in Australia and 17 percent in New Zealand. This is not
surprising given the relative size of the two markets. Similarly, Panel B shows that North American
funds concentrate their investments on the US property share market (β = 0.91) and are only
slightly exposed to the Canadian property share market (β = 0.09). The investment focus within the
two regions shows the high level of geographical specialization of the Australian and North
American real estate mutual fund sectors in terms of cross-border allocations.
Panel C indicates that the real estate mutual funds in Asia are sensitive to the returns of four out of
the six Asian country indices considered in the analysis. This indicates some degree of
diversification. However, Asian fund managers have a clear preference for Japanese property shares,
with an average β of 0.62. There is some exposure to Hong Kong, Malaysia and the Philippines, but
the investment exposure to the Singapore market is minimal, and the Thai index fails to explain the
funds’ returns entirely. This is surprising, as the Singapore market constitutes a major share of the
Asian property share market.
4 Empirical results for all individual real estate mutual funds are available upon request. 5 The strong style analysis requires the benchmarks to be exclusive, exhaustive and to have differing returns. Multicollinearity between the GPR indices forces us to omit a few country indices from the analysis for European and global funds. However, these are mainly small property markets.
- 13 -
Overall, the results show that Asian fund managers have exposure to multiple real estate markets,
while at the same time focusing most of their investments on a single country. These two facts
support the notion that the low degree of integration among Asian countries offers diversification
potential, while simultaneously impeding the acquisition of exceptional expertise in all countries
(Driessen and Laeven, 2006, Goetzmann, Li and Rouwenhorst, 2005). Furthermore, the macro-
analysis indicates that, to a certain extent, Asian funds also invest in Europe and vice versa. Thus,
omitting local property indices from the European region from the analysis will naturally lower the
R² of the style analysis on Asian real estate mutual funds.
Panel D of Table 4 shows that managers of pan-European funds diversify geographically, but with a
main investment focus on a limited number of property share markets only. More specifically, the
coefficients mimicking the returns of an average European fund portfolio are highest for the UK (β
= 0.38), Germany (β = 0.18), France (β = 0.17). On the other hand, the Scandinavian and southern
European country indices exhibit relatively low betas. European managers’ preference for a single
property share market is not as distinct as compared to funds with an Asian investment mandate,
which is most likely due to the fact that the number of European countries with well-developed real
estate markets is higher than in Asia. Furthermore, the stronger economic integration within
Europe relative to Asia facilitates capital allocation in multiple countries. Last, the relatively high
standard deviations reported for European funds suggest strong diversity in investment styles and
country allocations among European funds.
The evidence presented in Panel E shows that global real estate mutual funds are invested across
the globe, but it also shows that just two countries – the United States and the United Kingdom –
account for almost 70 percent of the average investment allocation of these so-called ‘global’ funds.
Thus, the global mandate that some global funds advertise is not reflected in their investment style.
The aggregated market capitalization of the continental European and Asian property share markets
currently represents more than half of the total global market. However, these continents are
strongly underrepresented in the portfolio of real estate mutual funds with a global mandate. The
investment style may be explained by the maturity of the UK and US property share markets, which
facilitates the screening of property stocks for investment managers and reduces informational
barriers.
– Insert Table 4 here –
4.2 Performance
- 14 -
The style analysis in the previous section provides evidence on the geographical asset allocation of
real estate mutual funds around the globe. This section discusses the empirical results regarding the
value added of investment managers, relative to both the global real estate securities market and the
regional market in which a fund operates. More specifically, we investigate the extent to which
performance is attributable to a fund’s particular geographic investment style, and compare the
performance of strong geographic specialists (Australian and US funds) to that of the more
diversified funds (Asian, European and global funds). We exploit both alphas obtained in Models 1
and 2, and calculate alphas based on the performance of real estate mutual funds relative to the
performance of the passive mimicking style portfolio, following Model 4.
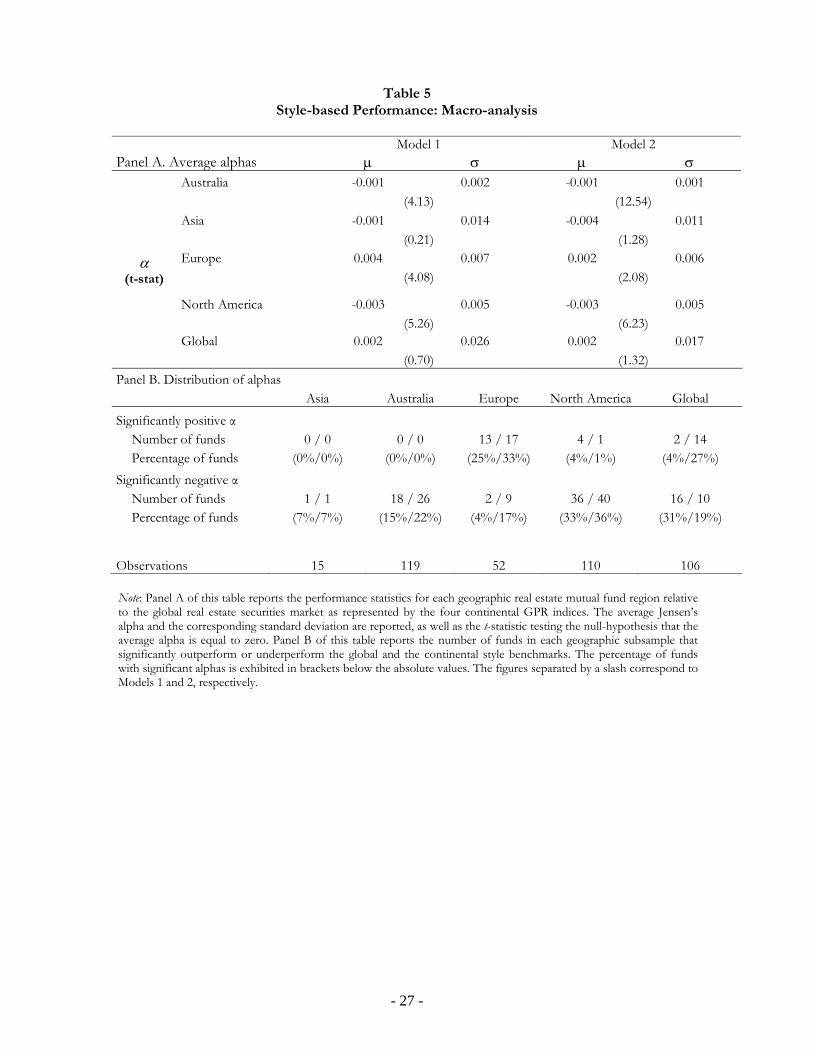
Table 5 provides the results based on the analyses of fund performance relative to the macro, i.e.
continental, property indices. Panel A provides average alphas for each continent and for the funds
with a global mandate. t-statistics testing the null-hypothesis that the average alpha is equal to zero
are provided in parentheses. We document significantly negative alphas for the US real estate
mutual funds. This contrasts with Kallberg et al. (2000) and Gallo et al. (2000), but is consistent
with the more recent evidence reported by Chiang et al. (2008). The annual underperformance
relative to a set of continental property indices is approximately 3 percent. Australian fund
managers also underperform, with a significantly negative average alpha of approximately 1.2
percent per annum. Results for Asian funds are not statistically significant. The underperformance
of real estate mutual funds is not surprising in the light of the general mutual fund literature, in
which the managerial ability to add value is consistently questioned.
However, both European and global real estate mutual fund managers beat their continental
benchmarks during the 1997 – 2007 period. This is surprising, although the European result is in
line with findings of Otten and Bams (2002), who show that European mutual funds, and especially
small cap funds, are able to add value. The contrasting results between US and Australian funds on
the one hand and European and global funds on the other hand, may indicate that the possibility of
cross-border diversification in property shares is value-enhancing. This could, in turn, follow from
the timing of non-synchronous economic cycles. Moreover, the possibility to venture into less
efficient property share markets may enable global real estate mutual fund managers to beat the
market.
In Panel B of Table 5, we show the distribution of positive and negative alphas for the different
geographical areas. The results for both Model 1 and Model 2 are reported, separated by a slash.
- 15 -
Positive alphas are mostly found among the funds with European and global mandates, while the
funds with negative alphas are concentrated in the North American, the Australian, and the global
market segment. None of the funds in the Australian sample exhibit significantly positive abnormal
returns, while 15 to 20 percent of funds are found to significantly underperform the global
benchmark. The North American sample contains few funds that significantly outperform the
market. However, 35 to 40 percent of the North American funds significantly underperform their
continental benchmarks. Within the European real estate mutual fund sector, a substantial 25 to 33
percent of the funds exhibit significantly positive returns as compared to just 4 to 17 percent of
funds that have a significantly negative alpha. For global funds, these percentages are 27 percent
versus 19 percent, respectively, indicating a substantial variation in global fund performance.
– Insert Table 5 here –
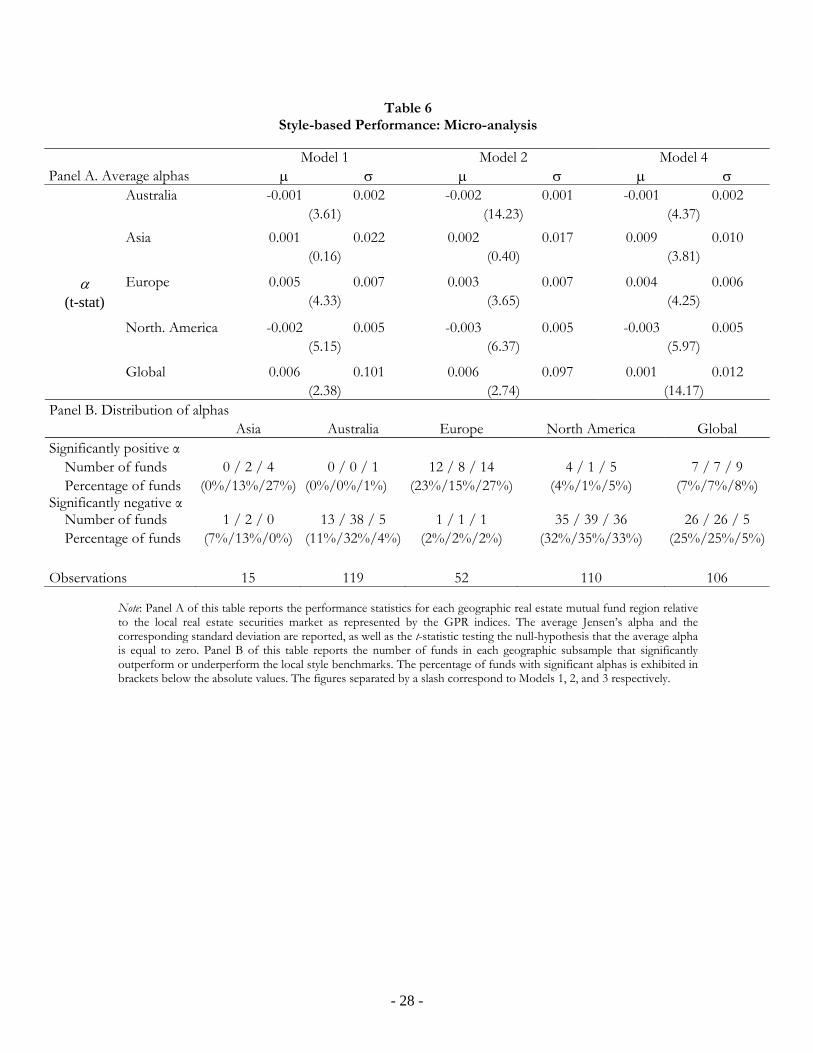
We next analyze the style-corrected performance of the funds relative to the performance of local
property indices. Panel A of Table 6 reports the average alphas and their standard deviations for
each dedicated real estate mutual fund sector. The coefficients in columns 1 through 4 represent the
average across the individual fund alphas that are obtained from the regression of the fund returns
on the region-specific set of GPR country indices, using Models 1 and 2. In columns 5 and 6, we
report results for Model 4, which is estimated using the mimicking index based on the weights
determined in Model 3. The corresponding t-statistics are presented in brackets.
For each region, the estimated signs of the coefficients and the statistical significance are similar
across the three models. We will therefore focus the discussion on the results from Model 4, as the
imposed constraints in estimating the mimicking index weights provide the most reliable and
efficient estimates of alpha (De Roon, Nijman and Werker, 2001).
Similar to our findings for the performance of funds relative to the continental GPR indices, we
find a performance difference among geographical specialists and geographical diversifiers. That is,
the specializing fund sectors – Australia and North America – underperform their respective
mimicking local real estate market index, while the remaining three real estate mutual fund sectors,
which have been documented to be more geographically diversified, exhibit significantly positive
alphas. The coefficients for the Australian funds (α = -0.001) and North American funds (α = -
0.003) correspond with negative style-adjusted losses of 1.2% and 3.6% per year, respectively.
- 16 -
In contrast, Asian real estate fund managers generate an average alpha of 0.009, which corresponds
to an annualized outperformance of 10.8%. This supports the findings of Goetzmann et al. (2005)
and Driessen and Laeven (2006,) who show that superior information is more likely to be found
across and within markets that are less integrated. However, it should be noted that part of this
substantial outperformance might be also be due to the fact that Asian property funds often venture
out to European and U.S. property markets. This is not captured in the performance attribution,
whereas the European and U.S. markets did remarkably better than the Asian market during part of
the sample period. The European and global real estate mutual fund sectors generate positive
average abnormal returns of 4.8% and 1.2% per year, respectively. As these returns are net of
transaction costs, the economic significance of the findings is considerable for a third-tier real estate
investment investor.
Panel B of Table 6 shows the distribution of alphas for the analyses using local indices.
Approximately a quarter of the funds in the Asian and European sub-samples significantly
outperform their passive style-mimicking benchmark portfolio obtained from Model 3. That is, a
large number of fund managers in those two regions are able to translate superior information and
diversification benefits into persistent positive abnormal returns by means of active portfolio
management, regardless of the particular geographic allocation of assets.
For global real estate mutual funds, we find that the use of the style-replicating benchmark in Model
4 is much more discriminating – with respect to the indication of abnormal returns – than the GPR
benchmark employed in Models 1 and 2. In the case of the latter two models, one quarter of the
funds exhibit significant negative alphas after correcting for style. The findings suggest that a large
number of global fund managers allocate capital in a way that generates lower returns than the
passive GPR portfolio. On the other hand, nine funds significantly outperform their style-specific
benchmark using Model 4, while only five underperform the mimicking benchmark. This implies
that, once investment style is accounted for, there are more global real estate fund managers who
demonstrate superior investment skills than managers who generate negative abnormal returns by
actively managing their portfolios.
The evidence for Australia and North America is much more unequivocal. Depending on the
model, between 32 percent and 35 percent of the North American funds significantly underperform
their benchmark. In contrast, only 1 to 5 funds exhibit significantly positive alphas. This evidence is
at odds with the findings obtained in the US real estate mutual fund studies by Kallberg et al. (2000)
- 17 -
and Gallo et al. (2000), which employed the Wilshire and/or NAREIT index as benchmarks.
However, more recent studies report similar results.
Within the Australian fund sector, the number of funds with significantly negative alphas is lowest
with Model 4 (5 funds) compared to Models 1 and 2 (13 and 38 funds, respectively). This indicates
that fewer managers underperform their style-mimicking portfolios than the GPR benchmark.
Unlike in the global or European sample, the number of underperforming funds is always larger
than the number of outperformers, regardless of the model. Overall, the evidence suggests that a
large number of geographically specializing real estate mutual fund managers do not possess
superior information regardless of whether the fund-specific investment style is considered.
Summarizing, the empirical results obtained from the microanalyses show that the performance of
real estate mutual funds differs substantially between regions. A considerable number of Australian
and North American funds have underperformed the GPR local indices as well as their style-
mimicking index. In sharp contrast, a large share of the fund managers in the Asian and European
sector has been able to outperform the passive benchmark. Similarly, the share of real estate mutual
funds beating the market is substantially larger than those underperforming the style-replicating
benchmark in the global fund sector during the sample period.
– Insert Table 6 here –
5. Conclusions and Implications
Real estate investors face a complex evaluation process when it comes to the construction of their
investment portfolios. First, an investor determines the geographical regions in which to invest,
followed by an allocation based on sector-specific attributes and risk and return requirements. The
availability of resources and expertise will determine whether capital can be effectively managed in-
house. If an investor makes the choice to outsource the investment management, she can either
invest in passively managed instruments (i.e. ETFs) or in an actively managed real estate mutual
funds. This study provides the first empirical evidence on the style and performance of real estate
mutual funds in a global setting. The results provide answers to the two questions most relevant to
third-tier real estate investors: how do real estate mutual funds perform around the globe and what
drives this performance?
We use a sample of 402 real estate mutual funds over the period from March 1997 through April
2007 and assess style and performance relative to appropriate sets of GPR general property indices.
- 18 -
Three different applications of Sharpe’s (1992) style analysis methodology are used for the analysis.
We find that up to 92 percent of the performance of real estate mutual funds can be attributed to
investment style, which strongly suggests that real estate mutual fund returns cannot be explained
by investment skill. This renders the style-based performance analysis conducted in this study most
appropriate for empirical studies on the global real estate mutual market. The evaluation of
geographical fund style shows that the funds in our sample invest according to their mandate, both
in terms of geographic location and in terms of scope. That is, Australian and US funds concentrate
their holdings in the domestic market, while Asian and European funds diversify their portfolios
across real estate securities in multiple countries within the borders of that particular region.
Strikingly, funds with a global mandate invest most of their holdings in the US and UK market,
rather than diversifying across the globe. This implies that there are still diversification
opportunities to be reaped by global real estate mutual fund managers.
In the performance analysis, we document a large number of underperforming Australian and
North American funds, which drives a significantly negative average performance for real estate
mutual funds in these regions. This contrasts evidence for European and global real estate mutual
funds, for which significantly positive average alphas are documented. The findings lend support to
the notion that fund managers who diversify geographically are better able to obtain superior
information, which, together with the resulting diversification benefits, translates into positive
abnormal returns. The profitability of such a strategy with respect to property types has been
documented in a study by Gallo et al. (2000). Specifically, targeting asset allocation can lead to both
an increase in absolute excess returns and an improvement in performance relative to passive
industry benchmarks. Ideally, this asset allocation approach to portfolio management can be
combined with a decrease in a fund’s operating expenses resulting from reduced securities trading.
The positive abnormal returns for European and global funds – and to a lesser extent Asian funds –
we document should be put in perspective. First of all, we do not control explicitly for established
risk factors, such as size, value and momentum. It has been documented by Chiang et al. (2008) that
these risk-adjustment specifications are important determinants of US real estate mutual fund
performance. Second, differences in sector performance within regions are not accounted for. Gallo
et al. (2000) show that over- or underrepresentation of certain property types in a fund portfolio
drives US real estate mutual fund performance. Sector-specific performance data are not available
for most of the markets we study, although this would be a venue for further research. Last, this
study does not further address cross-sectional determinants of mutual fund performance. The
decomposition of alphas can provide more insight into the drivers of the outperformance of Asian,
- 19 -
European and global fund managers. This information might be useful for investment practices of
US and Australian real estate mutual managers, which consistently underperform their benchmark.
- 20 -
References Bond, S.A. and Glascock, J. "The Performance and Diversification Benefits of European Public Real Estate Securities," 2006. University of Cambridge.
Brown, S.J. and Goetzmann, W.N. "Mutual Fund Styles." Review of Financial Studies, 1997, 43(3), pp. 373-99.
Carhart, M.M. "On Persistence in Mutual Fund Performance." Journal of Finance, 1997, 52(1), pp. 57-82.
Chan, S.H.; Chen, H.L. and Lakonishok, J. "On Mutual Fund Investment Styles." Review of Financial Studies, 2002, 15(5), pp. 1407-37.
Chen, H.L.; Narasimhan, J. and Russ, W. "The Value of Active Fund Management: An Examination of the Stockholdings and Trades of Fund Managers." Journal of Financial and Quantitative Analysis, 2000, 35(3), pp. 343-268.
Chiang, C.H.; Kozhevnikov, K.; Lee, M.L. and Wisen, C.H. "Further Evidence on the Performance of Funds of Funds: The Case of Real Estate Mutual Funds." Real Estate Economics, 2008, 36(1), pp. 47-61.
Daniel, K.; Grinblatt, M.; Titman, S. and Wermers, R. "Measuring Mutual Fund Performance with Characteristic-Based Benchmarks." Journal of Finance, 1997, 52(3), pp. 1035-58.
De Roon, F.A.; Nijman, T.E. and Werker, B.J.M. "Testing for Mean-Variance Spanning with Short Sales Constraints and Transaction Costs: The Case of Emerging Markets." Journal of Finance, 2001, 56(2), pp. 721-42.
DiBartolomeo, D. and Witkowski, E. "Mutual Fund Misclassification: Evidence Based on Style Analayis." Financial Analysts Journal, 1997, 53(5), pp. 32-43.
Donnelly, B. "What's in a Name? Some Mutual Funds Make It Difficult to Judge," 1992.
Driessen, J. and Laeven, L. "International Portfolio Diversification Benefits: Cross-Country Evidence from a Local Perspective." Journal of Banking and Finance, 2006, 31(6), pp. 1693-712.
Eichholtz, P.M.A. "Does International Diversification Work Better for Real Estate Than for Stocks and Bonds." Financial Analysts Journal, 1996, 52(1), pp. 56-62.
Eichholtz, P.M.A.; Koedijk, K. and Schweitzer, M. "Global Property Investment and the Costs of International Diversification." Journal of International Money & Finance, 2001, 20(3), pp. 349-66.
Eichholtz, P.M.A. and Kok, N. "The EU REIT and the Internal Market for Real Estate," 2007. Brussels: European Property Federation.
Gallo, J.G.; Lockwood, L.J. and Rutherford, R.C. "Asset Allocation and the Performance of Real Estate Mutual Funds." Real Estate Economics, 2000, 28(1), pp. 165-84.
- 21 -
Garmaise, M.J. and Moskowitz, T.J. "Confronting Information Asymmetries: Evidence from Real Estate Markets." Review of Financial Studies, 2004, 17(2), pp. 405-37.
Goetzmann, W.N.; Li, L. and Rouwenhorst, K. "Long-Term Global Market Correlations." Journal of Business, 2005, 78(1), pp. 1-38.
Grossman, S.J. and Stiglitz, J.E. "On the Impossibility of Informationally Efficient Markets." American Economic Review, 1980, 70(3), pp. 393-408.
Gruber, M.J. "Another Puzzle: The Growth in Actively Managed Mutual Funds." Journal of Finance, 1996, 51(3), pp. 783-810.
Jegadeesh, N. and Titman, S. "Returns to Buying Winners and Selling Losers: Implications for Stock Market Efficiency." Journal of Finance, 1993, 48(1), pp. 65.
Jensen, M.C. "The Performance of Mutual Funds in the Period 1945-1964." Journal of Finance, 1968, 23(2), pp. 389-416.
JLL. "From Opacity to Transparency." 2008, J. L. LaSalle: London.
Kallberg, J.G.; Liu, C.H. and Trzcinka, C. "The Value Added from Investment Managers: An Examination of Funds of REITs." Journal of Financial and Quantitative Analysis, 2000, 35(3), pp. 387-408.
Lin, C.Y. and Yung, K. "Real Estate Mutual Funds: Performance and Persistence." Journal of Real Estate Research, 2004, 26(1), pp. 69-93.
Ling, D.C. "A Random Walk Down Main Street: Can Experts Predict Returns on Commercial Real Estate?" Journal of Real Estate Research, 2005, 27(2), pp. 137-54.
Lucas, L. and Riepe, M.W. "The Role of Returns-Based Style Analysis: Understanding, Implementing and Interpreting the Technique," 1996. Ibbotson Associates.
Malkiel, B.G. "Returns from Investing in Equity Mutual Funds 1971 to 1991." Journal of Finance, 1995, 50(2), pp. 549-72.
Otten, R. and Bams, D. "European Mutual Fund Performance." European Financial Management, 2002, 8(1), pp. 75-101.
Peterson, J.D. and Hsieh, C. "Do Common Risk Factors in the Returns on Stocks and Bonds Explain Returns on REITs?" Real Estate Economics, 1997, 25(2), pp. 321-45.
Sharpe, W.F. "Asset Allocation: Management Style and Performance Measurement." Journal of Portfolio Management, 1992, 18, pp. 7-19.
Ter Horst, J.; Nijman, T.E. and De Roon, F.A. "Evaluating Style Analysis." Journal of Empirical Finance, 2004, 11, pp. 29-53.
Wermers, R. "Mutual Fund Performance: An Empirical Decomposition into Stock-Picking Talent, Style, Transaction Costs, and Expenses." Journal of Finance, 2000, 55(4), pp. 1655-703.
- 22 -
Figure 1. Growth of the Global Real Estate Mutual Fund Industry
0
20
40
60
80
100
120
140
160
Jun-
91
Jun-
93
Jun-
95
Jun-
97
Jun-
99
Jun-
01
Jun-
03
Jun-
05
Jun-
07
Date
No.
of
RE
MF
s
Asia
Australia
Europe
Global
Nth. America
Note: Figure 1 shows the development in the number of real estate mutual funds between June 1991 and June 2007. Each line corresponds to the number of funds that invest in a given geographic region. Data are obtained from AME Capital, ReitaUK, RealPac, APRA, Lipper and Morningstar.
- 23 -
Table 1 Sample Composition
Region Active Funds
Dead Funds
Total Funds
Total (%)
Asia 14 1 15 4% Australia 119 0 119 30% Europe 43 9 52 13% North America 98 12 110 27% Global 95 11 106 26%
Full Sample 369 33 402 100% Note: This table decomposes the fund sample according to the regional sub-samples scrutinized in this study (in rows). Columns 1 and 2 depict how many active and dead funds are employed in this analysis, respectively. The last two columns exhibit the total number of funds and the size of each geographic segment relative to the full sample, respectively.
- 24 -
Table 2 Descriptive Statistics
Country/Region Mean Return
(%) Median Return
(%) St. Dev.
(%) Sharpe Ratio
Panel A – Real Estate Mutual Funds (annualized regional averages)Asia 24.58 25.77 26.21 0.94 Australia 11.00 13.16 18.22 0.61 Europe 13.34 16.21 13.91 0.96 North America 8.67 15.52 15.72 0.55 Global 13.73 19.50 15.64 0.88
Panel B – GPR Benchmarks (annualized regional averages) Asia 20.08 0.92 38.49 0.52 Australia 11.07 13.95 17.42 0.64 Europe 12.53 10.61 16.73 0.75 North America 11.64 16.96 15.76 0.74 Global 11.24 15.94 17.40 0.72
Note: This table provides the annualized risk and returns characteristics of the real estate mutual funds and GPR indices during the sample period from 04:1997 until 04:2007. Panel A provides statistics for each regional fund sector, and panel B shows index statistics for each geographic region. Columns 1 and 2 report annualized mean and median returns, respectively. Column 3 shows standard deviations. The Sharpe Ratio is reported in the last column.
- 25 -
Table 3 Investment Style: Macro-analysis
Model 1 Model 2 μ σ Μ σ Panel A - Asia
β
Asia 1.01 0.69 1.06 0.65 Australia 0.09 0.15 -0.06 0.14 Europe 0.29 0.31 0.29 0.49 North America 0.17 0.41 -0.29 0.32
R² 0.75 0.24 0.72 0.24 Panel B - Australia
β
Asia 0.02 0.04 0.02 0.05 Australia 0.87 0.11 0.88 0.11 Europe 0.06 0.07 0.10 0.09 North America 0.01 0.04 0.00 0.04
R² 0.92 0.09 0.91 0.10
Panel C - Europe
β
Asia 0.11 0.12 0.11 0.11 Australia 0.04 0.12 -0.03 0.12 Europe 0.75 0.14 0.89 0.17 North America 0.00 0.28 0.03 0.13
R² 0.74 0.17 0.73 0.20 Panel D – North America
β
Asia 0.01 0.07 0.00 0.07 Australia 0.03 0.11 0.03 0.11 Europe 0.01 0.11 0.02 0.11 North America 0.95 0.16 0.95 0.15
R² 0.90 0.11 0.89 0.12
Panel E - Global
β
Asia 0.11 0.93 0.12 0.78 Australia 0.07 0.20 0.05 0.21 Europe 0.49 0.29 0.50 0.73 North America 0.40 0.33 0.33 0.28
R² 0.81 0.18 0.73 0.20 Note: This table reports empirical results on the geographic investment focus of the individual real estate mutual fund sectors. For each sector the β-coefficients of the GPR continental indices and the R² can be found in the corresponding panel. All metrics are averages across all funds within a regional subsample. Columns 1 and 2 report the mean and standard deviation of each statistic obtained from the weak style analysis, i.e. Model 1. The last two columns display empirical results from the semi-strong style analysis, i.e. Model 2.
- 26 -
Table 4 Investment Style: Micro-Analysis
Model 1 Model 2 Model 3 μ σ μ σ μ σ
Panel A – Australia
β Australia 0.89 0.11 0.94 0.05 0.83 0.08 New Zealand 0.03 0.03 0.06 0.05 0.17 0.08
R² 0.92 0.09 0.90 0.12 0.87 0.10 Panel B – North America
Note: This table reports empirical results for the country-specific investment focus of each regional real estate mutual fund sector. Each panel represents the β-coefficients of the GPR country indices corresponding to a given sector, as well as the R². All metrics are averages across all funds within a regional subsample. Columns 1 and 2 report the mean and standard deviation of each statistic obtained from the weak style analysis of Model 1. Column 3 and 4 display empirical results from the semi-strong style analysis, i.e. Model 2. The last two columns show statistics from the strong style analysis of Model 3. Denmark, Italy, Switzerland, Sweden are omitted from the global fund analyses for reasons of multicollinearity. For the same reason, Finland and France are omitted from the European fund analyses.
- 27 -
Table 5 Style-based Performance: Macro-analysis
Model 1 Model 2Panel A. Average alphas
(t-stat)
Australia -0.001 0.002 -0.001 0.001 (4.13) (12.54) Asia -0.001 0.014 -0.004 0.011 (0.21) (1.28) Europe 0.004 0.007 0.002 0.006 (4.08) (2.08)
North America -0.003 0.005 -0.003 0.005 (5.26) (6.23) Global 0.002 0.026 0.002 0.017 (0.70) (1.32)
Panel B. Distribution of alphas Asia Australia Europe North America Global
Significantly positive α Number of funds 0 / 0 0 / 0 13 / 17 4 / 1 2 / 14 Percentage of funds (0%/0%) (0%/0%) (25%/33%) (4%/1%) (4%/27%)
Significantly negative α Number of funds 1 / 1 18 / 26 2 / 9 36 / 40 16 / 10 Percentage of funds (7%/7%) (15%/22%) (4%/17%) (33%/36%) (31%/19%)
Observations 15 119 52 110 106 Note: Panel A of this table reports the performance statistics for each geographic real estate mutual fund region relative to the global real estate securities market as represented by the four continental GPR indices. The average Jensen’s alpha and the corresponding standard deviation are reported, as well as the t-statistic testing the null-hypothesis that the average alpha is equal to zero. Panel B of this table reports the number of funds in each geographic subsample that significantly outperform or underperform the global and the continental style benchmarks. The percentage of funds with significant alphas is exhibited in brackets below the absolute values. The figures separated by a slash correspond to Models 1 and 2, respectively.
- 28 -
Table 6
Style-based Performance: Micro-analysis
Model 1 Model 2 Model 4Panel A. Average alphas
(t-stat)
Australia -0.001 0.002 -0.002 0.001 -0.001 0.002 (3.61) (14.23) (4.37)
Asia 0.001 0.022 0.002 0.017 0.009 0.010 (0.16) (0.40) (3.81)
Europe 0.005 0.007 0.003 0.007 0.004 0.006 (4.33) (3.65) (4.25)
Observations 15 119 52 110 106 Note: Panel A of this table reports the performance statistics for each geographic real estate mutual fund region relative to the local real estate securities market as represented by the GPR indices. The average Jensen’s alpha and the corresponding standard deviation are reported, as well as the t-statistic testing the null-hypothesis that the average alpha is equal to zero. Panel B of this table reports the number of funds in each geographic subsample that significantly outperform or underperform the local style benchmarks. The percentage of funds with significant alphas is exhibited in brackets below the absolute values. The figures separated by a slash correspond to Models 1, 2, and 3 respectively.