84
Investments in Infrastructure in Brazil: Keep Investing Despite the Economic Adjustment
Investments in Infrastructure in Brazil: Keep Investing Despite the Economic Adjustment Investments in
Infrastructure in Brazil:Keep Investing Despite the Economic Adjustment
www.cbic.org.br
realização
www.senai.br
apoio

Investments in Infrastructure in Brazil:Keep Investing Despite the Economic Adjustment

INVESTMENTS IN INFRASTRUCTURE IN BRAZIL: KEEP INVESTING DESPITE THE ECONOMIC ADJUSTMENTBrasília-DF, maio de 2015
Câmara Brasileira da Indústria da Construção - CBIC SQN - Quadra 01 - Bloco E - Edifício Central Park - 13º Andar EP 70.711-903 - Brasília/DF Telefone: (61) 3327-1013
Investments in Infrastructure in Brazil:Keep Investing Despite the Economic Adjustment

6 6
[ SUMMARY ][ Executive Summary ] . . . . . . . . . . . . . . . . . . . . . . . . . . . . . . . . . . . . . . . . . . . . . . . . . . . . . . . . . . . . . . . . . . . . . . . . . . . . . . . . . . 11
[ introdução ] . . . . . . . . . . . . . . . . . . . . . . . . . . . . . . . . . . . . . . . . . . . . . . . . . . . . . . . . . . . . . . . . . . . . . . . . . . . . . . . . . . . . . . . . . . . . 16
#1 [ Evolution of investments in infrastructure in Brazil ] . . . . . . . . . . . . . . . . . . . . . . . . . . . . . . . . . . . . 22
#2 [ Why does Brazil invest little in infrastructure? ] . . . . . . . . . . . . . . . . . . . . . . . . . . . . . . . . . . . . . . . . . 32
#2.1 [ Lack of funds: low savings rate ] . . . . . . . . . . . . . . . . . . . . . . . . . . . . . . . . . . . . . . . . . . . . . . . . . . . . . . . . . . . . . . . . . 32
#2.2 [ Lack of incentives for investing in infrastructure ] . . . . . . . . . . . . . . . . . . . . . . . . . . . . . . . . . . . . . . . . . . . . . . 35
[ Fall in public investments in infrastructure ] . . . . . . . . . . . . . . . . . . . . . . . . . . . . . . . . . . . . . . . . . . . . . . . . . . . . . . . . . . 36
[ Lack of investment opportunities for the private sector ] . . . . . . . . . . . . . . . . . . . . . . . . . . . . . . . . . . . . . . . . . . . 37
#3 [ Why is important to invest, and to invest in infrastructure? ] . . . . . . . . . . . . . . . . . . . . . . . . . . . 42
#4 [ Investments in infrastructure in a fiscal adjustment program ] . . . . . . . . . . . . . . . . . . . . . . . . 50
#4.1 [ On the need for a macroeconomic adjustment ] . . . . . . . . . . . . . . . . . . . . . . . . . . . . . . . . . . . . . . . . . . . . . . . . . 50
#4.2 [ Particularities of the current crisis ] . . . . . . . . . . . . . . . . . . . . . . . . . . . . . . . . . . . . . . . . . . . . . . . . . . . . . . . . . . . . . . 56
#4.2.1 [ Limitations of aggregated supply ] . . . . . . . . . . . . . . . . . . . . . . . . . . . . . . . . . . . . . . . . . . . . . . . . . . . . . . . . . 56
#4.2.2 [ Current crisis contextual aspects ] . . . . . . . . . . . . . . . . . . . . . . . . . . . . . . . . . . . . . . . . . . . . . . . . . . . . . . . . . . 58
#4.3 [ It is critical to maintain public sector investments in infrastructure and expand the grant program ] 65
#4.4 [ The My House My Life housing program ] . . . . . . . . . . . . . . . . . . . . . . . . . . . . . . . . . . . . . . . . . . . . . . . . . . . . . . . . 68
#Conclusion . . . . . . . . . . . . . . . . . . . . . . . . . . . . . . . . . . . . . . . . . . . . . . . . . . . . . . . . . . . . . . . . . . . . . . . . . . . . . . 74
#References. . . . . . . . . . . . . . . . . . . . . . . . . . . . . . . . . . . . . . . . . . . . . . . . . . . . . . . . . . . . . . . . . . . . . . . . . . . . . . 78
[ SUMÁRIO EXECUTIVO ]
1010
Infrastructure investments in Brazil are small - between 2% and 2.5% of the GDP. This is a low fi-gure by all means: compared to our history, to cou-ntries with similar income levels and to our needs. From the 1970s to the 2000s, investments in infras-tructure fell steadily to an average of 2.2% of the GDP from an average of 5.4 of the GDP. This per-formance is strongly tied to the reduction of spen-ding by the public sector. In fact, public sector's in-vestments fell to 1.2% of the GDP in the 2000s from 3.7% of the GDP in the 1970s. In the same period, private sector's investments fell to 1.0% of the GDP from 1.3% of the GDP.
Two key factors help to understand why invest-ment in infrastructure in Brazil is short: i) econo-mic adjustment programs and ii) the private sector have not replaced investments made by the public sector. Since the 1980s, Brazil has been experien-cing several economic crises, being forced in many of them (such as in 1982, 1990, 1999, and 2003) to make fiscal adjustments. Traditionally fiscal ad-justments focus on slashing investments as oppo-sed to operational expenditure. Despite the poor quality of this type of adjustment, it is easier to be implemented. There is less political pressure when services that still do not exist are cut. Additionally, as larger works cost more, there is a lot of savings to achieve by eliminating expenses with few wor-ks.
The second reason for the fall in investment ra-tes in infrastructure is that the private sector did not replace the public sector. When the privatization program was launched, the State expected to per-form the role of regulator, transferring to the priva-te sector the job of investing. Improper regulatory benchmark, lack of autonomy for the regulating entities, high capital cost, legal insecurity, and an excessive policy focus on low fees made difficult for the private sector to entry.
Investments in infrastructure, after reaching the bottom in the 2000s, resumed growth after the launch of PAC, achieving 2.45% of the GDP in 2013. There is no data for 2014, but facing the perspectives of overall investment rate reduction, it is expected that the investment in infrastructu-re have also been reduced. It is feared now that due to another fiscal adjustment, once more the government cuts investments more intensely than current expenses.
We understand that this policy is risky and unnecessary. It is risky because the lack of infras-tructure is huge, both quantitative and qualitative. Even admitting that some infrastructure sectors are performing well, such as telecom, the overall situation is quite poor. The most recent World Eco-nomic Forum report for 2014/15, for instance, ran-ked Brazil's infrastructure in 120th place out of 144 countries, with a negative highlight on highways and ports.
We cannot be surprised with the problems of Brazilian infrastructure. According to the interna-tional experience, investment in infrastructure should be at least of 3% of the GDP to keep the current capital stock. This is a higher rate than the current one, which is around 2.5% of the GDP. In other words, we are barely managing to keep our infrastructure stock. This is terrible for a country such so many needs in this area. In order to achieve East Asia's emerging countries levels, investment in infrastructure should be at around 5% of the GDP, which would equal to a yearly additional ef-fort of approximately R$ 125 billion.
Brazil cannot afford to let its infrastructure to drag behind other countries, despite the investment needs are high. The literature shows how investing in infrastructure supported the strong growth in East Asia. For Latin America, there are evidences that
[ EXECUTIVE SUMMARY ]
11
these investments are able to increase the potential GDP growth rate and to reduce inequality. For Brazil, particularly, to improve and expand infrastructure is even more important face to the low productivity growth.
As a long term strategy to increase investments in infrastructure, it is necessary: i) to increase local savings rate to generate the funds required to fi-nance expenditures; ii) to make investing more attractive to the private sector, which requires to build a business environment more favorable and a behavior more inclined to privatizations by the public sector; iii) better planning to avoid waste.
In the short term, even admitting the need for macroeconomic adjustment, we understand that it is not necessary or recommendable to cut investments. It is not necessary because, in the current crisis, there is no exchange rate crisis and Brazil does not face liquidity restriction, instead of past’s crises. In this case, financially sound pro-jects, i.e., those in which the internal return rate is equal or higher than debt cost, should prosper. When there is liquidity restriction, the country does not have the funds required to cover the initial expenses incurred by the project's imple-mentation.
It is not advisable to cut investments in in-frastructure for two key reasons. First, the cur-rent crisis is mainly a demand crisis. Both the ins-talled capacity utilization rate as unemployment rates indicate that there is no idle capacity in the economy, albeit we are undergoing a stagnation period. In this context, it is critical to increase productivity. In the long term, this is achievab-le by investing heavily in human capital. But, in the short term, the best strategy is to expand the aggregated supply with investments. Invest-ments in infrastructure are particularly desirable
in the current environment, as they positively impact economy's productivity across the board.
Secondly, we understand that despite there is no idle capacity, a macroeconomic adjustment program should lead to more unemployment and reduction of the installed capacity utilization. In normal crises, a well executed adjustment pro-gram restores economic agent trust, that resume purchasing and investing. The problem is that in the current crisis, the prognostics are not favo-rable to recover the aggregated demand com-ponents, especially for investing. Adding to the current uncertain environment, which is common in times of crisis, the consequences of the so-cal-led "Carwash Operation", high debt levels and the worsening of risk perceptions shall force Petro-bras, the state-owned oil company in charge of some 10 of investments made in Brazil, to review its expenditure plans. A looming rationing of wa-ter and energy shall cause private sector invest-ments to reduce even further. If the private sector is not investing, then the public sector should do it.
Finally, we consider the My House My Life hou-sing program (known for its initials in Portuguese, MCMV). This is one of the most important social programs in terms of reach, both for expenditures and the number of beneficiaries. Despite it does not bring any future tax revenue for the gover-nment, as other investments do, MCMV directly impacts the country investment rate and causes the GDP to increase due to rents saved.
MCMV has high costs, but its social reach is also of relevance. Low income families cannot afford to rent or buy a house. Poorer families will not be able to live in decent houses if some subsidy is offered to them. Despite the program's increasing expen-ditures, housing deficit remains high in Brazil, rea-ching almost 6 million houses. Credit is still low at
12
approximately 8%, below the emerging econo-mies average that is near 12%. Thus, it is necessary to expand the housing market in Brazil. Finally, in-centives to the civil construction industry may be important in periods of economic stagnation, such as the one we are in now, as it is a workforce-inten-sive industry that can contribute to prevent a spike in the unemployment rate.
13

[ INTRODUCTION ]
Infrastructure investments in Brazil are small - between 2% and 2.5% of the GDP. These low ra-tes led us to a poor infrastructure both in quanti-tative and qualitative terms. Gaps are particularly obvious in areas as highways, ports, railroads, sanitation and energy. According to experts, we would have to invest at least 3% of the GDP to keep the current infrastructure stock. To catch up with fast-growth emerging countries such as those in East Asia, we should be investing at least 5% of the GDP on an ongoing basis.
Challenges to invest in infrastructure are enor-mous. Both the public sector and the private sector have relevant contributions for these investments. It turns out that in order to the private sector to in-vest, it is necessary to enhance the legal framework so to attract companies with higher technical and financial capabilities to operate in the industry, and to create a business-friendly environment. Particu-larly, the Grantor must establish clear, stable, and foreseeable rules.
Investments by the public sector are largely constrained by the fragile fiscal situation. Gover-nment spends most of the resources in funding expenses (social insurance, employees and social programs), and little is left to invest. The current situation is even more concerning. Brazil faces stagnation, which requires a fiscal adjustment. In the other hand, adjustment programs usually imply in expense reduction, and investments tend to be proportionally even more reduced.
The main goal of this study is to show that the government should avoid cutting investments in infrastructure even when required to perform a fiscal adjustment. In simple terms, we justify this conclusion through the following facts:
[ INTRODUCTION ]
I) This is an aggregated supply crisis so that a conventional adjustment program, in which in-vestments are cut to the bone, would make the country's situation worse in the long term, as it will limit future supply expansion
II) Instead of past crises, there is no liquidity gaps in this one, which allows Treasury to increa-se debt if the plan is to invest in infrastructure
III) The need for the Central Bank to adopt severe measures against inflation is lower today than in the 1999 and 2003 crises, so that incenti-ves for the aggregated demand by public invest-ments shall not cause strong reactions from the Central Bank
IV) Investments in infrastructure, if well se-lected, will not alter government financial health from a long-term standpoint, as expenses today will be matched by larger tax revenues or by cut-ting other expenses in the future.
To develop this line of thought, we divided this Report into four chapters, in addition to this Introduction and the Conclusion.
Chapter One describes where investments, in general and in infrastructure, stand in Brazil today. As we shall see, Brazil invests little in in-frastructure: little when compared to the past, little in relation to countries with similar income levels, and little in relation to our needs. From the 1970s until the mid 2000s, investments in infrastructure in proportion to the GDP fell con-tinuously. Since then, investments rose for some years by it threatens to fall again since 2014.
The goal of Chapter Two is to explain why we invest so little. As we stated before, the public sector is fiscally restrained and the public sector
16
17
faces a not so much friendly business environ-
ment. Additionally, Brazil saves little, which limits
available funds for investing.
Chapter Three shows that investing in infras-
tructure is important. The Chapter begins by
showing that Brazil presents low growth levels in
historical terms. However, in the past, producti-
vity gains were obtained easier. The stagnation
in the Brazilian productivity in the last years, ad-
ded to the low growth of the population able to
work, implies that it is necessary to expand the
stock of capital available to the economy for Bra-
zil to resume growth. It is critical that low funds
available are invested in activities that genera-
te higher returns. Investments in infrastructure
should be prioritized as they allow for efficiency
gains all over the economy.
Finally, Chapter Four discusses the need for
investing in infrastructure during fiscal adjust-
ment. We start the Chapter by showing the need
for implementing an adjustment policy. Later on,
we discuss the particularities of the current stag-
nation situation to conclude that investments in
infrastructure shall be preserved. The Chapter
ends with a brief explanation on the My House,
My Life housing program (MCMV).
The last section summarizes the results found
and presents the main conclusions.

#1 [ EVOLUTION OF INVESTMENTS IN INFRASTRUCTURE IN BRAZIL ]
Poor quality infrastructure is often pointed
as one of the barriers to be overcome so that
Brazil presents sustainable growth rates at le-
vels that are compatible with our development
stage. Our needs in this are arose from low in-
vestments that, in turn, are caused by mistaken
policies and actions that will be discussed in
Chapter Two. In this Chapter 1, we will focus on
numbers more than in causes.
As we shall see, investments in infras-
tructure in Brazil are low in relation to the
past, in relation to countries with similar
development levels, and in relation to our
needs.
Since 1970, investments in infrastructure
has fallen, as well as aggregated investments.
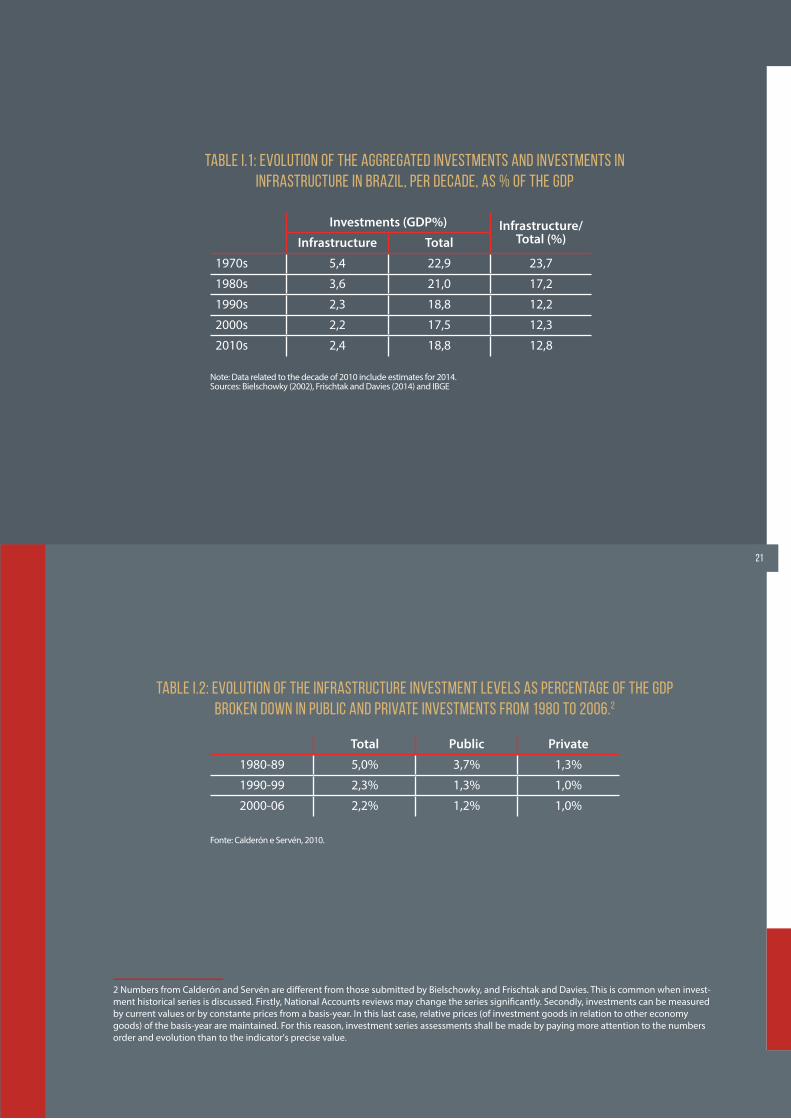
Table I.1 shows average investment amounts
per decade.
We see a double phenomenon: from the
1970s to the 2000s, aggregate investment and
investment in infrastructure rates fell. Howe-
ver, the fall in infrastructure investments were
deeper. Thus, in 1970, 75% of total invest-
ments were directed to infrastructure. Cur-
rently, this ration fell to near 1/8.
Qualitative aspects for this fall are also
worrisome. A 50% reduction in investments
brings different impacts to the economy,
depending on the starting level. Thus, if
the infrastructure investment rate falls to
5% from 10% of the GDP, the consequences
for the economy are less damaging than if
the fall is to 2.5% from 5% of the GDP. This
is because, as pointed by Frischtak and Da-
vies (2014), there is some consensus in the
international literature that it is necessary
to spend at least 3% of the GDP to ensure
that the infrastructure stock is maintained.
Investments below this rate would lead to
capital stock depreciation in the long term,
without the corresponding maintenance.
Investments in infrastructure are between 2
percent and 3 percent of the GDP for almost
three decades in Brazil - in other words, the
country is being able to replace capital de-
preciating on infrastructure.
If we break down the evolution of invest-
ments in infrastructure by investor type, pu-
blic or private, we will see a strong reduction
on public investments. It would be expected
a reduction on public investments due to the
privatization programs that took place in that
period. Such privatization programs should
cause an increase in private investments, but
this did not happen. The table below was ex-
#1 [ EVOLUTION OF INVESTMENTS IN INFRASTRUCTURE IN BRAZIL ]
20
1 - Argentina, Bolívia, Brasil, Chile, Colômbia, México e Peru.
21
2 Numbers from Calderón and Servén are different from those submitted by Bielschowky, and Frischtak and Davies. This is common when invest-ment historical series is discussed. Firstly, National Accounts reviews may change the series significantly. Secondly, investments can be measured by current values or by constante prices from a basis-year. In this last case, relative prices (of investment goods in relation to other economy goods) of the basis-year are maintained. For this reason, investment series assessments shall be made by paying more attention to the numbers order and evolution than to the indicator's precise value.
Table I.1: Evolution of the aggregated investments and investments in infrastructure in Brazil, per decade, as % of the GDP
Note: Data related to the decade of 2010 include estimates for 2014.Sources: Bielschowky (2002), Frischtak and Davies (2014) and IBGE
Investments (GDP%) Infrastructure/Total (%)Infrastructure Total
1970s 5,4 22,9 23,7
1980s 3,6 21,0 17,2
1990s 2,3 18,8 12,2
2000s 2,2 17,5 12,3
2010s 2,4 18,8 12,8
Table I.2: Evolution of the infrastructure investment levels as percentage of the GDP broken down in public and private investments from 1980 to 2006.2
Fonte: Calderón e Servén, 2010.
Total Public Private
1980-89 5,0% 3,7% 1,3%
1990-99 2,3% 1,3% 1,0%
2000-06 2,2% 1,2% 1,0%
22
tracted from Calderón and Servén (2010) and
shows that the public investment in infrastruc-
ture in Brazil, as measured in proportion to the
GDP, fell approximately two thirds between the
1980s and 2000s whilst private investments
fell less than 30% or 0.3 percentage point in
the same period.
Private investments reduction in infras-
tructure is somehow unexpected. In the seven
Latin American economies3 analyzed by Cal-
derón and Servén (2010, public investments
in infrastructure fell due to fiscal adjustment
programs and privatization, but private invest-
ments have risen, albeit not in the same mag-
nitude.
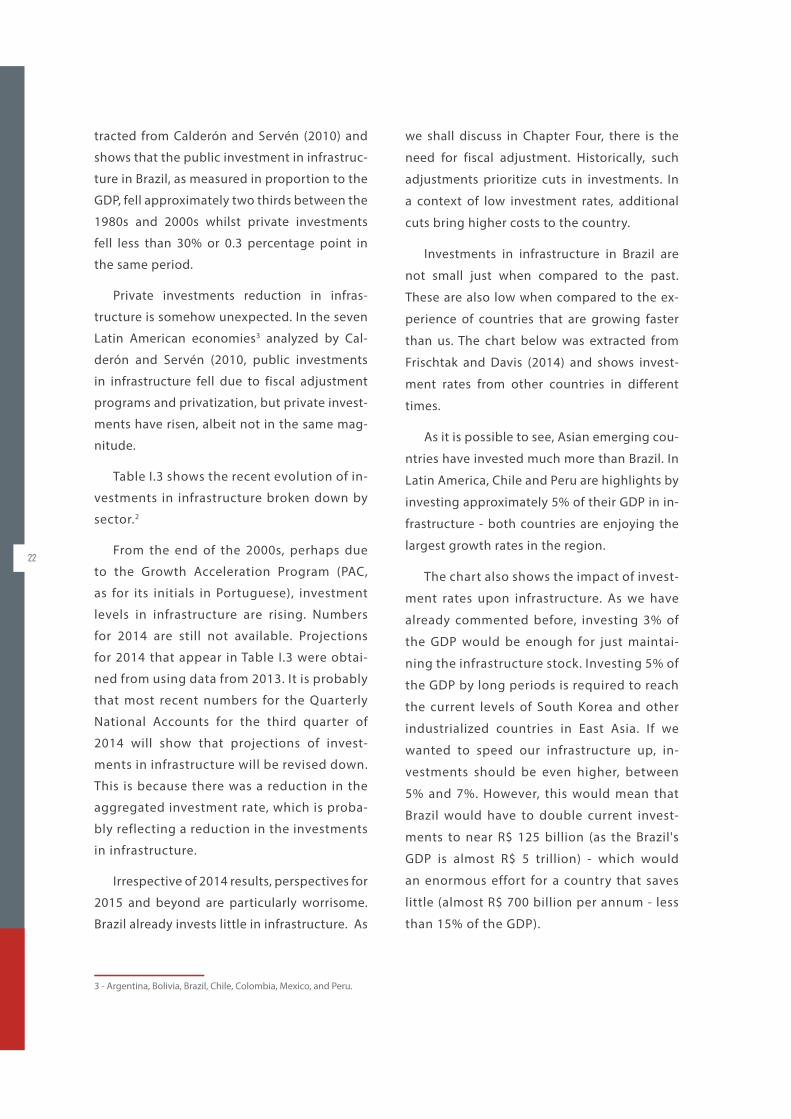
Table I.3 shows the recent evolution of in-
vestments in infrastructure broken down by
sector.2
From the end of the 2000s, perhaps due
to the Growth Acceleration Program (PAC,
as for its initials in Portuguese), investment
levels in infrastructure are rising. Numbers
for 2014 are still not available. Projections
for 2014 that appear in Table I.3 were obtai-
ned from using data from 2013. It is probably
that most recent numbers for the Quarterly
National Accounts for the third quarter of
2014 will show that projections of invest-
ments in infrastructure will be revised down.
This is because there was a reduction in the
aggregated investment rate, which is proba-
bly reflecting a reduction in the investments
in infrastructure.
Irrespective of 2014 results, perspectives for
2015 and beyond are particularly worrisome.
Brazil already invests little in infrastructure. As
we shall discuss in Chapter Four, there is the
need for fiscal adjustment. Historically, such
adjustments prioritize cuts in investments. In
a context of low investment rates, additional
cuts bring higher costs to the country.
Investments in infrastructure in Brazil are
not small just when compared to the past.
These are also low when compared to the ex-
perience of countries that are growing faster
than us. The chart below was extracted from
Frischtak and Davis (2014) and shows invest-
ment rates from other countries in different
times.
As it is possible to see, Asian emerging cou-
ntries have invested much more than Brazil. In
Latin America, Chile and Peru are highlights by
investing approximately 5% of their GDP in in-
frastructure - both countries are enjoying the
largest growth rates in the region.
The chart also shows the impact of invest-
ment rates upon infrastructure. As we have
already commented before, investing 3% of
the GDP would be enough for just maintai-
ning the infrastructure stock. Investing 5% of
the GDP by long periods is required to reach
the current levels of South Korea and other
industrialized countries in East Asia. If we
wanted to speed our infrastructure up, in-
vestments should be even higher, between
5% and 7%. However, this would mean that
Brazil would have to double current invest-
ments to near R$ 125 billion (as the Brazil's
GDP is almost R$ 5 trillion) - which would
an enormous effort for a country that saves
little (almost R$ 700 billion per annum - less
than 15% of the GDP).
3 - Argentina, Bolivia, Brazil, Chile, Colombia, Mexico, and Peru.
23
Table I.3: Evolution of investments in infrastructure in Brazil broken down by sector (in GDP %)
Source: Calderón and Servén, 2010.
Energy Transportation Telecom Sanitation Total
Década de 2000 0,64 0,64 0,70 0,18 2,162000s 0,73 0,84 0,50 0,17 2,242011 0,73 0,91 0,54 0,21 2,392012 0,75 1,04 0,45 0,21 2,45
2013•• 0,75 1,19 0,37 0,21 2,522014**
Table I.4: Investment in infrastructure as proportion of the GDP for selected countries and periods:
Source: Frishtak and Davies, 2014.
Up to 3% (necessary level to keep existing capital stock per
capita and gradually give 100% access to water/sanitation and
energy services
From 4% to 6%. To reach current levels of South
Korea and other industriali-zed countries in East Asia.
From 5% to 7%. Drive economic growth and take 15-20 years to
get closer to developed countries.
Brazil (2010 - 13) = 2,36% Chile (2001 - 06) = 4,57% China (2003) = 7,3%
Brazil (2007) = 1,84% Chile (2008 - 11) = 5,10% China (2010) = 13,4%
Peru (2001 - 06) 1,51% Peru (2008 - 11) = 4,22% Vietnam (2003) = 9,9%
India (2005 - 09) = 4,13% Vietnam (2009) = 10,3%
India (2009 - 10) = 4,80% Thailand (2003) = 15,4%
India (2013 - 17) = 6,00% Thailand (2009) = 15,6%
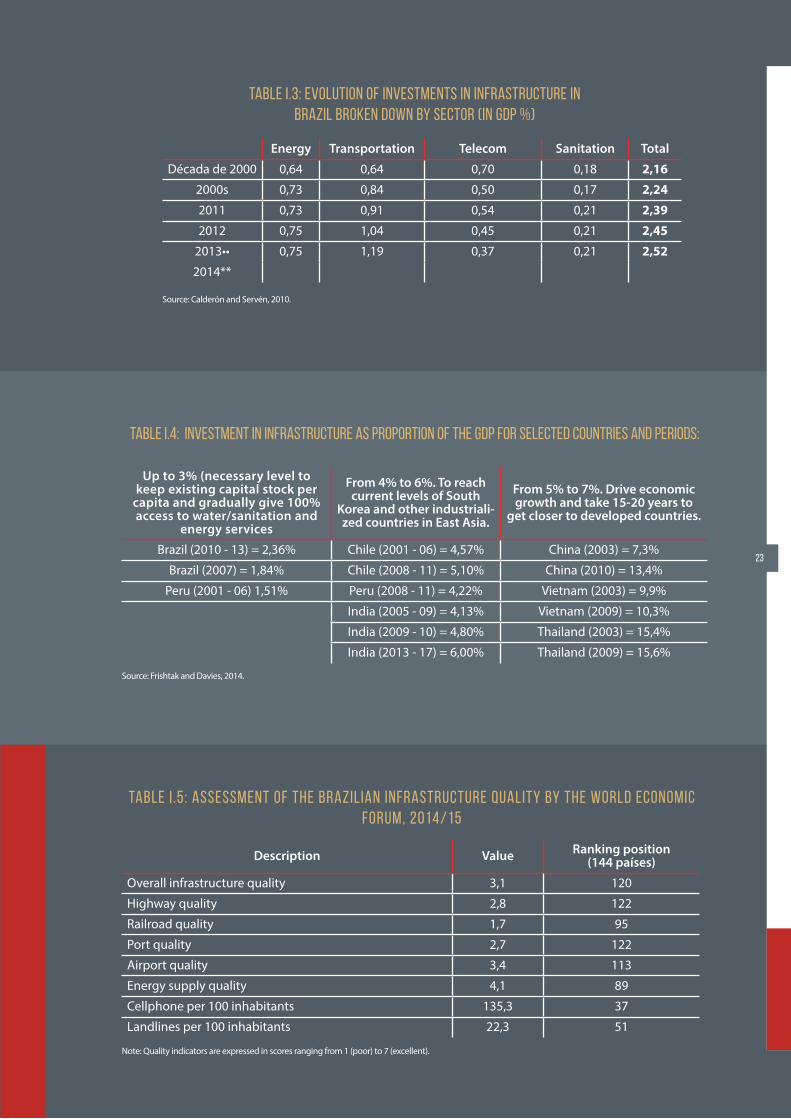
Table I .5: Assessment of the Brazilian infrastructure quality by the World Economic Forum, 2014/15
Note: Quality indicators are expressed in scores ranging from 1 (poor) to 7 (excellent).
Description Value Ranking position (144 países)
Overall infrastructure quality 3,1 120
Highway quality 2,8 122
Railroad quality 1,7 95
Port quality 2,7 122
Airport quality 3,4 113
Energy supply quality 4,1 89
Cellphone per 100 inhabitants 135,3 37
Landlines per 100 inhabitants 22,3 51
Due to small investment levels, it is not stran-
ge that our infrastructure is poor, both quanti-
tatively and qualitatively. The World Economic
Forum 2014/15 Global Competitiveness Report
ranked Brazil's infrastructure in the 120th place
out of a list with 144 countries. The table below
shows the scores obtained by each assessed
item (maximum of 7) as well as the country's
ranking. As infrastructure involves several sec-
tors, it is just natural that some have better sco-
res than others.
Other assessments show that Brazil has a
poor performance in international compari-
sons at a varying degree. Donaubauer et al
(2014) elaborated an infrastructure quality
index where Brazil is ranked 65th, out of 140
countries. In Transportation and Energy sec-
tors, Brazil was ranked 128th and 78th. As well
as in the World Economic Forum's ranking,
our best performance was in Telecom, where
we ranked 48th . According to the authors,
there was an important evolution between
1990, 2000 and 2010, when we jumped from
91th to 63th and then to 57th in the ranking.
Since then, we fell nine positions.
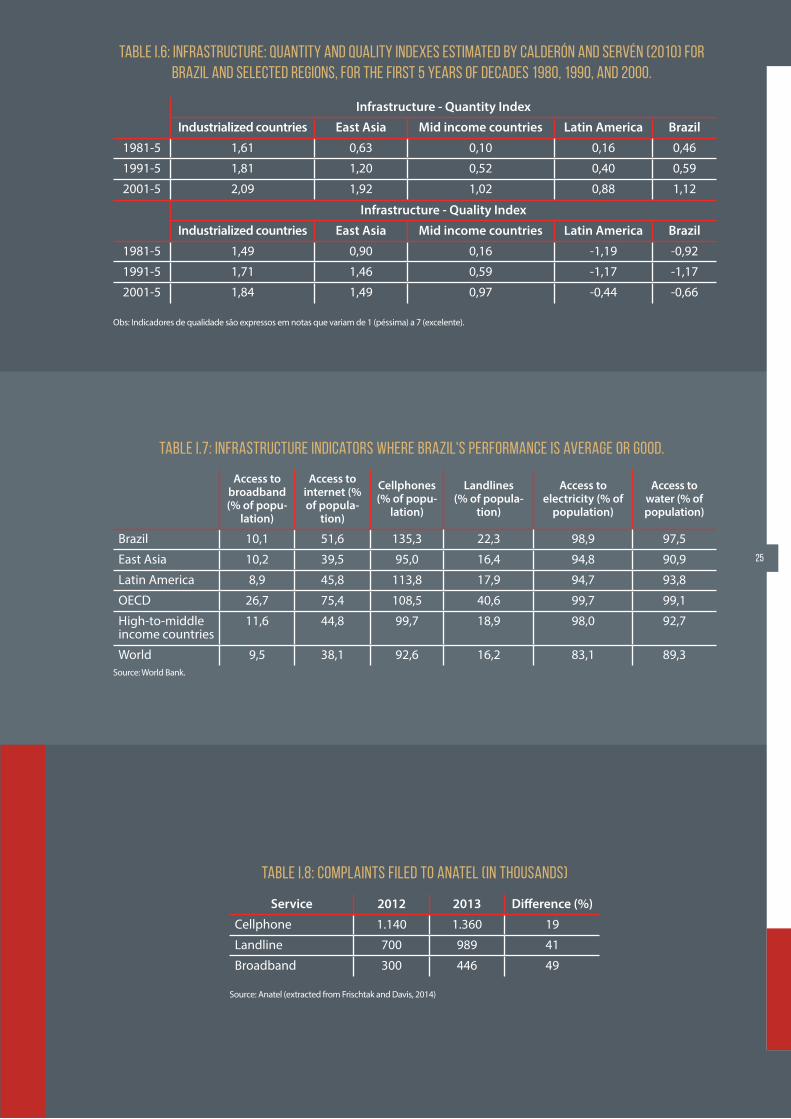
Calderón and Servén (2010) also show how
infrastructure in Brazil is delayed. The authors
have elaborated an Infrastructure Quality and
Quantity Index covering Telecom, Energy and
Highways. Results are found in Table I.6.
As it is possible to see, at the beginning of
the 1980s, the quantity of infrastructure in Bra-
zil was not so bad if compared to countries in
East Asia, middle-income countries and Latin
America. Twenty years later, we are still better
than middle-income countries and Latin Ame-
rica, but the gap is becoming shorter. For East
Asian countries, we were in a worse situation at
the beginning of the 1980s and the gap increa-
sed considerably. It is worth to mention that
East Asia arrived to the 2000s with the quantity
of infrastructure almost at the same level of de-
veloped countries.
In relation to the quality of our infrastructu-
re, results cover Brazil in shame. At the begin-
ning of the 1980s, the quality of our infrastruc-
ture was way below those of the industrialized
countries, countries in East Asia and middle-in-
come countries. We were above only Latin Ame-
rica. Twenty years later, we would fall behind all
these groups.
As infrastructure covers several sectors, it
is natural that some differences arise among
them. We have seen that, according to compo-
nents of aggregated indexes presented above,
some sectors are better than others, such as
Telecom. Table I.7 shows some indicators whe-
re Brazil is going well or, at least, acceptably as
the country's performance is not way below the
average of high-to-middle income countries.
As it can be seen, Telecom indicators (ac-
cess to broadband and to internet, popula-
tion with cell phones and landlines) Brazil is
doing relatively OK. In the case of broadband,
internet and landlines, we are well below the
OECD average but closer to the high-to-mi-
ddle income countries. For cell phones, our
density is above the OECD average. We also
perform well in access to electricity and trea-
ted water, with almost 100% of the popula-
tion served by these services.
Results above are for infrastructure quantity.
For Telecom, the World Bank did not publish
data related to the quality of services. Table I.8
was extracted from Frischtak and Davies (2014)
and shows a possible deterioration of services
as measured by the increase of the number of
complaints made to Anatel. Such deterioration
would be consequence of a reduction of invest-
ments as shown in Table I.3.
24
25
Table I.7: Infrastructure indicators where Brazil's performance is average or good.
Source: World Bank.
Access to broadband (% of popu-
lation)
Access to internet (% of popula-
tion)
Cellphones (% of popu-
lation)
Landlines (% of popula-
tion)
Access to electricity (% of
population)
Access to water (% of population)
Brazil 10,1 51,6 135,3 22,3 98,9 97,5
East Asia 10,2 39,5 95,0 16,4 94,8 90,9
Latin America 8,9 45,8 113,8 17,9 94,7 93,8
OECD 26,7 75,4 108,5 40,6 99,7 99,1
High-to-middle income countries
11,6 44,8 99,7 18,9 98,0 92,7
World 9,5 38,1 92,6 16,2 83,1 89,3
Table I.6: Infrastructure: Quantity and Quality Indexes estimated by Calderón and Servén (2010) for Brazil and selected regions, for the first 5 years of decades 1980, 1990, and 2000.
Obs: Indicadores de qualidade são expressos em notas que variam de 1 (péssima) a 7 (excelente).
Infrastructure - Quantity Index
Industrialized countries East Asia Mid income countries Latin America Brazil
1981-5 1,61 0,63 0,10 0,16 0,46
1991-5 1,81 1,20 0,52 0,40 0,59
2001-5 2,09 1,92 1,02 0,88 1,12
Infrastructure - Quality Index
Industrialized countries East Asia Mid income countries Latin America Brazil
1981-5 1,49 0,90 0,16 -1,19 -0,92
1991-5 1,71 1,46 0,59 -1,17 -1,17
2001-5 1,84 1,49 0,97 -0,44 -0,66
Table I.8: Complaints filed to Anatel (in thousands)
Source: Anatel (extracted from Frischtak and Davis, 2014)
Service 2012 2013 Difference (%)
Cellphone 1.140 1.360 19
Landline 700 989 41
Broadband 300 446 49
26
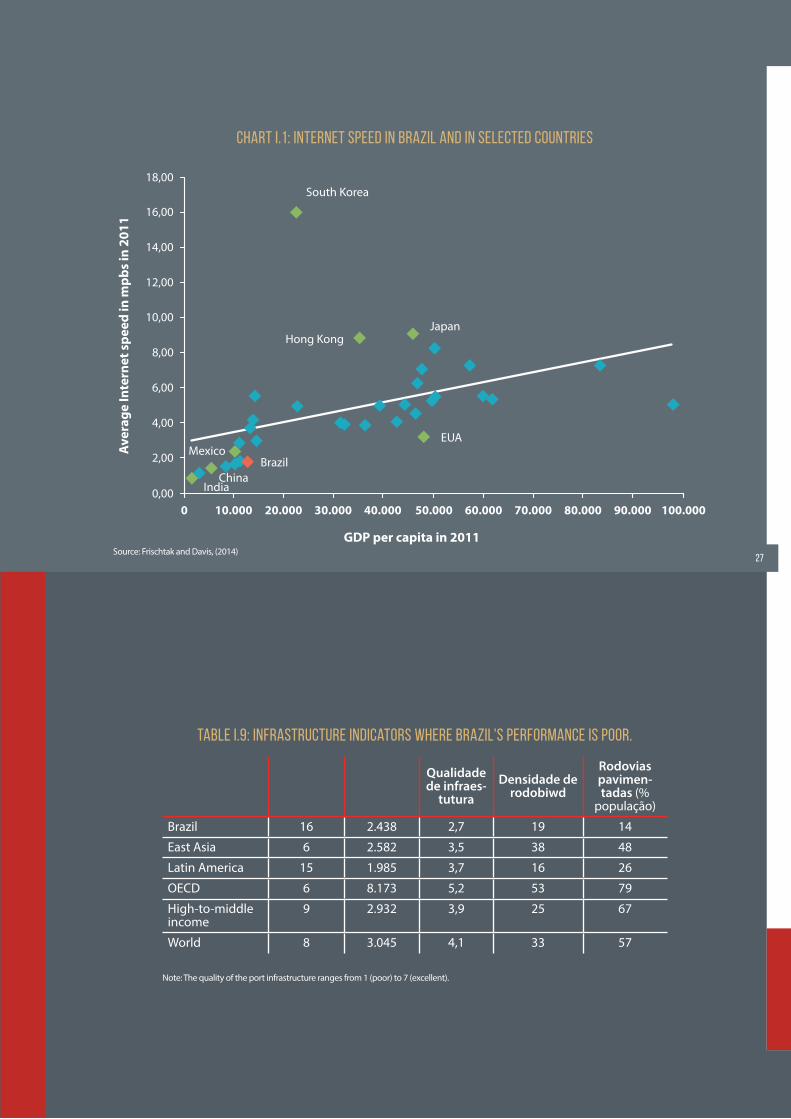
Chart I.1, extracted from the same authors, sho-ws that Internet speed in Brazil is slow and below the expectation of our per capita income level.
If the access to the energy grid is almost rea-
ching 100% of the Brazilian population, energy
consumption and the quality of the service (mea-
sured by losses) are below the average of high-
-to-middle income countries and way behind
of results found in developed economies. As for
highways, both quantity and quality (measured
by the percentage of paved highways) are poor.
The quality of Brazilian ports is also below those
of countries with income similar to ours and much
behind those found in East Asia and in developed
countries. Table I.9 summarizes all results from the
World Bank.
The CNT Rodovias 2014 survey (CNT, 2014)
assessed the quality of 98.500 kilometers of
highways in Brazil - 79.500 km managed by
the public sector and 19.000 km managed by
the private sector. Only 37.9% of highways are
ranked as excellent or good. This figure rises
to 74.1% for granted highways and falls to
29.3% for public highways. Equally, 23.9% of
highways are in bad or poor conditions, being
38.2% of public highways and only 4.1% for
private highways.
Finally, another infrastructure sector in whi-
ch Brazil needs to improve a lot is sanitation.
Although almost 100% of the population has
access to water, sanitation is still very poor. Ac-
cording to PNAD, only 58% of houses had ac-
cess to sanitation in 2014. However, not all se-
wage is treated, being directly thrown in rivers
or in the sea. According to Trata Brasil Institute,
treated sewage corresponded to only 38% of
the water consumed5. According to a report by
Trata Brasil Institute and the Brazilian Business
Council for Sustainable Developed (Conselho
Empresarial Brasileiro para o Desenvolvimento
Sustentável, CEBDS), Brazil is 112th among 200
countries in water and sanitation services. Bra-
zil's performance is poor both at service levels
and the recent evolution of indicators.6
In short, investment levels are below 3% of
the GDP - the level considered as a minimum
for maintaining the current infrastructure stock
- for 20 years now. Low investments lead to low
supply and/or low quality of services. Analysts
recommend that investments should be at 5%
of the GDP as a minimum. Results, though, are
not the homogeneous. Sectors such as telecom,
energy and water managed to become almost
universal, although quality indicators are still
not satisfactory. In other sectors, such as high-
ways, ports and sanitation, the amount of servi-
ce provided is not enough to meet the popula-
tion needs.
5 Refer to: http://www.tratabrasil.org.br/novo-ranking-do-instituto-trata-brasil-mostra-os-avancos-e-desafios-para-a-universalizacao-do-saneamento-basico-nas-100-maiores-cidades-do-pais
6 Refer to: http://cebds.org/noticias/estudo-destaca-beneficios-com-expansao-saneamento-brasil/#.VRDfZPzF8Xs
27
Chart I.1: Internet speed in Brazil and in selected countries
Japan
South Korea
Hong Kong
EUA
BrazilMexico
ChinaIndia0,00
2,00
4,00
6,00
8,00
10,00
12,00
14,00
16,00
18,00
0 10.000 20.000 30.000 40.000 50.000 60.000 70.000 80.000 90.000 100.000
GDP per capita in 2011
Ave
rage
Inte
rnet
spe
ed in
mpb
s in
201
1
Table I.9: Infrastructure indicators where Brazil's performance is poor.
Note: The quality of the port infrastructure ranges from 1 (poor) to 7 (excellent).
Qualidade de infraes-
tuturaDensidade de
rodobiwd
Rodovias pavimen-tadas (%
população)
Brazil 16 2.438 2,7 19 14
East Asia 6 2.582 3,5 38 48
Latin America 15 1.985 3,7 16 26
OECD 6 8.173 5,2 53 79
High-to-middle income
9 2.932 3,9 25 67
World 8 3.045 4,1 33 57
Source: Frischtak and Davis, (2014)
28
29#2 [ WHY DOES BRAZIL INVEST LITTLE IN INFRASTRUCTURE? ]
30
#2 [ WHY DOES BRAZIL INVEST LITTLE IN INFRASTRUCTURE? ]
#2.1 [ LACK OF FUNDS: LOW SAVINGS RATE ]
As seen in Chapter One, investments, in general
and in infrastructure, are little in Brazil today. Ac-
tually, Brazil has always invested little. In the Post-
-War, investment rates exceeded 20% of the GDP
only the 1970s and the 1980s. As will be discussed
in Chapter III, low investment rates did not preven-
ted the country from growing in the past. However,
this is not true since the 1970s: to invest is a required
condition to grow. Even aware of this, the economic
policy generates low investment rates.
It is not our purpose to dive into history here. We will focus on events taking place since the 2000s. Some reasons for low investment levels, such as low saving rate, are not new in Brazil. But the recent eco-nomic policy, especially the so-called "new macroe-conomic matrix", seems to have brought the issues to a new level.
Two things are required for investing: supply of resources and investors. As we shall see, Brazil lacks both. We shall discuss in the next sections these two problems in detail.
When we mention lack of resources and diffi-
culties for financing investments, we are not re-
ferring to operational aspects for getting invest-
ments, such as paperwork, lack of expertise in
drafting and analyzing projects or lack of financial
institutions. These are all issues that certainly help
to explain low investment rates in Brazil. But our
main concern is the lack of resources to finance
investments. Even if we manage to solve all ope-
rational issues, investment will not take off if there
are no resources available.
These resources have a name: savings. Eco-
nomic theory teaches us that savings will always
equal investments. A country's total savings cor-
respond to the sum of the domestic savings (whi-
ch is the sum of government's and families sa-
vings) and external savings. The latter is equal to
the deficit in Current Transactions in the Balance
of Payments.
In principle, a country that does not save
enough could enjoy high investment rates. For
this, absorbing external savings would suffice,
which means to generate deficits in Current
Transactions. Although technically viable, in
practice is not probable that a country can get
sustainable external financing at 4% of the GDP
for long periods. In one hand, lenders are not
secure to finance an indebted country forever.
Eventually, it is possible that external savings
are extremely high, such as with Iceland in 2006,
when the deficit in current transactions exceeds
25% of the GDP. Deficits of that size usually ha-
ppen during crises and are followed by some
form of adjustment to correct the imbalance.
In addition to creditor restriction, local agents
also exert pressure to limit the entry of external
savings. This happens because large deficits in
current account demand strong cambial appre-
ciation, damaging the competitiveness of tra-
dable goods and service producers.
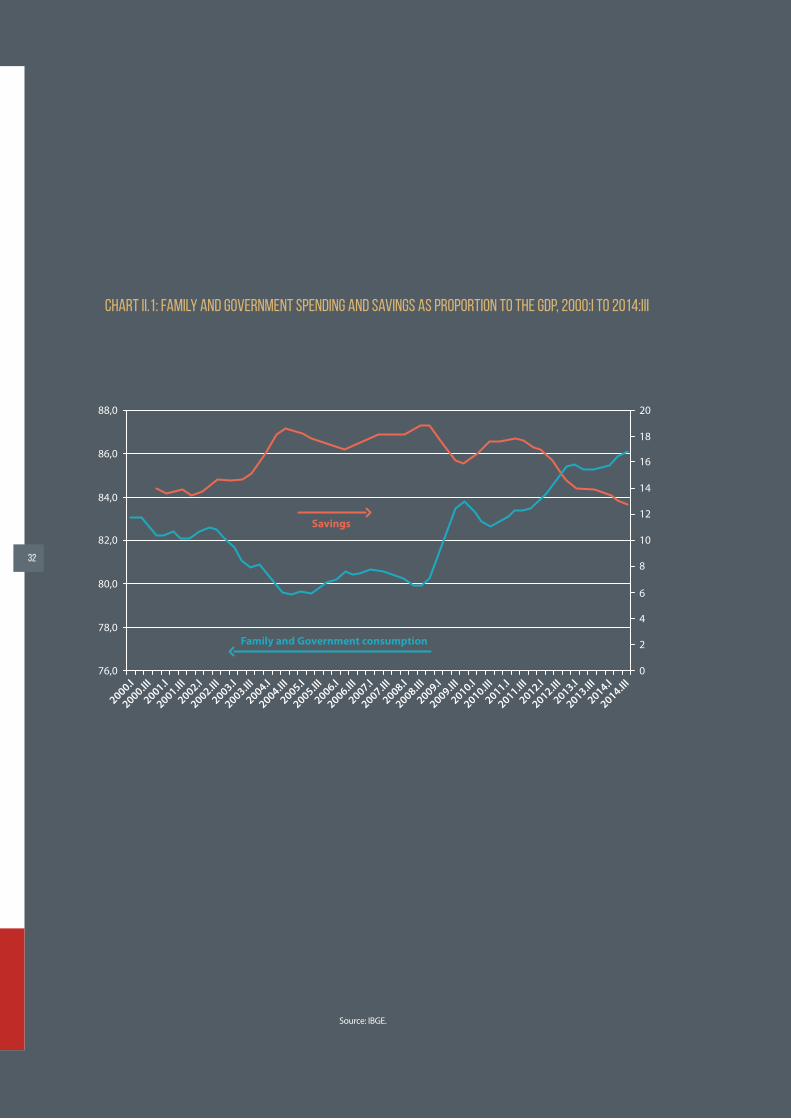
Chart II.1 shows the evolution of consump-
tion of families and government since 2000 as
well as its counterpart - the savings rate. As we
see, savings rate in Brazil is extremely low, never
above 20% of the GDP. Increasing our concerns,
this rate is falling in the last years.
Between 2001 and 2004, aggregated consump-
tion (families plus government) fell due firstly to the
cambial and fiscal crisis and later, to the adjustment
program that followed. Between 2004 and 2007, as
growth resumed speed, mainly due to gains in terms
of trade, consumption rose again, albeit shyly, and
the savings rate remained stable.
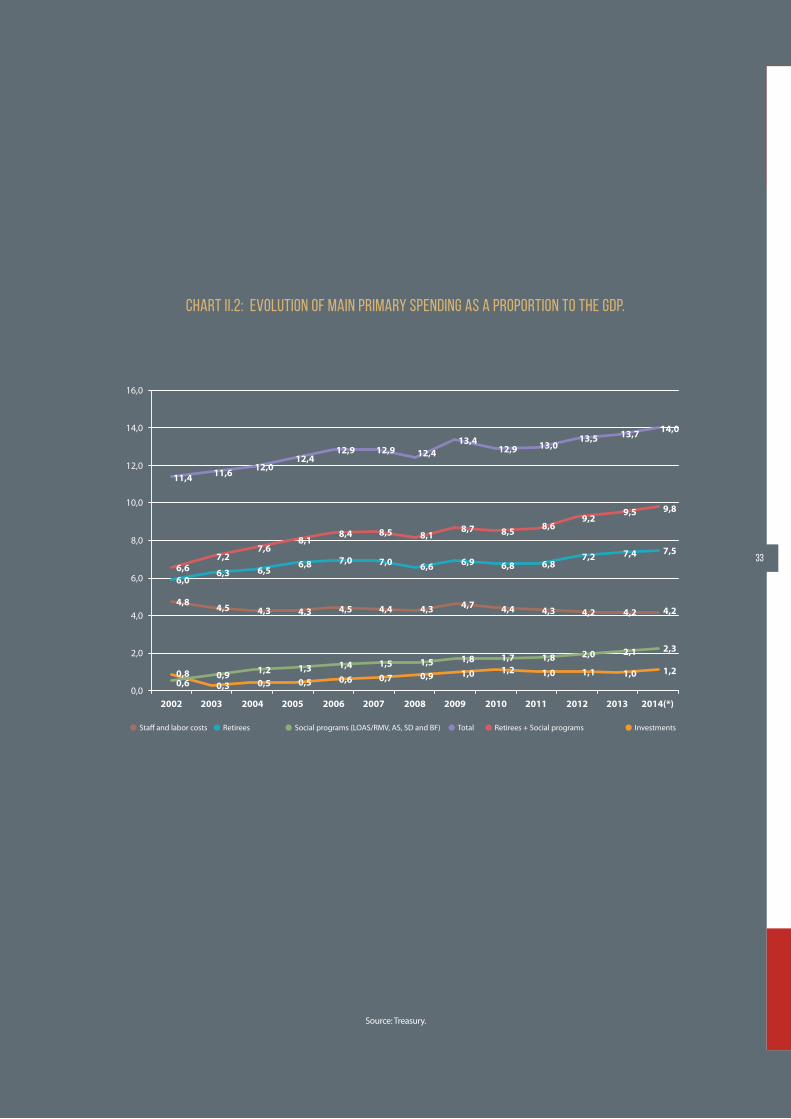
In that period, one could see the trend for con-
sumption spending by government, instead of in-
vesting. Chart II.2 shows the evolution of the main
primary public spending components: social insu-
rance, social programs (Bolsa Família, Benefício de
Prestação Continuada, Unemployment Insurance,
and Salary Add-ons), employees and investment, all
as a proportion to the GDP. As it can be seen, invest-
ments increased between 2003 and 2007, but less
than expenditures with social insurance and social
programs.
Due to the 2008 crisis, the trend to increase
consumption became clearer. Initially, consump-
tion was strongly encouraged by means of an an-
ticyclical policy. Later, the so-called "new econo-
mic matrix" was enhanced, and its diagnosis was
that investment in Brazil is low because there are
no incentives to invest. By encouraging consump-
tion, the increase of aggregated demand would
awake the so-called "animal spirit" and invest-
ments would naturally flow.
Incentives to consumption were made by
means of several policies, such as increases to
the minimum wage; more spending on social
programs; tax incentives for purchasing auto-
mobiles and other durable goods, as furniture
and household appliances; usage of state-o-
wned banks to expand credit to consumers;
subsidized credit to purchase furniture and
household appliances in the My House Impro-
ved program.
While Brazil relied in the good weather
abroad, in the form of strong demand for our
commodities and later, in the shape of ex-
ternal savings incoming, it was possible to
increase the proportion of aggregated con-
sumption and investments to the GDP at the
same time. But this is a model that tends to
end in itself. Without savings generation and
with limitations for the entry of external sa-
vings, it is impossible to increase investment
rates in the economy, thus restricting the po-
tential GDP growth.
31
32
076,0
2000.I
2000.III
2001.I
2001.III
2002.I
2002.III
2003.I
2003.III
2004.I
2004.III
2005.I
2005.III
2006.I
2006.III
2007.I
2007.III
2008.I
2008.III
2009.I
2009.III
2010.I
2010.III
2011.I
2011.III
2012.I
2012.III
2013.I
2013.III
2014.I
2014.III
78,0
80,0
82,0
84,0
86,0
88,0
2
4
6
8
10
12
14
16
18
20
Savings
Family and Government consumption
Chart II.1: Family and Government spending and savings as proportion to the GDP, 2000:I to 2014:III
Source: IBGE.
Total InvestmentsRetirees + Social programsSta� and labor costs Retirees Social programs (LOAS/RMV, AS, SD and BF)
0,0
2,0
4,0
6,0
8,0
10,0
12,0
14,0
16,0
2002 2003 2004 2005 2006 2007 2008 2009 2010 2011 2012 2013 2014(*)
0,8
4,8
6,06,6
11,4
0,9
4,5
6,3
7,2
11,6
1,2
4,3
6,5
7,6
12,0
0,6 0,3 0,5 0,51,3
4,3
6,8
8,1
12,4
0,61,4
4,5
7,0
8,4
12,9
0,71,5
4,4
7,0
8,5
12,9
0,91,5
4,3
6,6
8,1
12,4
1,01,8
4,7
6,9
8,7
13,4
1,21,7
4,4
6,8
8,5
12,9
1,0
1,8
4,3
6,8
8,6
13,0
1,1
2,0
4,2
7,2
9,2
13,5
1,0
2,1
4,2
7,4
9,5
13,7
1,2
2,3
4,2
7,5
9,8
14,0
Chart II.2: Evolution of main primary spending as a proportion to the GDP.
Source: Treasury.
33
34
#2.2 [ LACK OF INCENTIVES FOR INVESTING IN INFRASTRUCTURE ]
The lack of savings is a constraint to our invest-ments. However, having savings is necessary, but not enough, to increase investments. So it is that even 2003 and 2007, the current transaction balance was positive, indicating that Brazil was exporting savings to the rest of the world. In other words, even saving 18.5% of the GDP maximum on that period, a figure much below the average of high-to-middle income countries (average of 32% of the GDP) and the world (average of 22.5% of the GDP), investments in Brazil were so low that there were resources to finance in-vestments abroad.
There are several reasons for the lack of incentives to invest in Brazil. Table II.1 shows several indicators evi-dencing the difficulties to make business in the coun-try. Evidently, when there are barriers for a business to grow, there are also barriers to invest.
All indicators but cost to open a business and time to register a property are not favorable to us. The tax
load, tax over profits and paperwork in general are wor-
se in Brazil than in its peers. Our worst indicator is the
amount of hours dedicated to tax work: 2,600 hours,
almost ten times more than the global average!
The list of barriers to investment is not restricted
to the indicators above, as we also have problems
with a slow Justice, instability of rules, corruption
and more.
Specifically for investing in infrastructure, we ar-
rive at a paradox: government does not have resour-
ces to invest and creates difficulties for the private
sector to invest at the same time. In the remainder of
this section, we will discuss the reasons why public
investments decreased and the obstacles to private
investment.
[ FALL IN PUBLIC INVESTMENTS IN INFRASTRUCTURE ]
The public sector has always been an important
infrastructure service provider. Even after privatiza-
tion in the 1990s, the public sector remains rele-
vant in some areas whether by direct operation or
by state-owned companies. In total (including the
Federal Administration, state governments, direct
administration and state-owned companies), in
2007, the public sector was responsible for 55% of
investment in energy, 30% of investments in ports,
95% of investments in sanitation, and 54% of all
investments in infrastructure7. Furthermore, more
than 80% of highways are public (CNT, 2014). Only
telecom is totally privatized.
Despite the private sector is potentially able
to invest more efficiently, the biggest problem of
public sector investment in infrastructure is that it
does not invest as much as it should. As we saw in
Chapter One, after the 1970s public investment in
infrastructure fell to less than 2.5% of the GDP from
5.4% of the GDP. It is due partly to privatization pro-
grams that exempted the State from the responsi-
bility to invest. Partly, the public sector capacity to
invest also fell due to fewer saving. Estimates from
7 Conforme Frischtak, 2008.
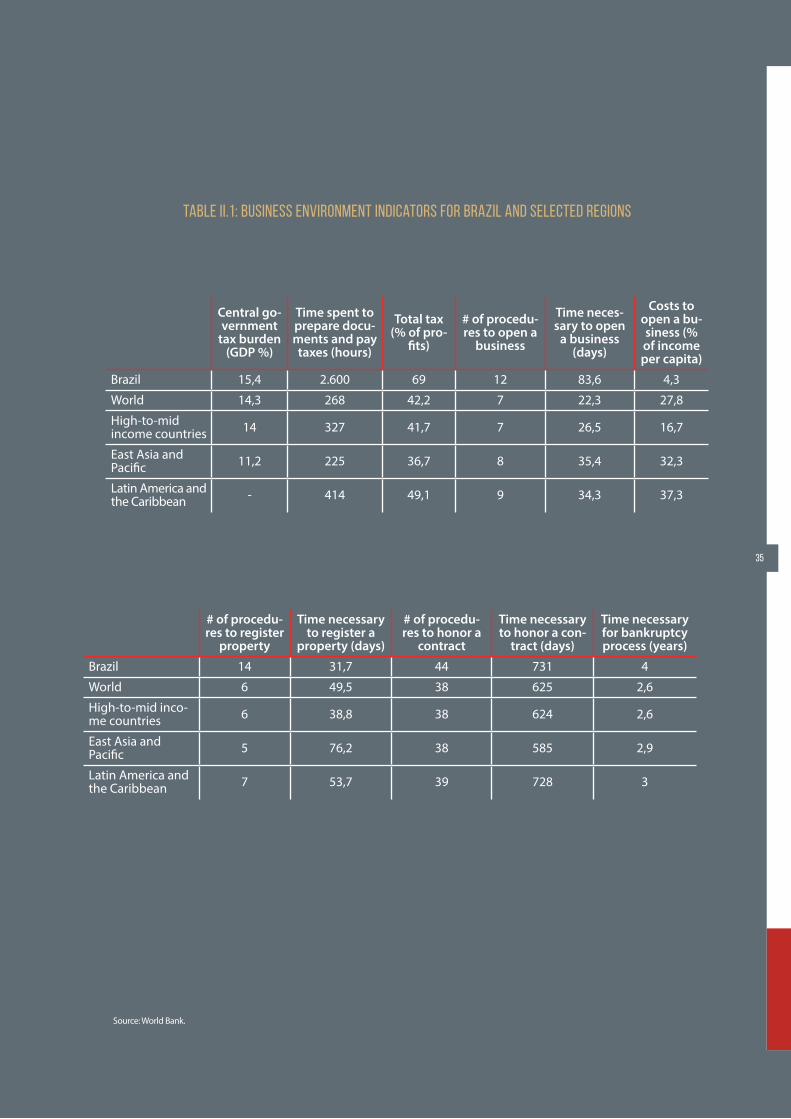
Table II.1: Business environment indicators for Brazil and selected regions
Central go-vernment
tax burden (GDP %)
Time spent to prepare docu-ments and pay taxes (hours)
Total tax (% of pro-
fits)
# of procedu-res to open a
business
Time neces-sary to open
a business (days)
Costs to open a bu-siness (% of income per capita)
Brazil 15,4 2.600 69 12 83,6 4,3
World 14,3 268 42,2 7 22,3 27,8
High-to-mid income countries 14 327 41,7 7 26,5 16,7
East Asia and Pacific 11,2 225 36,7 8 35,4 32,3
Latin America and the Caribbean - 414 49,1 9 34,3 37,3
# of procedu-res to register
property
Time necessary to register a
property (days)
# of procedu-res to honor a
contract
Time necessary to honor a con-
tract (days)
Time necessary for bankruptcy process (years)
Brazil 14 31,7 44 731 4
World 6 49,5 38 625 2,6
High-to-mid inco-me countries 6 38,8 38 624 2,6
East Asia and Pacific 5 76,2 38 585 2,9
Latin America and the Caribbean 7 53,7 39 728 3
Source: World Bank.
35
36
the IBMEC Study Center (2013) show that the pu-
blic sector moved from being a net saver in the
1980s (saving 0.5% of the GDP) to become a spen-
der, spending 2.75% of the GDP in the 2000s and
1.5% of the GDP in the current decade.
It is particularly concerning the anti-investment
behavior from the public sector in adjustment pe-
riods: when the government decides to cut spending,
it focuses first in investment. Actually this behavior
that leads to a poor adjustment is not exclusive to
Brazil. Easterly and Servén (2003) and Calderón et al
(2003) have shown that this standard was seen in ad-
justment programs in Latin America. During macroe-
conomic stabilization programs in the region during
the 1990s, half of these adjustment programs in five
out of eight countries that performed fiscal adjust-
ments in the period reduced spending with invest-
ments by 50%8.
Blanchard and Giavazzi (2004) have shown a
similar behavior in European countries. In Western
Europe, limits to public deficit for countries mem-
ber of the Euro zone, as determined by the Growth
Stability Pact9 led to a reduction in public invest-
ment in these countries, with negative effects to
their long term growth.
The option for adjustments through cuts in
investments, as opposed to operational costs, has
several explanations. First, there is a political eco-
nomy issue as pointed by the IMF (2004). Program
cutting impacts specific interest groups (such as
public employees, agriculture sector) or significant
portions of voters (retirement, social programs).
Reducing investment programs leads only to less
services in the future, which generates less satisfac-
tion than stop providing an existing service. By the
end of the adjustment, when it is possible to raise
public expenditure, the same political motivations
benefit groups that were preserved during the ad-
justment, quitting room for raising investments.
In addition the political convenience, there is
institutional rigidness, such as the impossibility of
layoffs and/or reducing nominal wages of public
employees and the mandatory transfers to state
governments. Thus, it is easier (but not less ex-
pensive in the long term) to interrupt works and
then resume them when there are funds available.
Another reason for cutting investments du-
ring macroeconomic adjustment programs is
the fact that larger works demand more resour-
ces. Thus, the saving goal becomes easier to be
achieved by cutting a handful investment pro-
jects. Finally, as shown by Blanchard and Giava-
zzi (2004), the accounting method for the fiscal
result also damages investment, as all expenses
are recorded in the same fiscal year, generating
deficits that are incompatible to a government
pursuing fiscal balance. The proper accounting
method would be to register expenses with pu-
blic capital maintenance and depreciation only,
such as in the private sector.
In addition to the low financing capacity
and the anti-investment behavior, there are
operational issues. In a previous paper , we
have discussed some issues that damage pu-
blic investment. The main one is the lack of a
system to assess the cost/benefit of projects.
In general, these are assessed one by one,
without a ranking in terms of priority and re-
turn. The result is a poor selection of projects,
including "white elephants", delays in elabo-
ration and conclusion of projects, unfinished
works, cost reviews, and corruption.
8 These countries were Argentina, Brazil, Ecuador, Mexico, and Peru.
9 The Growth Stability Pact is a mechanism adopted voluntarily by Eurozone members that poses limits to public deficits in these countries.
10 Velloso et al.(2012).
37
[ LACK OF INVESTMENT OPPORTUNITIES FOR THE PRIVATE SECTOR ]
Infrastructure services are usually government regulated and granted to the private sector by means of a contract. This is because infrastructu-re activities usually involve natural monopolies or duopolies (such as highways, airports, water and energy distribution network, transmission lines), rights of use of a public asset (as exploration of water resources, rights to use a given frequency in telecom) or that require coordination between different activities (for instance, a port shall be connected to other transportation mode, there may be conflicts on the use of water for supply cities or to generate energy). The strong (and re-quired) presence of the State as the regulator of infrastructure services implies that the private sector will only join an activity if the State creates a favorable environment for such.
In previous studies on granting highways and energy plants12, it is possible to find that one of the main problems - if not the key one - for the private sector to invest in infrastructure is an excessive low fee policy. We define excessive low fee policy as the intention to reduce the fee for public services to a maximum, even without an equivalent reduction in costs. The result is delays or works not done.
On highway grants, negative impacts of the excessive low fee policy at any cost become evi-dent on the bids for the 2nd Stage of the Federal Government Highway Grant Program (PCRGF) in 2007. At that time, impressive discounts in relation to the limit price, that reached more than 60% in the case of Fernão Dias Highway, were trumpeted as the success of the new grant policy. What ha-ppened instead was the so-called opportunistic behavior by the regulated entity. In short, a bid-der submits unrealistic low prices in the auction in order to pressure the government to renegotiate the contract after winning the bid. Under pressure of not delivering the work to the population, the government yields and what seemed to be cheap ends up quite expensive. A survey carried out by the "O Estado de São Paulo" newspaper in 2011 shown that seven highways privatized in 2007 had invested only 55% of the expected investment in the three first years of the grant.
The auctions in the third PCRGF stage took pla-ce in 2013, after a three-year delay. In other words, the governmental incompetence generates a se-ven-year gap between one stage and the next one in the grant program. There were again attempts to
The government's main tool to incentive
growth (the Growth Acceleration Program) is
right in the diagnosis that it is required to in-
vest more in infrastructure, both public and
private, to make Brazil achieve higher, sus-
tained growth rates. However, the program
implementation was poor. Instead of selec-
ting few projects according to feasibility and
convenience, PAC simply gathered several in-
vestment projects in a single bundle, trying
to execute them all at once. The result was de-
layed works, cost reviews, and losses to society.
A CNI study11 shows that delays in execution of
six works (transposition of the São Francisco Ri-
ver, Vitória airport, Fortaleza's main sanitation
project, East-West Integration Railroad, BR-101
highway duplication, and energy lines from the
Madeira River plants) caused losses of R$ 28 bil-
lion to society.
11 See http://economia.estadao.com.br/noticias/geral,atraso-em-seis-obras-do-pac-provoca-perda-de-r-28-bilhoes,185889e .
12 Velloso et al.(2012), Velloso et al.(2014).
38
force excessively low fees, with the result of empty auctions such as the one for the BR-262 highway in September 2013. Perhaps to avoid a repetition of that flop, the government postponed the BR-040 highway auction and increased the limit price to R$ 9.74 from R$ 4.95 for every 100 kilometers. Higher limit prices incentive competition and curiously, the discount was so high that the auction-deter-mined price of R$ 3.70 was below the original limit price. Recent highway auctions did not attract inex-perienced companies as in 2007, perhaps because technical and financial requirements to join the auction were stricter.
The excessive low fee policy was also applied in the energy sector. As it happened with highways, this policy attracted inexperienced companies, such as the Grupo Bertin. A meat processing com-pany, the group had in portfolio thermal energy plants construction projects totaling 6,000 MW, almost half of Itaipu's capacity, demanding R$ 7 billion in investments. Due to the difficulties in ob-taining credit, the Group's 21 grants did not take off and had to be sold or revoked by Aneel.
Other consequence of the excessive low fee policy in the energy sector was an increase of Eletrobras and its subsidiaries role in grants, since they do not aim profits, they could provide finan-cially not viable fees. The consequence was the deterioration of Eletrobras financial conditions, as well as delays in work delivery. A highlight is Chesf, which won almost all transmission lines in the Northeast region. Delays followed in a row, as the company did not have financial conditions to execute all projects. According to an Aneel survey, 96 transmission works of Chesf were delayed with average delay of 495 days. Some lines were 2,294 days delayed!
Frischtak e Davies (2014) also showed that de-lays in works and cost reviews are commonplace infrastructure investments in Brazil. Considering a sample of four plants, including Jirau and Belo Monte - two of key plants in construction - ave-rage cost increase was of 49% and the average deadline increase was 90%, which corresponds to delays between 12 and 91 months! A sample of five projects in sanitation shows no cost increases,
but the execution period increased by 81% with delays ranging from 26 to 43 months.
Such delays show planning gaps and dif-ficulties for executing projects in Brazil. Pro-jects are many times bid without the required details for execution, there are delays in en-vironmental permits, low or inefficient over-seeing and incapacity by the regulating entity to fix eventual schedule deviations. The result is a low infrastructure supply with losses to the whole country.
Planning and operation gaps are probably the best explanation for delays in bids. Airports are an example of this. Since Brazil was confir-med as the 2014 World Cup host, in 2007, it was known that it would be necessary to renovate airports. Airports of Guarulhos, Brasília, and Vi-racopos were bid only in the beginning of 2012, only two years from the event. And the airports of Confins and Galeão were bid at the end of 2013, due to a delay in grant, and both were not ready in time for the World Cup.
Another factor to damage private investments in infrastructure is the so-called regulator risk. An investment in infrastructure usually requires high initial financial inputs to set up the service founda-tion. In hydroelectric plants, for instance, expendi-ture with O&M (Operation & Maintenance) did not total 30% of total costs. Similarly, for a highway grantee, the main cost is delivering the highway itself. The same is valid for sanitation and energy transmission and distribution, railroads, and ports.
Once the infrastructure is built, the gran-tee is in the hands of the grantor. If the rules are changed, imposing fees below what is de-termined by contract, grantees will not have many options. If the new fixed fees are suffi-
PLANNING AND OPERATION
GAPS ARE PROBABLY THE BEST
EXPLANATION FOR DELAYS IN BIDS.
39
cient to cover O&M costs (that are usually low), grantees will keep the contract even aware that they will not be able to recover high costs incurred with the investment. This policy is successful in the short term, as the politician shows to the population that managed to im-pose lower fees, but it disastrous in the long term. Grantees, being aware beforehand that the grantor is not reliable, will require a high premium risk in order to join the auction, in-creasing the service price in future grants. Opportunistic policies from the government cause a reduction in the future infrastructure stock, as well as increasing fees.
An example of this risk carried by the regulator can be seen in the current highway grant contracts. It is not allowed to disclose the project's internal re-turn rate when submitting proposals. Thus, eventual changes to the original project (such as building a new access road) will be remunerated by a fee to be determined by the regulator, without any certainty that such fee will be enough to remunerate invest-ments. Equally, there are several imprecision in the fee adjustment rules, as in the definition of the so--called X Factor, that transfers to the consumer part of productivity gains obtained during the grant by means of lower fees.
As well as for highway grantees, energy carriers are also subject to regulatory and government deci-sions, which may cause high losses to energy carriers. For example, at periodical fee reviews that take place every four or five years, there is always an intense de-bate on capital's fair remuneration. Another example was the Provisory Measure # 579 of 2012 that deeply changed some energy generation and transmission rules. Companies were given the short timeframe of 30 days to decide whether they accepted the new rules or not. Two years after the passing of the new rules, there is not a consensus yet on the amount related to assets not fully depreciated to be reimbursed.
In short, private investments in infrastructu-re depend a lot on the government. Firstly, it is the responsibility of the public sector to select projects with care. Auctions (or any other bid
method) shall be designed so to prevent inexpe-rienced companies to win. Technical and finan-cial qualification requirements and a well drafted work plan are critical tools to attract well intentio-ned and resourceful companies. Regulation and overseeing entities shall be able to oversee works and be empowered to correct eventual schedule deviations. Finally, the grantee shall prevent to any extent to operate in opportunistic behavior, attempting to reduce the company's remunera-tion below to what the contract established. The higher legal insecurity is, more will be the demand from grantees in future contracts to offset higher risks involved. Artificially low fees today will bring higher fees tomorrow, with low infrastructure ser-vice supply.
40
41#3 [ WHY IS IMPORTANT TO INVEST, AND TO INVEST IN INFRASTRUCTURE? ]
#3 [ WHY IS IMPORTANT TO INVEST, AND TO INVEST IN INFRASTRUCTURE? ]
42
The goal of previous chapters was to show that
Brazil invests little in infrastructure and explain
why this is so. But why investing little in infrastruc-
ture is a problem? As we shall see, general invest-
ments, and particularly in infrastructure, have two
effects upon economy: the first arises from the
definition of investment itself that is the increase
in capital stock and thus, of the economy's pro-
ductive capacity; the second impact is indirect,
caused by productivity gains. Empirical evidences
support potential gains arising from investment.
We will show in this Chapter how Brazil's
economy is almost stagnated. We do not men-
tion here the low economic growth forecasts
for 2015, but to the fact the perspectives for
mid- and long-term growth are also bleak.
Curiously, Brazil was able to grow intensely
even with poor infrastructure. Unfortunately,
historical series for investing in infrastructure
are not long, starting by the 1970s. However,
there are longer series for the aggregated in-
vestment in the economy. If we assume that
investments in infrastructure were a relatively
constant proportion on aggregated invest-
ment, we could use the longer series to infer
the importance of investing in infrastructure
for the country.
According to IBGE, the average investment
rate between 1946 and 1970 was of 15% of
the GDP, close to lower levels seen recently. In
this period, the GDP expanded at an impressi-
ve average of 6.9% per year. Part of such gro-
wth was due to high population growth. As
population grew 3% per year, GDP per capita
expanded at 3.9% per year, which remains a
great result.
By that time, Brazil presented characteris-
tics allowing for a strong GDP growth despite
the small capital formation. We started with
an economy that was basically agrarian. It
was a period when productivity gains were
obtained by simple population reallocation,
migrating from rural areas where producti-
vity was almost zero (except for exportation
areas) to cities, where work productivity was
higher. Additionally, despite a 3% growth on
population, urban workforce grew at faster
rates, around 4.4% per year between 1950
and 1970.
The current situation has no similarity with
that period. Our current investment rates are as
low as the old ones, but the potential GDP gro-
wth rate13 is substantially smaller. As potential
GDP is a non-observable variable, there is no
consensus of its value, but estimative between
2% and 3% seem reasonable.
In a previous paper (Velloso et al, 2013), I
calculated that the potential GDP growth rate
for 2011 was around 3% per year, down from
5.8% in 2006. Barbosa Filho estimative (2011)
also shows a reduction of potential GDP gro-
wth rates from an average figure of up to 4.4%
per year between 2007 and 2010 to figures
near 3%.
13 O PIB potencial corresponde ao nível de produção compatível com o equilíbrio macroeconômico, em particular, com estabilidade de preços. Por ser uma variável não observável, sua mensuração depende de hipóteses e, por isso, suas estimativas variam de autor para autor.
Recent projections point to a result even
worse for Brazil's potential GDP growth. The
market does not release growth projections
for the potential GDP on a regular basis,
perhaps it does not even research this variab-
le directly However, when the Central Bank's
Focus Survey asks what is the growth rate ex-
pected for the next three or four years, it is
actually asking something very similar to the
potential GDP growth rate. We understand
that for the short term, up to two years from
now, circumstantial factors impact growth
projections. But these shocks go away pro-
bably in three or four years. As a result, pro-
jected growth for longer periods shall reflect
potential GDP growth estimative.
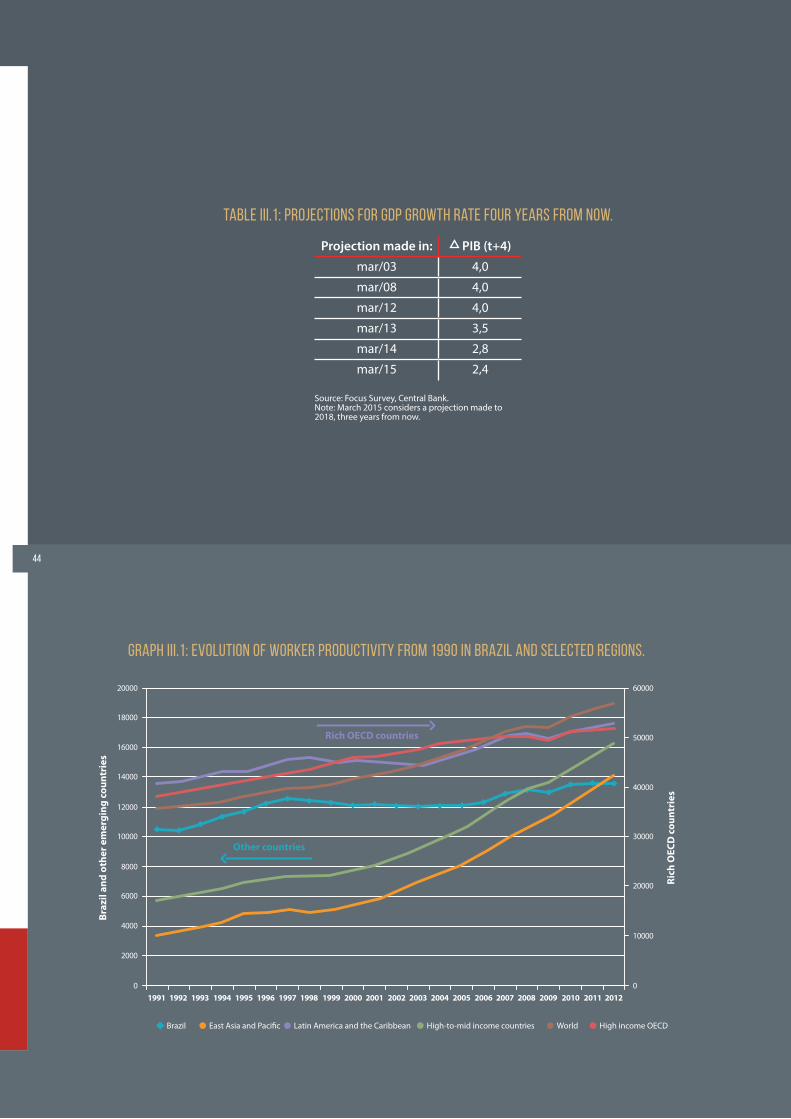
Table III.1 shows the median for GDP growth
projections four years from now, according to
Central Bank's Focus Survey collected every
year in March.
The table shows that the potential GDP
growth rate estimative remained around 4%
from the beginning of the 2000s up to 2012.
Projections made in March 2012 deserve more
detail. As it was the beginning of the year,
only the weak GDP result for 2011 was known
at the time (a 2.7% growth), but there were
expectations that the economy would reco-
ver. It was widely believed that 2011 would
be just cooling down after an exceptional
growth of 7.5% in 2010. After a disappointing
growth rate of 0.9% in 2012, economy agents
became aware that Brazil had entered a new
low growth cycle. We arrived thus to the cur-
rent situation, with perspective for mid-term
growth below 2.5%.
The potential GDP growth depends basi-
cally on two causes. First is the accumulation
of production factors, namely capital and la-
bor. Second are productivity gains.
In relation to production factors, the labor
supply growth rate fell significantly over the
last ten years. In 2004, the yearly growth rate for
the Economically Active Population was 1.8%.
It is currently around 1.2%. It is true that the
workforce is relevant, as is the human capital
incorporated to it. According to Barbosa Filho
(2011), the human capital growth rate between
2007 and 2010 was around 1% per year. Thus,
the workforce, corrected by the variation in hu-
man capital, would grow around 2% and 2.5%
per year.
In relation to the capital stock, its growth
is determined by the economy's investment
rate. As we have discussed in Chapter Two,
Brazil opted for a consumption-based model
as opposed to an investment-based model.
It is true that investment rate expanded in
Brazil between 2003 and the third quarter of
2014, going to 19.5% of the GDP from 15.6%.
But overall consumption, both by families
and government, increased even more in the
same period, to 85.8% of the GDP from 81.1%.
It would not be concerning if the investment
ratio to the GDP would grow slower, but
from higher levels. However, investment rate
in Brazil is very low. According to the World
Bank, we have invested in 2013 less than 18%
of the GDP, as the global average was 22.3%;
high-to-middle income countries, like us, in-
vested 32.6% of the GDP; and East Asia coun-
tries invested 44.2% of the GDP.
Due to low workforce growth rates and
small capital stock, the only way to make our
GDP grow is by means of productivity gains.
But here, our performance was mediocre as
well. Graph III.1 shows the evolution of wor-
ker productivity measured by GDP in PPP dol-
lar14 per employee.
43
13 O PIB potencial corresponde ao nível de produção compatível com o equilíbrio macroeconômico, em particular, com estabilidade de preços. Por ser uma variável não observável, sua mensuração depende de hipóteses e, por isso, suas estimativas variam de autor para autor.
14 Dólar PPP é o dólar medido em paridade de poder de compra. Trata-se de uma medida que busca incorporar a diferença de custo de vida entre os países no cálculo dos rendimentos.
Graph III.1: Evolution of worker productivity from 1990 in Brazil and selected regions.
2002200120001999199819971996199519941993199219910 0
10000
20000
30000
40000
50000
60000
2000
4000
6000
8000
10000
12000
14000
16000
18000
20000
2003 2004 2005 2006 2007 2008 2009 2010 2011 2012
Braz
il an
d ot
her e
mer
ging
cou
ntri
es
Rich
OEC
D c
ount
ries
Rich OECD countries
Other countries
East Asia and Paci�c Latin America and the Caribbean High-to-mid income countries World High income OECDBrazil
Table III.1: Projections for GDP growth rate four years from now.
Source: Focus Survey, Central Bank.Note: March 2015 considers a projection made to 2018, three years from now.
Projection made in: PIB (t+4)
mar/03 4,0
mar/08 4,0
mar/12 4,0
mar/13 3,5
mar/14 2,8
mar/15 2,4
4444
As it can be seen, productivity did not pro-gress well in Brazil from the 1990s up to now. In the beginning of the 1990s, we were well above the average in high-to-middle income countries and East Asia countries but in 2012 (last year of the series) we were below both groups. Our pro-ductivity grew below the global average and even below the average from rich OECD countries that started from higher levels.
We arrived in 2015 in a troublesome situation. The economy is almost stagnated, with low perspec-tives for growth and low labor productivity.
To improve the situation, it is necessary to increa-se the workforce, the human capital stock, physical capital stock or productivity.
It is quite hard to adopt public policies that increase the workforce, at least on short- and mid-term, mainly in Brazil, where the-re are no significant barriers for entry in the job market15. Nor it is easy to imagine public policies focusing population increases, since if such policy were feasible and effective, it would only increase the product but would leave per capita product unchanged or even smaller, due to decreasing wages.
It is feasible and desirable to increase the human capital stock, considering Brazil's gaps in this area. An important indicator of our edu-cational gap is the performance of Brazilian stu-dents in the Student Assessment International Program (SAIP). The latest edition in 2012, Brazi-
lian students were ranked 55th in Reading, 59th in Sciences, and 58th in Mathematics, among 65 countries.16
Even facing the need to increase the human capital stock, eventual public policies in this re-gard will be effective in the long term. Eleven years are required for a child to leave Basic Education and more four years on College. Furthermore, an important part of human capital is acquired over the years, through formal and informal training at work. Thus, human capital formation policies would hardly be able to turn around the almost stagnated condition in the mid-term.
Challenges to increase physical capital stock are also daunting. It is necessary to increase the domestic savings rate and create more incentives for private investment. Some ad-hoc reforms in this regard are possible, both aiming to increase public savings as to eliminate some barriers to private investment, such as paperwork and the complexity of the tax system.
In this context of low investment rates and low productivity growth, to invest in infras-tructure becomes more important as it is the foundation to all other activities in the eco-nomy, and for allowing an overarching pro-ductivity gain.
A better transportation network allows for a country to best allocate its resources geo-graphically, benefiting from comparative ad-vantages. Many times, a good is not produced in places with lower production cost because transportation and logistics costs can offset the differentials. It is true that the Mid-South pre-sents comparative advantages that make most of Brazilian industrial production to be located in this region, but certainly the spatial concen-tration of our production could be much smal-ler if there was a better overall transportation and logistics infrastructure.
Poor highways also damage our internatio-nal competitiveness. A CNT study carried out in 2009 (CNT, 2009) estimates that freight costs are expensive due to the poor quality of highways,
45
DUE TO LOW WORKFORCE GROWTH RATES AND SMALL CAPITAL STOCK, THE ONLY WAY TO MAKE OUR GDP GROW IS BY MEANS OF PRODUCTIVITY GAINS
15 Compare against countries with strong cultural or legal restrictions for women to work. Removing these barriers could broaden the work-force significantly. Some policies may positively impact the job market, such as an increase in daycare facilities that would unlock mothers (or fathers) to get a job. Even admitting this impact, such policies shall not be designed to reach this goal but to improve children education.
16 See http://exame.abril.com.br/brasil/noticias/brasil-fica-em-38o-de-44o-paises-em-teste-de-raciocini
that ranges from 19.3% in the South to 40% in the Northeast. Considering only higher fuel consumption, transportation costs can increase 5%.
Similar arguments can be developed for other infrastructure modes. Plenty, cheap energy is criti-cal to make some production sectors viable. Thus, it is not enough to be a mineral-rich country. Wi-thout cheap energy, bauxite and iron ore are ex-ported instead of internally processed to generate aluminum and steel. Irrigation projects, that also require energy, allow for agricultural activity in arid regions with fertile soil, such as the São Fran-cisco River Valley.
The US experience illustrates well how impor-tant cheap and plenty energy is for the economic development. Due to shale gas increased usage in this decade, electricity costs fell significantly, allowing for a comeback of electricity-intensive industries in the US, such as steelmakers.
On a daily basis, access to energy allow for sa-ving time (using washing machines, electric sho-wer etc.), obtain information by TV or computer, and use devices that overall allow for more com-fort and productivity gains.
In the line of increasing comfort and pro-ductivity, we can mention the development of telecommunications, that by speeding and making more precise data flows, allows for the optimization of production processes and inventory controls. Furthermore, by in-creasing information flows, decisions can be made with better context.
Similar conclusions apply to ports and air-ports. Reducing costs for transporting goods and people allows for a more efficient spatial allocation for economic activities.
Investments in sanitation also bring impor-tant impacts over the population well-being and productivity. A study by Fundação Getúlio Vargas (2010) shows that universal access to sanitation would allow, among other things: 25% less hos-pitalizations and 65% less mortality caused by gastrointestinal infections; 30% improvement in
school; 19% less chances of a employee to leave work due to gastrointestinal infections; and ave-rage increase of productivity per worker of 13.3%.
Calderón and Servén (2004) elaborated an in-frastructure index, gathering telecommunications, transportation and energy, to assess their impacts on economic growth and income distribution. In both cases, they found a positive and significant impact. An increase on an index standard deviation, which would equal to transform the infrastructure of nations like Ecuador and Colombia into the infras-tructure of Korea and New Zealand, would increase 3 percentage points in the GDP growth rate. By asses-sing each index component - telecommunications, transportation and energy - the authors found that also individually, these components have significant impact for economic development.
The authors also found a negative correlation between infrastructure and the Gini Index , which means that more infrastructures is associated to better income distribution. This is an expected re-sult. First, as some public services expand, such as electricity and sanitation, it is likely that more poor people is served, directly improving their producti-vity and well being. Access to cell phones allows for freelancers, such as janitors and service providers in general, better organizing their schedule and being ready to meet demands, increasing their income. A better road/rail system reduces migration costs, al-lowing for low income population to move to cities with more job offerings. Furthermore, better infras-tructure reduces the price of goods and services in general, causing an increase of real wages. If poor people's propensity to consume is higher than rich people's, an overall fall of prices would strongly be-nefit the poorest.
According to the authors’ estimation, if the Brazilian infrastructure would come closer to
46
INVESTMENTS IN SANITATION ALSO BRING IMPORTANT IMPACTS OVER THE POPULATION WELL-BEING AND PRODUCTIVITY.
17 The Gini Index measures the income concentration degree in an economy, from 0 (absolute equality) to 1 (absolute inequality, where only one individual has all the income in a country).
Costa Rica's, which has the best infrastructure in Latin America, our yearly growth rate could in-crease 2.9%. If such improvement was enough to reach the median level of East Asia and Pa-cific, potential gains would be of 4.4% in the yearly growth rate. The same exercise would al-low reducing Gini Index in 6 and 9 percentage points, respectively. For comparison, the period between 2002 and 2012, when it is considered that a strong reduction in inequality have taken place in Brazil, the Gini Index fell six percentage points to 52.6% from 58.1%.
IMF's "2014 Global Economic Perspective Re-port" shows that for developed countries, an one percentage point increase in public investments causes a 0.4 percentage point increase in the GDP in the same year, and 1.5 percentage point four years later. The report highlights that emerging markets, including Brazil, India, Russia, and South Africa, infrastructure bottlenecks have restricted growth both at mid- and short-term.
Mody e Walton (1998) point that while an ave-rage emerging country would invest 4% of the GDP in infrastructure, East Asia countries would invest between 6% and 8%. For the authors, such high investment rate is the basis for the strong economic growth seen in the region.
Changing the approach for Brazil, Ferreira and
Araújo (2005) investigated the impact of invest-
ments in infrastructure over public finance. Their
goal was to check whether the present value of
the increase in taxes caused by services provided
by infrastructure would be enough to pay for it.
According to the authors, the answer is yes. In
their simulations, a 1% of the GDP increase in pu-
blic investment would generate, depending on
the model specification and the sampled period,
a wealth creation that varied between 3.1% and
7.1% of the GDP over 20 years.
In short, we have seen that Brazil finds itself in
an almost stagnation scenario. We are not men-
tioning here to the probable poor economic per-
formance in 2015. What concerns us most is the
long-term perspective. Labor productivity is al-
most stagnated and the estimative for potential
GDP growth rate fell in the last years to around 2%
and 3% per year, which is very low for an emer-
ging economy. To increase our productivity and
consequently, our growth potential, it is required
to expand our human and physical capital supply,
namely in infrastructure. As the impact over eco-
nomy of improvements in education takes some
time to materialize, the best strategy for short-
and mid-term is to invest more in infrastructure.
47

48
49#4 [ INVESTMENTS IN INFRASTRUCTURE IN A FISCAL ADJUSTMENT PROGRAM ]
#4 [ INVESTMENTS IN INFRASTRUCTURE IN A FISCAL ADJUSTMENT PROGRAM ]
#4.1 [ ON THE NEED FOR A MACROECONOMIC ADJUSTMENT ]
We shall discuss in this Chapter what can be done within the current economy slowdo-wn and the fiscal adjustment program. The discussion will be divided into three parts. In the first part, we will describe Brazil's current macroeconomic environment, showing that there are serious imbalances that demand corrective actions by the economic policy.
In the second part, we will highlight the particularities of the current economic crisis
by comparing it against recent crises of 1999,
2003, and 2008. The third part explains that
due to the particularities of the current cri-
sis, a recommended economic policy would
be not to cut investments in infrastructure.
Finally, the Chapter ends with a discussion
on the My House, My Live housing program,
showing the positive aspects of investing in
popular housing.
Economy management in the last four years led to a deterioration in macroeconomic fun-damentals, requiring the implementation of a fiscal adjustment policy. In this section, we will focus in presenting the deterioration of some indicators and not build a narrative of how we arrived at the current situation. Overall, ma-croeconomic indicators have worsened in the period. The main exception is the unemploy-ment rate, which managed to remain at record low levels.
Firstly, there is a solid 10 percentage point increase in the gross debt/GDP ratio since 2011. At the same time, there is a relative stability in the net debt/GDP ratio for most of the period, although since the beginning of 2014, net debt is also increasing as a proportion of GDP. The increasing gap between both series in the last
four years is basically due to loans granted to BNDES . Chart III.1 shows the evolution of both indicators since December 2006, when the se-ries on overall government gross debt begins.
It is necessary to see both indicators to as-sess the country's fiscal situation. Low net debt levels may not mean a comfortable fiscal situa-tion is gross debt is at high levels. This situation reflects the case in which a government owes a lot to the market but at the same time, also have a lot of credits to receive. The problem is that those credits may not materialize whereas the public sector would still be forced to honor its debt with the market.
In our case, the exiting gap between gross and net debts is mainly caused by BNDES cre-dits owned by Treasury. By its turn, BNDES lends the resources received from Treasury to their
50
18 Até 2008 também houve um aumento da diferença entre as duas séries, mas a causa subjacente no período foi a acumulação de reser-vas internacionais.
clients. If they default on these loans, BNDES may face difficulties to pay its debts.
In addition to credit risks, the interest rates the government applies to its debt (usually, the Selic rate) is higher than the interests it gets for its loans (for BNDES, the TJLP). In the short term, the remuneration gap between assets and liabi-lities do not pressure the Treasury, as there is no immediate interest payment. Even if it was, the disbursement would be relatively low. However, in the short term, by adding the interest rates gap paid over the years, we would realize that these financial strategies poses a lot of pressure into public accounts. It is enough to see the im-plicit interest rates behavior upon net debt20. It went from an average of 14.5% in 2010 to 17.2% in 2014 and currently sits above 18%. The gap between the implicit interest rates and Selic rate (currently at 12.75%) is due exactly to the remuneration gap between Treasury's liabilities and assets. The higher this gap is, higher the im-plicit interest rate of public debt will be in rela-tion to Selic rate.
The deterioration of debt (variable in stock) reflects deterioration of flows (deficits). Chart IV.2 shows the evolution of primary and no-minal results since 2005. Brazil (as well as the majority of governments) traditionally presents nominal deficits (which means negative nomi-nal results), causing public debt growth over time. This is not a problem per se, since the no-minal deficit is not high enough to cause the public debt to grow above the public sector ability to pay. A good proxy for such ability is the GDP of a country. Hence the concern on the public debt growing faster than the GDP. When it happens, we usually say that deficits genera-ted are sustainable. Since 2005, we can see two periods when a strong deterioration of deficits took place: 2008 and mid-2014. In 2008, the in-crease of deficits was justified by the need of implementing an anticyclical policy to face an international financial crisis. Such deterioration was perceived as temporary and not to compro-mise public sector fiscal situation in the long term.
The fiscal policy in 2014 differs in nature from the one in 2008. First of all, we are not ex-periencing an international crisis requiring an-ticyclical policies. As we shall discuss further in this document, the problem in Brazil today (or at least in 2014) is more related to supply than aggregated demand. In this context, expansio-nary fiscal policies can have null effects or even make the economic activity worse. Secondly, it is due because the increase in nominal deficit was way more intense now than in 2008 crisis. Third, deterioration began at a more fragile fis-cal situation. This is particularly important for the primary result, which became negative in the last months.
Primary deficits indicate inability to pay even debt's interests and if maintained for long, they would drive debt to an explosive path. As we have said before, the sustainability problem of debt is not that debts grow, but if debts grow faster than the economy. In normal situations, where the real interest rate is higher than GDP growth rate, negative primary results generate an unbearable dynamics for debt in the long term21.
The external scenario has also deteriorated in the last years. Chart IV.3 shows the evolution of the current transaction balance. As theory has it, high deficits in current account corres-pond to a solid entry of external savings into an economy and are possible by appreciation of real exchange rates. Deficits in current account are beyond 4% of the GDP in the last few mon-ths. As Brazil relies on a high volume of reserves, we do not expect an exchange rate crisis in the short term, but history teaches us that few cou-ntries can keep current account deficits above 4% of the GDP for longer periods.
High current account deficits are made pos-sible by an appreciated exchange rate, as we have said before. High deficits are, thus, an in-dication of unbalance in exchange rates. Due to the recent risk-aversion increase to Brazilian assets, it is natural that the supply of dollars to Brazil falls, depreciating the Real. Also, the dete-rioration of risk perception may encourage mul-tinationals to send profits to headquarters, wor-
20 The implicit interest rate impacting on the net debt corresponds to the gap between the total of paid interests (due to the gross debt) and the total of interest received as income (due to government's credits) in relation to the stock of net debt.
21 Positive primary results also can generate unbearable paths for debt. Our simulation shows that primary results below 2.1% of the GDP gener-ate unbearable paths for public gross debt, if maintained for a long time.
51
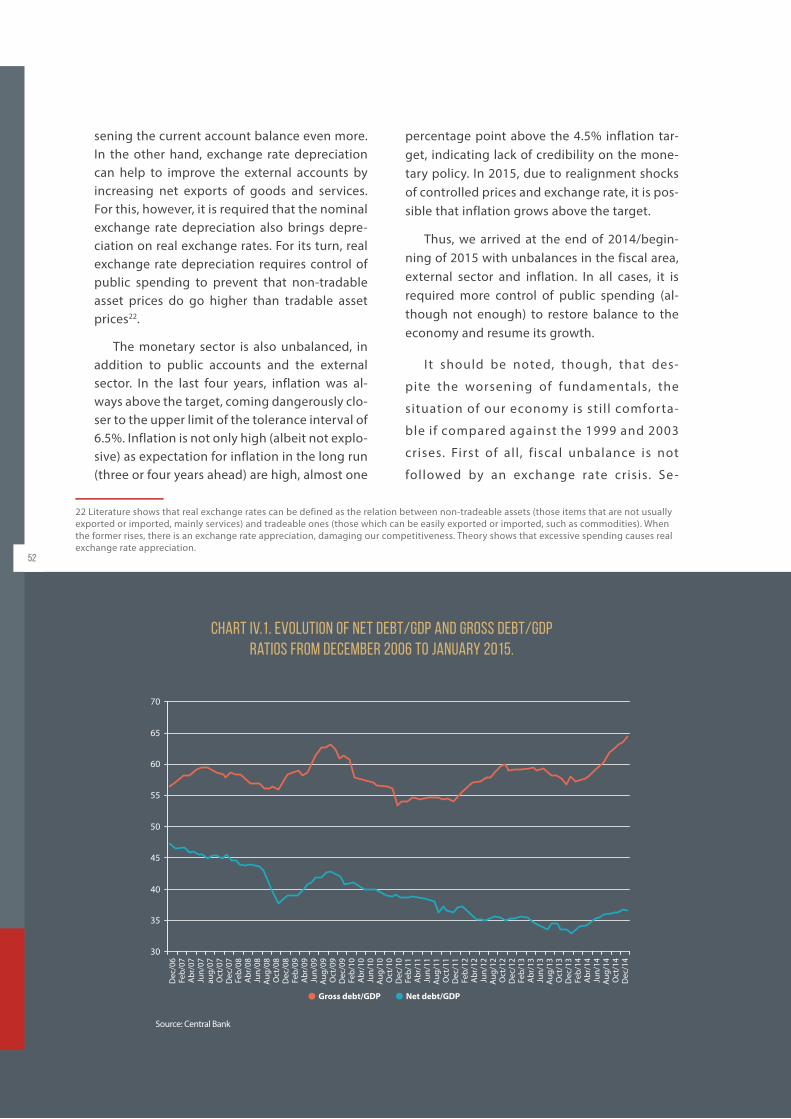
sening the current account balance even more. In the other hand, exchange rate depreciation can help to improve the external accounts by increasing net exports of goods and services. For this, however, it is required that the nominal exchange rate depreciation also brings depre-ciation on real exchange rates. For its turn, real exchange rate depreciation requires control of public spending to prevent that non-tradable asset prices do go higher than tradable asset prices22.
The monetary sector is also unbalanced, in addition to public accounts and the external sector. In the last four years, inflation was al-ways above the target, coming dangerously clo-ser to the upper limit of the tolerance interval of 6.5%. Inflation is not only high (albeit not explo-sive) as expectation for inflation in the long run (three or four years ahead) are high, almost one
percentage point above the 4.5% inflation tar-get, indicating lack of credibility on the mone-tary policy. In 2015, due to realignment shocks of controlled prices and exchange rate, it is pos-sible that inflation grows above the target.
Thus, we arrived at the end of 2014/begin-ning of 2015 with unbalances in the fiscal area, external sector and inflation. In all cases, it is required more control of public spending (al-though not enough) to restore balance to the economy and resume its growth.
I t should be noted, though, that des-
pite the worsening of fundamentals, the
situation of our economy is sti l l comforta-
ble if compared against the 1999 and 2003
crises. First of all, f iscal unbalance is not
followed by an exchange rate crisis. Se -
52
30
Dec
/06
Feb/
07A
br/0
7Ju
n/07
aug/
07O
ct/0
7D
ec/0
7Fe
b/08
Abr
/08
Jun/
08Au
g/08
Oct
/08
Dec
/08
Feb/
09A
br/0
9Ju
n/09
Aug/
09O
ct/0
9D
ec/0
9Fe
b/10
Abr
/10
Jun/
10Au
g/10
Oct
/10
Dec
/10
Feb/
11A
br/1
1Ju
n/11
Aug/
11O
ct/1
1D
ec/1
1Fe
b/12
Abr
/12
Jun/
12Au
g/12
Oct
/12
Dec
/12
Feb/
13A
br/1
3Ju
n/13
Aug/
13O
ct/1
3D
ec/1
3Fe
b/14
Abr
/14
Jun/
14Au
g/14
Oct
/14
Dec
/14
35
40
45
50
55
60
65
70
Gross debt/GDP Net debt/GDP
Chart IV.1. Evolution of net debt/GDP and gross debt/GDP ratios from December 2006 to January 2015.
Source: Central Bank
22 Literature shows that real exchange rates can be defined as the relation between non-tradeable assets (those items that are not usually exported or imported, mainly services) and tradeable ones (those which can be easily exported or imported, such as commodities). When the former rises, there is an exchange rate appreciation, damaging our competitiveness. Theory shows that excessive spending causes real exchange rate appreciation.
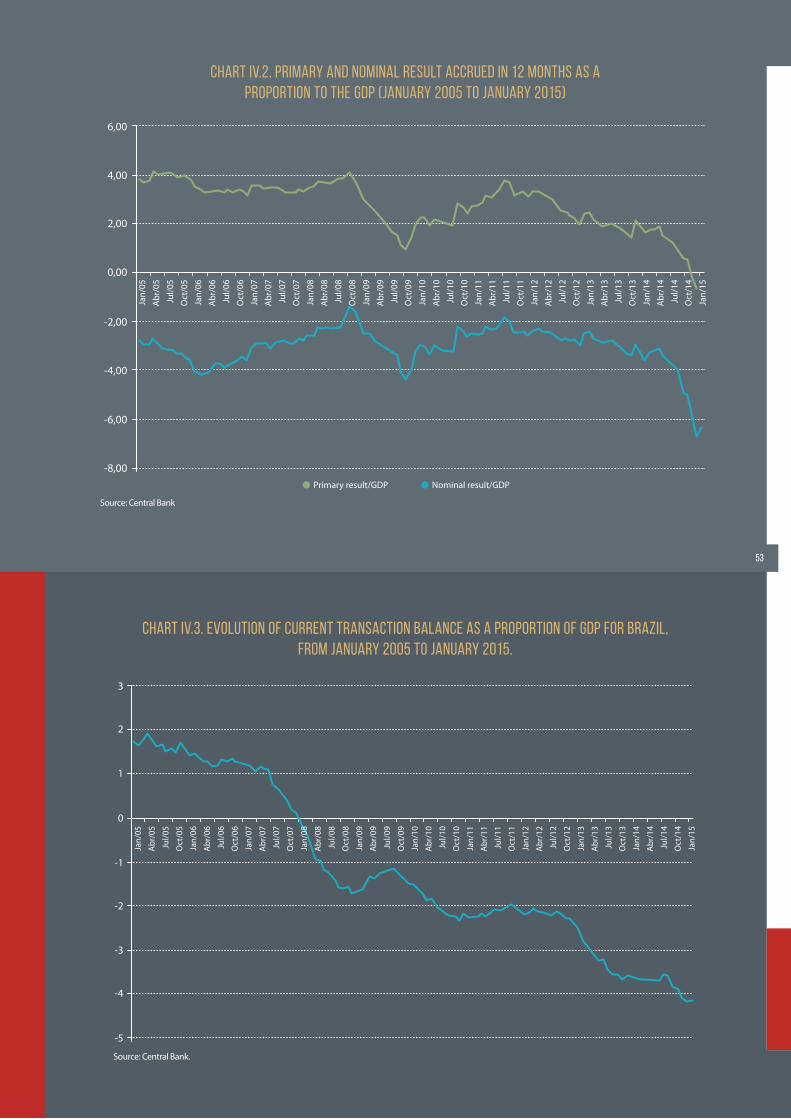
53
Primary result/GDP Nominal result/GDP
-8,00
-6,00
-4,00
-2,00
0,00
2,00
4,00
6,00Ja
n/05
Abr
/05
Jul/0
5
Oct
/05
Jan/
06
Abr
/06
Jul/0
6
Oct
/06
Jan/
07
Abr
/07
Jul/0
7
Oct
/07
Jan/
08
Abr
/08
Jul/0
8
Oct
/08
Jan/
09
Abr
/09
Jul/0
9
Oct
/09
Jan/
10
Abr
/10
Jul/1
0
Oct
/10
Jan/
11
Abr
/11
Jul/1
1
Oct
/11
Jan/
12
Abr
/12
Jul/1
2
Oct
/12
Jan/
13
Abr
/13
Jul/1
3
Oct
/13
Jan/
14
Abr
/14
Jul/1
4
Oct
/14
Jan/
15
Chart IV.2. Primary and nominal result accrued in 12 months as a proportion to the GDP (January 2005 to January 2015)
Source: Central Bank
-5
-4
-3
-2
-1
0
1
2
3
Jan/
05
Abr
/05
Jul/0
5
Oct
/05
Jan/
06
Abr
/06
Jul/0
6
Oct
/06
Jan/
07
Abr
/07
Jul/0
7
Oct
/07
Jan/
08
Abr
/08
Jul/0
8
Oct
/08
Jan/
09
Abr
/09
Jul/0
9
Oct
/09
Jan/
10
Abr
/10
Jul/1
0
Oct
/10
Jan/
11
Abr
/11
Jul/1
1
Oct
/11
Jan/
12
Abr
/12
Jul/1
2
Oct
/12
Jan/
13
Abr
/13
Jul/1
3
Oct
/13
Jan/
14
Abr
/14
Jul/1
4
Oct
/14
Jan/
15
Source: Central Bank.
Chart IV.3. Evolution of current transaction balance as a proportion of GDP for Brazil, from January 2005 to January 2015.
54
23 Countries with BBB grade as per Standard & Poor's and Fitch To join the list below, it was enough for the country to be included to the list of one of the agencies. The countries are as follow: Azerbaijan, Bahamas, Colombia, Slovenia, Spain, The Philipines, Iceland, India, Italy, Kazakhstan, Malta, Mexico, Morocco, Panama, Peru, Romania, San Marino, Thailand, and Uruguay.
condly, Brazil is sti l l ranked as investment
grade by all main risk agencies. This indi-
cates that the Brazil ian government sti l l
is capable to pay its debt. Until 2003, our
sovereign debt was ranked as speculative.
The need for adjustment now is caused
more by the deterioration of indicators
than by the level these indicators are in.
I t is obviously to adjust when indicators
are at reasonable levels, as opposed to
per form an adjustment when they are de -
teriorated. Table IV.1 shows that Brazil is
reasonably well when compared against
countries with the same credit r isk , al-
though it is necessary to be careful with
some indicators.
In relation with countries with BBB grade23,
we shall be concerned with our gross debt/
GDP ratio, current transaction balance, GDP
growth, investment and saving levels (that
show our future growth potential), public
spending, and nominal deficit. In the other
hand, we enjoy a comfortable net debt/GDP
ratio, low unemployment levels and high tax
collection by the public sector (which expands
the government ability to pay debts). As we
know, the primary result for 2014 was -0.6% of
the GDP, well below IMF projections. If all other
IMF projects are correct, our primary result for
2014 will be worse than the average of BBB-
-grade countries.
In short, it is necessary to adjust the eco-
nomy, mainly in the fiscal area, with the main
goal to revert the deterioration trend that is
being configured. Specifically on what con-
certs gross debt, more important is to signal
that it is going to stop growing or, at least,
that it will stabilize in the long run. Our
biggest concern is not to the indicator value
per se, but with their recent evolution.
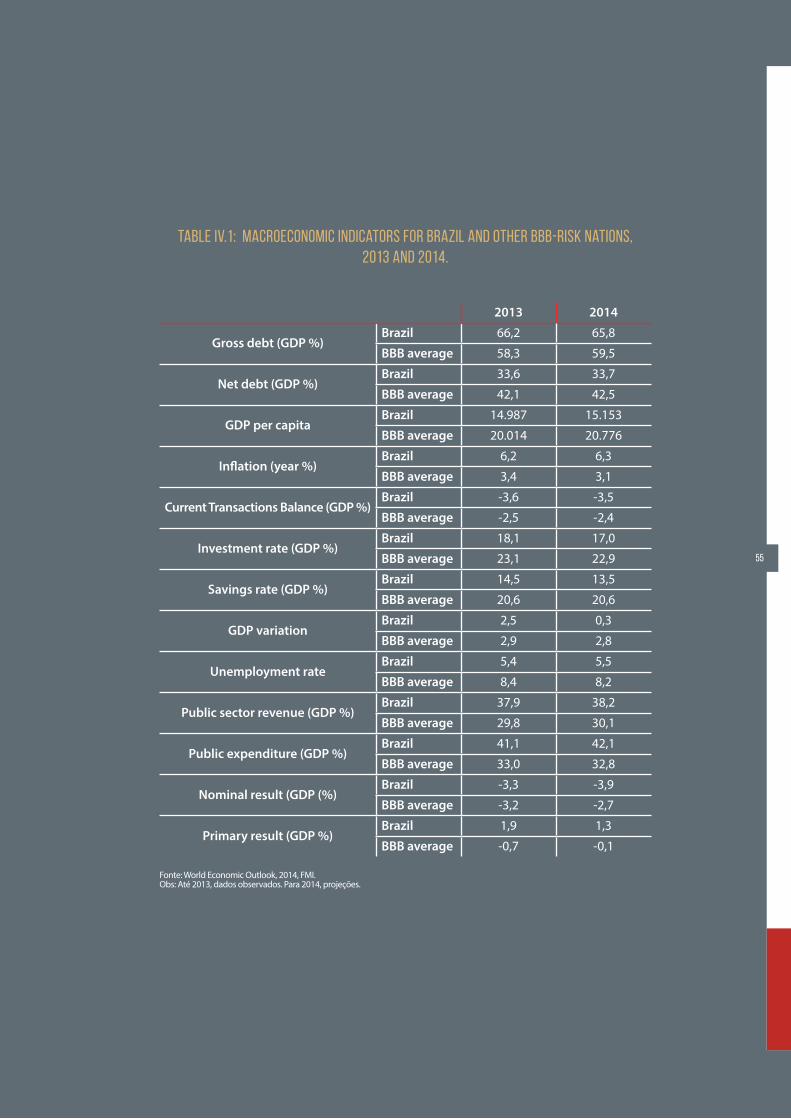
55
Table IV.1: Macroeconomic indicators for Brazil and other BBB-risk nations, 2013 and 2014.
Fonte: World Economic Outlook, 2014, FMI.Obs: Até 2013, dados observados. Para 2014, projeções.
2013 2014
Gross debt (GDP %)Brazil 66,2 65,8
BBB average 58,3 59,5
Net debt (GDP %)Brazil 33,6 33,7
BBB average 42,1 42,5
GDP per capitaBrazil 14.987 15.153
BBB average 20.014 20.776
Inflation (year %)Brazil 6,2 6,3
BBB average 3,4 3,1
Current Transactions Balance (GDP %)Brazil -3,6 -3,5
BBB average -2,5 -2,4
Investment rate (GDP %)Brazil 18,1 17,0
BBB average 23,1 22,9
Savings rate (GDP %)Brazil 14,5 13,5
BBB average 20,6 20,6
GDP variationBrazil 2,5 0,3
BBB average 2,9 2,8
Unemployment rateBrazil 5,4 5,5
BBB average 8,4 8,2
Public sector revenue (GDP %)Brazil 37,9 38,2
BBB average 29,8 30,1
Public expenditure (GDP %)Brazil 41,1 42,1
BBB average 33,0 32,8
Nominal result (GDP (%)Brazil -3,3 -3,9
BBB average -3,2 -2,7
Primary result (GDP %)Brazil 1,9 1,3
BBB average -0,7 -0,1
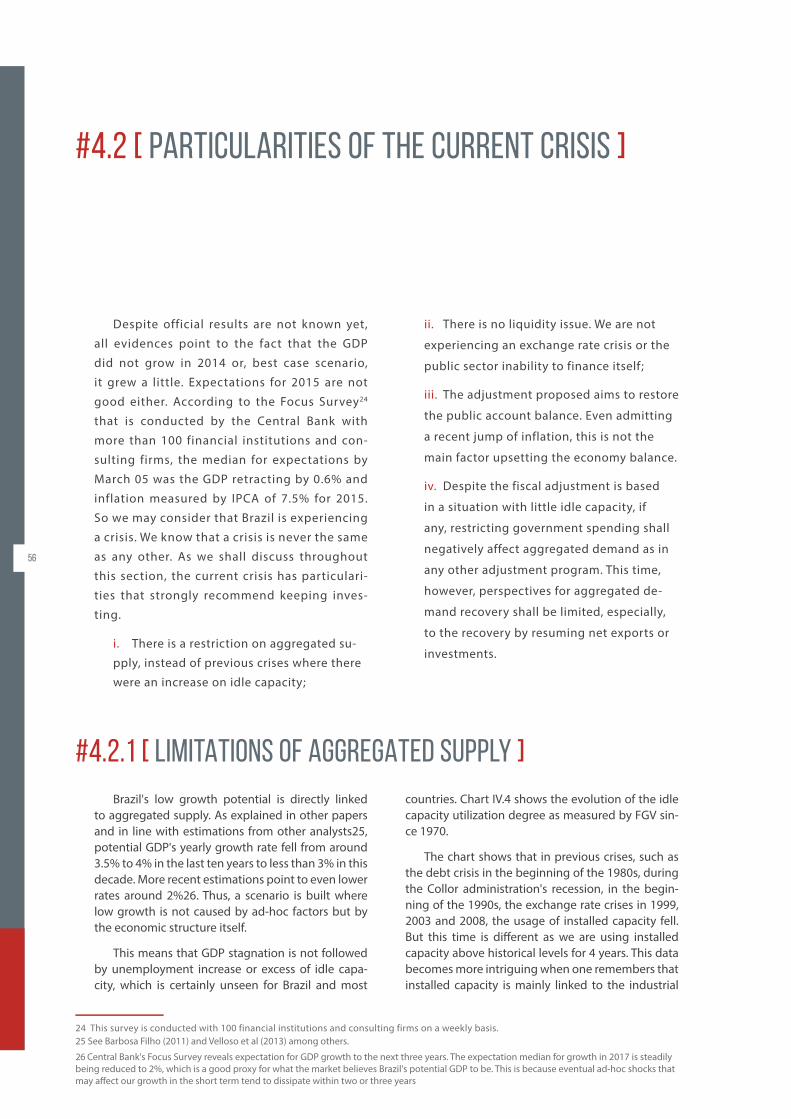
#4.2 [ PARTICULARITIES OF THE CURRENT CRISIS ]
#4.2.1 [ LIMITATIONS OF AGGREGATED SUPPLY ]
56
Despite official results are not known yet,
all evidences point to the fact that the GDP
did not grow in 2014 or, best case scenario,
it grew a little. Expectations for 2015 are not
good either. According to the Focus Survey24
that is conducted by the Central Bank with
more than 100 financial institutions and con-
sulting firms, the median for expectations by
March 05 was the GDP retracting by 0.6% and
inflation measured by IPCA of 7.5% for 2015.
So we may consider that Brazil is experiencing
a crisis. We know that a crisis is never the same
as any other. As we shall discuss throughout
this section, the current crisis has particulari-
ties that strongly recommend keeping inves-
ting.
i. There is a restriction on aggregated su-
pply, instead of previous crises where there
were an increase on idle capacity;
ii. There is no liquidity issue. We are not
experiencing an exchange rate crisis or the
public sector inability to finance itself;
iii. The adjustment proposed aims to restore
the public account balance. Even admitting
a recent jump of inflation, this is not the
main factor upsetting the economy balance.
iv. Despite the fiscal adjustment is based
in a situation with little idle capacity, if
any, restricting government spending shall
negatively affect aggregated demand as in
any other adjustment program. This time,
however, perspectives for aggregated de-
mand recovery shall be limited, especially,
to the recovery by resuming net exports or
investments.
24 This survey is conducted with 100 financial institutions and consulting firms on a weekly basis.25 See Barbosa Filho (2011) and Velloso et al (2013) among others.
26 Central Bank's Focus Survey reveals expectation for GDP growth to the next three years. The expectation median for growth in 2017 is steadily being reduced to 2%, which is a good proxy for what the market believes Brazil's potential GDP to be. This is because eventual ad-hoc shocks that may affect our growth in the short term tend to dissipate within two or three years
Brazil's low growth potential is directly linked to aggregated supply. As explained in other papers and in line with estimations from other analysts25, potential GDP's yearly growth rate fell from around 3.5% to 4% in the last ten years to less than 3% in this decade. More recent estimations point to even lower rates around 2%26. Thus, a scenario is built where low growth is not caused by ad-hoc factors but by the economic structure itself.
This means that GDP stagnation is not followed by unemployment increase or excess of idle capa-city, which is certainly unseen for Brazil and most
countries. Chart IV.4 shows the evolution of the idle capacity utilization degree as measured by FGV sin-ce 1970.
The chart shows that in previous crises, such as the debt crisis in the beginning of the 1980s, during the Collor administration's recession, in the begin-ning of the 1990s, the exchange rate crises in 1999, 2003 and 2008, the usage of installed capacity fell. But this time is different as we are using installed capacity above historical levels for 4 years. This data becomes more intriguing when one remembers that installed capacity is mainly linked to the industrial
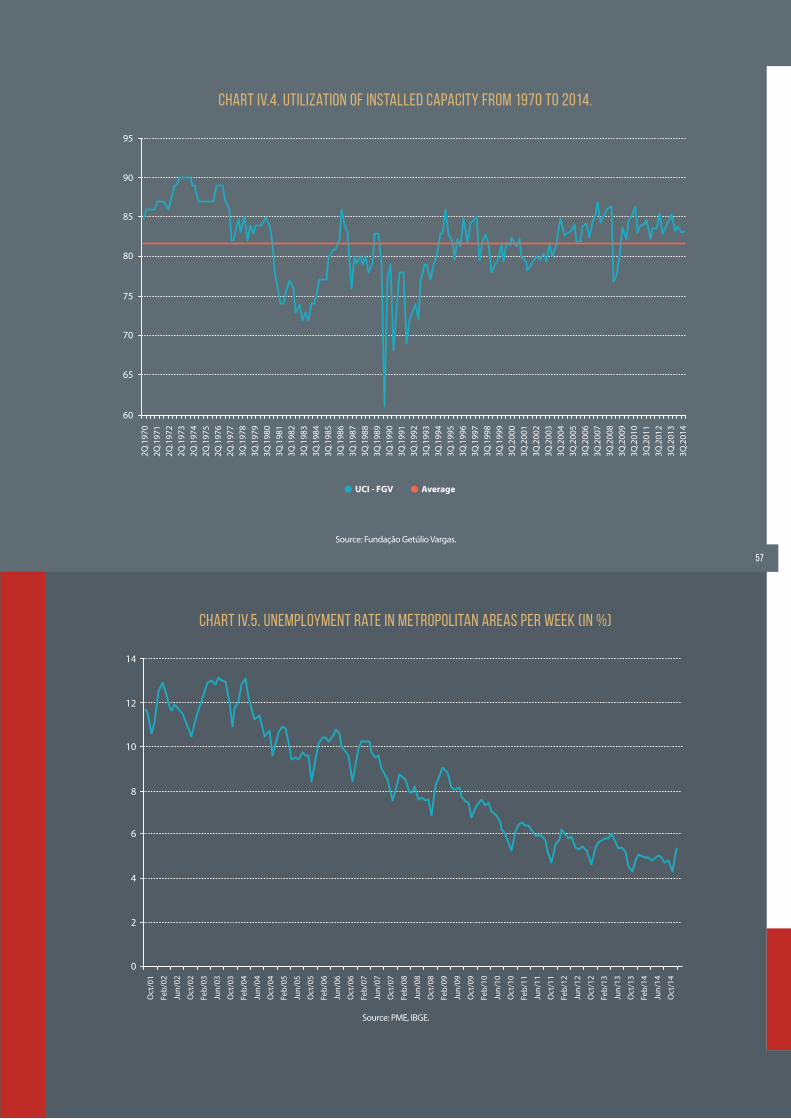
57
UCI - FGV Average
60
65
70
75
80
85
90
952Q
.197
02Q
.197
12Q
.197
22Q
.197
32Q
.197
42Q
.197
52Q
.197
62Q
.197
73Q
.197
83Q
.197
93Q
.198
03Q
.198
13Q
.198
23Q
.198
33Q
.198
43Q
.198
53Q
.198
63Q
.198
73Q
.198
83Q
.198
93Q
.199
03Q
.199
13Q
.199
23Q
.199
33Q
.199
43Q
.199
53Q
.199
63Q
.199
73Q
.199
83Q
.199
93Q
.200
03Q
.200
13Q
.200
23Q
.200
33Q
.200
43Q
.200
53Q
.200
63Q
.200
73Q
.200
83Q
.200
93Q
.201
03Q
.201
13Q
.201
23Q
.201
33Q
.201
4
Chart IV.4. Utilization of installed capacity from 1970 to 2014.
Source: Fundação Getúlio Vargas.
0
2
4
6
8
10
12
14
Oct
/01
Feb/
02
Jun/
02
Oct
/02
Feb/
03
Jun/
03
Oct
/03
Feb/
04
Jun/
04
Oct
/04
Feb/
05
Jun/
05
Oct
/05
Feb/
06
Jun/
06
Oct
/06
Feb/
07
Jun/
07
Oct
/07
Feb/
08
Jun/
08
Oct
/08
Feb/
09
Jun/
09
Oct
/09
Feb/
10
Jun/
10
Oct
/10
Feb/
11
Jun/
11
Oct
/11
Feb/
12
Jun/
12
Oct
/12
Feb/
13
Jun/
13
Oct
/13
Feb/
14
Jun/
14
Oct
/14
Chart IV.5. Unemployment rate in metropolitan areas per week (in %)
Source: PME, IBGE.
sector, which is the sector less performing in the last years not only in relation to the GDP but also in ab-solute terms. In other words, despite the industrial sector is stagnated in the last four years, the sector's capital stock is following up such stagnation.
There is no idle capacity either in another pro-duction input - labor. Unemployment rates are steadily falling since 2001, as Chart IV.5. shows. It is interesting that employment levels are basically stagnated, so the reason why unemployment levels fall is the reduction in the workforce, i.e., there are more individuals at working age that are not wor-king or looking for employment.
The lack of idle capacity shows that economy recovery will be harder than in previous crises. Un-til then, policies to maintain supply would help to recover economic activity. In a typical adjustment, relying on support from the IMF, exchange rate de-preciation would encourage net exports, allowing
for a recovery of production by using idle capacity first. Thus, a new cycle could be launched without inflationary pressures and as trust was regained, in-vestment levels could also be recovered.
In the current situation, the possibility of reco-very by stimulating demand is much more limited. It is possible to expand employment by attracting people outside the workforce, which probably will be followed by salary pressures. It is possible to in-crease the usage of capacity, currently at 83%, as we are below the 90% maximum as seen in the histo-rical series. However, such expansion would bring growing cost for businesses. Also, 83% is an avera-ge. There are certainly sectors close to their capacity limits, where expansion is quite limited. In keeping the current situation, we would hardly maintain mo-derate growth rates - say, 2% to 3% per year - without inflationary pressures and industry imbalances.
#4.2.2 [ CURRENT CRISIS CONTEXTUAL ASPECTS ]
[ BETTER LIQUIDITY CONDITIONS THAN IN CRISES PAST ]
The current crisis is different from previous crises in the sense that there is no apparent liquidity crisis in relation to public sector fi-nancing ability and external accounts. There were a strong exchange rate crisis in the 1980s, 1998 (before the inflation target regime) and 2002/2003. To a certain extent, it is correct to say that such crises were caused by a reduction in the incoming flow of cash to the country. In all cases, agreements with IMF were necessary to ensure solvency in our balance of payments. As part of such agreements, it was necessary to strongly reduce domestic absorption27 to resto-re balance to external accounts.
In 2009, due to the international financial crisis, we were better positioned since Bra-zil had accumulated some US$ 200 billion in international reserves. In other hand, as the name suggests, that crisis was characterized by
a strong credit clinch due to overall insecurity spread over financial markets.
In current crisis, there are no serious liquidity issues. From an international liquidity standpoint, it is true that upon the recovery of the US eco-nomy we shall see some capital flight (as other economies will see too). But a better economic outlook in the US and consequently around the world tend to benefit capital flows in the midterm. The Euro zone, by its turn, recently announced that will keep the monetary expansion policy in effect for the last years. Finally, Brazil has a solid international reserve stock of US$ 363 billion by the end of February 2015, which allows for endu-re with some tranquility eventual period (not long ones) with difficulties on financing the balance of payments.
As in all crises, it is obvious that may have very short periods, during few weeks, in which
58
Chart IV.6. Evolution of federal bond debt composition according to main indexes: Selic, pre-fixed and inflation from January 2000 to January 2015.
27 Domestic absorption corresponds to the total of family consumption, government spending and investment. It is different from aggregated demand by not including net exports.
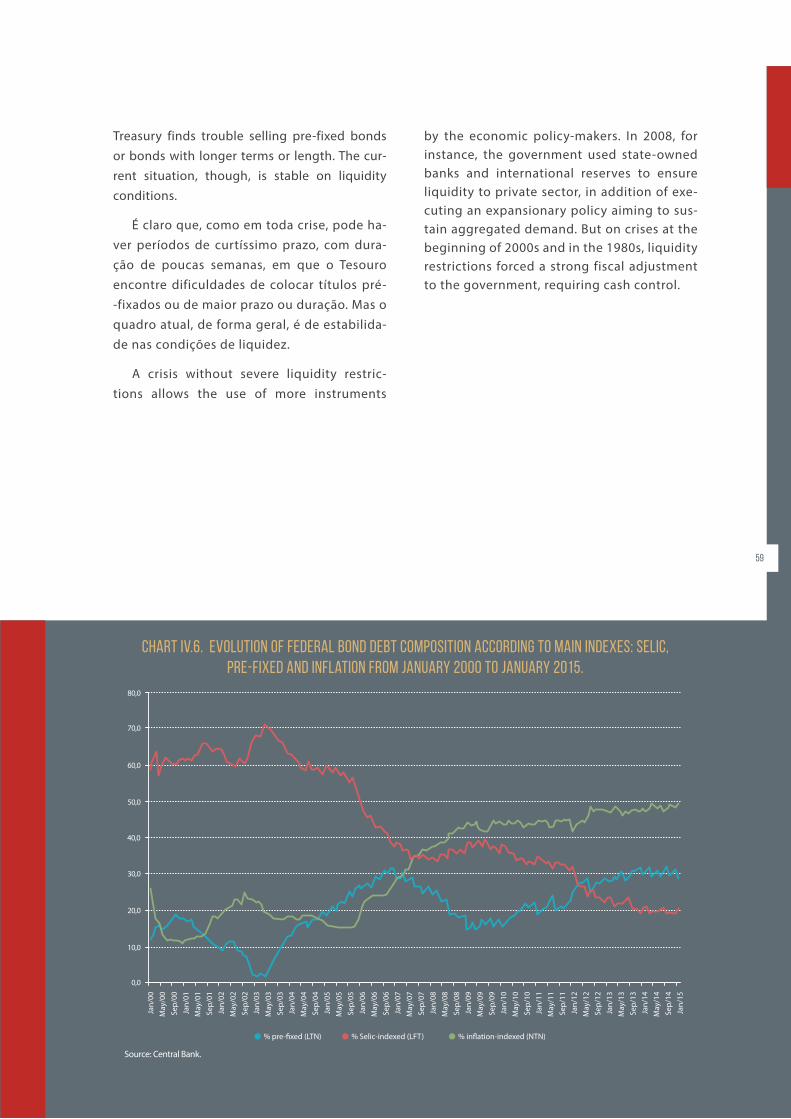
Treasury finds trouble selling pre-fixed bonds or bonds with longer terms or length. The cur-rent situation, though, is stable on liquidity conditions.
É claro que, como em toda crise, pode ha-ver períodos de curtíssimo prazo, com dura-ção de poucas semanas, em que o Tesouro encontre dificuldades de colocar títulos pré--fixados ou de maior prazo ou duração. Mas o quadro atual, de forma geral, é de estabilida-de nas condições de liquidez.
A crisis without severe liquidity restric-tions allows the use of more instruments
59
0,0
10,0
20,0
30,0
40,0
50,0
60,0
70,0
80,0
% pre-�xed (LTN) % Selic-indexed (LFT) % in�ation-indexed (NTN)
Jan/
00M
ay/0
0Se
p/00
Jan/
01M
ay/0
1Se
p/01
Jan/
02M
ay/0
2Se
p/02
Jan/
03M
ay/0
3Se
p/03
Jan/
04M
ay/0
4Se
p/04
Jan/
05M
ay/0
5Se
p/05
Jan/
06M
ay/0
6Se
p/06
Jan/
07M
ay/0
7Se
p/07
Jan/
08M
ay/0
8Se
p/08
Jan/
09M
ay/0
9Se
p/09
Jan/
10M
ay/1
0Se
p/10
Jan/
11M
ay/1
1Se
p/11
Jan/
12M
ay/1
2Se
p/12
Jan/
13M
ay/1
3Se
p/13
Jan/
14
Jan/
15
May
/14
Sep/
14
Chart IV.6. Evolution of federal bond debt composition according to main indexes: Selic, pre-fixed and inflation from January 2000 to January 2015.
Source: Central Bank.
by the economic policy-makers. In 2008, for instance, the government used state-owned banks and international reserves to ensure liquidity to private sector, in addition of exe-cuting an expansionary policy aiming to sus-tain aggregated demand. But on crises at the beginning of 2000s and in the 1980s, liquidity restrictions forced a strong fiscal adjustment to the government, requiring cash control.
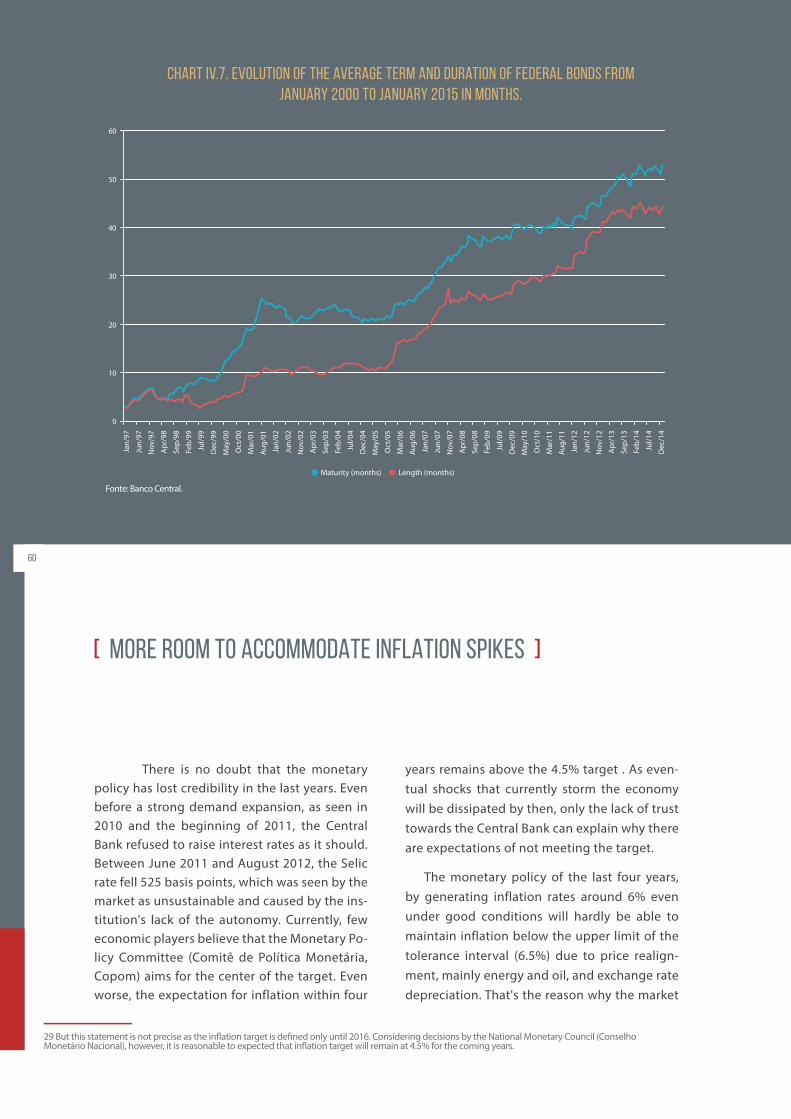
60
0
10
20
30
40
50
60
Maturity (months) Length (months)
Jan/
97
Jun/
97
Nov
/97
Apr
/98
Sep/
98
Feb/
99
Jul/9
9
Dec
/99
May
/00
Oct
/00
Mar
/01
Aug/
01
Jan/
02
Jun/
02
Nov
/02
Apr
/03
Sep/
03
Feb/
04
Jul/0
4
Dec
/04
May
/05
Oct
/05
Mar
/06
Aug/
06
Jan/
07
Jun/
07
Nov
/07
Apr
/08
Sep/
08
Feb/
09
Jul/0
9
Dec
/09
May
/10
Oct
/10
Mar
/11
Aug/
11
Jan/
12
Jun/
12
Nov
/12
Apr
/13
Sep/
13
Feb/
14
Jul/1
4
Dec
/14
Chart IV.7. Evolution of the average term and duration of Federal Bonds from January 2000 to January 2015 in months.
Fonte: Banco Central.
[ MORE ROOM TO ACCOMMODATE INFLATION SPIKES ]
There is no doubt that the monetary policy has lost credibility in the last years. Even before a strong demand expansion, as seen in 2010 and the beginning of 2011, the Central Bank refused to raise interest rates as it should. Between June 2011 and August 2012, the Selic rate fell 525 basis points, which was seen by the market as unsustainable and caused by the ins-titution's lack of the autonomy. Currently, few economic players believe that the Monetary Po-licy Committee (Comitê de Política Monetária, Copom) aims for the center of the target. Even worse, the expectation for inflation within four
years remains above the 4.5% target . As even-tual shocks that currently storm the economy will be dissipated by then, only the lack of trust towards the Central Bank can explain why there are expectations of not meeting the target.
The monetary policy of the last four years, by generating inflation rates around 6% even under good conditions will hardly be able to maintain inflation below the upper limit of the tolerance interval (6.5%) due to price realign-ment, mainly energy and oil, and exchange rate depreciation. That's the reason why the market
29 But this statement is not precise as the inflation target is defined only until 2016. Considering decisions by the National Monetary Council (Conselho Monetário Nacional), however, it is reasonable to expected that inflation target will remain at 4.5% for the coming years.
[ MORE DIFFICULTIES FOR A FAST RECOVERY]
expects inflation to go over 7.5% in 2015, ac-cording to Central Bank's Focus Survey released this March.
Even with all these problems, distrust to-wards inflation is much smaller than it was during the 1999 and 2002 crises. In 1999, we had just implemented the inflation tar-get regime that was by then implemented successfully in advanced economies such as England, Canada, Sweden, and New Zealand. There were not even reliable his-torical series and expertise to project infla-tion and the monetary policy transmission mechanism, basic instruments for Copom's decision making. Within that context, the Central Bank could not let inflation loose under the risk of losing all credibility.
In 2002, due to the first Worker's Party admi-nistration, distrust over the future conduction of the overall economic policy (and the mone-tary policy in particular) led to a strong increa-se in inflation and cambial depreciation. Again, the new Central Bank president could not signal any kind of benevolence towards inflation.
In those times, any pressure for increasing demand, whether by consumption, investment or government spending, would lead to a Cen-tral Bank reaction signaling to the market its in-
tolerance against inflation deviations from the
goal.
Currently, despite the aforementioned cre-
dibility loss, the market realizes that inflation
will not spiral out of control. Furthermore, if
required, the private sector understands that
a simple change of direction by the Central
Bank board suffices to make inflation return to
the goal, as there is an already successful expe-
rience with the target regime and expertise has
been created.
Additionally, the monetary theory30 deter-
mines that face to cost shocks, as those we ex-
perience now (fee increases and exchange rate
depreciation), the optional response from the
monetary policy is to let inflation go up and
then gradually get back to the target.
Thus, inflation is a secondary concern at
the moment. Cost shocks will exert the lar-
gest pressures on inflation which, certainly,
the Central Bank will not (nor should) fully
neutralize. And an eventual accommodation
to demand pressures will not damage the mo-
netary authority's credibility more than it has
been in the last years.
If we look to the pattern of the three
last crises (1999, 2003, and 2008), the eco-
nomy has recovered relatively fast. Table IV.2
shows the variation of the GDP in years of cri-
ses. In 1999 and 2003, crises were more inten-
se in the first quarter of those years . Thus, the
economy performance in those years reflec-
ted the impact of adopted stabilization poli-
cies. In the case of 2008 international financial
crisis, the turning point was the bankruptcy
of Lehman Brothers, in September. Due to
delays, the Brazilian GDP (considering the ac-
crued value during four quarters) fell only at
the first quarter of 2009 and only shown a po-
sitive growth in the first quarter of 2010. For
this reason, we use this quarter as reference
for Table IV.2.
30 See Clarida et al (1999).31Or the last quarter of the previous year.
61
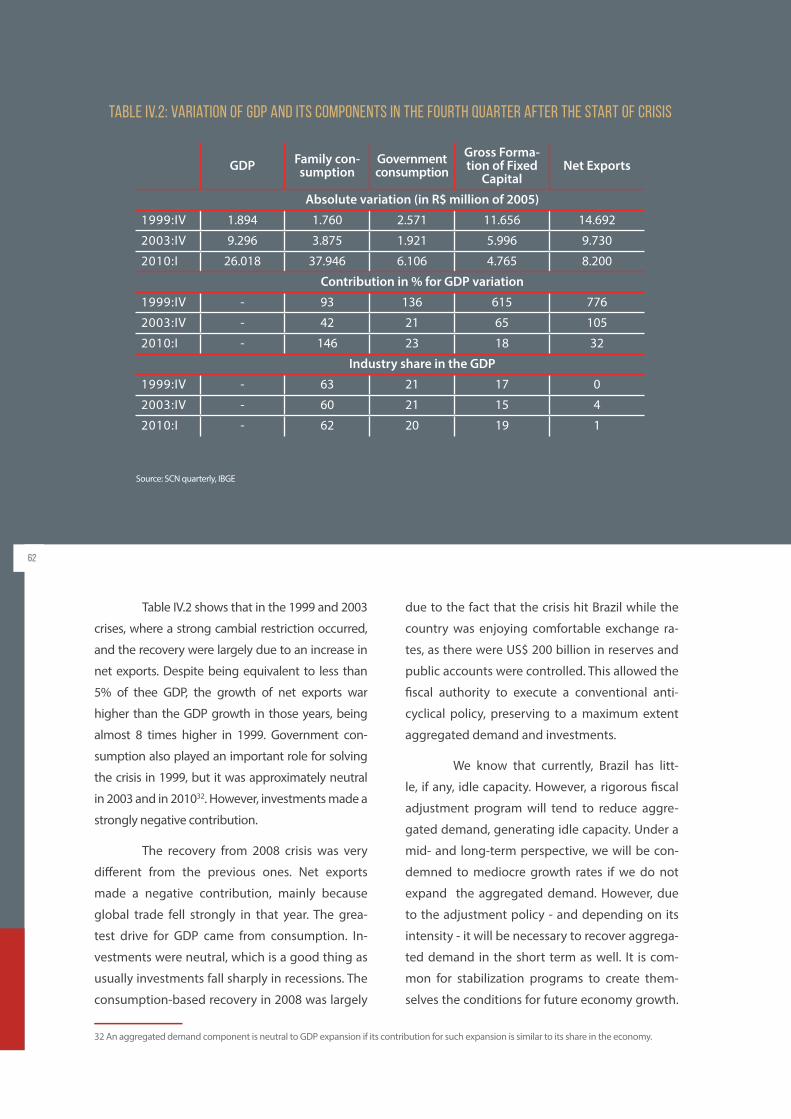
62
Table IV.2 shows that in the 1999 and 2003
crises, where a strong cambial restriction occurred,
and the recovery were largely due to an increase in
net exports. Despite being equivalent to less than
5% of thee GDP, the growth of net exports war
higher than the GDP growth in those years, being
almost 8 times higher in 1999. Government con-
sumption also played an important role for solving
the crisis in 1999, but it was approximately neutral
in 2003 and in 201032. However, investments made a
strongly negative contribution.
The recovery from 2008 crisis was very
different from the previous ones. Net exports
made a negative contribution, mainly because
global trade fell strongly in that year. The grea-
test drive for GDP came from consumption. In-
vestments were neutral, which is a good thing as
usually investments fall sharply in recessions. The
consumption-based recovery in 2008 was largely
due to the fact that the crisis hit Brazil while the
country was enjoying comfortable exchange ra-
tes, as there were US$ 200 billion in reserves and
public accounts were controlled. This allowed the
fiscal authority to execute a conventional anti-
cyclical policy, preserving to a maximum extent
aggregated demand and investments.
We know that currently, Brazil has litt-
le, if any, idle capacity. However, a rigorous fiscal
adjustment program will tend to reduce aggre-
gated demand, generating idle capacity. Under a
mid- and long-term perspective, we will be con-
demned to mediocre growth rates if we do not
expand the aggregated demand. However, due
to the adjustment policy - and depending on its
intensity - it will be necessary to recover aggrega-
ted demand in the short term as well. It is com-
mon for stabilization programs to create them-
selves the conditions for future economy growth.
32 An aggregated demand component is neutral to GDP expansion if its contribution for such expansion is similar to its share in the economy.
Table IV.2: Variation of GDP and its components in the fourth quarter after the start of crisis
Source: SCN quarterly, IBGE
GDP Family con-sumption
Government consumption
Gross Forma-tion of Fixed
CapitalNet Exports
Absolute variation (in R$ million of 2005)
1999:IV 1.894 1.760 2.571 11.656 14.692
2003:IV 9.296 3.875 1.921 5.996 9.730
2010:I 26.018 37.946 6.106 4.765 8.200
Contribution in % for GDP variation
1999:IV - 93 136 615 776
2003:IV - 42 21 65 105
2010:I - 146 23 18 32
Industry share in the GDP
1999:IV - 63 21 17 0
2003:IV - 60 21 15 4
2010:I - 62 20 19 1

Increasing public savings tends to depreciate the
exchange rate, encouraging net exports. Further-
more, enhancing the perception on the public
sector solvency may encourage consumption and
investment as trust in the economy grows.
This begs the question: can we say that, given
the current context, the macroeconomic adjust-
ment is enough to activate the recovery mecha-
nisms for the economy's aggregated demand in a
reasonable timeframe?
In relation to consumption, it is hard to repeat
the experience in 2008 when before the crisis (in
2008:III), consumption was expanding at an accu-
mulated rate of 6.7% in 12 months. This rate fell
due to the crisis, but by reaching a low of 3.25%
in 2009:III, it was a reasonable figure for times of
crisis. Currently, consumption is expanding much
more slowly. In 2014 (last data available), con-
sumption growth rate accumulated in 12 mon-
ths fell gradually from 1.8% to 1.5% and 0.9% on
quarters 1, 2, and 3, respectively. It is not probable
that the population feels encouraged to consume
more due to the deterioration of economic gro-
wth expectation, inflation increase (which might
decrease real wages) and job market stagnation33.
It is highly improbable the reediting of incen-
tives such as those provided in 2008 and 2009,
as tax exemption for vehicles and other durable
goods, considering fiscal restrictions. Credit also
tends to become limited, because the financial
system feels less comfortable to loan during re-
cessions. Additionally, the next steps of the Car
Wash Operation may affect bank's balances and
thus, the credit supply.
In relation to government's consumption, the
current fiscal adjustment will leave almost no
room for economy stimulus. The primary surplus
target for 2015 is 1.2%, which means a gigantic
effort if one considers that the primary result in
2014 was negative in 0.6% of the GDP. In other
words, the fiscal effort measured as the difference
between the consecutive primary results for two
years shall be of 1.8% of the GDP. If it succeeds, it
would have been the largest fiscal effort obtained
since 1999, when it reached 3.2% of the GDP. Sin-
ce then, no fiscal effort went above 1% of the GDP.
The perspectives for investment are not
good either. Table IV.2 has shown that investment
fell sharply in Brazil in 1999 and 2003. However, as
trust was recovered, investments grew in the fol-
lowing years: 5% in 2000 and 9.1% in 2004. In the
2008 crisis, the investment growth rate also fell,
but similarly to what happened to consumption,
the fall was from the heights: 16.7% in 2008:III. The
minimum was a growth rate of 2.5%, which is sa-
tisfactory for a period of crisis.
But the current situation is well less promi-
sing. Investments are in free fall: reduction of
0.7% in the second quarter of 2014, and more
4.6% in the third quarter of the same year. The
fiscal adjustment may limit Treasury loans to
BNDES, main long-term lender in our economy.
Exchange rate depreciation might upset the
balance of companies with foreign debt, redu-
cing funds available for investment. Petrobras,
which accounts for some 10% of investments in
Brazil, shall revise its plan downward due to cor-
ruption charges in the company, its high debt
levels and the recent downgrade of its debt.
Another barrier for investments will be the pro-
bable water and energy rationing.
Finally, net exports hardly can perform
the same role they did on the 1999 and 2003 cri-
ses recovery. Such as happened in those years,
there has been a significant depreciation of the
33 As explained above, the low unemployment rate is more due to a slow expansion of the Economically Active Population than to job generation. Considering the metropolitan areas surveyed by the Monthly Job Survey (Porto Alegre, São Paulo, Rio de Janeiro, Belo Horizonte, Salvador, and Recife), the total number of employment reach a peak in October 2012 with 23.5 million employed people. The General Record of Employed and Unemployed People (Cadastro Geral de Empregados e Desempregados, Caged) maintained by the Ministry of Labor shows that in 12 months ended in February 2015, the formal sector lost 48,000 jobs, or 0.11% of all job posts.
63
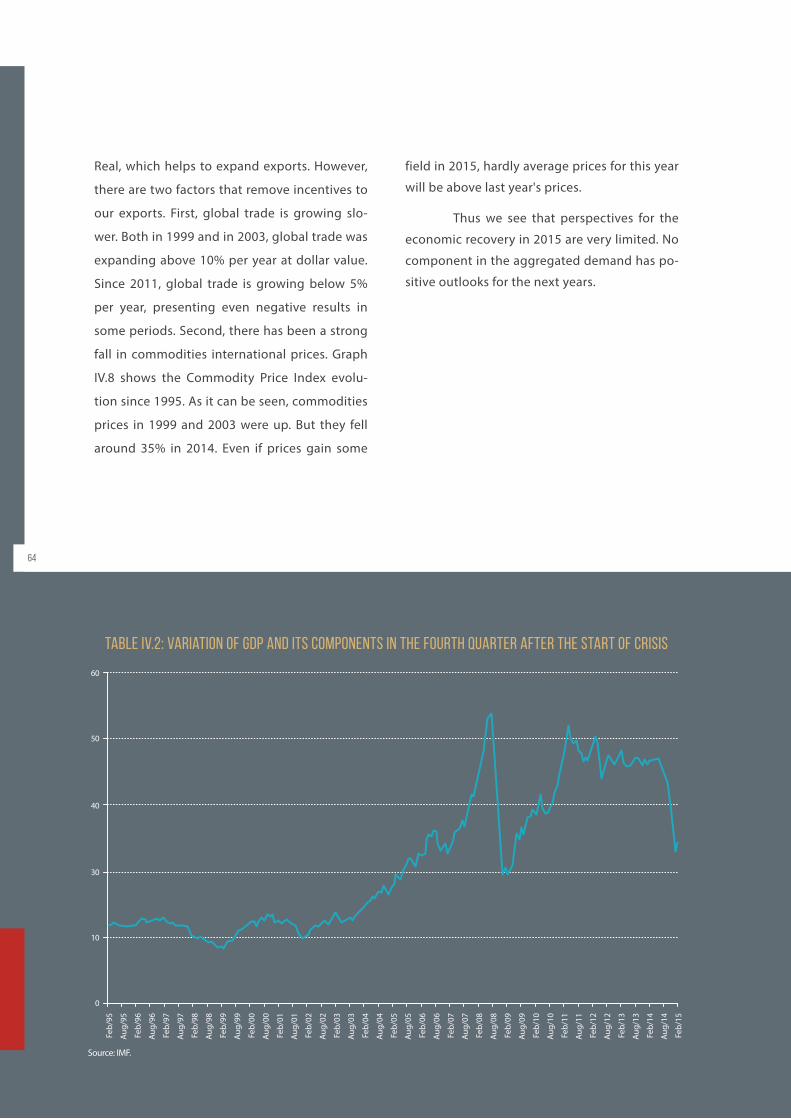
Real, which helps to expand exports. However,
there are two factors that remove incentives to
our exports. First, global trade is growing slo-
wer. Both in 1999 and in 2003, global trade was
expanding above 10% per year at dollar value.
Since 2011, global trade is growing below 5%
per year, presenting even negative results in
some periods. Second, there has been a strong
fall in commodities international prices. Graph
IV.8 shows the Commodity Price Index evolu-
tion since 1995. As it can be seen, commodities
prices in 1999 and 2003 were up. But they fell
around 35% in 2014. Even if prices gain some
field in 2015, hardly average prices for this year
will be above last year's prices.
Thus we see that perspectives for the
economic recovery in 2015 are very limited. No
component in the aggregated demand has po-
sitive outlooks for the next years.
64
0
10
30
40
50
60
Feb/
95
Aug/
95
Feb/
96
Aug/
96
Feb/
97
Aug/
97
Feb/
98
Aug/
98
Feb/
99
Aug/
99
Feb/
00
Aug/
00
Feb/
01
Aug/
01
Feb/
02
Aug/
02
Feb/
03
Aug/
03
Feb/
04
Aug/
04
Feb/
05
Aug/
05
Feb/
06
Aug/
06
Feb/
07
Aug/
07
Feb/
08
Aug/
08
Feb/
09
Aug/
09
Feb/
10
Aug/
10
Feb/
11
Aug/
11
Feb/
12
Aug/
12
Feb/
13
Aug/
13
Feb/
14
Feb/
15
Aug/
14
Table IV.2: Variation of GDP and its components in the fourth quarter after the start of crisis
Source: IMF.
#4.3 [ IT IS CRITICAL TO MAINTAIN PUBLIC SECTOR INVESTMENTS IN INFRASTRUCTURE AND EXPAND THE GRANT PROGRAM ]
This section aims to show that despite the need for a fiscal adjustment, government shall main-tain investments. We shall argue at first that cutting investments do not change the payment ability of the public sector. Later on, we shall complete the argument by showing that the particularities of this crisis recommend to keep investing and to resume the grant program.
[ INVESTMENTS DO NOT DAMAGE PUBLIC SECTOR'S FINANCIAL HEALTH ]
65
Fiscal statistics, such as primary re-sult, nominal deficit, gross or net debt, are fre-quently released and usually used by financial analysts as benchmark to assess a government's financial situation. These are actually important and critical data to assess a macroeconomic si-tuation of a country.
However, any strict assessment has to analy-ze other indicators. If the analysis targets only the short term situation of a country, it does not matter whether public spending is for operational costs or investment. But for the long run, it is criti-cal to distinguish the nature of spending.
It is true that situations characterized by a strong liquidity restriction, such as the ones we experienced in 1999 and 2003, the planning pers-pective is short. Therefore, if a government rea-ched a level of distrust to a point where it is not able to finance itself, it is necessary first to save money by cutting expenses deeply (whether they are operational or investment) to later recover the economy's trust (or trust from multilateral entities such as the IMF) and get financing again.
But if there is no liquidity issue, the quality of spending affects dramatically the eco-
nomy's mid- and long-term results. Investments, if
well carried out, increase the economy's produc-
tion capacity, allowing for income generation and
consequently, more taxes.
For instance, building a highway can reduce
freight costs and increase efficiency on allocation
production factors in the economy. Even if there
are no toll fees, the possibility of allocating eco-
nomy resources more efficiently would positively
impact the activity level, and thus increasing fu-
ture tax collection. Investment in sanitation al-
low for less diseases, saving money from health
treatments and reducing job leaves due to poor
health. Similarly, we can prove that investments
in urban mobility, energy, telecom - investments
in infrastructure in general - can bring financial re-
turns for the government, whether by increasing
tax collection or by reducing costs. Depending on
such returns, investments are financially self-sus-
tainable.
When an entity's financial ability is analyzed
(whether public or private), such analysis shall be
performed under a long-term perspective. If high
spending today will imply less expenses or more
revenue tomorrow, then such spending shall be made even if they create deficits in the short term.
One can demonstrate that, once the internal return rate of an investment is higher or equal to the interest rate applied to public debt, it is worth for the government to increase debt le-vels to finance a given project. In other words, if the current value of benefits brought by the in-vestment is at least equal to their cost, the opti-mal decision by the administrator is to perform such investment.
Finally, it is worth remembering that public spending increase by investment does not con-flict with the goal to increase public saving. Des-pite savings and fiscal result are interconnected concepts, they are synonyms. Fiscal result is the difference between total tax collection and spen-ding. Public saving is the difference between tax collection and current expenses. Thus, a public sector of a country can spend much, experiencing deficits (nominal or primary) and save money at the same time.
[ THE CURRENT CRISIS JUSTIFIES THE MAINTENANCE OF PUBLIC SPENDING WITH INVESTMENTS ]
We have seen that investments can
be sustainable under a financial standpoint.
Furthermore, on Section IV.2, we have shown
several particularities of the current crisis. As
we shall see next, today's specificities recom-
mend that the fiscal adjustment is carried out
as to preserve to a maximum extent spending
with investments.
The first question posed by this is if the go-
vernment has financial conditions to keep in-
vestments in infrastructure. The answer is yes.
In this current crisis, the public sector does not
face liquidity problems and can finance itself. It
is true that by spending, the public sector com-
petes against the private sector for funds avai-
lable in the economy. But this is not a different
competition that one can see in situations of
less macroeconomic imbalance. Furthermore,
as discussed in Velloso et al (2013), the Brazilian
public sector problem is the trend to overspend
in operational costs, with employees, social in-
surance and social programs, not investments.
The monetary policy shall also not pose
restrictions to policies that maintain public in-
vestments in infrastructure. Such investments
correspond to a small GDP percentage below
2%. So they do not overpressure the aggrega-
ted demand and thus, the level of prices. But
even if they do, controlling inflation, despite its
importance, is not as required as it was in pre-
66
vious adjustment programs in 1999 and 2003.
At those times, it was critical that the monetary
authority signal with conviction to the market
that any inflationary spike would not tolerated.
Despite the monetary policy's loss of credibility
in the last years, currently there is more room for
the Central Bank to adopt an accommodating
policy. This means that an eventual demand
increase caused by public investments would
not bring an interest rates increase, negatively
affecting the whole economy.
Thus, we find that government is able to
keep investing in infrastructure. The second
question is if the government must keep these
investments. And the answer is also yes.
Firstly, because this is a crisis marked by a li-
mitation on aggregated supply. Cutting invest-
ments would limit our future growth capacity
even further.
Secondly, because private investments
shall not recover as fast as they did in pre-
vious crises: there is a high degree of uncer-
tainty; a water and energy rationing looms in
the horizon; Petrobras, responsible for 10%
of Brazil's investments, shall revise its busi-
ness plan; and the credit market shall become
more strict. This way, without public invest-
ment, there is a trend that the economy's
aggregated investment will fall.
Third, when we look to the components
of aggregated demand, all we can see is poor
perspectives: family consumption, govern-
ment consumption, net exports and, of cou-
rse, investment itself - all configuring barriers
for private investment.
It is worth to remember that selecting fi-
nancially sound investments was already part
of previous macroeconomic adjustment pro-
grams. In 2005, still under the IMF adjustment
program, it was created the Investment Pilot
Program (Programa Piloto de Investimento,
PPI) with the blessing from the fund. It was
a never-seen-before program back then, in
which it was allowed to discount from the
primary result goal (in that case, 0.1% of the
GDP) to investments. Justification for PPI is
similar to the one discussed above: self-sus-
tainable investments do not damage public
sector's financial health, when all impacts are
considered over time.
Curiously, PPI-allowed discount was not
used. Partly because tax collection increa-
sed quickly (there was a commodity boom
with strong gains on exchange terms), ren-
dering the discount unnecessary. It also
shall be considered that even with IMF su-
pport, the economic team need and wan-
ted to show strong commitment to public
finances, in order to gain trust.
Curiously, PPI-allowed discount was not
used. Partly because tax collection increased
quickly (there was a commodity boom with
strong gains on exchange terms), rendering
the discount unnecessary. It also shall be con-
sidered that even with IMF support, the eco-
nomic team need and wanted to show strong
commitment to public finances, in order to
gain trust.
67
#4.4 [ THE MY HOUSE MY LIFE HOUSING PROGRAM ]
68
The My House My Life housing program (MCMV) was created in 2009 aiming to finance 1 million houses initially. The goal for the second phase, launched in 2011, was to build 2 million houses. Currently, MCMV is in its third phase, ai-ming to build 3 million houses. It serves the po-pulation with household income up to R$ 5,000 - those with income up to 1,600 can pay in 120 months, with installments limited to 5% of the monthly household income and the subsidy may reach to 96% of the house value.
Due to changes in the accounting me-thod, MCMV, accounted as operational expense before in the form of transfer from Treasury to the Housing Fund, it is now accounted as public in-vestment. This procedure changed government statistics dramatically, raising public investment to 1.48% of the GDP in 2014 from 1.19% (as per Almeida, 2015).
Irrespective of the controversy if it is public investment or not, as it is a subsidy targe-ted for new housing, MCMV directly impacts the aggregated investment rate (public and private) of the economy. In numbers, the program consu-med R$ 14.8 billion or 0.3% of the GDP in 2014.
This is a program absorbing many public
resources. For comparison purposes, spending
with Continuous Subsidy Benefit (Benefício de
Prestação Continuada, BPC) reached R$ 31.4 bil-
lion; Bolsa Família, R$ 27 billion; Unemployment
Benefit, R$ 36 billion; Salary Bonus, R$ 16 billion.
Thus, MCMV is a program similar to the main so-
cial assistance programs in Brazil. Changes to any
of these programs bring considerable fiscal im-
pacts. The issue, thus, is to analyze the need of
spending with each one of them.
For instance, BPC and Bolsa Família aims to ensure minimum income for a given social group: for the former, old and disable people and the latter, poor families in general. Thus, there is a large inter-face between them, which may be used to reduce costs. The Wage Bonus focuses on the formal sector worker earning up to two minimum wages. This is the program less focused on poverty elimination from all programs, as its target audience is not the poorest of the poorest. Unemployment insurance aims to protect unemployed workers but it juxtapo-ses to FGTS in a certain measure.
In the other hand, MCMV focuses ci-vil construction. Contrary to other social pro-grams, this is the only program directly impac-ting the economy's investment rate. It is true that, from the public accounting standpoint, MCMV is more similar to a current expenditure as hardly the government will fully recover the amounts spent as taxes. As we will see later, ho-wever, even if the public sector cannot recover the amount invested in full, the public sector obtains some financial return.
From the society standpoint, though, expenditure with housing construction is just like any investment. Housing built through MCMV will generate housing services and thus, rent. The difference is that the tenant and the owner are the same person, so that there is no financial transaction associated to such rent. From a national account perspective, however, the rent paid by the owner to himself is accou-nted. This makes sense because the goal to measure the wealth of a country is to assess the well-being of its population, and better housing certainly help to well-being, even if there is no financial flow related to the service.
69
34 See ROSSI-HANSBERG et al (2010).35 PNAD does not detail civil construction from its several components, such as construction of houses, highways and others.
Thus, MCMV can lead to a sustained GDP ex-pansion even if it do not expand income tax col-lection, as financial transactions related to renting the house will not take place. But the public sector can obtain other financial gains. Better housing positively impacts the worker productivity, as he/she can rest better and is less exposed to disea-ses caused by increased agglomeration of people. Children can also benefit from better health and environment for studies. Cities can benefit from larger housing-related tax collection. Further-more, studies show34 that housing programs can positively impact the price of properties adjacent to the area of the program, raising rents and the potential of housing-related taxes and income tax. Finally, as there will be an increase in the GDP, MCMV improves macroeconomic indicators such as the debt/GDP ratio, which helps to improve the risk-country perception.
Thus, despite MCMV implies in govern-ment spending without financial returns in the same size, one can say that such return is not null, at least. As it is a program with a strong social appeal, two questions beg to be made: first, is it necessary for the government to offer subsidies? Secondly, is it necessary to invest in housing? The answer for both questions is affirmative.
On the need for subsidies, as it is low in-come target audience, housing would not be built. Here we can make a relevant point. As it is an essen-tial good, hardly someone would relinquish a decent house if were able to purchase or rent it. Families live under precarious conditions because they cannot afford better housing. A house valued at R$ 100,000 would imply in a rent around R$ 500 per month. If it is purchased, only monthly interests would require payment of the same R$ 500 (assuming subsidized interests of 6% per annum), not considering amorti-zation, which would make the payment unaffordab-le for low income families.
As for the second question, there are no dou-bts on the need for a housing program. According to the IBGE, the housing gap in Brazil was almost 6 million houses in 2012.
An IMF study (2012) points to the same direc-tion by showing that Brazil needs to expand access to housing. Chart IV.9 shows housing credit as a propor-tion of the GDP. Data from 2010 and 2011 when the housing credit in Brazil was below 5% of the GDP. It is true that a strong credit expansion took place since then. It is estimated that Brazil has ended 2014 with a stock corresponding to 8.4% of the GDP. It is still a figu-re way below the global average that is around 12% of the GDP. Considering data from 2010/11, we were wor-se than emerging countries like Chile, Thailand, Mexico, Panama, and Peru - and much behind the list toppers as Hong Kong, Malaysia and South Korea.
When investment is broken down in purchase of machines and equipment and construction, one can see that our largest gap is in construction spending. According to Chart IV.10, Brazil was spending in 2006 8.5% of the GDP in purchasing machines and equipments, which was almost 1 percentage point above the global average. Even intensive investing and growing countries, such as China and South Korea, were investing more than Brazil: 9.9% and 9.1% of their respective GDPs. A large gap is found in construction investment. While Brazil spent 6.6% of the GDP in that year, the global average was 11.9%. In China, no less than 26% of the GDP was invested in housing.
It is true that spending in construction is not li-mited to housing. It also involves road infrastructu-re, dams and others. Anyway, along with evidences presented above, we can conclude that Brazil still invests little in housing.
Finally, one shall consider the importance of investing in housing for the economy re-covery and job creation. Furman (2014) sho-ws the economy recovery in the US is usually boosted by the recovery in house building. On job creation, the Brazilian construction sector has been expanding its role in job generation since 2011, according to PNAD. The sector employed some 7% of all employees during 2002 and 2009. In 2013, more than 9% of em-ployees were working in the civil construction (most recent data)35. It should be mentioned as well that the sector is important by em-
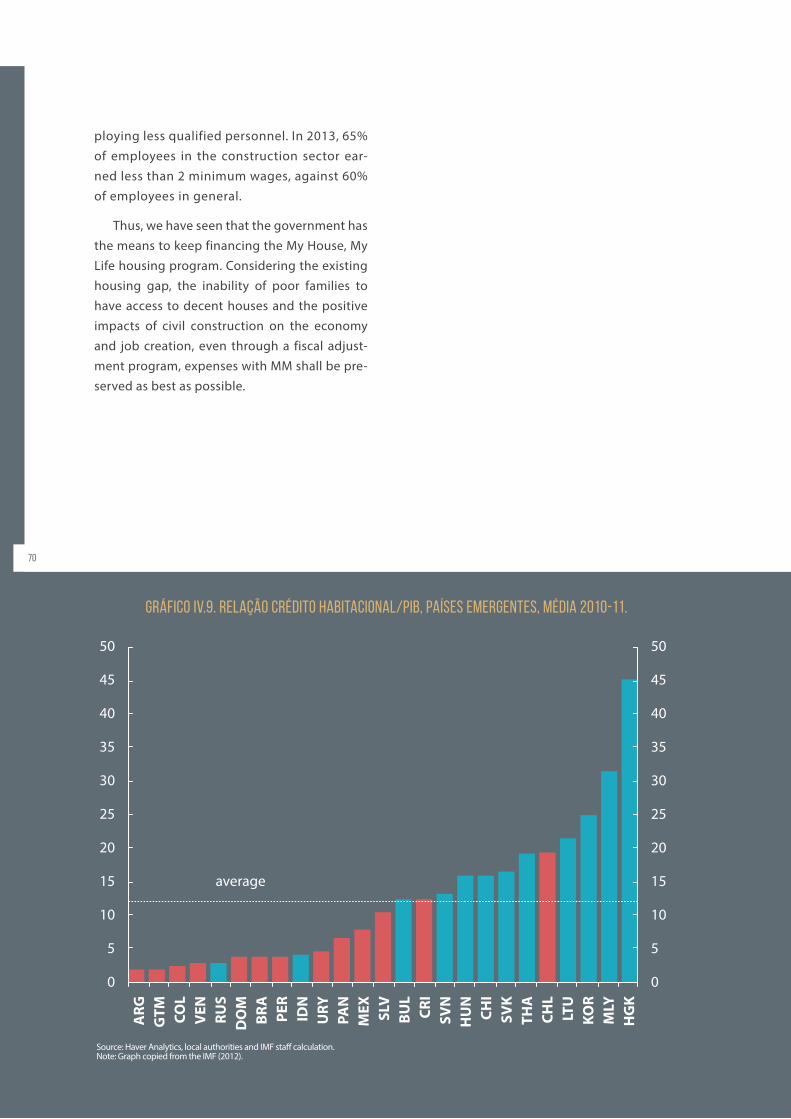
ploying less qualified personnel. In 2013, 65%
of employees in the construction sector ear-
ned less than 2 minimum wages, against 60%
of employees in general.
Thus, we have seen that the government has
the means to keep financing the My House, My
Life housing program. Considering the existing
housing gap, the inability of poor families to
have access to decent houses and the positive
impacts of civil construction on the economy
and job creation, even through a fiscal adjust-
ment program, expenses with MM shall be pre-
served as best as possible.
70
ARG
GTM COL
VEN
RUS
DOM
BRA
PER IDN
URY
PAN
MEX SLV
BUL
CRI
SVN
HUN
CHI
SVK
THA
CHL
LTU
KOR
MLY
HGK
50
45
40
35
30
25
20
15
10
5
0
50
45
40
35
30
25
20
15
10
5
0
average
Gráfico IV.9. Relação crédito habitacional/PIB, países emergentes, média 2010-11.
Source: Haver Analytics, local authorities and IMF staff calculation.Note: Graph copied from the IMF (2012).
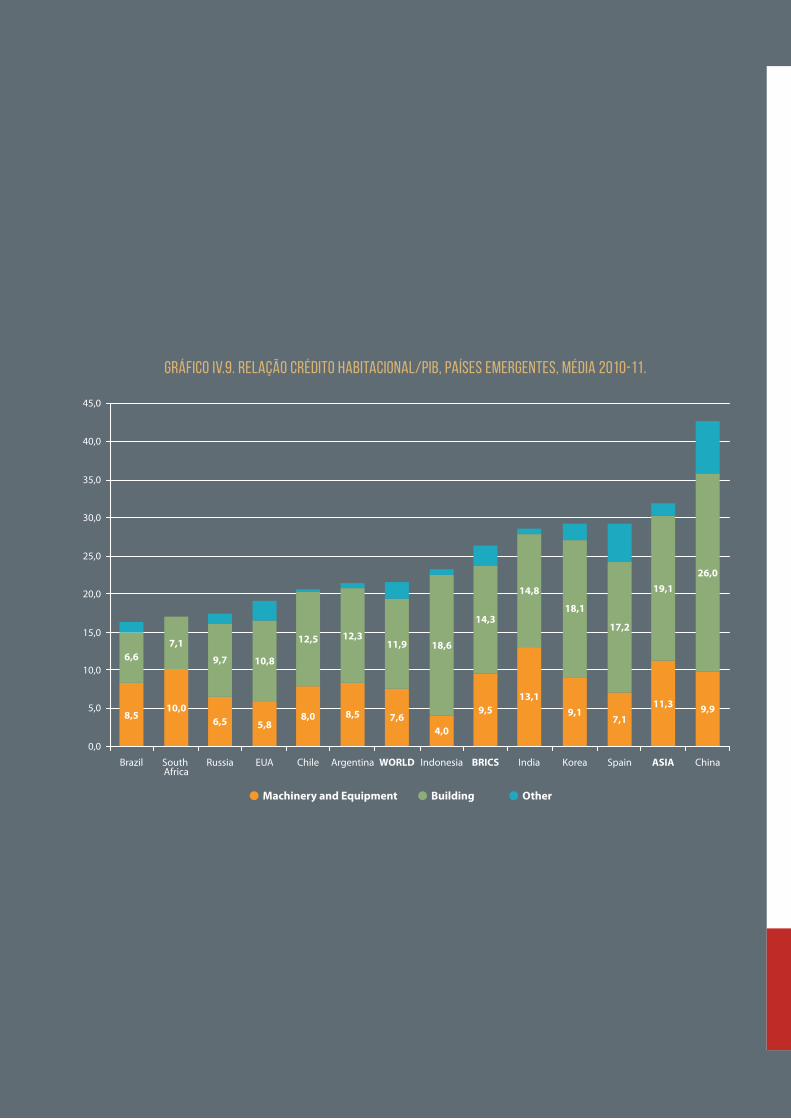
Brazil Russia EUA Chile Argentina WORLD Indonesia BRICS India Korea Spain ASIA ChinaSouth Africa
0,0
5,0
10,0
15,0
20,0
25,0
30,0
35,0
40,0
45,0
Machinery and Equipment Building Other
6,6
8,5
7,1
10,0
9,7
6,5
10,8
5,8
12,5
8,0
12,3
8,5
11,9
7,6
18,6
4,0
14,3
9,5
14,8
13,1
18,1
9,1
17,2
7,1
19,1
11,3
26,0
9,9
Gráfico IV.9. Relação crédito habitacional/PIB, países emergentes, média 2010-11.

7272

7373#CONCLUSION
Under any perspective, Brazil invests too little in in-
frastructure. In relation to our own past, there has been a
reduction from the 1970s on, when we used to invest an
average of 5.4% of the GDP to between 2.0% and 2.5%
of the GDP. Compared against other countries, we also
invest little in infrastructure. Especially, countries from
East Asia are consistently investing more than 5% of the
GDP in infrastructure. Finally, we also invest little in our
needs. There is a rule of thumb that determines 3% of
the GDP as the minimum threshold required to keep the
existing infrastructure stock. Considering our gaps, we
should invest at least 5% of the GDP during several years
in order to close these gaps.
The reduction of investment in infrastructure in Brazil
can be credited to two key factors:
I) Economic adjustment programs. Since the 1980s,
Brazil has been experiencing several economic crises,
being forced in many of them (such as in 1982, 1990,
1999, and 2003) to make fiscal adjustments. Traditio-
nally fiscal adjustments focus on slashing investments
as opposed to operational expenditure.
II) Non-substitution of public investment for priva-
te investment. When the privatization program was
launched, the State expected to perform the role of
regulator, transferring to the private sector the job of
investing. Improper regulatory benchmark, lack of au-
tonomy for the regulating entities, high capital cost, le-
gal insecurity, and an excessive policy focus on low fees
made difficult for the private sector to entry.
Investments in infrastructure, after reaching the
bottom in the 2000s, resumed growth after the laun-
ch of PAC, achieving 2.45% of the GDP in 2013. There
is no data for 2014, but facing the perspectives of ove-
rall investment rate reduction, it is expected that the
investment in infrastructure have also been reduced.
It is feared now that due to another fiscal adjustment,
once more the government cuts investments more in-
tensely than current expenses.
We understand that this policy is risky and unneces-
sary. It is risky because the lack of infrastructure is huge,
both quantitative and qualitative. Even admitting that
some infrastructure sectors are performing well, such
as telecom, the overall situation is quite poor. The most
recent World Economic Forum report for 2014/15, for
instance, ranked Brazil's infrastructure in 120th place
out of 144 countries, with a negative highlight on high-
ways and ports.
It is critical to develop our infrastructure to ensure
higher GDP growth rates in a sustainable fashion. Lite-
rature shows how investing in infrastructure supports
strong economic growth. For Latin America, there are
evidences that these investments lead not only to
the GDP growth but also to improving income distri-
bution. For Brazil, particularly, to improve and expand
infrastructure is even more important face to the low
productivity growth.
As a long term strategy to increase investments
in infrastructure, it is necessary: i) to increase the local
savings rate to generate the funds required to finance
expenditures; ii) to make investing more attractive to
the private sector, which requires to build a business
environment more favorable and a behavior more in-
clined to privatizations by the public sector; iii) better
planning to avoid waste.
2015 started with the implementation of a ma-
croeconomic adjustment that is required due to the
deterioration of several indicators. Particularly, there
has been a worsening of the public accounts situa-
tion, as well as for inflation perspectives and for the
external accounts. Still, the current situation allows -
and recommends for - that the adjustment is carried
out so to preserve to the maximum extent possible
74
#CONCLUSION
75
the investments from the public sector, particularly
those in infrastructure.
The current situation allows for continuing invest-
ments in infrastructure because, instead of past crises,
there are no exchange rate crisis or liquidity issues. For
this reason, there is no barrier preventing those finan-
cially sound projects, i.e., those in which the internal
return rate is equal or higher than debt cost, should
prosper. As there are no liquidity constraints, the public
sector manages to get the necessary resources to bear
initial costs incurred by implementing the project.
The current situation recommends to continue
to investing in infrastructure by two key reasons. First,
the current crisis is mainly a demand crisis. Both the
installed capacity utilization rate as unemployment
rates indicate that there is no idle capacity in the eco-
nomy, albeit we are undergoing a stagnation period.
In this context, it is critical to increase productivity. In
the long term, this is achievable by investing heavily in
human capital. But, in the short term, the best strategy
is to expand the aggregated supply with investments.
Investments in infrastructure are particularly desirable
in the current environment, as they positively impact
economy's productivity across the board.
Secondly, we understand that despite there is no
idle capacity, a macroeconomic adjustment program
should lead to more unemployment and reduction
of the installed capacity utilization. In normal crises, a
well executed adjustment program restores economic
agent trust, that resume purchasing and investing. The
problem is that in the current crisis, the prognostics are
not favorable to recover the aggregated demand com-
ponents, especially for investing. Adding to the current
uncertain environment, which is common in times
of crisis, the consequences of the so-called "Carwash
Operation", high debt levels and the worsening of risk
perceptions shall force Petrobras, the state-owned oil
company in charge of some 10 of investments made
in Brazil, to review its expenditure plans. A looming ra-
tioning of water and energy shall cause private sector
investments to reduce even further. If the private sector
is not investing, the public sector shall keep investing in
activities it was investing before, as a minimum.
According to accounting criteria recently adopted
by Treasury, near 20% of public investment is directed
to the My House, My Life housing program (MCMV).
Although it is not an infrastructure investment, it is im-
portant to consider it as it is one of the most investment
programs (if not the most important) with a broad so-
cial reach, in terms of expenditure and the number of
beneficiaries. Despite it does not bring any future tax
revenue for the government, as other investments do,
MCMV directly impacts the country investment rate
and causes the GDP to increase due to rents saved.
MCMV has high costs, but its social reach is also of
relevance. Low income families cannot afford to rent
or buy a house. Poorer families will not be able to live
in decent houses if some subsidy is offered to them.
Despite MCMV exists since 2009, the country's housing
gap remains high. Credit is still low at approximately
8%, below the emerging economies average that is
near 12%. Thus, it is necessary to expand the housing
market in Brazil. Finally, considering that civil construc-
tion requires intensive workforce, incentives to this
sector can contribute to keep employment levels high,
which is important in periods of economic stagnation
as the one we are in now.
#REFERENCES
ALMEIDA, Mansueto. Investimento Público Governo Federal: fracassou. Blog do Mansueto Almeida. 27 de janeiro de 2015.
Disponível em: https://mansueto.wordpress.com/2015/01/
BARBOSA FILHO, Fernando de Holanda. Uma estimativa do produto potencial no Brasil. Eco-nomia & Tecnologia - Ano 07, Vol. 27 - Outubro/Dezembro de 2011.
Disponível em: http://ojs.c3sl.ufpr.br/ojs/in-dex.php/ret/article/viewFile/25904/17287
BIELSCHOWSKY, R. Investimento e reformas no Brasil: indústria e infraestrutura nos anos 1990. Brasília: IPEA/Cepal, 2002.
BLANCHARD, Olivier e Giavazzi, Francesco. Im-proving the SGP Through a Proper Accounting of Public investment. CEPR Discussion Paper no 4220. 2004.
Disponível em: http://economics.mit.edu/fi-les/735
CALDERÓN, César e Luis Servén. The Effects of Infrastructure Development
on Growth and Income Distribution. Policy Research Working Papers. Banco Mundial. 2004
Disponível em: http://elibrary.worldbank.org/doi/pdf/10.1596/1813-9450-3400
CALDERÓN, César e Luis Servén. Infrastruc-ture in Latin America. Policy Research Working Paper 5317. World Bank. 2010.
Disponível em: http://elibrary.worldbank.org/doi/pdf/10.1596/1813-9450-5317
CALDERÓN, César; William Easterly e Luis Ser-vén: “Latin America´s Infrastructure in the Era of Macroeconomic Crises”. in Easterly, William and Luis Servén (Eds):The limits of stabilization : in-frastructure, public deficits and growth in La-tin America. Palo Alto, Calif.; Stanford University Press; Washington, D.C. : World Bank, 2003. 209p.
Disponível em:
h t t p : / / s i t e r e s o u r c e s . w o r l d b a n k .o r g / B R A Z I L I N P O R E X T N / R e s o u r -c e s / 3 8 1 7 1 6 6 - 1 1 8 5 8 9 5 6 4 5 3 0 4 /4044168-1186325351029/18Full.pdf
CENTRO DE ESTUDOS DO IBMEC. Relatório Trimestral de Financiamento dos Investimen-tos. Outubro, 2013.
Disponível em:
http://www.cemec.ibmec.org.br/download/Relat%c3%b3rio%20CEMEC%20Trimestral%20de%20Financiamento%20de%20Investimen-tos%20na%20Economia%20Brasileira%20-%20setembro%202013.pdf
CLARIDA, Richard; Jordi Gali and Mark Gertler. The Science of Monetary Policy: A New Keynesian
76
Perspective. Journal of Economic Literature, n.37, p. 1661-1707, 1999.
Disponível em: http://www.nyu.edu/econ/user/gertlerm/science.pdf
CONFEDERAÇÃO NACIONAL DO TRANSPOR-TE. Pesquisa CNT de rodovias 2009: relatório gerencial. – Brasília : CNT : SEST : SENAT, 2009.
Disponível em:
http://pesquisarodovias.cnt.org.br/Down-loads/Edicoes//2009/Relat%C3%B3rio%20Geren-cial/Relat%C3%B3rio%20Gerencial%202009.pdf
CONFEDERAÇÃO NACIONAL DO TRANSPOR-TE. Pesquisa CNT de rodovias 2014: relatório gerencial. – Brasília:CNT : SEST : SENAT, 2014.
Disponível em: http://pesquisarodovias.cnt.org.br/Paginas/relGeral.aspx
DONAUBAUER, Julina, Birgit Meyer e Peter Nunnenkamp. A New Global Indexo of Infras-tructure: Construction, Rankings and Applica-tions. Kiel Working Paper no. 1929. Kiel, Germany. June 2014.
Disponível em: https://www.ifw-members.ifw-kiel.de/publications/a-new-global-index-of--infrastructure-construction-rankings-and-appli-cations
EASTERLY, William e Servén, Luis: Introduction. In Easterly, William and Luis Servén (Eds):The li-mits of stabilization : infrastructure, public deficits and growth in Latin America. Palo Alto, Calif.; Stanford University Press; Washington, D.C. : World Bank, 2003. 209p.
Disponível em:
h t t p : / / s i t e r e s o u r c e s . w o r l d b a n k .o r g / B R A Z I L I N P O R E X T N / R e s o u r -c e s / 3 8 1 7 1 6 6 - 1 1 8 5 8 9 5 6 4 5 3 0 4 /4044168-1186325351029/18Full.pdf
FERREIRA, Pedro Cavalcanti e Carlos Hamilton Araújo. Growth and Fiscal Effects of Infrastruc-ture Investments in Brazil. Fundação Getúlio Vargas, Rio de Janeiro. 2005.
Disponível em: http://www.fgv.br/professor/ferreira/BrazilInfra4.pdf
FRISCHTAK, Claúdio. O investimento em infra-estrutura no Brasil: histórico recente e perspectivas. Pesquisa e Planejamento Econômi-co, v. 38, nº 2. agosto 2008.
Disponível em: http://ppe.ipea.gov.br/index.php/ppe/article/viewFile/1129/1033
FRISCHTAK, Cláudio R. e Katharina Davies. De-satando o nó da Infraestrutura no Brasil: uma agenda de reformas. Fórum Nacional (Sessão Especial) Visões do Desenvolvimento Brasileiro e Nova Revolução Industrial – a maior desde 1790. Rio de Janeiro, 2014.
77
Disponível em: http://www.forumnacional.org.br/pub/ep/EP0571.pdf
FUNDAÇÃO GETÚLIO VARGAS. Benefícios econômicos da expansão do saneamento bra-sileiro. Instituto Trata Brasil, junho de 2010.
Disponível em: http://www.tratabrasil.org.br/novo_site/cms/files/trata_fgv.pdf
FUNDO MONETÁRIO INTERNACIONAL. Public Investment and Fiscal Policy, Fiscal Affairs Depart-ment and Policy Development and Review De-partment, Washington. 2004. 52p.
Disponível em: https://www.imf.org/external/np/fad/2004/pifp/eng/PIFP.pdf
FUNDO MONETÁRIO INTERNACIONAL. Keeping an Eye on Housing Markets in Latin America. Regional Economic Outlook. Analytical Notes. Spring. 2012.
Disponível em:
https://www.imf.org/external/pubs/ft/reo/2012/whd/eng/pdf/wreo013013.pdf
FUNDO MONETÁRIO INTERNACIONAL. World economic outlook : a survey by the staff of the International Monetary Fund. Washington, DC : International Monetary Fund. 2014.
Disponível em: http://www.imf.org/external/pubs/ft/weo/2014/02/
FURMAN, Jason. The Role of Housing in the Economic Recovery and the Path Forward. Real Estate Roundtable. Mimeo. April 29, 2014.
Disponível em:
https://www.whitehouse.gov/sites/default/f i les/docs/real_estate_roundtable_remar-ks_2014.04.29_jf_0.pdf
MODY, Ashoka e Michael Walton. Building on Esta Asia’s Infrastructure Foundations. Finance & Developmento. Volume 35 (2). June 1998.
Disponível em: http://www.imf.org/external/pubs/ft/fandd/1998/06/mody.htm
PUGA, Fernando Pimentel;Gilberto Rodrigues Borça Junior e Marcelo Machado Nascimento. Alta da produtividade do investimento viabi-liza maior crescimento do PIB. Visão do Desen-volvimento nº 73, BNDES, Rio de Janeiro, 30 nov 2009.
Disponível em:
http://www.bndes.gov.br/SiteBNDES/export/sites/default/bndes_pt/Galerias/Arquivos/conhe-cimento/visao/visao_73.pdf
ROSSI-HANSBERG, Esteban; Pierre-Daniel Sar-te and Raymond Owens III. Housing Externalities. Journal of Political Economy. University of Chica-go. USA. vol. 118, no. 3. 2010.
Disponível em: http://www.princeton.edu/~e-rossi/NiB.pdf
VELLOSO, Raul; César Mattos; Marcos Mendes e Paulo Springer de Freitas. Infraestrutura: os
78
caminhos para sair do buraco. Rio de Janeiro, INAE. 2012. 136p.
Disponível em: http://www.raulvelloso.com.br/infraestrutura-os-caminhos-para-sair-do-bura-co/
VELLOSO, Raul; Paulo Springer de Freitas; Mar-celo Caetano e José Oswaldo Cândido Júnior. Na crise, Estado e Ajuste Fiscal Permanente XXV Fórum Nacional (Jubileu de Prata – 1988/2013) O Brasil de Amanhã. Transformar Crise em Oportuni-dade. Rio de Janeiro, 13-16 de maio de 2013.
Disponível em: http://www.forumnacional.org.br/pub/ep/EP0475.pdf
VELLOSO, Raul; Paulo Springer de Freitas e Omar Abbud. Energia Elétrica a Caminho do Es-trangulamento. Rio de Janeiro. Fórum Nacional. 2014. 256 p.
Disponível em: http://www.raulvelloso.com.br/energia-eletrica-a-caminho-do-estrangula-mento/
WORLD ECONOMIC FORUM. The Global Competitiveness Report 2014-2015: Full Data Edition.World Economic Forum, Geneve, Switzer-land. 2014.
Disponível em:
http://www3.weforum.org/docs/WEF_Global-CompetitivenessReport_2014-15.pdf
79


investimento em
infraestrutura e recuperação da economia
investimento eminfraestruturae recuperação da economia
www.cbic.org.br
realização
www.senai.br
apoio


