BARRICK GOLD CORPORATION Investor Day – September 7, 2011 Building Value in Everything We Do Investor Day - September 7, 2011 1 Agenda Market and Company Overview – Aaron Regent Fi ilS & Ri k M t Financial Summary & Risk Management – Jamie Sokalsky Exploration Update – Rob Krcmarov Operating Framework – Peter Kinver 2 Regional Overviews – Greg Lang, Igor Gonzales, Gary Halverson, Greg Hawkins Closing Remarks – Aaron Regent
Transcript
BARRICK GOLD CORPORATIONInvestor Day – September 7, 2011
Building Value in Everything We DoInvestor Day - September 7, 2011
1
Agenda
Market and Company Overview– Aaron Regent
Fi i l S & Ri k M tFinancial Summary & Risk Management– Jamie Sokalsky
Exploration Update– Rob Krcmarov
Operating Framework– Peter Kinver
2
Regional Overviews– Greg Lang, Igor Gonzales, Gary Halverson, Greg Hawkins
Closing Remarks– Aaron Regent
BARRICK GOLD CORPORATIONInvestor Day – September 7, 2011
Certain information contained in this presentation, including any information as to our strategy, projects, plans or future financial or operating performance and other statements that express management's expectations or estimates of future performance, constitute"forward-looking statements”. All statements, other than statements of historical fact, are forward-looking statements. The words “believe”, "expect", "will", “anticipate”, “contemplate”, “target”, “plan”, “continue”, “budget”, “may”, “intend”, “estimate” and similar expressions identify forward-looking statements. Forward-looking statements are necessarily based upon a number of estimates andassumptions that, while considered reasonable by management, are inherently subject to significant business, economic and competitive uncertainties and contingencies The Company cautions the reader that such forward-looking statements involve known and unknown
CAUTIONARY STATEMENT ON FORWARD‐LOOKING INFORMATION
uncertainties and contingencies. The Company cautions the reader that such forward looking statements involve known and unknown risks, uncertainties and other factors that may cause the actual financial results, performance or achievements of Barrick to be materially different from the Company's estimated future results, performance or achievements expressed or implied by those forward-lookingstatements and the forward-looking statements are not guarantees of future performance. These risks, uncertainties and other factors include, but are not limited to: the impact of global liquidity and credit availability on the timing of cash flows and the values of assets and liabilities based on projected future cash flows; changes in the worldwide price of gold, copper or certain other commodities (such as silver, fuel and electricity); fluctuations in currency markets; the ability of the Company to complete or successfully integrate an announced acquisition proposal; legislative, political or economic developments in the jurisdictions in which the Company carries on business, including Zambia and Saudi Arabia; operating or technical difficulties in connection with mining or development activities; employee relations; availability and costs associated with mining inputs and labor; the speculative nature of exploration and development, including the risks of obtaining necessary licenses and permits and diminishing quantities or grades of reserves; changes in costs and estimates associated with our projects; adverse changes in our credit rating, level of indebtedness and liquidity, contests over title to properties, particularly title to undeveloped properties; the organization of our previously held African gold operations under a separate listed entity; the risks involved in the exploration, development and mining business. Certain of these factors are discussed in greater detail in the C ’ t t F 40 F/A l I f ti F fil ith th U S S iti d E h C i i d C di
3
Company’s most recent Form 40-F/Annual Information Form on file with the U.S. Securities and Exchange Commission and Canadian provincial securities regulatory authorities.
The Company disclaims any intention or obligation to update or revise any forward-looking statements whether as a result of new information, future events or otherwise, except as required by applicable law.
Key Themes
Market outlook is positive – short and long term dynamics areprice supportive
Increasing industry challenges favor large well capitalizedIncreasing industry challenges favor large, well capitalized,global organizations
ABX well positioned as a large global producer with deep operating, technical and resource development capabilities
Strategic focus on value creation by leveraging our competitive strengths to develop gold and gold/copper resources
Exploration has been a key value driver in securing resources and
4
Exploration has been a key value driver in securing resources andhas resulted from a consistent commitment and well developed strategic focus
Significant development optionality within existing asset base
Delivering strong financial results
Compelling valuation
BARRICK GOLD CORPORATIONInvestor Day – September 7, 2011
Industry Profitability vs Share Price
Gold equity returns have not reflected i d
300%
350% +353%Senior Op. Cash Flow(1)
increased profitability from expanding margins
100%
150%
200%
250%
+224% Gold
5
0%
50%
2004 2005 2006 2007 2008 2009 2010
+80%Senior ShareReturns(2)
(1) Combined cash flow for ABX, NEM, AU, GG & KGC; 2007 adjusted operating cash flow for NEM, 2008 adjusted operating cash flow for AU & KGC,2009 - 2010 adjusted operating cash flow for ABX, AU & KGC
Consensus Estimates (CE) vs Actual PricesForward Curve
Forward Spot ~$1,950
Current ~$1,885
actual prices
Equities shouldrespond as price forecasts recalibrate
1,200
1,400
1,600
,
~$1,200Actual Avg. ~$1,227
Actual YTD Avg. ~$1,493
2010CE
2011CE
6
800
1,000 ~$1,000
~$850~$770
2008 2009 2010 2011 2012 2013 2014 Long Term
Actual Avg. ~$974
Long TermConsensusEstimates
2008CE
2009CE
600
Sources: Analyst estimates and Bloomberg
BARRICK GOLD CORPORATIONInvestor Day – September 7, 2011
Are Current Prices Sustainable?
Global demand for resources will continue to intensify with the growth in emerging markets
current GDP growth rates of 8 9% versus mature economies– current GDP growth rates of 8-9% versus mature economies growth rate of 2-3%(1)
– by 2050, emerging markets expected to increase five fold, be larger than the developed world and represent 19 of the 30 top economies by GDP(2)
– in a commodity intensive phase of development
Increased wealth and wealth protection objectives
7
Increased wealth and wealth protection objectives plus Central Bank diversification will drive gold demand
Industrialization and urbanization will drive copper demand
(1) Source: The Economist (2) Source: HSBC
-10 -5 0 5 10 15 20 25 30 35
Argentina*India*
China
Real GDP per person
Q4 2007 to Q2 2011 (% change)
Mexico*Belgium*
SwedenSwitzerland*
South Africa*GermanyAustralia*Russia
Turkey*South Korea
Brazil*Taiwan
Poland*Indonesia
Argentina
8
Ireland*Greece*
ItalyBritainJapanSpain
United StatesPortugal
FranceNetherlands
Canada*Mexico
Sources: Economist Intelligence Unit; Haver Analytics; IMF; JPMorgan; The Economist * Q2 2011 estimate
BARRICK GOLD CORPORATIONInvestor Day – September 7, 2011
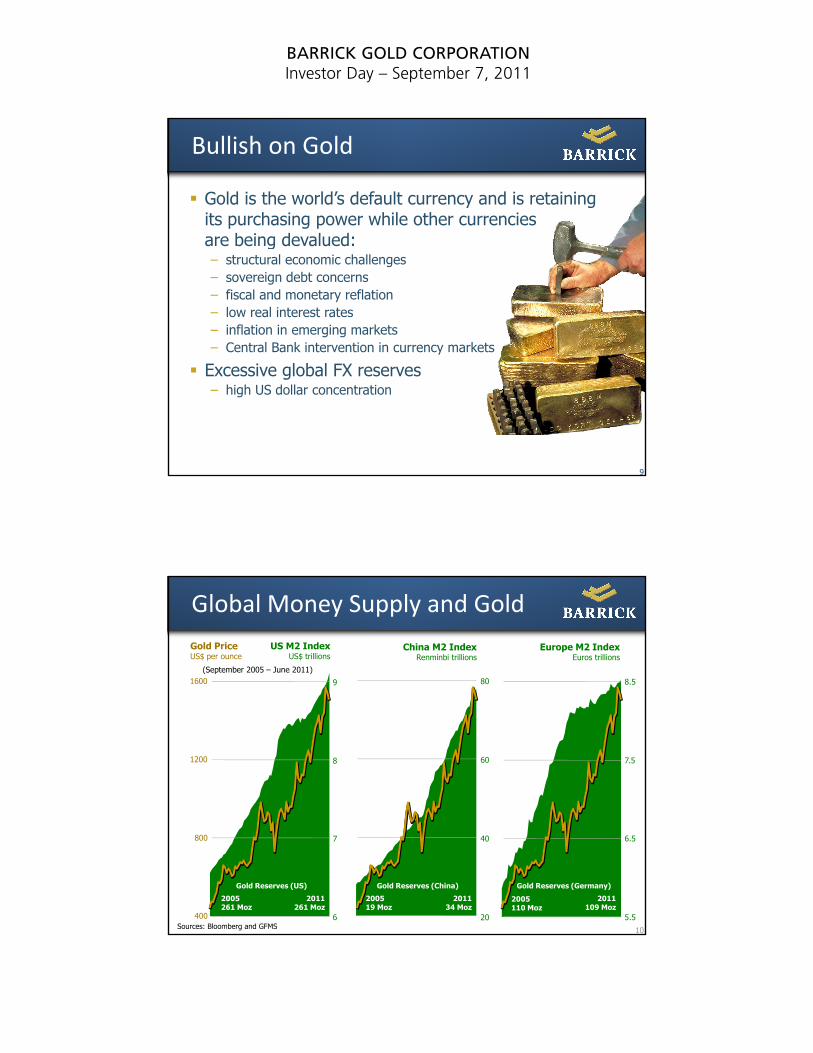
Bullish on Gold
Gold is the world’s default currency and is retainingits purchasing power while other currenciesare being devalued:are being devalued:– structural economic challenges– sovereign debt concerns– fiscal and monetary reflation– low real interest rates– inflation in emerging markets– Central Bank intervention in currency markets
9
Excessive global FX reserves – high US dollar concentration
9
Global Money Supply and Gold
8.59 801600
US M2 IndexUS$ trillions
China M2 IndexRenminbi trillions
Europe M2 IndexEuros trillions
Gold PriceUS$ per ounce
(September 2005 – June 2011)
7.58 601200
10
5.5
6.57 40
Sources: Bloomberg and GFMS400
800
6 20
2005261 Moz
2011261 Moz
Gold Reserves (US)
200519 Moz
201134 Moz
Gold Reserves (China)
2005110 Moz
2011109 Moz
Gold Reserves (Germany)
BARRICK GOLD CORPORATIONInvestor Day – September 7, 2011
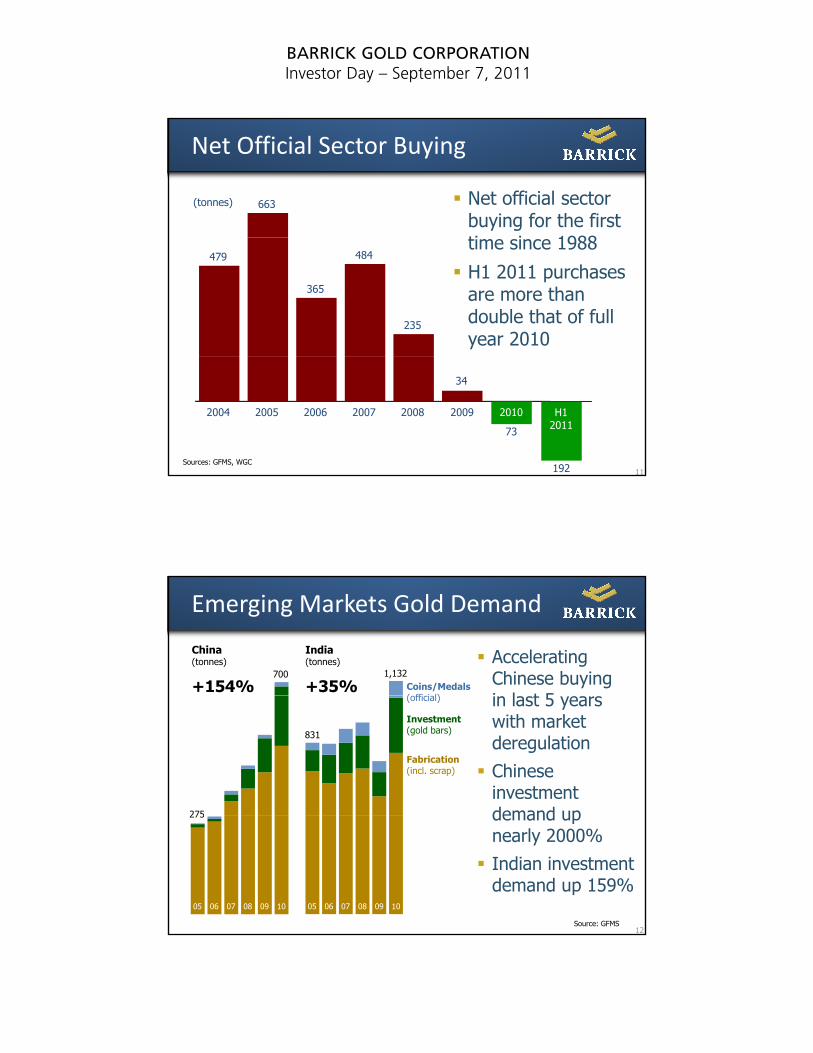
Net Official Sector Buying
Net official sector buying for the first ti i 1988
663(tonnes)
time since 1988
H1 2011 purchases are more than double that of full year 2010
479
365
484
235
11Sources: GFMS, WGC
2004 2005 2006 2007 2008
34
2009
73
2010
192
H12011
700
Emerging Markets Gold Demand
Accelerating Chinese buyingi l t 5
1,132Coins/Medals( ffi i l)
India(tonnes)
+35%
China(tonnes)
+154%
275
in last 5 years with market deregulation
Chinese investment demand up
831
Fabrication(incl. scrap)
Investment(gold bars)
(official)
12
05 06 07 08 09 10
275 demand upnearly 2000%
Indian investment demand up 159%
05 06 07 08 09 10
Source: GFMS
BARRICK GOLD CORPORATIONInvestor Day – September 7, 2011
Mine Supply vs Gold Price
Since 2001, gold is up ~350% but mine supply has only110 $1,200
Gold PriceUS$/oz
Mine SupplyMoz
supply has only increased by 2%
Supply has not kept pace with the rising gold price
80
90
100
$600
$800
$1,000
$ ,
13
50
60
70
01 02 03 04 05 06 07 08 09 10$0
$200
$400
Sources: GFMS, Bloomberg
Resources are Scarce
150 6Number of Discoveries and type Primary Gold Copper-Gold (three year average)
15
Discoveries are declining and becoming more expensive to find
BARRICK GOLD CORPORATIONInvestor Day – September 7, 2011
Positive Copper Outlook
Demand being supported by the urbanization of emerging markets such as China and India– China will have more than 220 +1 million plus population cities– China will have more than 220 +1 million plus population cities
by 2025 compared to Europe with 35 today– China’s economy expected to be the largest and India’s in the
top 3 by 2050(1)
~13 million tonne shortfall in mine production expected by 2035, or approximately 8 Escondidas(2)
Copper supply will continue to be constrained
15
Copper supply will continue to be constrained– aging mines and lower grades, operational disruptions,
development challenges– bulk of new potential production expected to come from
emerging markets which have complex and challenging environments, a lack of infrastructure and sovereign risk issues
(1) Source: HSBC (2) Source: CRU; based on current production levels
Environmental/Climate Change regulation and impacts– growing complexity, legislation by country, increased costs
Competition for access to new resources– new ‘strategic’ and commercial acquirers
BARRICK GOLD CORPORATIONInvestor Day – September 7, 2011
Summary
Structural change in demand
Industry challenged to mount a sufficient supply y g pp yresponse– running at full capacity– project delays– dearth of new discoveries– next generation of mines in complex locations
P i h ld b ll t d
17
Prices should be well supported
Emerging risks best mitigated by large, well capitalized companies with global capabilities
NorthAmerica
Global Footprint
2010 P&P Reserves(1)
North America
Af i
2011E Production
Africa 7%
S thAustraliaPacific
North America44%
41%
SouthAmerica
39%
AustraliaPacific11%
Africa 9%
18
AustraliaPacific
SouthAmerica
Africa
ProjectMine
SouthAmerica
24%
Pacific25%
See final slide #3
BARRICK GOLD CORPORATIONInvestor Day – September 7, 2011
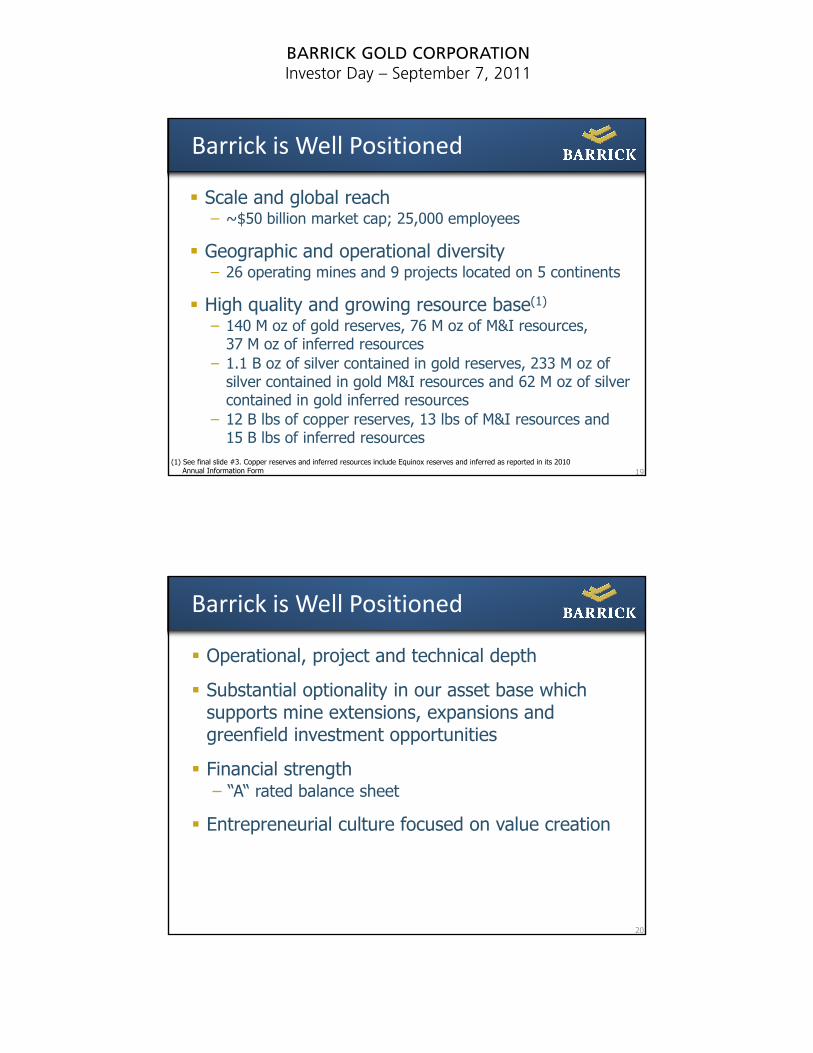
Barrick is Well Positioned
Scale and global reach– ~$50 billion market cap; 25,000 employees
Geographic and operational diversity– 26 operating mines and 9 projects located on 5 continents
High quality and growing resource base(1)
– 140 M oz of gold reserves, 76 M oz of M&I resources,37 M oz of inferred resources
19
– 1.1 B oz of silver contained in gold reserves, 233 M oz of silver contained in gold M&I resources and 62 M oz of silver contained in gold inferred resources
– 12 B lbs of copper reserves, 13 lbs of M&I resources and 15 B lbs of inferred resources
(1) See final slide #3. Copper reserves and inferred resources include Equinox reserves and inferred as reported in its 2010Annual Information Form
Barrick is Well Positioned
Operational, project and technical depth
Substantial optionality in our asset base whichSubstantial optionality in our asset base which supports mine extensions, expansions and greenfield investment opportunities
Financial strength– “A“ rated balance sheet
20
Entrepreneurial culture focused on value creation
BARRICK GOLD CORPORATIONInvestor Day – September 7, 2011
Strategy
Leverage our competitive strengths to grow and improve the quality of our production base by:– maximizing the potential of our existing operations and land positionsg p g p p– developing our project pipeline– securing new deposits through exploration and acquisitions
– focus is on gold and gold/copper deposits
Production profile and cash flows will continue to be dominated by gold and will be complemented with increased copper productionfrom expansions at existing mines and projects
B ti thi t t t t
21
By executing on this strategy, we expect to:– grow earnings and cash flow per share– generate appropriate risk-adjusted returns on capital– enhance shareholders’ leverage to metal prices
With earnings and cash flow growth we expect to pay a progressive dividend
Barrick’s Strategy ‐ Objectives
Focus on adding value…Meet operational and financial targets to maximize b fit f i i t l ibenefits of rising metal prices Increase gold and copper reserves through exploration and selective acquisitions
Maximize the value of existing mines and properties, leveraging technical skills and regional infrastructure
Invest in and develop high return projects
22
Invest in and develop high return projects
Continually improve CSR practices to maintain license to operate
…to increase NAV, production, reserves, earnings and cash flow all on a per share basis
BARRICK GOLD CORPORATIONInvestor Day – September 7, 2011
Barrick EPS & CFPS vs GoldReturns (US$)
Leverage to Gold
Barrick’s adjusted net earnings and 800%
cash flow(1) growth has significantly outpaced the rise in gold prices over the past 7 years400%
500%
600%
700%
( = adjusted)
23
(1) See final slide #1. All EPS figures are adjusted except Dec ‘04 is US GAAP basis and all CFPS are on a US GAAP basis except Dec ’09, Dec ‘10 and June ‘11 are adjusted. H1 2011 adjusted EPS and CFPS return is annualized. Gold price as at June 30, 2011.
BARRICK GOLD CORPORATIONInvestor Day – September 7, 2011
Barrick’s Strategy
Focus on adding value…Meet operational and financial targets to maximize b fit f i i t l ibenefits of rising metal prices
Increase gold and copper reserves through exploration and selective acquisitions Maximize the value of existing mines and properties, leveraging technical skills and regional infrastructure
Invest in and develop high return projects
25
Invest in and develop high return projects
Continually improve CSR practices to maintain license to operate
…to increase NAV, production, reserves, earnings and cash flow all on a per share basis
THROUGH ACQUISITION AND EXPLORATION Proven and Probable – millions of ounces of gold
History of Gold Reserve Growth
~140(1)
20
140TOTAL
EXPLORA-TION
21
26(1) See final slide #3
1990 2010109TOTALMINED
110TOTAL
ACQUIRED
21Moz
Divestitures
BARRICK GOLD CORPORATIONInvestor Day – September 7, 2011
2011 Exploration Program(1)
$370-$390M
North AmericaAfricanBarrick
$210M
38%
13%
11%
~80%
27
AustraliaPacific
South America
(1) See final slide #5
20112010
38%
Operation Development Project
2011 exploration budget increased to $370-$390 M; ~40% to be capitalized
Exploration & Acquisition Results
Two potential world-class gold discoveries in Nevada
ld h– Goldrush– Red Hill– Excellent land positions and deep exploration pipeline
Two quality copper assets added through Equinox acquisition
28
– Lumwana – long life, producing asset with substantial exploration and expansion potential inan excellent region
– Jabal Sayid – will provide additional cash flow in 2012 and is located in a promising region
BARRICK GOLD CORPORATIONInvestor Day – September 7, 2011
History of Reserve/Resource Growth
40
50
Reserve/resource ounces added post acquisition or discoveryounces millions
20
30
40
ACQUIRED ADDED GRASSROOTS
29
0
10
Reserves and Resources(1)
76 3
37.2Inferred
61 6 Inferred
Silver Contained in Gold Reserves and ResourcesMoz
GoldMoz
Copper Lbs billions
Contained ingold resources
Contained in1.21.6
17.612.4
139.8P&P
76.3M&I
932.6
1,066.3P&P47.0
232.9M&I
61.6 Inferred Contained ingold reserves
13.0 M&I
14.6Inferred
1 2
5.7
0.2
30
88.6
05 10 05 10
(1) See final slide #3
6.0
12.2 P&P6.6
5.01.2
06 10*
* 2010 includes Equinox reserves and resources as stated in its2010 Annual Information Form. See final slide #10 and #11
BARRICK GOLD CORPORATIONInvestor Day – September 7, 2011
Barrick’s Strategy
Focus on adding value…Meet operational and financial targets to maximize b fit f i i t l ibenefits of rising metal prices
Increase gold and copper reserves through exploration and selective acquisitions
Maximize the value of existing mines and properties, leveraging technical skills and regional infrastructure
Invest in and develop high return projects
31
Invest in and develop high return projectsContinually improve CSR practices to maintain license to operate
…to increase NAV, production, reserves, earnings and cash flow all on a per share basis
World Class Operations and Projects
Total Global Gold Mines by SizeBarrick Mines by Size (2010 gold production)
5 mines >1 Moz
23 mines >500 Koz
9 mines >800 Koz
4
3GoldstrikeVeladero Cortez
32
159 mines >100 Koz 5
17 2 Projects ~800 KozTurquoise Ridge(1)
Pascua-Lama
3 Projects ~1 MozPueblo ViejoCerro CasaleDonlin Creek
Sources: Metals Economics Group and Barrick(1) See final slide #12
BARRICK GOLD CORPORATIONInvestor Day – September 7, 2011
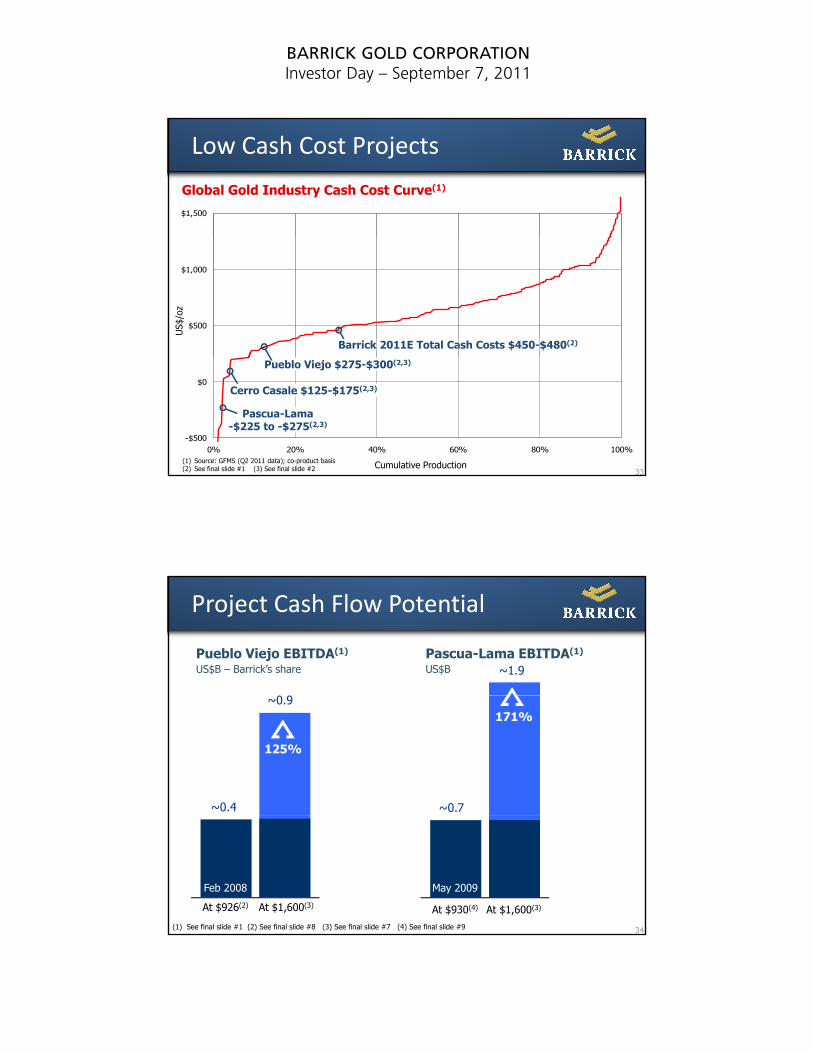
$1,500
Low Cash Cost Projects
Global Gold Industry Cash Cost Curve(1)
$500
$1,000
US$
/oz
Barrick 2011E Total Cash Costs $450-$480(2)
33
-$500
$0
0% 20% 40% 60% 80% 100%
Cumulative Production(1) Source: GFMS (Q2 2011 data); co-product basis(2) See final slide #1 (3) See final slide #2
Pueblo Viejo $275-$300(2,3)
Pascua-Lama-$225 to -$275(2,3)
Cerro Casale $125-$175(2,3)
~1.9Pascua-Lama EBITDA(1)
US$B
Project Cash Flow Potential
Pueblo Viejo EBITDA(1)
US$B – Barrick’s share
171%
~0.7
~0.9
~0.4
125%
34(1) See final slide #1 (2) See final slide #8 (3) See final slide #7 (4) See final slide #9
At $930(4) At $1,600(3)At $926(2) At $1,600(3)
May 2009Feb 2008
BARRICK GOLD CORPORATIONInvestor Day – September 7, 2011
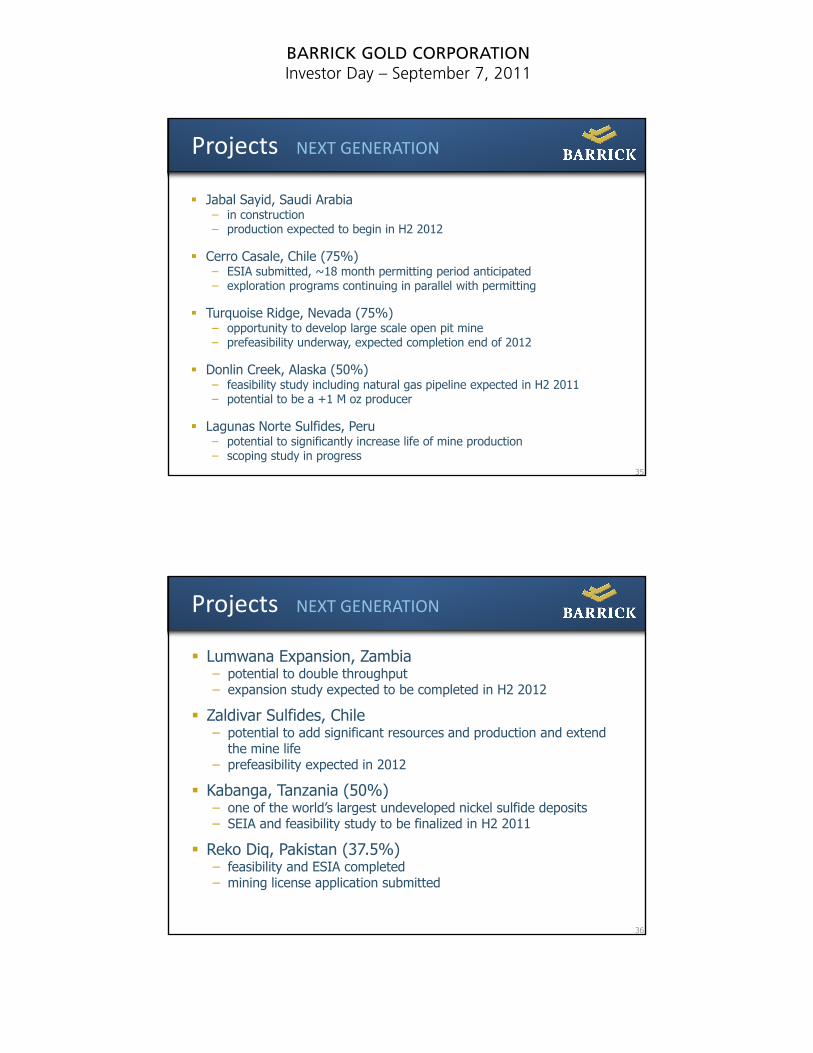
Projects NEXT GENERATION
Jabal Sayid, Saudi Arabia– in construction– production expected to begin in H2 2012
Cerro Casale, Chile (75%)– ESIA submitted, ~18 month permitting period anticipated– exploration programs continuing in parallel with permitting
Turquoise Ridge, Nevada (75%)– opportunity to develop large scale open pit mine– prefeasibility underway, expected completion end of 2012
35
Donlin Creek, Alaska (50%)– feasibility study including natural gas pipeline expected in H2 2011– potential to be a +1 M oz producer
Lagunas Norte Sulfides, Peru– potential to significantly increase life of mine production – scoping study in progress
Projects NEXT GENERATION
Lumwana Expansion, Zambia– potential to double throughput– expansion study expected to be completed in H2 2012p y p p
Zaldivar Sulfides, Chile– potential to add significant resources and production and extend
the mine life– prefeasibility expected in 2012
Kabanga, Tanzania (50%) – one of the world’s largest undeveloped nickel sulfide deposits
36
– SEIA and feasibility study to be finalized in H2 2011
Reko Diq, Pakistan (37.5%)– feasibility and ESIA completed– mining license application submitted
BARRICK GOLD CORPORATIONInvestor Day – September 7, 2011
Excellent Growth Potential
Gold Production(Moz) ~9.0
Pascua-Lama
(Mlbs)
Copper Production
~1,000(Moz)
Silver Production
~50
7.8
-Lama
PuebloViejoNet
Depletion323
Lumwana(2)
641
Lumwana
ZaldivarSulphides
LumwanaExpansion
Jabal Sayid
37
2010
(1) See final slide #4 (2) As reported in Equinox 2010 Annual Information Form (3) Excluding Osborne production
Target within5 years(1)
6.0
318Zaldivar
2010(3) Target within6-7 years(1)
Zaldivar
2010 Target within5 years(1)
6
Barrick’s Strategy
Focus on adding value…Meet operational and financial targets to maximize b fit f i i t l ibenefits of rising metal prices
Increase gold and copper reserves through exploration and selective acquisitions
Maximize the value of existing mines and properties, leveraging technical skills and regional infrastructure
Invest in and develop high return projects
38
Invest in and develop high return projects
Continually improve CSR practices to maintain license to operate
…to increase NAV, production, reserves, earnings and cash flow all on a per share basis
BARRICK GOLD CORPORATIONInvestor Day – September 7, 2011
Corporate Social Responsibility
Strengthening CSR
First Canadian mining company to join theFirst Canadian mining company to join the Voluntary Principles on Security & Human Rights
Implementing new Community Relations Management System
CSR Advisory Board in development
39
New independent director with relevant expertise
Investment Case for Barrick
Excellent price supportive fundamentals for gold, silver and copper
A major beneficiary of rising metal prices with the industry’s largest gold production and stable operating costs
Reflected in expanding margins, record earnings, d hi h t it
40
and high returns on equity
A growing production base with the development and acquisition of high quality deposits
BARRICK GOLD CORPORATIONInvestor Day – September 7, 2011
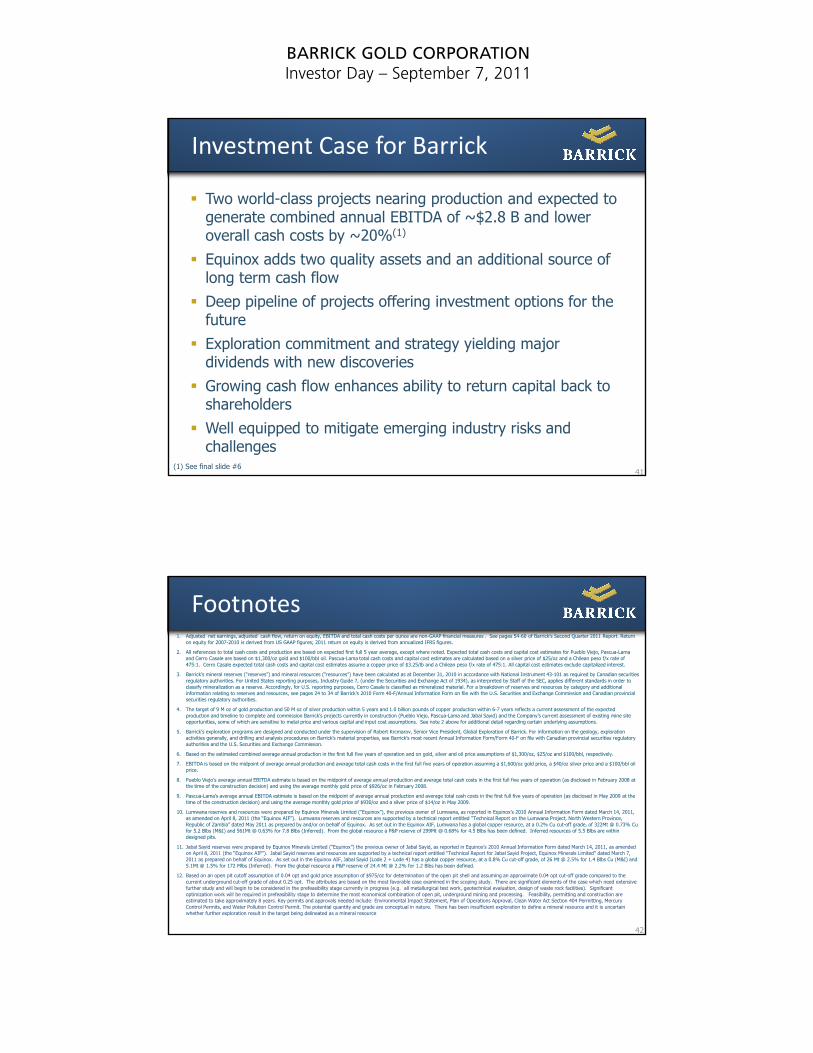
Investment Case for Barrick
Two world-class projects nearing production and expected to generate combined annual EBITDA of ~$2.8 B and lower overall cash costs by ~20%(1)overall cash costs by ~20%( )
Equinox adds two quality assets and an additional source of long term cash flow
Deep pipeline of projects offering investment options for the future
Exploration commitment and strategy yielding major di id d ith di i
41
dividends with new discoveries
Growing cash flow enhances ability to return capital back to shareholders
Well equipped to mitigate emerging industry risks and challenges
(1) See final slide #6
Footnotes1. Adjusted net earnings, adjusted cash flow, return on equity, EBITDA and total cash costs per ounce are non-GAAP financial measures . See pages 54-60 of Barrick’s Second Quarter 2011 Report. Return
on equity for 2007-2010 is derived from US GAAP figures; 2011 return on equity is derived from annualized IFRS figures.
2. All references to total cash costs and production are based on expected first full 5 year average, except where noted. Expected total cash costs and capital cost estimates for Pueblo Viejo, Pascua-Lama and Cerro Casale are based on $1,300/oz gold and $100/bbl oil. Pascua-Lama total cash costs and capital cost estimates are calculated based on a silver price of $25/oz and a Chilean peso f/x rate of 475:1. Cerro Casale expected total cash costs and capital cost estimates assume a copper price of $3.25/lb and a Chilean peso f/x rate of 475:1. All capital cost estimates exclude capitalized interest.
3. Barrick’s mineral reserves (“reserves”) and mineral resources (“resources”) have been calculated as at December 31, 2010 in accordance with National Instrument 43-101 as required by Canadian securities regulatory authorities. For United States reporting purposes, Industry Guide 7, (under the Securities and Exchange Act of 1934), as interpreted by Staff of the SEC, applies different standards in order to classify mineralization as a reserve. Accordingly, for U.S. reporting purposes, Cerro Casale is classified as mineralized material. For a breakdown of reserves and resources by category and additional information relating to reserves and resources, see pages 24 to 34 of Barrick’s 2010 Form 40-F/Annual Information Form on file with the U.S. Securities and Exchange Commission and Canadian provincial g , p g / g psecurities regulatory authorities.
4. The target of 9 M oz of gold production and 50 M oz of silver production within 5 years and 1.0 billion pounds of copper production within 6-7 years reflects a current assessment of the expected production and timeline to complete and commission Barrick’s projects currently in construction (Pueblo Viejo, Pascua-Lama and Jabal Sayid) and the Company’s current assessment of existing mine site opportunities, some of which are sensitive to metal price and various capital and input cost assumptions. See note 2 above for additional detail regarding certain underlying assumptions.
5. Barrick’s exploration programs are designed and conducted under the supervision of Robert Krcmarov, Senior Vice President, Global Exploration of Barrick. For information on the geology, exploration activities generally, and drilling and analysis procedures on Barrick’s material properties, see Barrick’s most recent Annual Information Form/Form 40-F on file with Canadian provincial securities regulatory authorities and the U.S. Securities and Exchange Commission.
6. Based on the estimated combined average annual production in the first full five years of operation and on gold, silver and oil price assumptions of $1,300/oz, $25/oz and $100/bbl, respectively.
7. EBITDA is based on the midpoint of average annual production and average total cash costs in the first full five years of operation assuming a $1,600/oz gold price, a $40/oz silver price and a $100/bbl oil price.
8. Pueblo Viejo’s average annual EBITDA estimate is based on the midpoint of average annual production and average total cash costs in the first full five years of operation (as disclosed in February 2008 at the time of the construction decision) and using the average monthly gold price of $926/oz in February 2008.
9. Pascua-Lama’s average annual EBITDA estimate is based on the midpoint of average annual production and average total cash costs in the first full five years of operation (as disclosed in May 2009 at the time of the construction decision) and using the average monthly gold price of $930/oz and a silver price of $14/oz in May 2009.
10. Lumwana reserves and resources were prepared by Equinox Minerals Limited (“Equinox”), the previous owner of Lumwana, as reported in Equinox’s 2010 Annual Information Form dated March 14, 2011,
42
as amended on April 8, 2011 (the “Equinox AIF”). Lumwana reserves and resources are supported by a technical report entitled “Technical Report on the Lumwana Project, North Western Province, Republic of Zambia” dated May 2011 as prepared by and/or on behalf of Equinox. As set out in the Equinox AIF, Lumwana has a global copper resource, at a 0.2% Cu cut-off grade, of 322Mt @ 0.73% Cu for 5.2 Blbs (M&I) and 561Mt @ 0.63% for 7.8 Blbs (Inferred). From the global resource a P&P reserve of 299Mt @ 0.68% for 4.5 Blbs has been defined. Inferred resources of 5.5 Blbs are within designed pits.
11. Jabal Sayid reserves were prepared by Equinox Minerals Limited (“Equinox”) the previous owner of Jabal Sayid, as reported in Equinox’s 2010 Annual Information Form dated March 14, 2011, as amended on April 8, 2011 (the “Equinox AIF”). Jabal Sayid reserves and resources are supported by a technical report entitled “Technical Report for Jabal Sayid Project, Equinox Minerals Limited” dated March 7, 2011 as prepared on behalf of Equinox. As set out in the Equinox AIF, Jabal Sayid (Lode 2 + Lode 4) has a global copper resource, at a 0.8% Cu cut-off grade, of 26 Mt @ 2.5% for 1.4 Blbs Cu (M&I) and 5.1Mt @ 1.5% for 172 Mlbs (Inferred). From the global resource a P&P reserve of 24.4 Mt @ 2.2% for 1.2 Blbs has been defined.
12. Based on an open pit cutoff assumption of 0.04 opt and gold price assumption of $975/oz for determination of the open pit shell and assuming an approximate 0.04 opt cut-off grade compared to the current underground cut-off grade of about 0.25 opt. The attributes are based on the most favorable case examined in the scoping study. There are significant elements of the case which need extensive further study and will begin to be considered in the prefeasibility stage currently in progress (e.g. all metallurgical test work, geotechnical evaluation, design of waste rock facilities). Significant optimization work will be required in prefeasibility stage to determine the most economical combination of open pit, underground mining and processing. Feasibility, permitting and construction are estimated to take approximately 8 years. Key permits and approvals needed include: Environmental Impact Statement, Plan of Operations Approval, Clean Water Act Section 404 Permitting, Mercury Control Permits, and Water Pollution Control Permit. The potential quantity and grade are conceptual in nature. There has been insufficient exploration to define a mineral resource and it is uncertain whether further exploration result in the target being delineated as a mineral resource