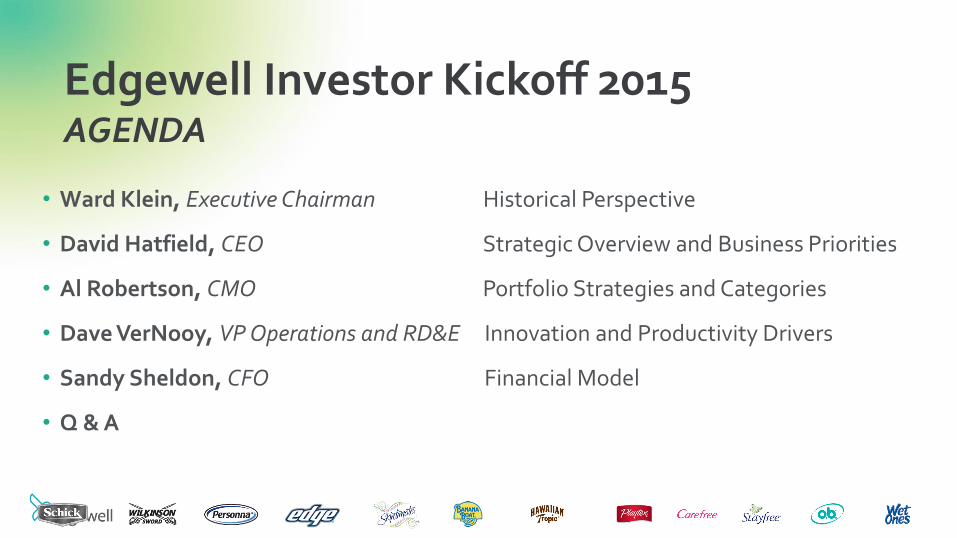
• David Hatfield, CEO Strategic Overview and Business Priorities
• Al Robertson, CMO Portfolio Strategies and Categories
• Dave VerNooy, VP Operations and RD&E Innovation and Productivity Drivers
• Sandy Sheldon, CFO Financial Model
• Q & A
Edgewell Investor Kickoff 2015 AGENDA
Presentation of Information; Forward-Looking Statements
Unless the context otherwise requires, references in this presentation to “Edgewell,” “Personal Care,” “we,” “our,” and “the Company” refer to the Personal Care business of Energizer Holdings, Inc. , a Missouri corporation, and its consolidated subsidiaries, which will become Edgewell Personal Care Company upon completion of the separation of the Household Products business of Energizer from the Personal Care business. Unless the context otherwise requires, references in this presentation to “Energizer” refer to Energizer Holdings, Inc. and its consolidated subsidiaries including both the Personal Care business and the Household Products business prior to completion of the separation. Unless the context otherwise requires, references in this presentation to the Company’s historical assets, liabilities, products, businesses or activities generally refer to the historical assets, liabilities, products, businesses or activities of the Personal Care business as it was conducted prior to the completion of the separation.
The following presentation contains forward looking statements. Forward-looking statements are not based on historical facts but instead reflect our expectations concerning future results or events, including our expectations for the separation, new product launches and strategic initiatives, including restructurings, and our outlook for future financial, operational or other potential or expected results. These statements are not guarantees of performance and are inherently subject to known and unknown risks and assumptions that are difficult to predict and could cause our actual results, performance or achievements to differ materially from those expressed in or indicated by those statements.
In addition, other risks and uncertainties not presently known to us or that we consider immaterial could affect the accuracy of any such forward-looking statements. All forward-looking statements should be evaluated with the understanding of their inherent uncertainty. Additional risks and uncertainties include those detailed from time to time in our publicly filed documents, including our annual report on Form 10-K for the year ended September 30, 2014 and the Form 10-Q for the quarter ended March 31, 2015, as well as the Registration Statement on Form 10 filed by Energizer SpinCo, Inc., the entity that will hold the Household Products business upon completion of the separation The forward-looking statements included in this presentation are only made as of the date of this document and we disclaim any obligation to publicly update any forward-looking statement to reflect subsequent events or circumstances.
Market and Industry Data Unless indicated otherwise, the information concerning our industry contained in this presentation is based on our general knowledge of and expectations concerning the industry. Our market position, market share and industry market size are based on estimates using our internal data and estimates, based on data from various industry analyses, our internal research and adjustments and assumptions that we believe to be reasonable. We have not independently verified data from industry analyses and cannot guarantee their accuracy or completeness. In addition, we believe that data regarding the industry, market size and our market position and market share within such industry provide general guidance but are inherently imprecise. Further, our estimates and assumptions involve risks and uncertainties and are subject to change based on various factors. These and other factors could cause results to differ materially from those expressed in the estimates and assumptions.
Non-GAAP Financial Measures While the Company reports financial results in accordance with accounting principles generally accepted in the U.S. (“GAAP”), this presentation includes non-GAAP measures. These non-GAAP measures, include (1) EBITDA, adjusted EBITDA and ratios derived therefrom, as well as (2) non-GAAP comparatives such as operating results, organic sales, gross margin and other comparison changes that exclude such items as the impact of changes in foreign currency rates on a period over period basis versus the U.S. dollar, separation related costs and costs associated with restructuring activities. We believe these non-GAAP measures provide a meaningful comparison to the corresponding historical or future period and assist investors in performing their analysis and provide investors with visibility into the underlying financial performance of the Company’s business.
The Company believes that these non-GAAP measures are presented in such a way as to allow investors to more clearly understand the nature and amount of the adjustments to arrive at the non-GAAP measure. Investors should consider non-GAAP measures in addition to, not as a substitute for, or superior to, the comparable GAAP measures. Further, these non-GAAP measures may differ from similarly titled measures presented by other companies. For full reconciliation of non-GAAP financial measures, visit www.energizerholdings.com About Energizer, Investor Relations, Presentations.
Presentation of Information; Forward-Looking Statements
Edgewell Investor Day 2015
Ward Klein Executive Chairman of the Board
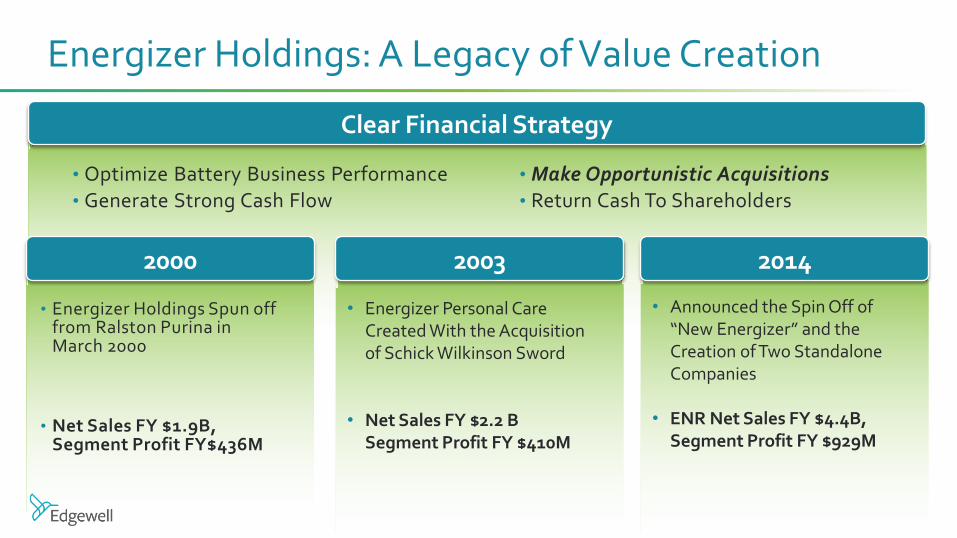
• Announced the Spin Off of “New Energizer” and the Creation of Two Standalone Companies
• ENR Net Sales FY $4.4B, Segment Profit FY $929M
• Energizer Personal Care Created With the Acquisition of Schick Wilkinson Sword
• Net Sales FY $2.2 B Segment Profit FY $410M
Energizer Holdings: A Legacy of Value Creation
2000
2003
2014
• Energizer Holdings Spun off from Ralston Purina in March 2000
• Net Sales FY $1.9B, Segment Profit FY$436M
Clear Financial Strategy
• Optimize Battery Business Performance • Generate Strong Cash Flow
• Make Opportunistic Acquisitions • Return Cash To Shareholders
0
0.5
1
1.5
2
2.5
3
3.5
4
4.5
5
2000 2003 2014
Net Sales
Energizer Edgewell
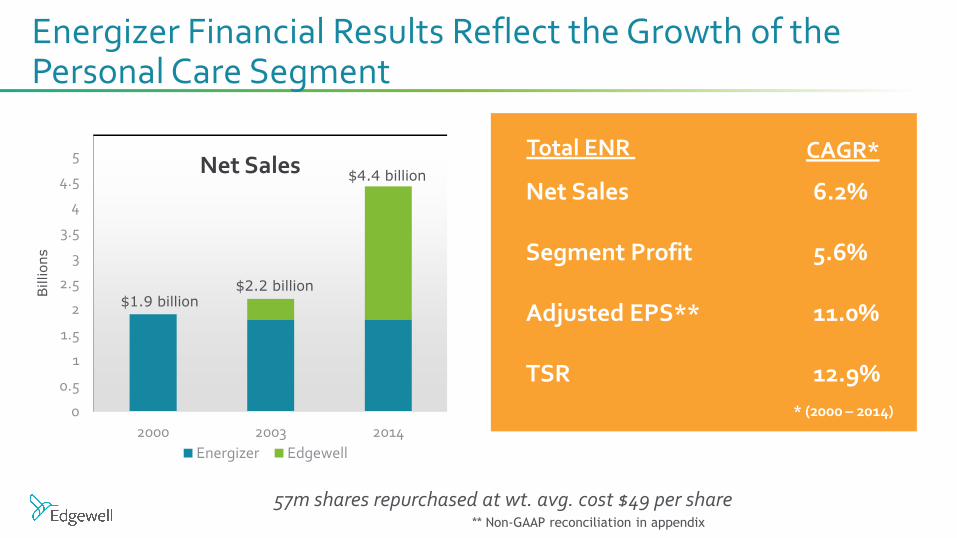
Energizer Financial Results Reflect the Growth of the Personal Care Segment
Billions
$1.9 billion
$4.4 billion
$2.2 billion
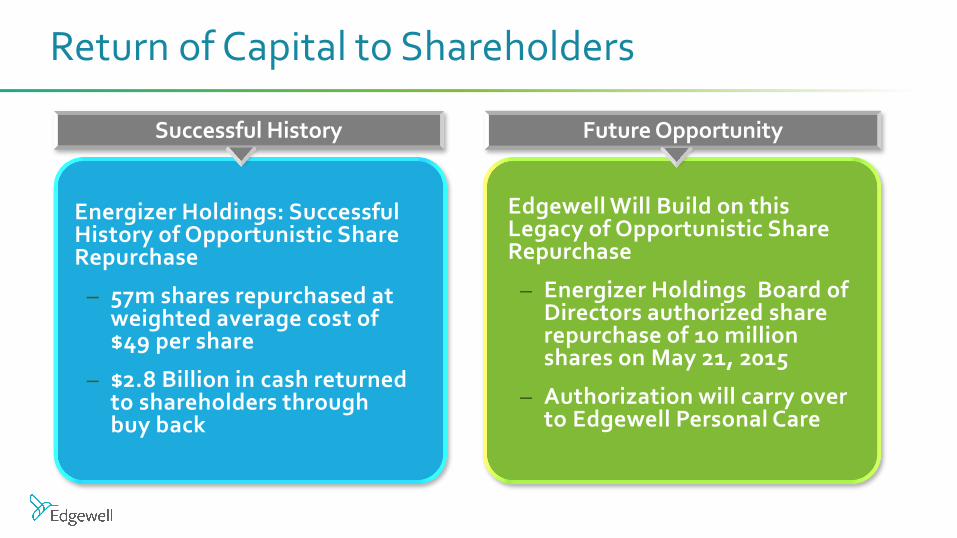
57m shares repurchased at wt. avg. cost $49 per share
Net Sales 6.2% Segment Profit 5.6% Adjusted EPS** 11.0% TSR 12.9%
CAGR* Total ENR
* (2000 – 2014)
** Non-GAAP reconciliation in appendix
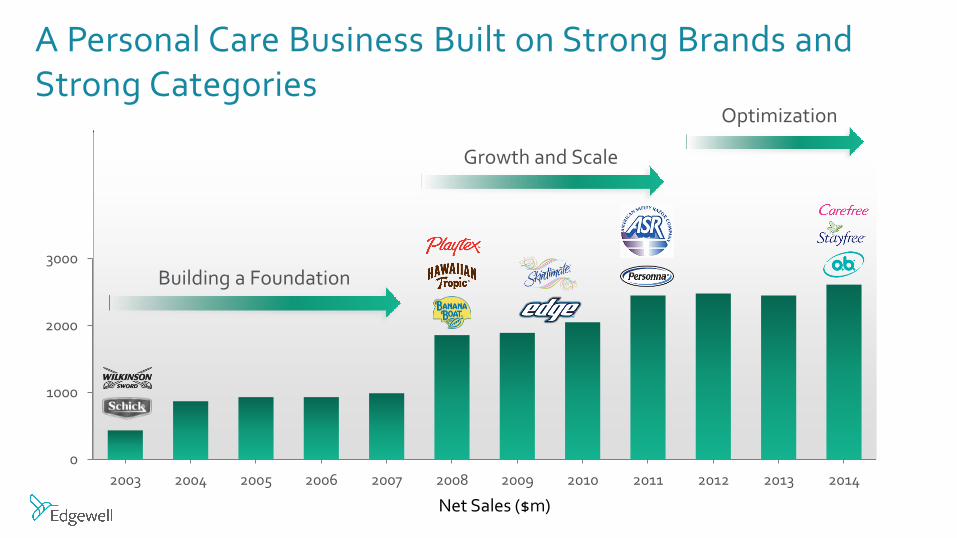
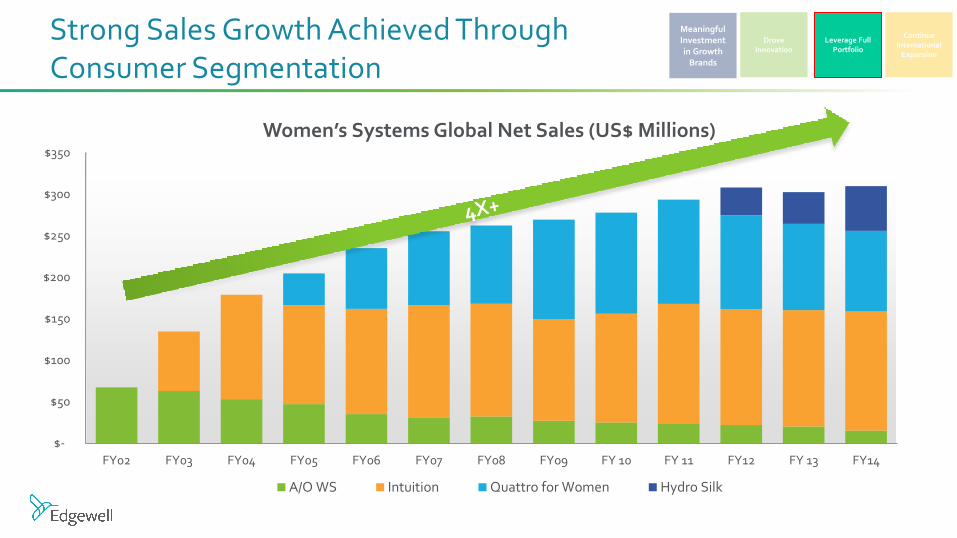
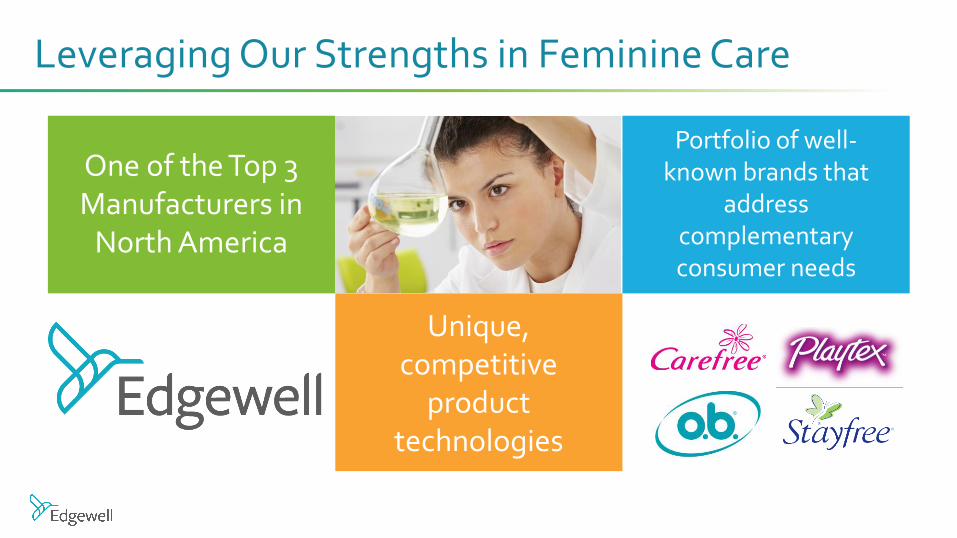
A Personal Care Business Built on Strong Brands and Strong Categories
by over 500, with automation projects averaging less than 2 year paybacks.
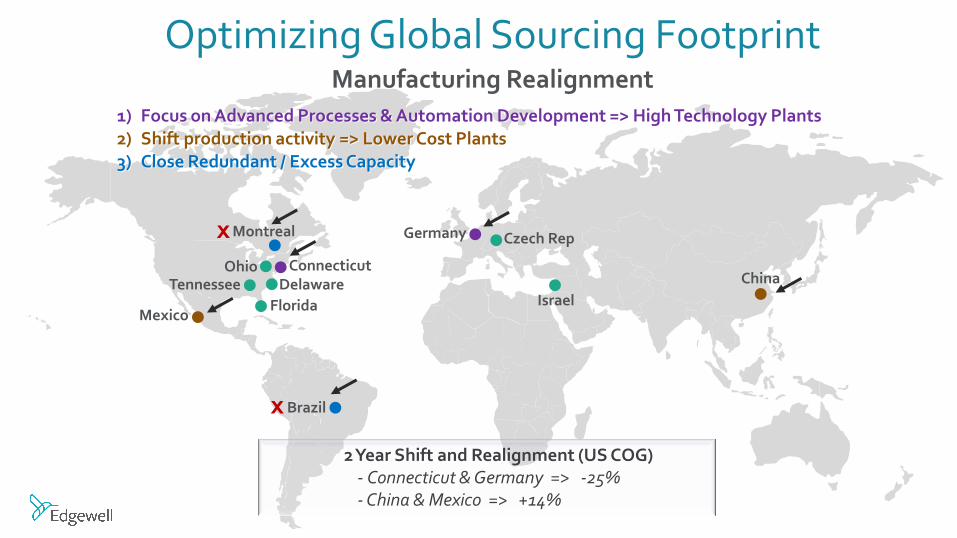
Optimizing Global Sourcing Footprint Manufacturing Realignment
Brazil x
Florida
Delaware Connecticut
Tennessee
Mexico
Ohio
Montreal x
China
Israel
Czech Rep Germany
1) Focus on Advanced Processes & Automation Development => High Technology Plants 2) Shift production activity => Lower Cost Plants 3) Close Redundant / Excess Capacity
2 Year Shift and Realignment (US COG) - Connecticut & Germany => -25% - China & Mexico => +14%
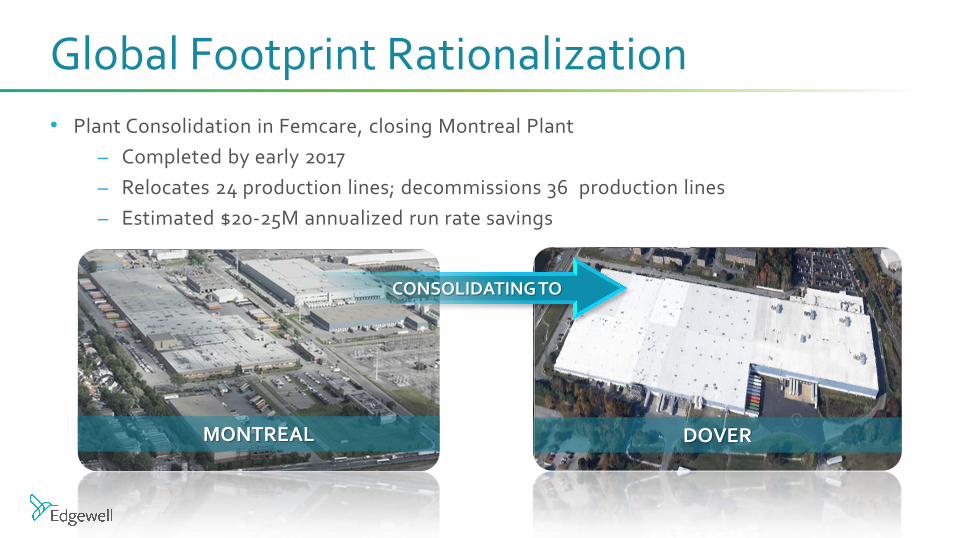
• Plant Consolidation in Femcare, closing Montreal Plant
– Completed by early 2017
– Relocates 24 production lines; decommissions 36 production lines
– Estimated $20-25M annualized run rate savings
Global Footprint Rationalization
MONTREAL DOVER
CONSOLIDATING TO
Asset Optimization Liquid Fill Insource / Outsource Optimization
$0.200
$0.250
$0.300
$0.350
$0.400
$0.450
$0.500
$0.550
20,000
25,000
30,000
35,000
40,000
45,000
50,000
55,000
2012 2013 2014 2015
Ormond Beach - Volume & Conversion COGS* Trend
Volume (000's Units) Conv COGS/Unit
2012 to 2015 Volume up 16%
Conversion COGS down 9%
* Conversion COGS includes direct labor, freight and plant overhead Volume is in units/pcs produced in Ormond Beach internal Sun care only
• Demonstrated History of Delivering Productivity Savings
• Process, Resources, and Focus In Place to Capture Future Opportunity
Driving Productivity: More to Come
Target = Gross Productivity Savings of 3% Annually
Edgewell Investor Day 2015 Financial Model
Sandy Sheldon Chief Financial Officer
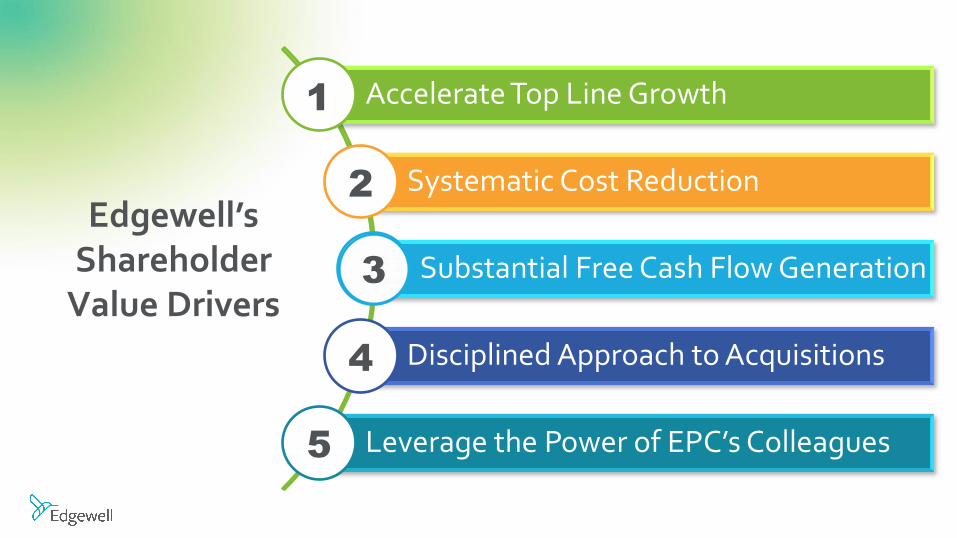
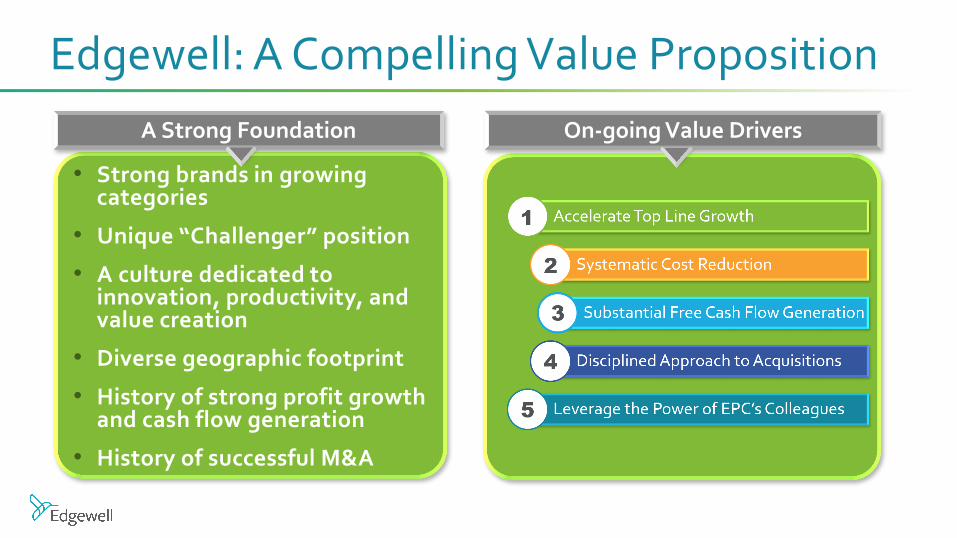
Edgewell: A Compelling Value Proposition
• Strong brands in growing categories
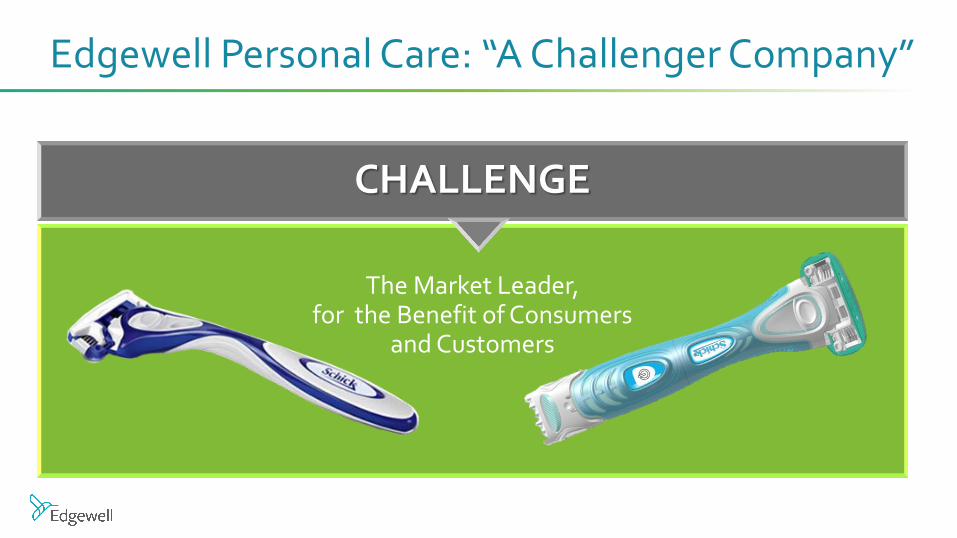
• Unique “Challenger” position
• A culture dedicated to innovation, productivity, and value creation
• Diverse geographic footprint
• History of strong profit growth and cash flow generation
• History of successful M&A
A Strong Foundation On-going Value Drivers
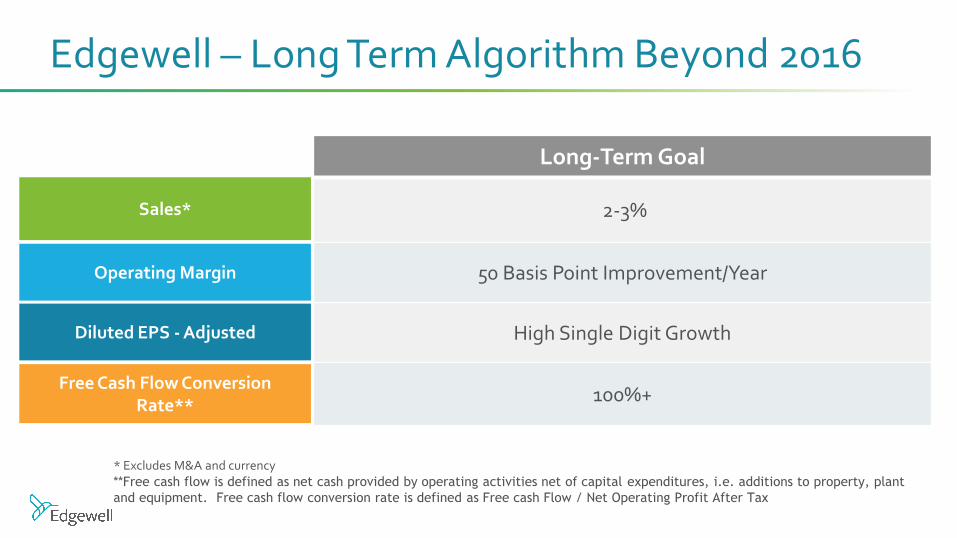
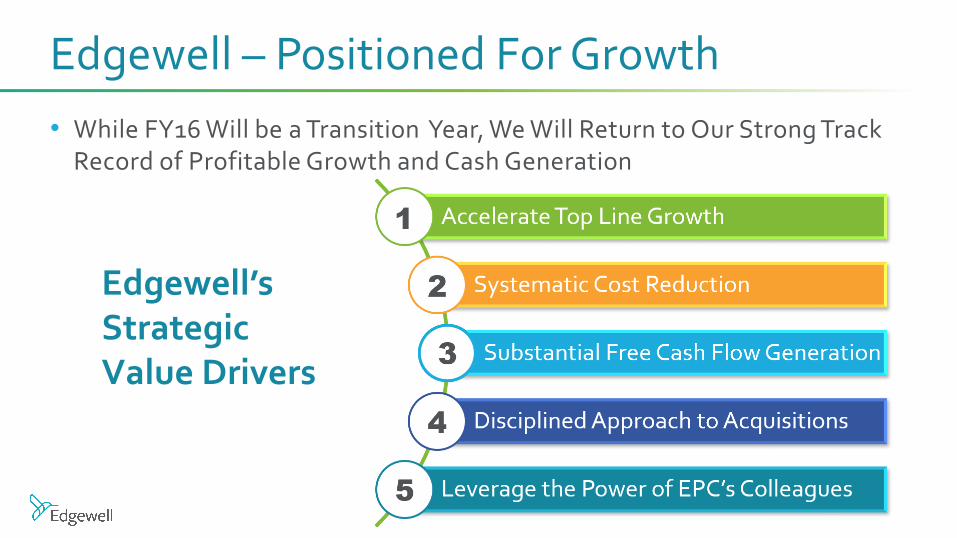
Edgewell – Long Term Algorithm Beyond 2016
Sales*
Long-Term Goal
2-3%
50 Basis Point Improvement/Year
High Single Digit Growth
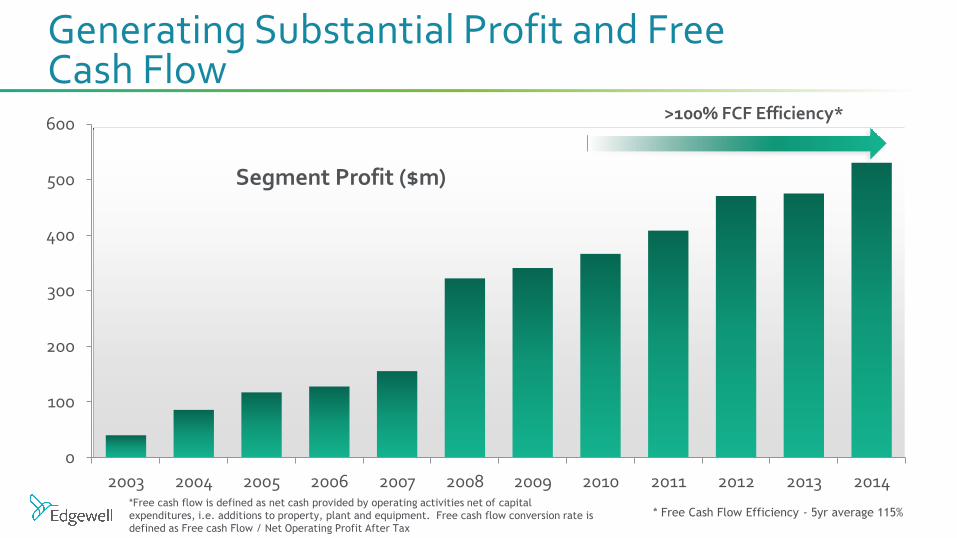
100%+
Operating Margin
Diluted EPS - Adjusted
Free Cash Flow Conversion Rate**
* Excludes M&A and currency **Free cash flow is defined as net cash provided by operating activities net of capital expenditures, i.e. additions to property, plant
and equipment. Free cash flow conversion rate is defined as Free cash Flow / Net Operating Profit After Tax
3.0% 3.0% 3.1%
4.5%
0.2%
-1.5%
**1.9%
-2%
-1%
0%
1%
2%
3%
4%
5%
FY08 FY09 FY10 FY11 FY12 FY13 FY14 Long termObjective
Long Term Objective 2-3%
1.8% CAGR ‘08 – ‘14
* Organic growth rates exclude currency impacts and M&A ** 1.9% excluding ASR planned decline of 10.3% in FY12
Sales
3.1% CAGR ‘08 – ‘12
Long Term Algorithm: Organic* Sales Growth Trends
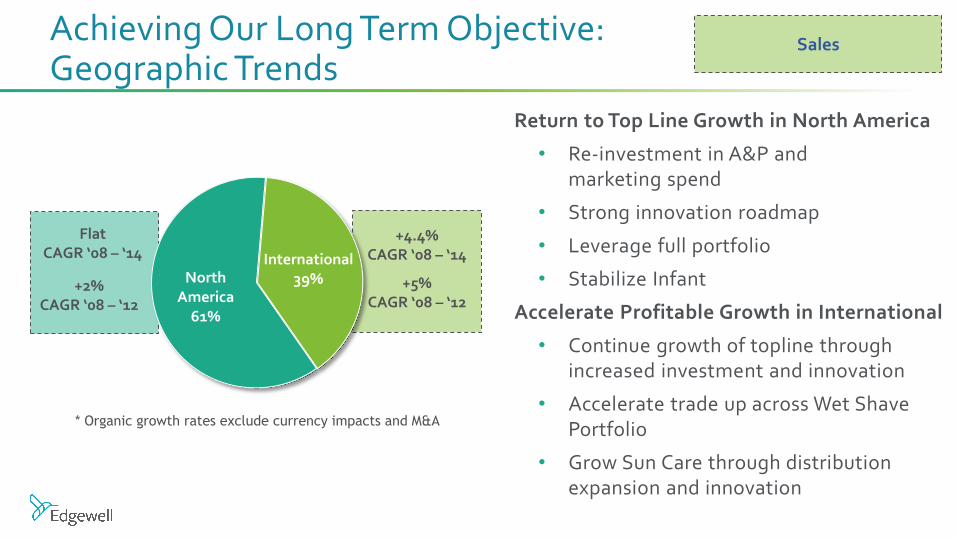
Achieving Our Long Term Objective: Geographic Trends
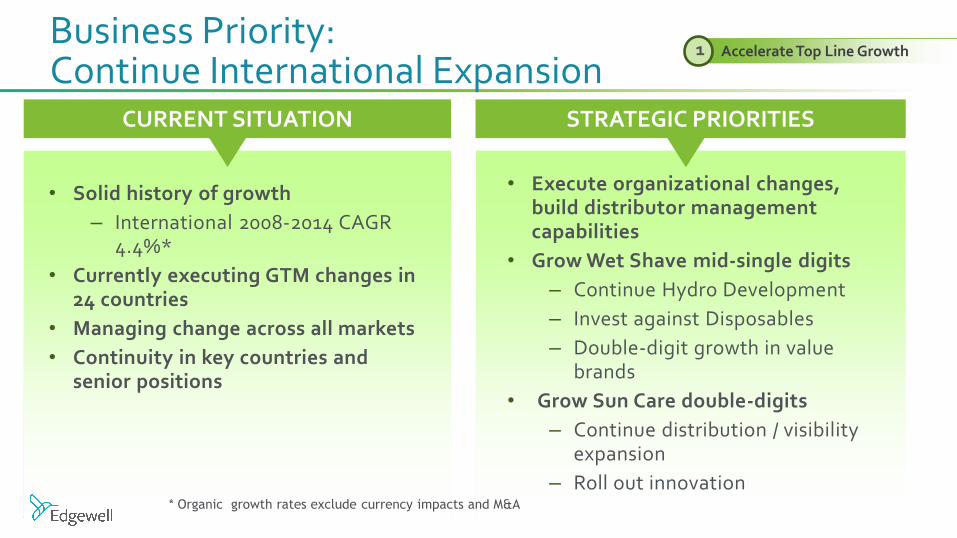
Return to Top Line Growth in North America
• Re-investment in A&P and marketing spend
• Strong innovation roadmap
• Leverage full portfolio
• Stabilize Infant
Accelerate Profitable Growth in International
• Continue growth of topline through increased investment and innovation
• Accelerate trade up across Wet Shave Portfolio
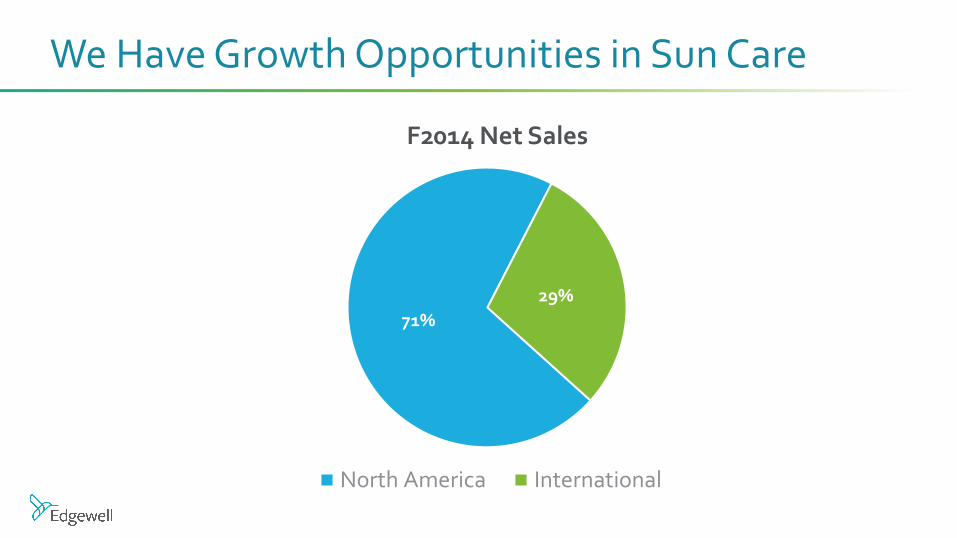
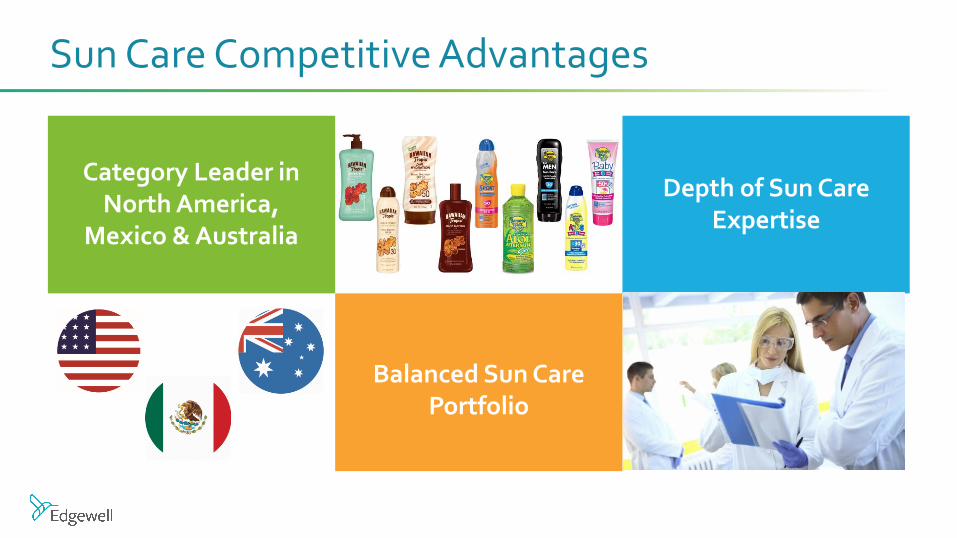
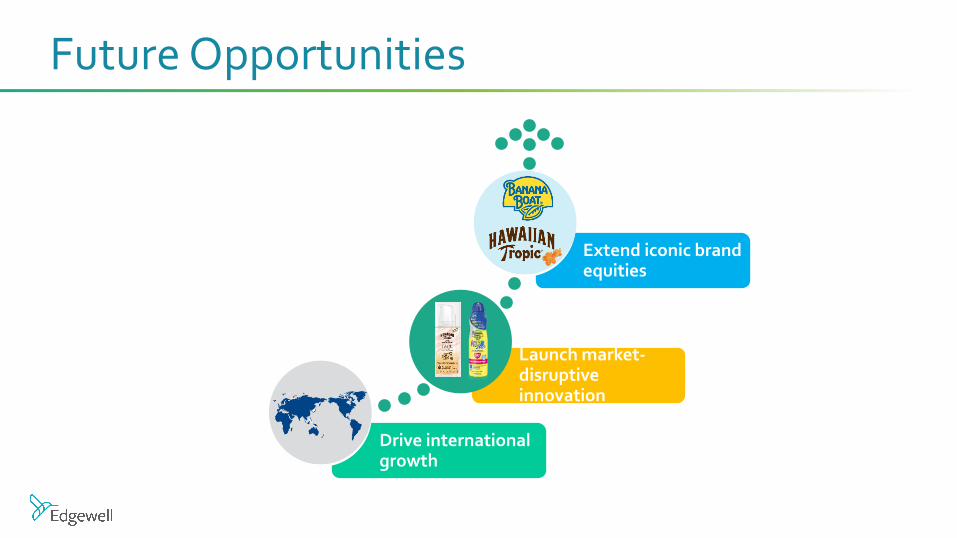
• Grow Sun Care through distribution expansion and innovation
North America
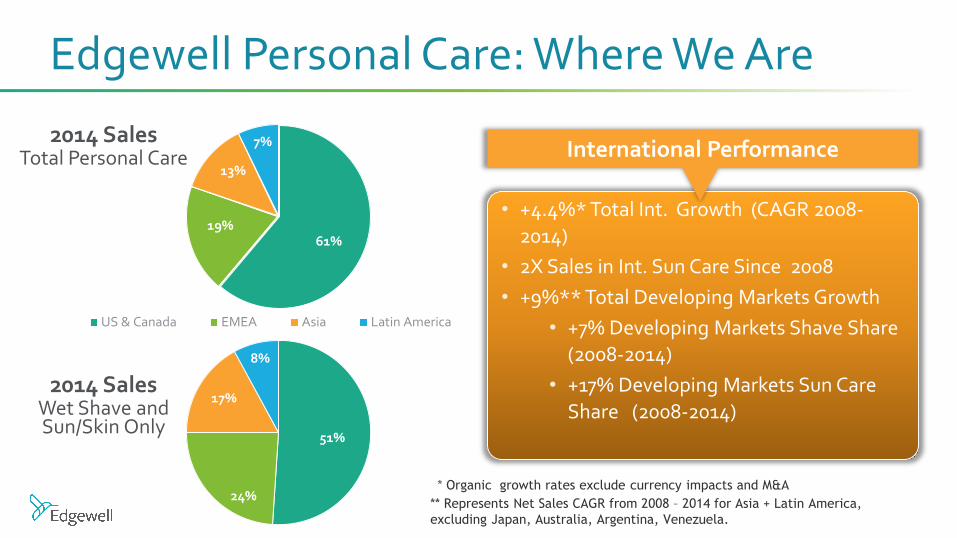
61%
International 39%
Flat CAGR ‘08 – ‘14
+4.4% CAGR ‘08 – ‘14
+5% CAGR ‘08 – ‘12
+2% CAGR ‘08 – ‘12
Sales
* Organic growth rates exclude currency impacts and M&A
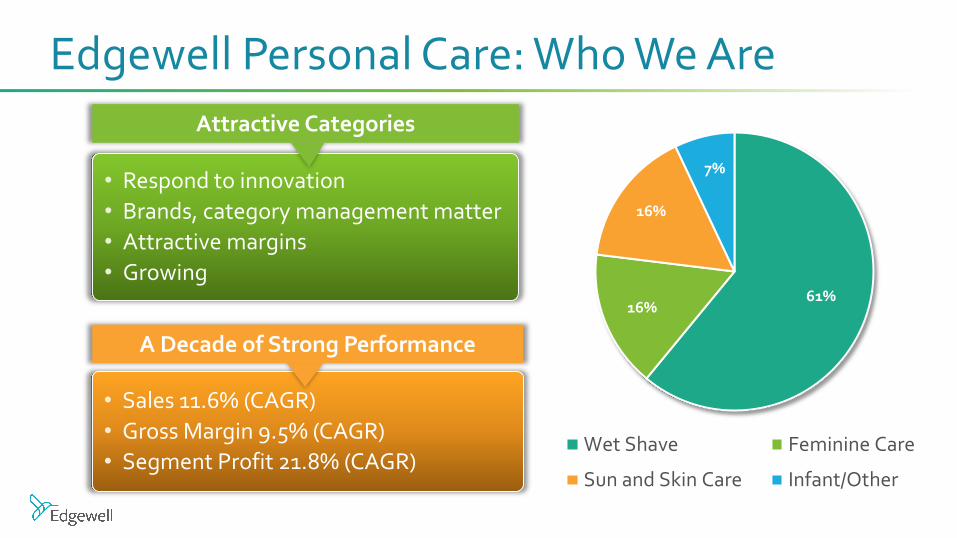
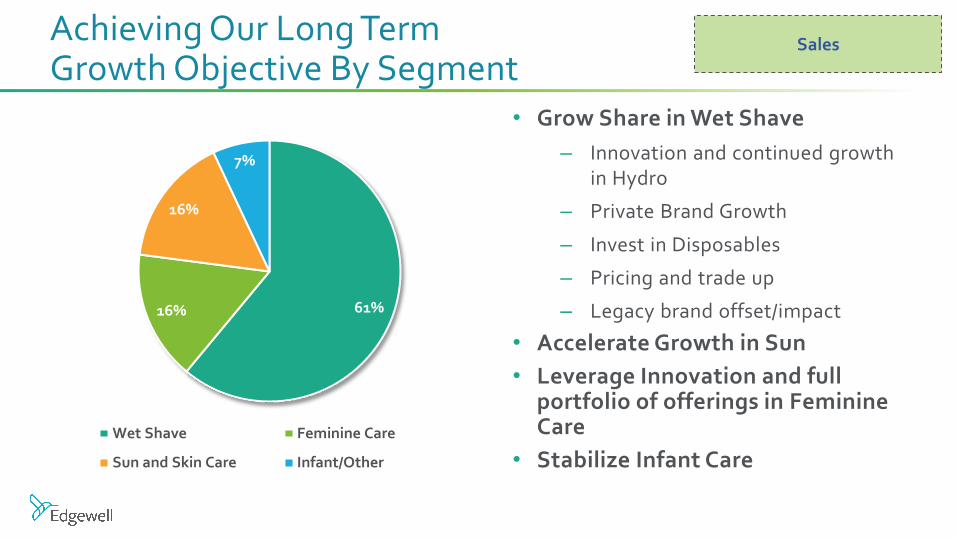
61% 16%
16%
7%
Wet Shave Feminine Care
Sun and Skin Care Infant/Other
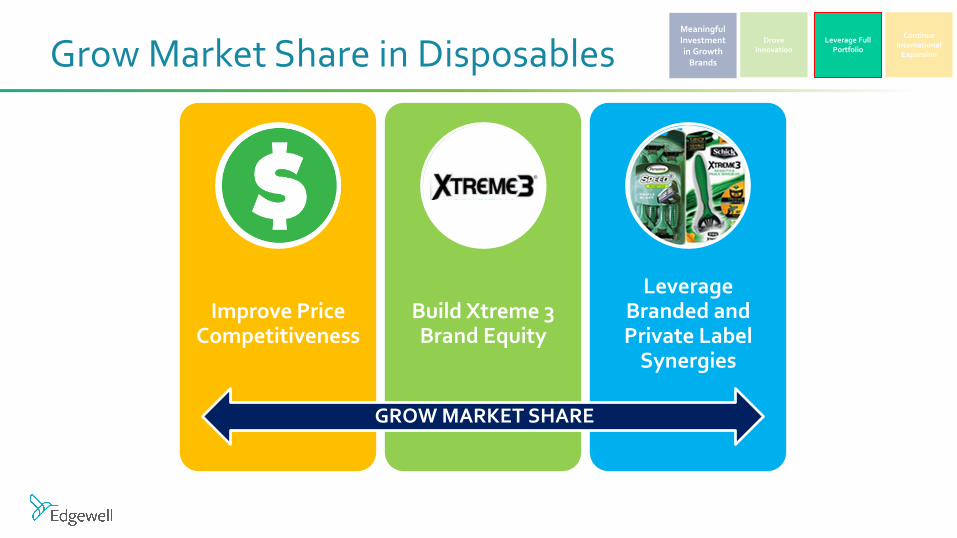
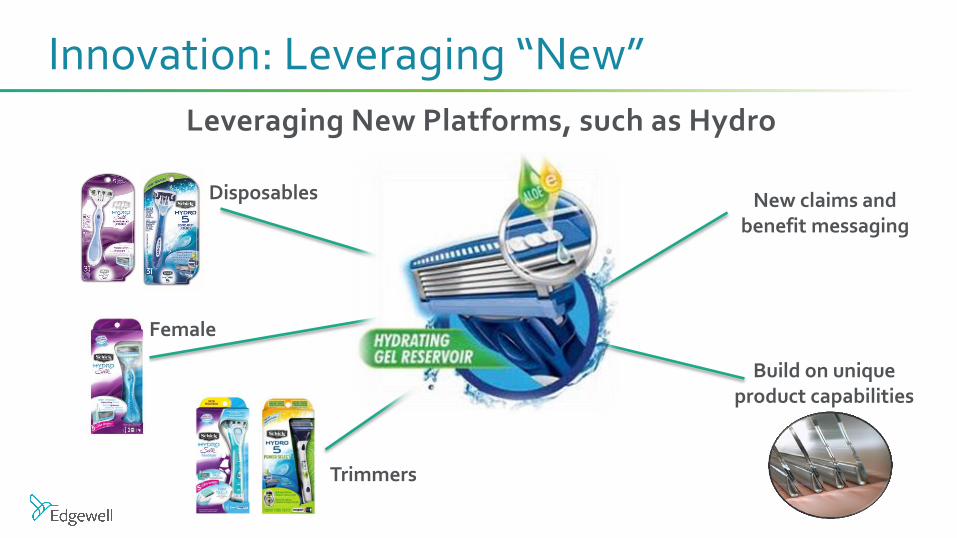
• Grow Share in Wet Shave
– Innovation and continued growth in Hydro
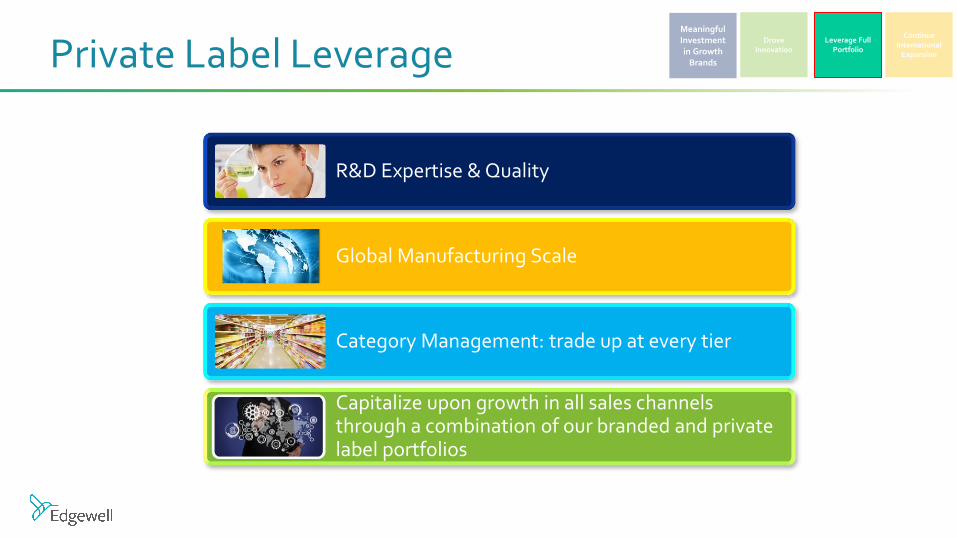
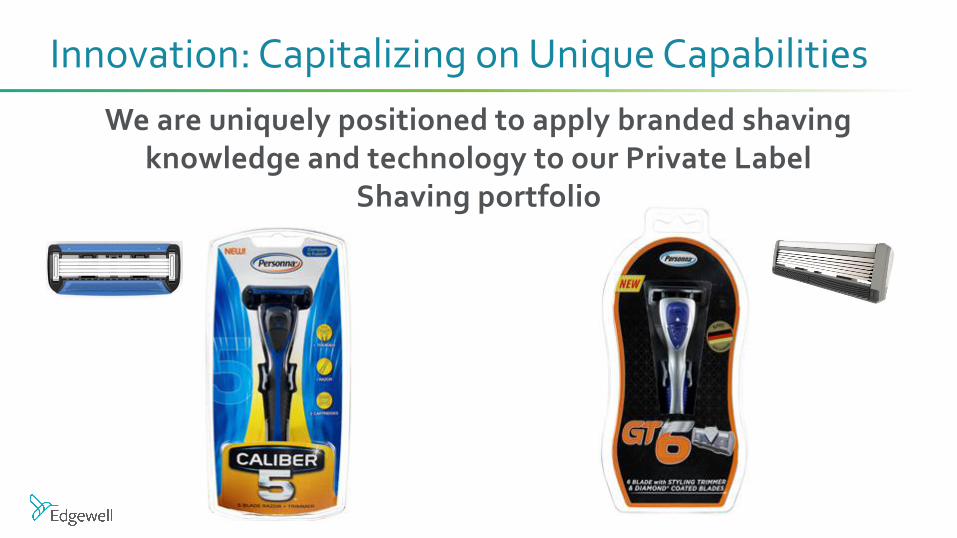
– Private Brand Growth
– Invest in Disposables
– Pricing and trade up
– Legacy brand offset/impact
• Accelerate Growth in Sun
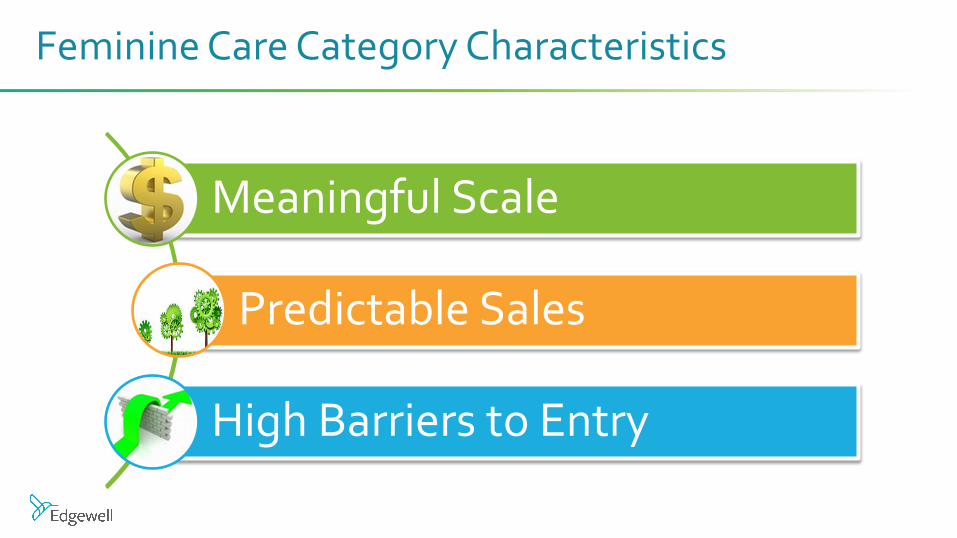
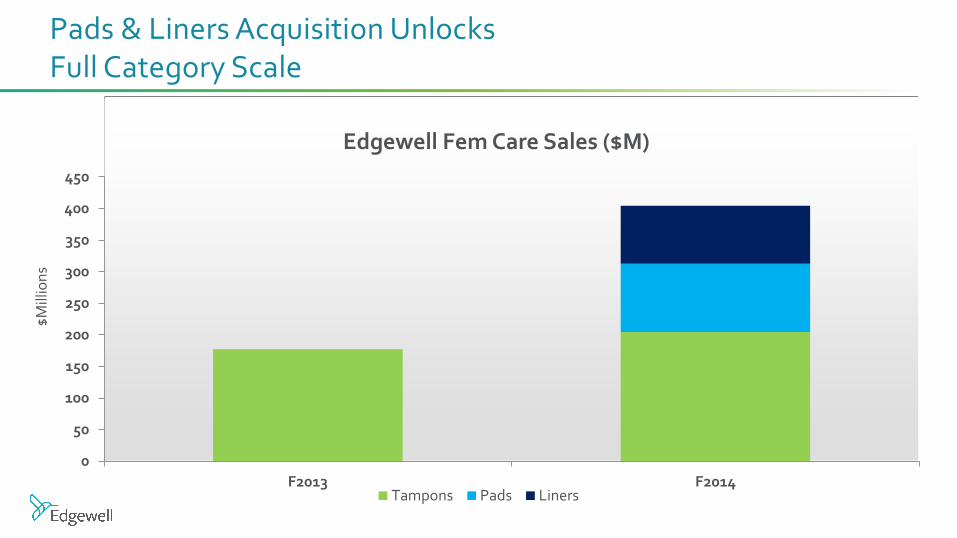
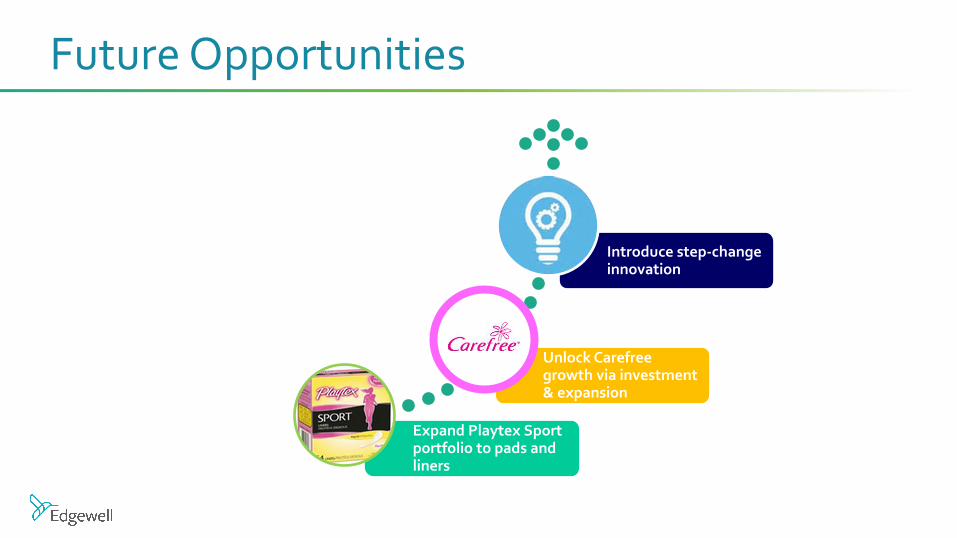
• Leverage Innovation and full portfolio of offerings in Feminine Care
• Stabilize Infant Care
Achieving Our Long Term Growth Objective By Segment
Sales
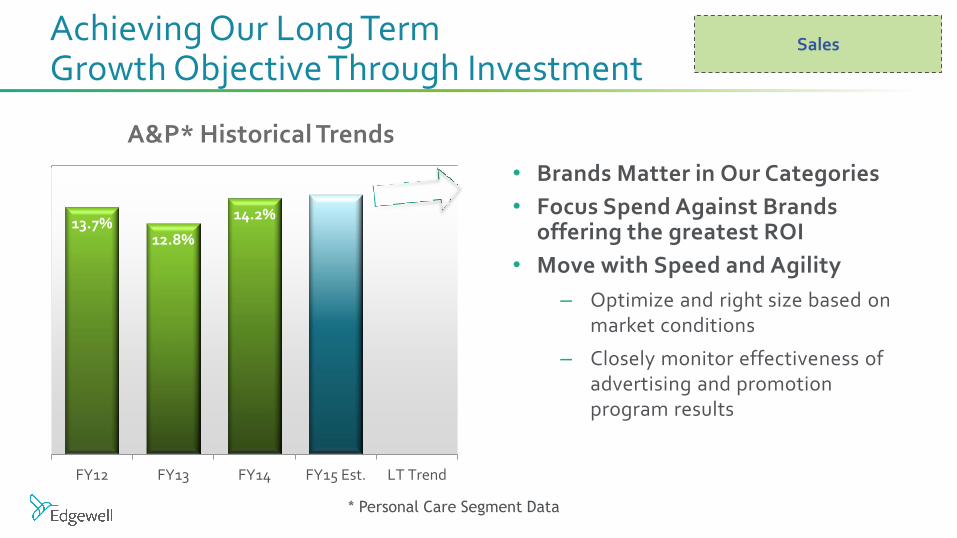
13.7% 12.8%
14.2%
FY12 FY13 FY14 FY15 Est. LT Trend
A&P* Historical Trends
Achieving Our Long Term Growth Objective Through Investment
Sales
• Brands Matter in Our Categories
• Focus Spend Against Brands offering the greatest ROI
• Move with Speed and Agility
– Optimize and right size based on market conditions
– Closely monitor effectiveness of advertising and promotion program results
* Personal Care Segment Data
17.9% 16.7%
19.0% 19.4% 20.3%
FY10 FY11 FY12 FY13 FY14
A Track Record of Strong Profit Growth and Margin Expansion
Operating Margin Expansion
Hydro launch
investment
Operating Margin*
• Track Record of Profit Margin Improvement
• Key Areas of Focus:
– Price and mix due to innovation and trade up
– Operational productivity
– SG&A leverage, cost discipline including 2013 restructuring
• Reinvest in A&P and Other Promotional Activities
* Personal Care Segment Data -- does not include EHI corporate costs
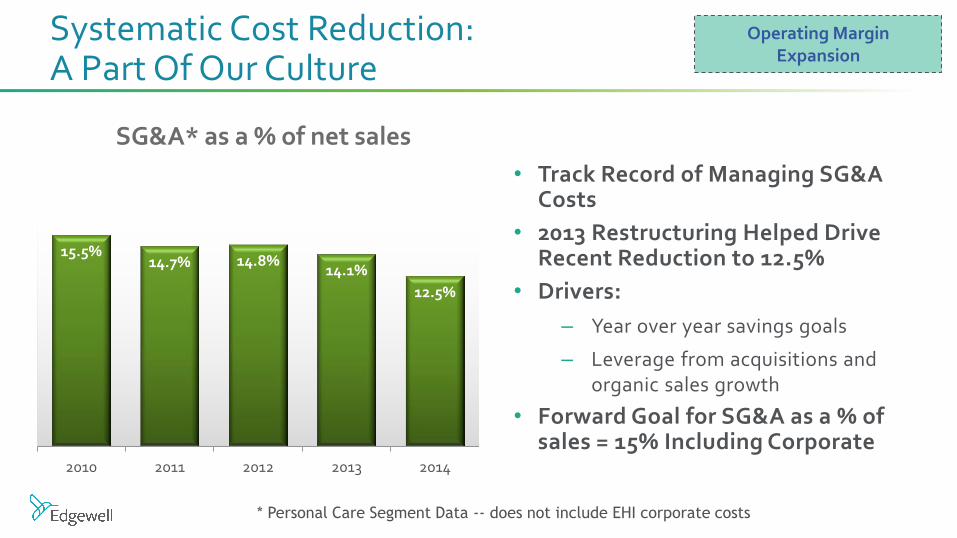
15.5% 14.7% 14.8%
14.1%
12.5%
2010 2011 2012 2013 2014
Operating Margin Expansion
SG&A* as a % of net sales
* Personal Care Segment Data -- does not include EHI corporate costs
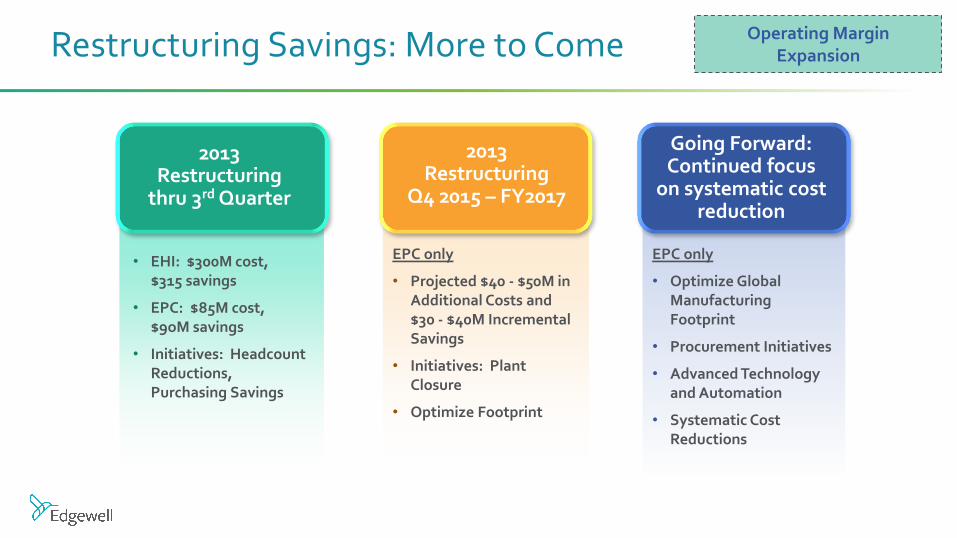
Systematic Cost Reduction: A Part Of Our Culture
• Track Record of Managing SG&A Costs
• 2013 Restructuring Helped Drive Recent Reduction to 12.5%
• Drivers:
– Year over year savings goals
– Leverage from acquisitions and organic sales growth
• Forward Goal for SG&A as a % of sales = 15% Including Corporate
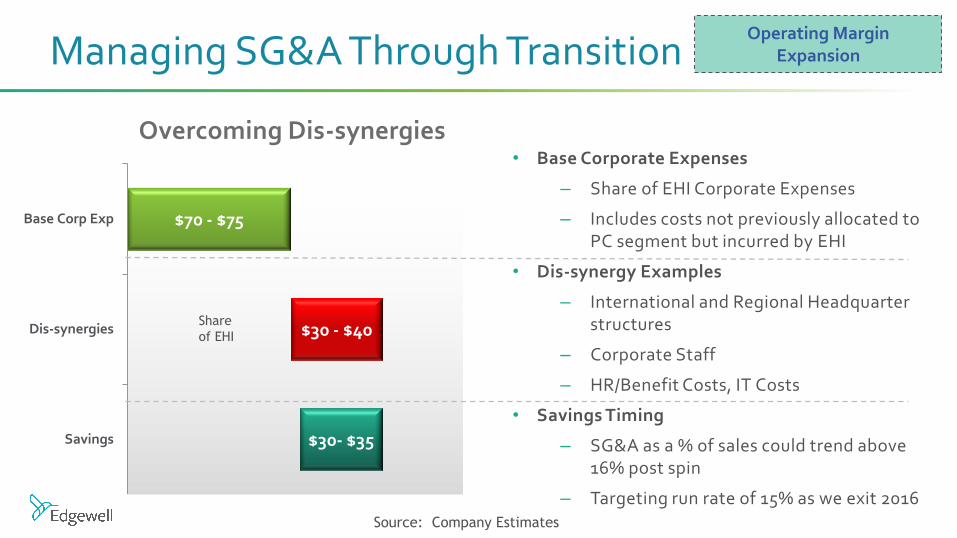
Managing SG&A Through Transition
Overcoming Dis-synergies • Base Corporate Expenses
– Share of EHI Corporate Expenses
– Includes costs not previously allocated to PC segment but incurred by EHI
• Dis-synergy Examples
– International and Regional Headquarter structures
– Corporate Staff
– HR/Benefit Costs, IT Costs
• Savings Timing
– SG&A as a % of sales could trend above 16% post spin
– Targeting run rate of 15% as we exit 2016
Operating Margin Expansion
$30- $35
$30 - $40
$70 - $75
Savings
Dis-synergies
Base Corp Exp
Share
of EHI
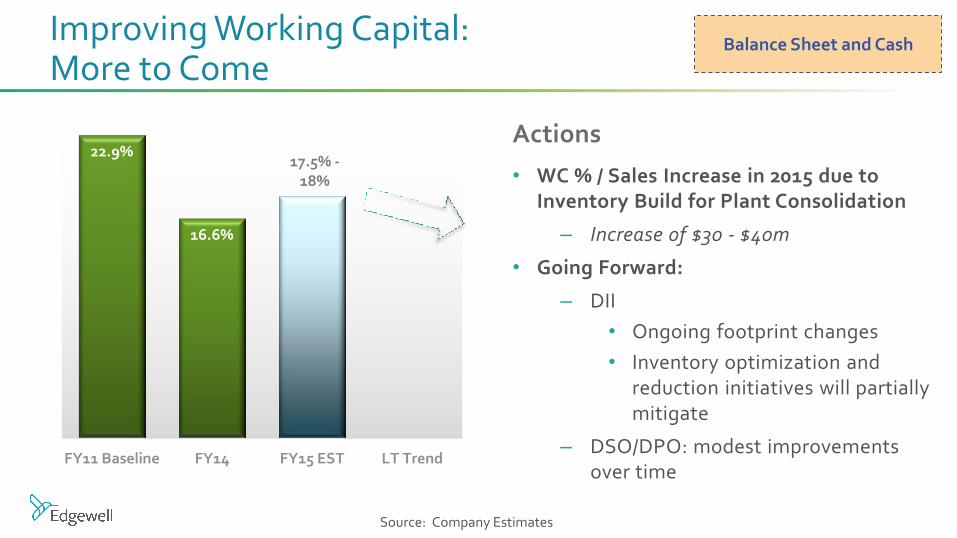
Source: Company Estimates
Continuing to Fuel Our Growth Through Disciplined Cost Management
COGS/Supply Chain Commercial SG&A
Are
as
of
Fo
cus
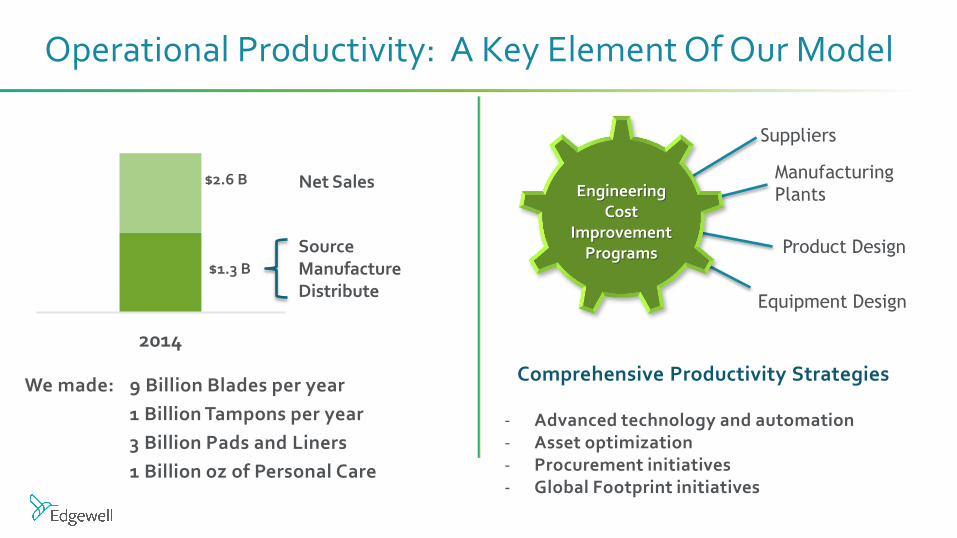
• Advanced Technology and Automation Deployment
• Global Footprint Initiatives
• Asset Optimization
• Procurement Initiatives
• Trade Spend Productivity
• Brand Investment Effectiveness
• Outsource Non-core Transactional Activities
• Centralized Back-office Functions
• Go to Market Footprint
Ta
rge
t
Average 3% Gross, 0.5% - 1% Net Savings Annually
Reinvest For Growth Steady State Objective: 15%
of Sales with On-going Productivity and Efficiency
Lo
ng
-Te
rm
Ob
ject
ive
s
Contributes to +50 Basis Point Operating Margin Expansion Per Year
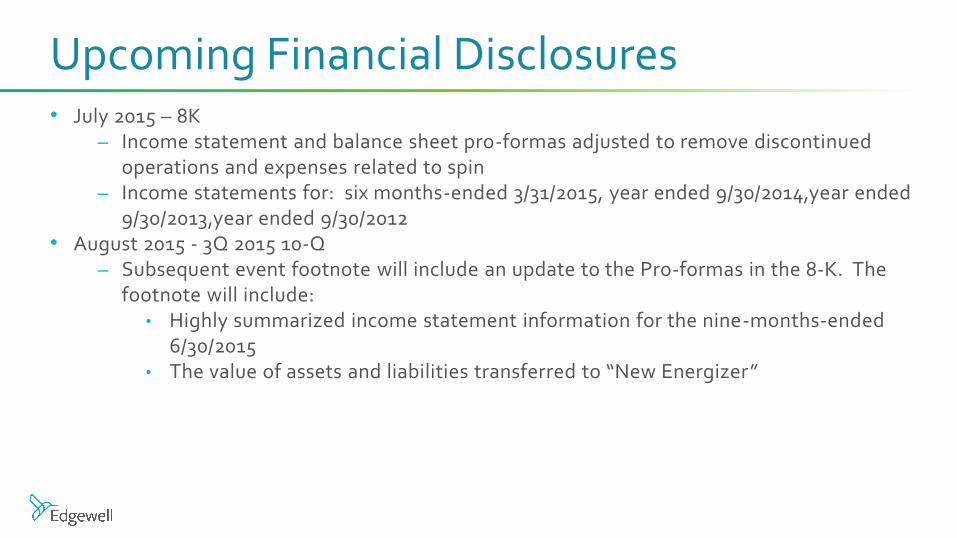
• July 2015 – 8K – Income statement and balance sheet pro-formas adjusted to remove discontinued
operations and expenses related to spin – Income statements for: six months-ended 3/31/2015, year ended 9/30/2014,year ended
9/30/2013,year ended 9/30/2012 • August 2015 - 3Q 2015 10-Q
– Subsequent event footnote will include an update to the Pro-formas in the 8-K. The footnote will include:
• Highly summarized income statement information for the nine-months-ended 6/30/2015
• The value of assets and liabilities transferred to “New Energizer”
Upcoming Financial Disclosures
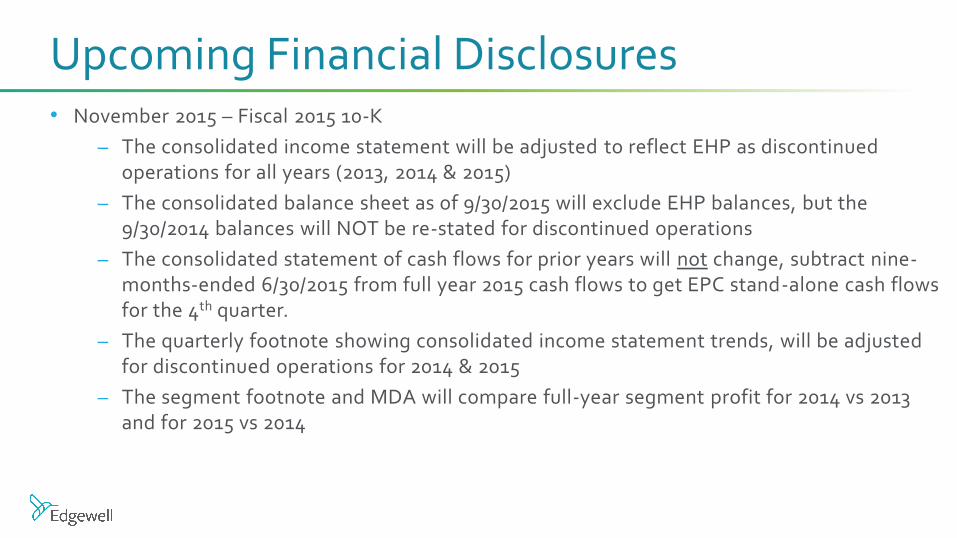
• November 2015 – Fiscal 2015 10-K
– The consolidated income statement will be adjusted to reflect EHP as discontinued operations for all years (2013, 2014 & 2015)
– The consolidated balance sheet as of 9/30/2015 will exclude EHP balances, but the 9/30/2014 balances will NOT be re-stated for discontinued operations
– The consolidated statement of cash flows for prior years will not change, subtract nine-months-ended 6/30/2015 from full year 2015 cash flows to get EPC stand-alone cash flows for the 4th quarter.
– The quarterly footnote showing consolidated income statement trends, will be adjusted for discontinued operations for 2014 & 2015
– The segment footnote and MDA will compare full-year segment profit for 2014 vs 2013 and for 2015 vs 2014
Upcoming Financial Disclosures
Non-GAAP Financial Measures. While the Company reports financial results in accordance with accounting principles generally accepted in the U.S. (“GAAP”), this discussion includes non-GAAP measures. These non-GAAP measures, such as adjusted net earnings per diluted share, the costs associated with restructuring and other initiatives, costs associated with the planned spin-off transaction, costs associated with acquisitions and integration as well as acquisition inventory valuation, adjustments to prior year tax accruals, pension curtailment, pro forma adjustments related to the spin-off from Ralston Purina Company and certain other items as outlined herein, are not in accordance with, nor are they a substitute for, GAAP measures. The Company believes these non-GAAP measures provide a meaningful comparison to the corresponding historical period and assist investors in performing analysis consistent with financial models developed by research analysts. Investors should consider non-GAAP measures in addition to, not as a substitute for, or superior to, the comparable
GAAP measures.
Non-GAAP Reconciliations
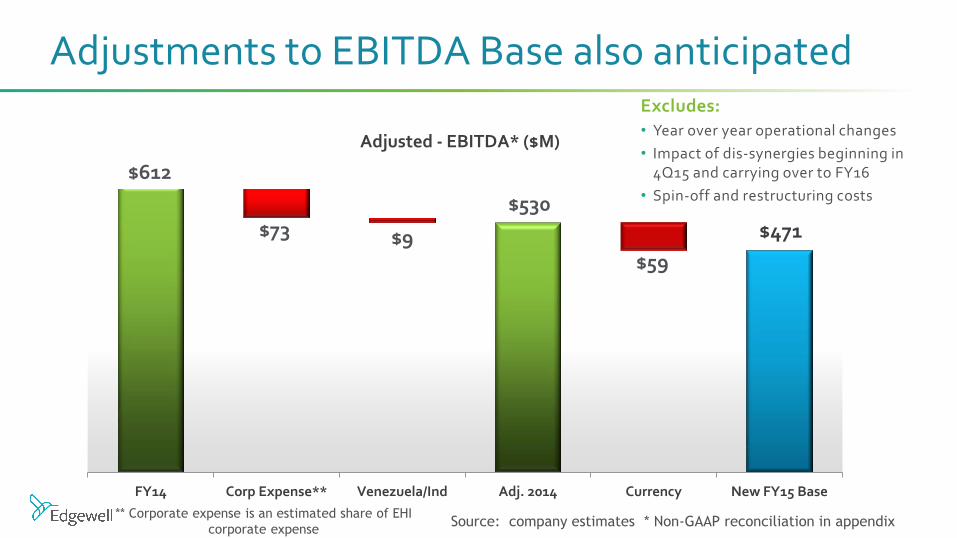
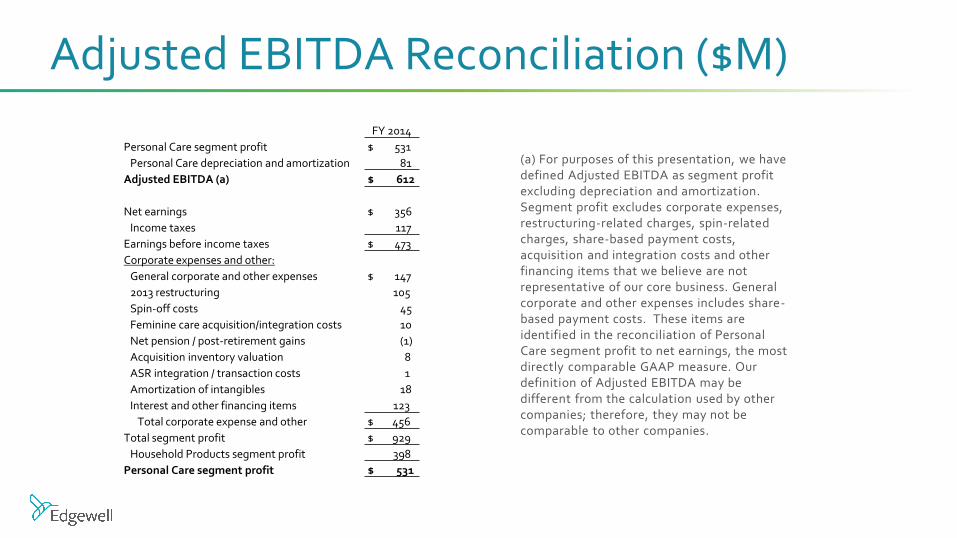
(a) For purposes of this presentation, we have defined Adjusted EBITDA as segment profit excluding depreciation and amortization. Segment profit excludes corporate expenses, restructuring-related charges, spin-related charges, share-based payment costs, acquisition and integration costs and other financing items that we believe are not representative of our core business. General corporate and other expenses includes share-based payment costs. These items are identified in the reconciliation of Personal Care segment profit to net earnings, the most directly comparable GAAP measure. Our definition of Adjusted EBITDA may be different from the calculation used by other companies; therefore, they may not be comparable to other companies.
Adjusted EBITDA Reconciliation ($M)
FY 2014
Personal Care segment profit $ 531
Personal Care depreciation and amortization 81
Adjusted EBITDA (a) $ 612
Net earnings $ 356
Income taxes 117
Earnings before income taxes $ 473
Corporate expenses and other:
General corporate and other expenses $ 147
2013 restructuring 105
Spin-off costs 45
Feminine care acquisition/integration costs 10
Net pension / post-retirement gains (1)
Acquisition inventory valuation 8
ASR integration / transaction costs 1
Amortization of intangibles 18
Interest and other financing items 123
Total corporate expense and other $ 456
Total segment profit $ 929
Household Products segment profit 398
Personal Care segment profit $ 531
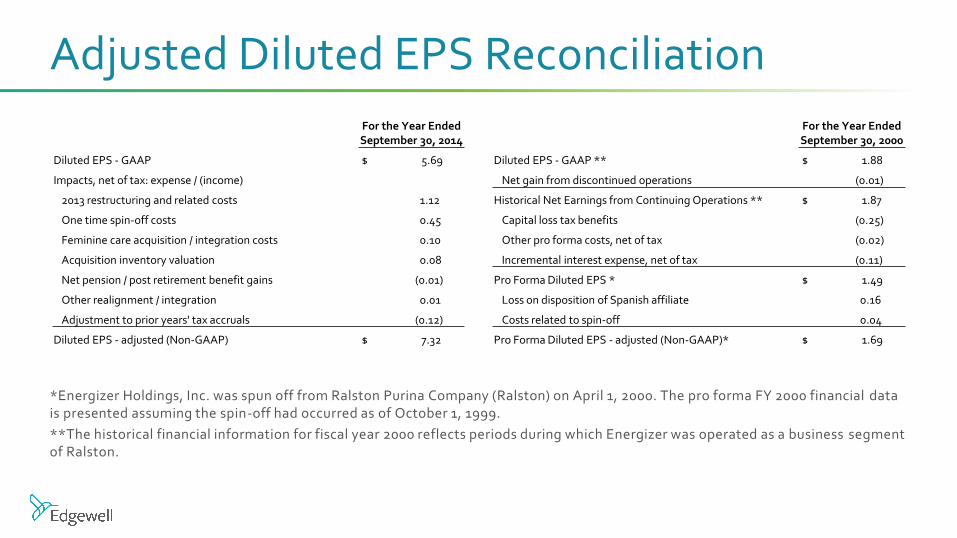
Adjusted Diluted EPS Reconciliation
*Energizer Holdings, Inc. was spun off from Ralston Purina Company (Ralston) on April 1, 2000. The pro forma FY 2000 financial data is presented assuming the spin-off had occurred as of October 1, 1999.
**The historical financial information for fiscal year 2000 reflects periods during which Energizer was operated as a business segment of Ralston.