28
INVESTOR PRESENTATION - 1
INVESTOR PRESENTATION - 1
INVESTOR PRESENTATION - 2
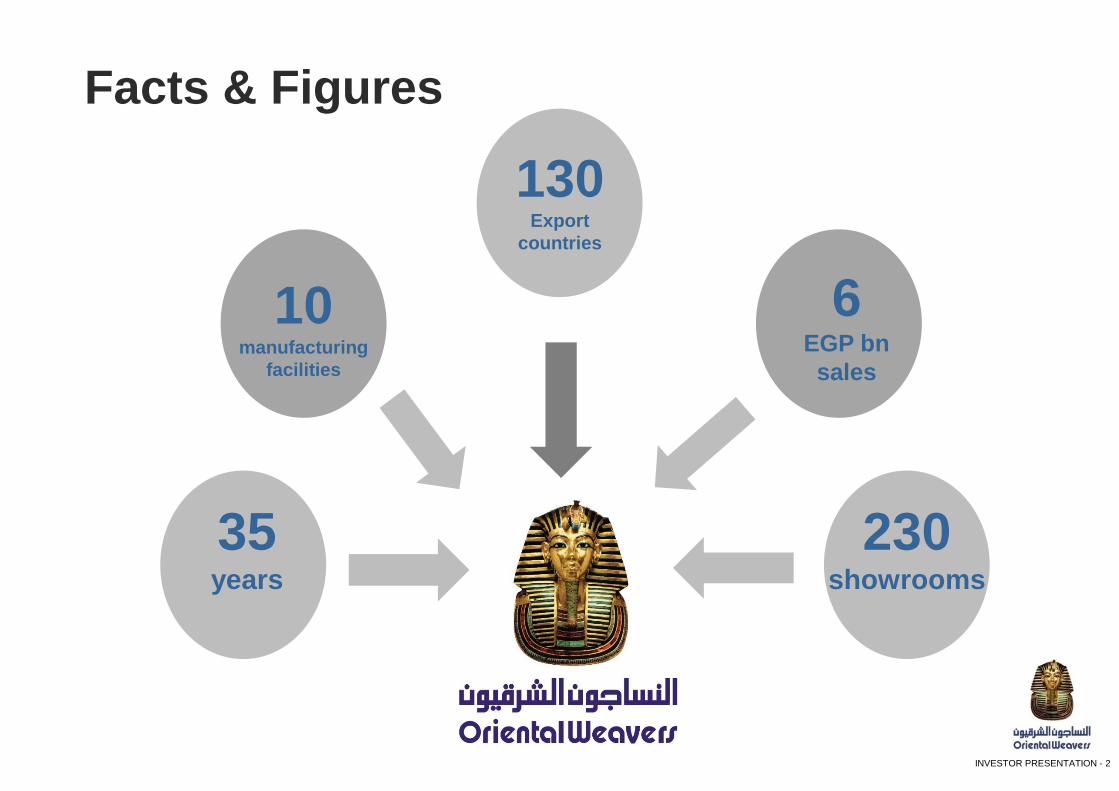
Facts & Figures
35 years
10 manufacturing
facilities
130 Export
countries
6 EGP bn
sales
230 showrooms
INVESTOR PRESENTATION - 3
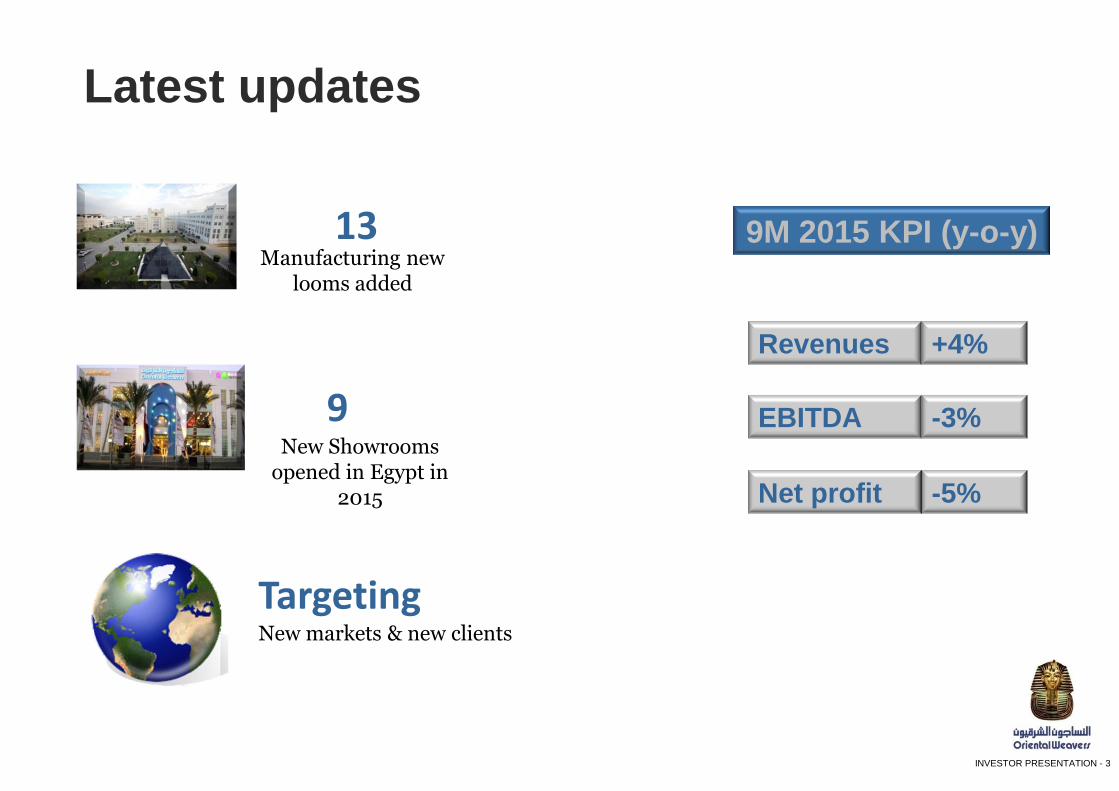
Latest updates
9 New Showrooms
opened in Egypt in 2015
Manufacturing new looms added
13
Targeting New markets & new clients
9M 2015 KPI (y-o-y)
Revenues +4%
EBITDA -3%
-5% Net profit
INVESTOR PRESENTATION - 4
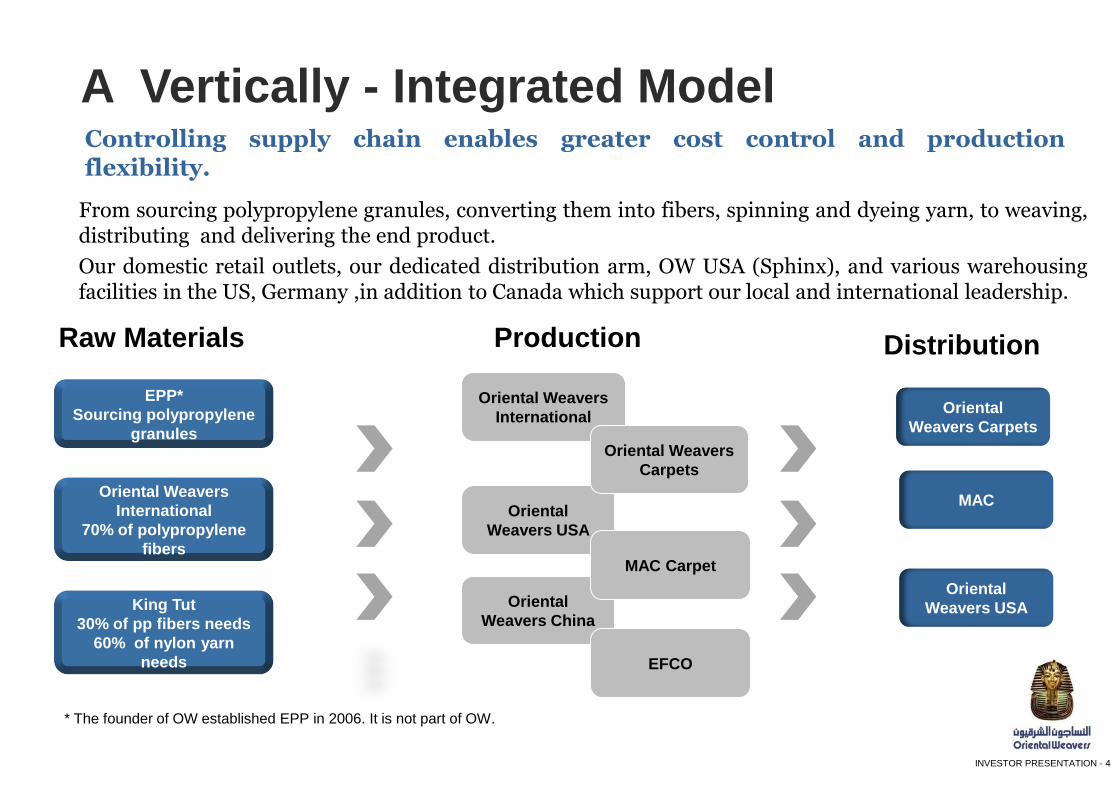
A Vertically - Integrated Model
From sourcing polypropylene granules, converting them into fibers, spinning and dyeing yarn, to weaving, distributing and delivering the end product.
Our domestic retail outlets, our dedicated distribution arm, OW USA (Sphinx), and various warehousing facilities in the US, Germany ,in addition to Canada which support our local and international leadership.
Raw Materials Production Distribution
Oriental
Weavers USA
Oriental Weavers
International
Oriental Weavers
Carpets
Oriental
Weavers China
MAC Carpet
Oriental
Weavers Carpets
Oriental
Weavers USA
EPP*
Sourcing polypropylene
granules
King Tut
30% of pp fibers needs
60% of nylon yarn
needs
Oriental Weavers
International
70% of polypropylene
fibers
* The founder of OW established EPP in 2006. It is not part of OW.
Controlling supply chain enables greater cost control and production flexibility.
MAC
EFCO
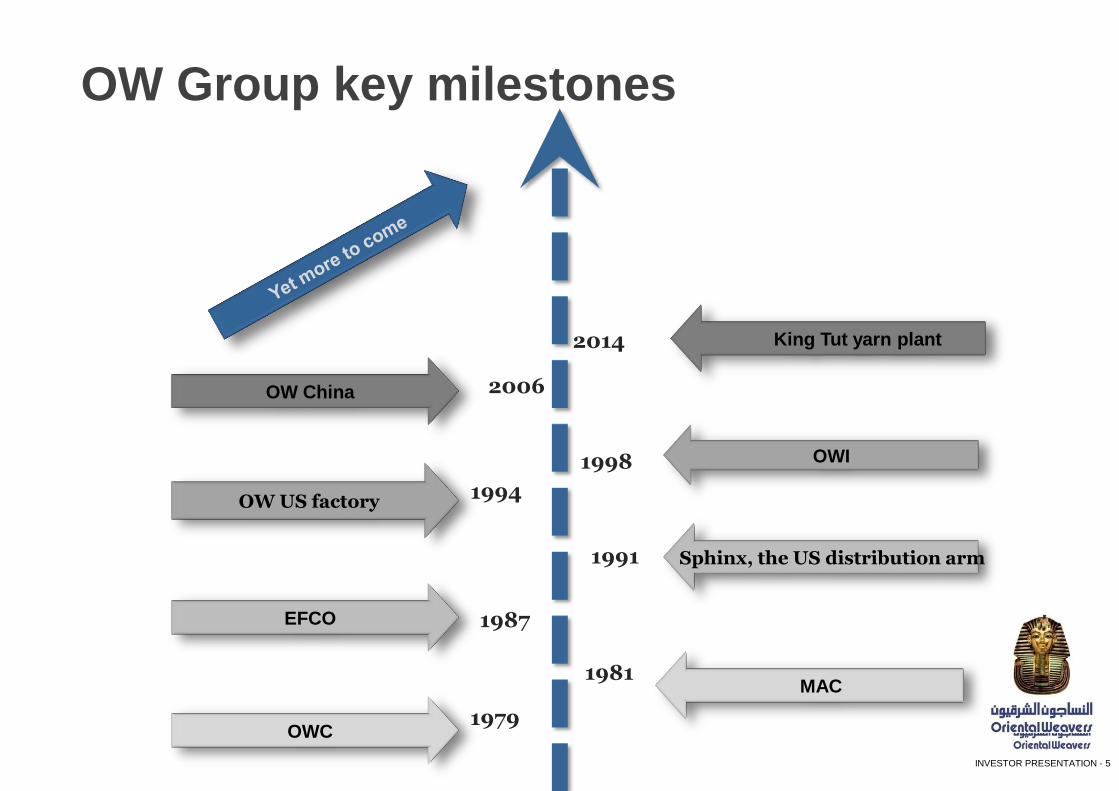
INVESTOR PRESENTATION - 5
1979
1987
1991
1994
1998
2006
OW Group key milestones
OWC
OWI
OW China
King Tut yarn plant
MAC 1981
Sphinx, the US distribution arm
OW US factory
2014
EFCO
INVESTOR PRESENTATION - 6
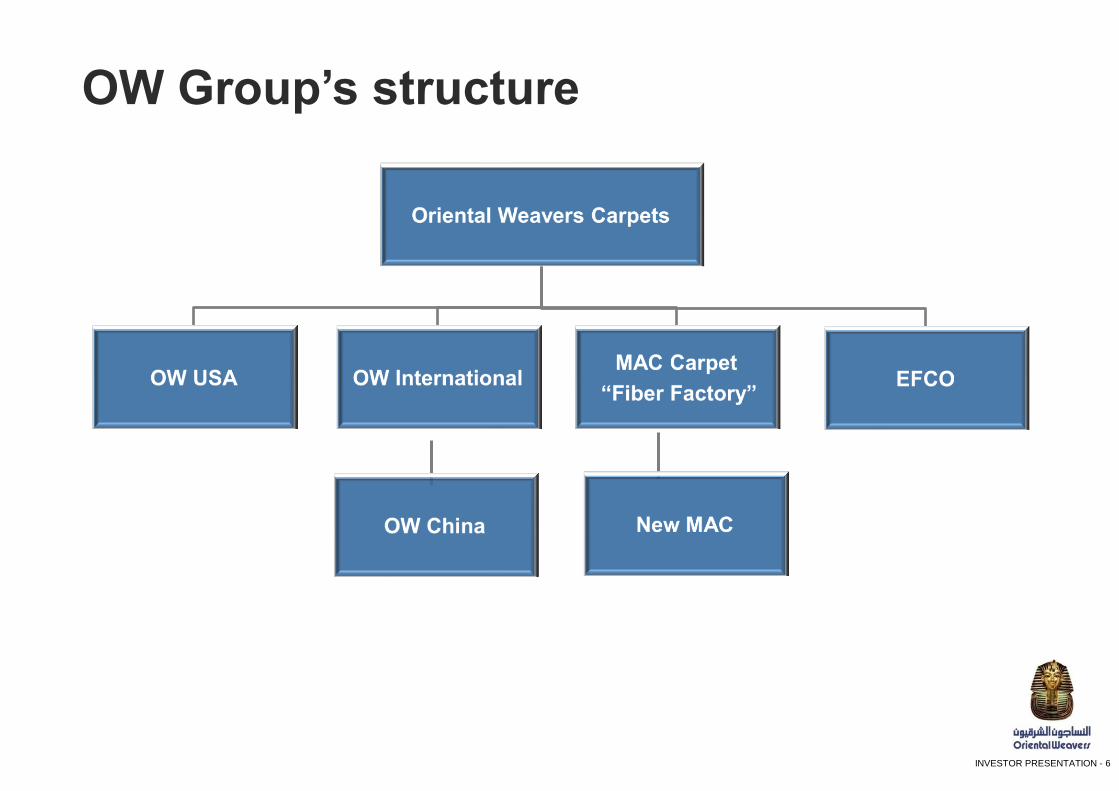
OW Group’s structure
INVESTOR PRESENTATION - 7
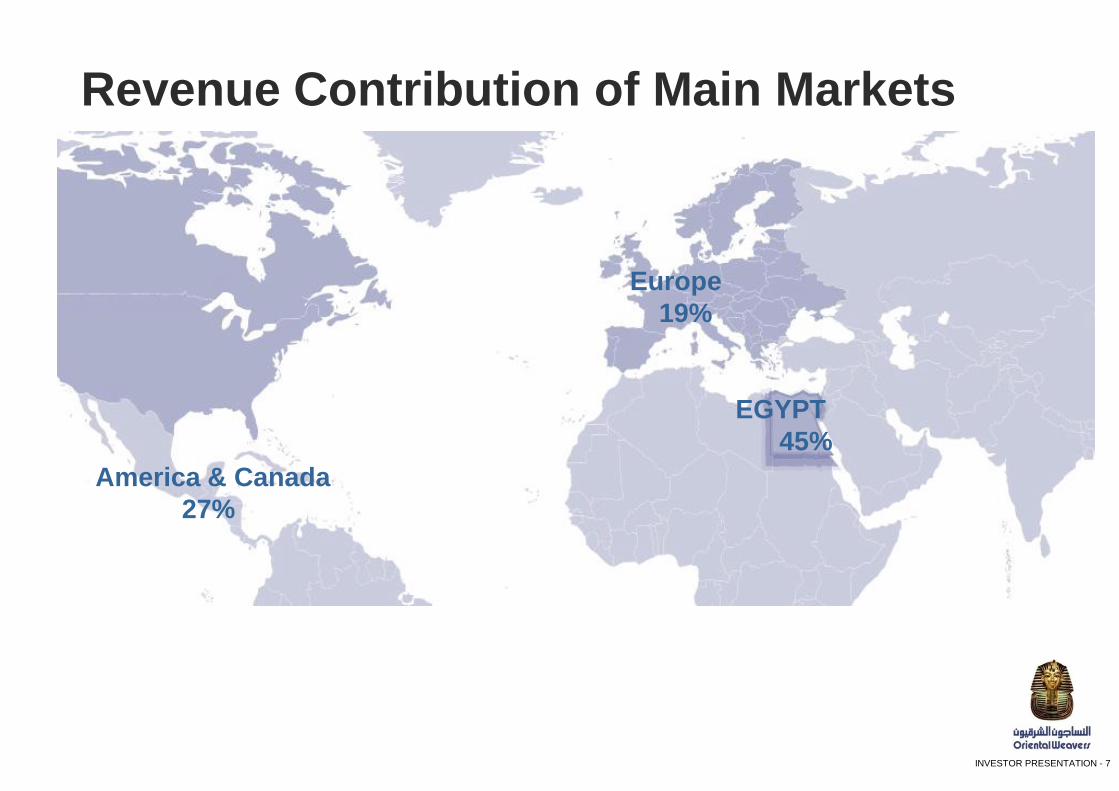
America & Canada
27%
EGYPT
45%
Europe
19%
Revenue Contribution of Main Markets
INVESTOR PRESENTATION - 8
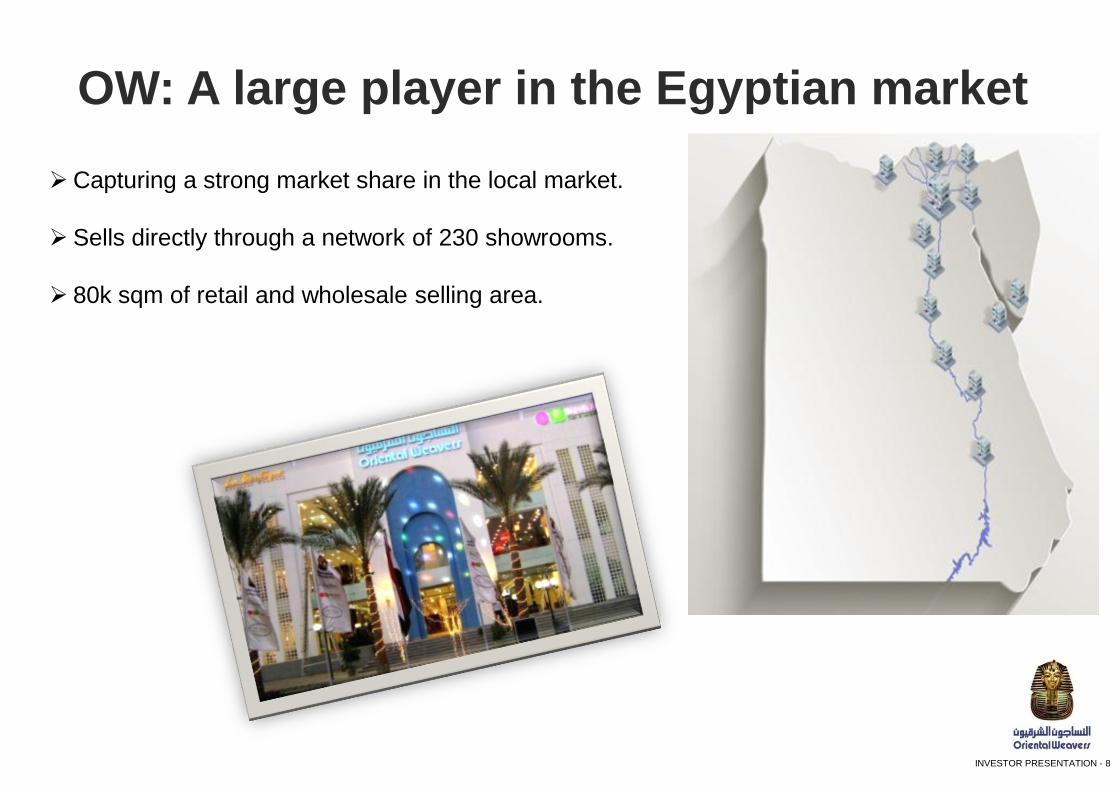
OW: A large player in the Egyptian market
Capturing a strong market share in the local market.
Sells directly through a network of 230 showrooms.
80k sqm of retail and wholesale selling area.
INVESTOR PRESENTATION - 9
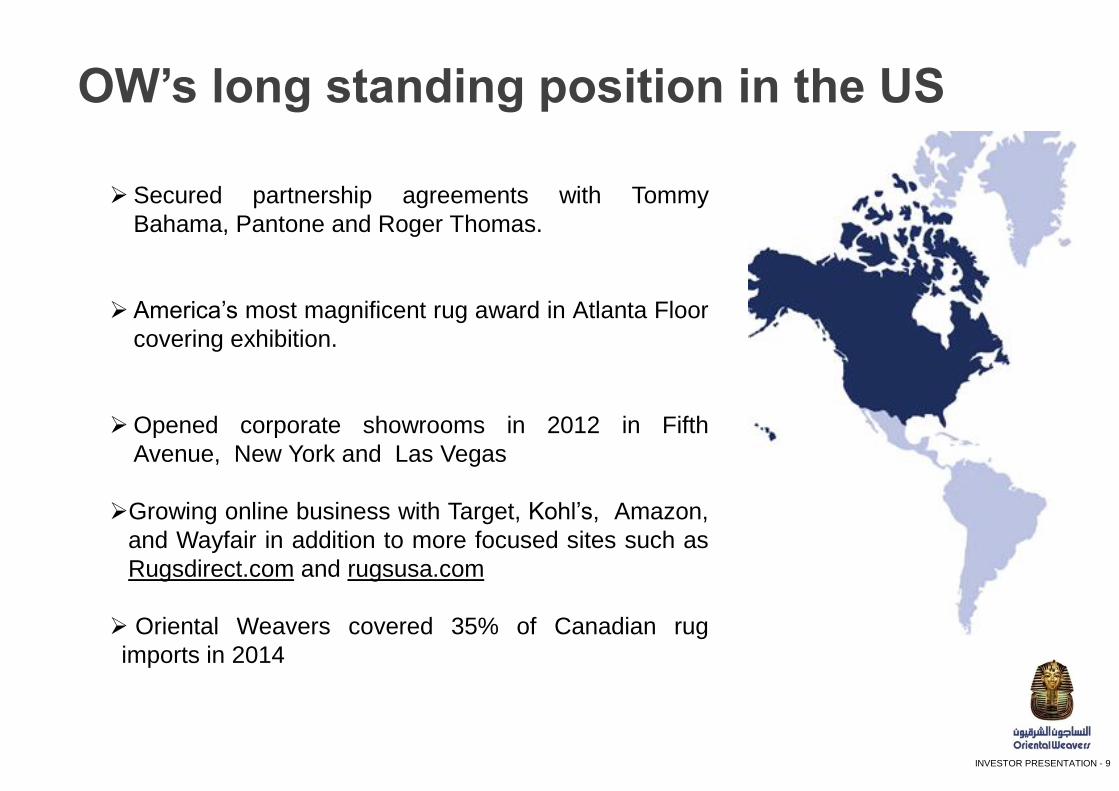
OW’s long standing position in the US
Secured partnership agreements with Tommy
Bahama, Pantone and Roger Thomas.
America’s most magnificent rug award in Atlanta Floor
covering exhibition.
Opened corporate showrooms in 2012 in Fifth
Avenue, New York and Las Vegas
Growing online business with Target, Kohl’s, Amazon,
and Wayfair in addition to more focused sites such as
Rugsdirect.com and rugsusa.com
Oriental Weavers covered 35% of Canadian rug
imports in 2014
INVESTOR PRESENTATION - 10
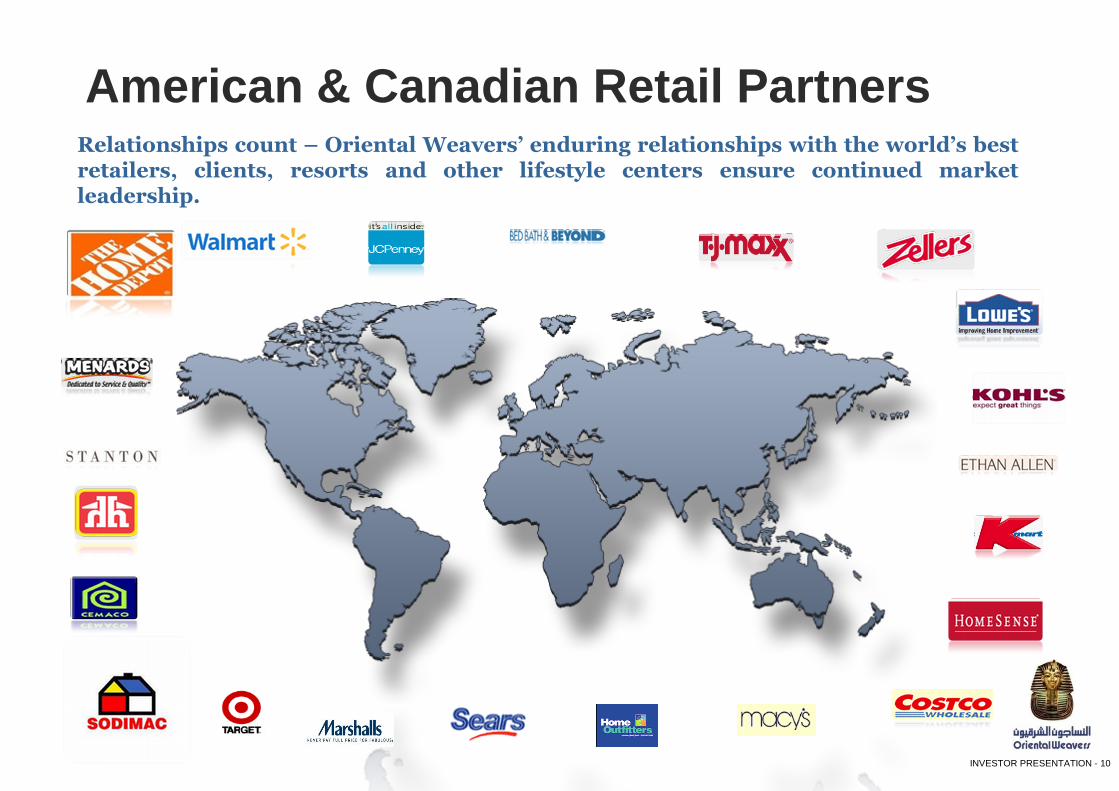
American & Canadian Retail Partners Relationships count – Oriental Weavers’ enduring relationships with the world’s best retailers, clients, resorts and other lifestyle centers ensure continued market leadership.
INVESTOR PRESENTATION - 11
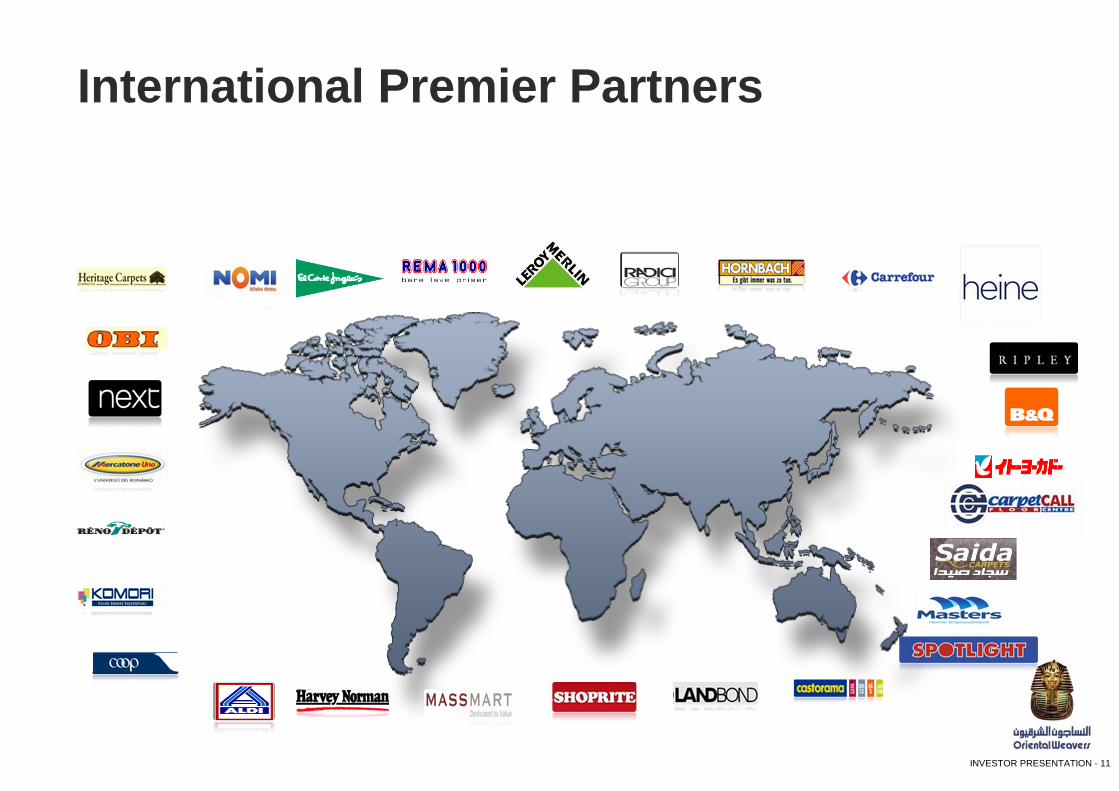
International Premier Partners
INVESTOR PRESENTATION - 12
Expansions
INVESTOR PRESENTATION - 13
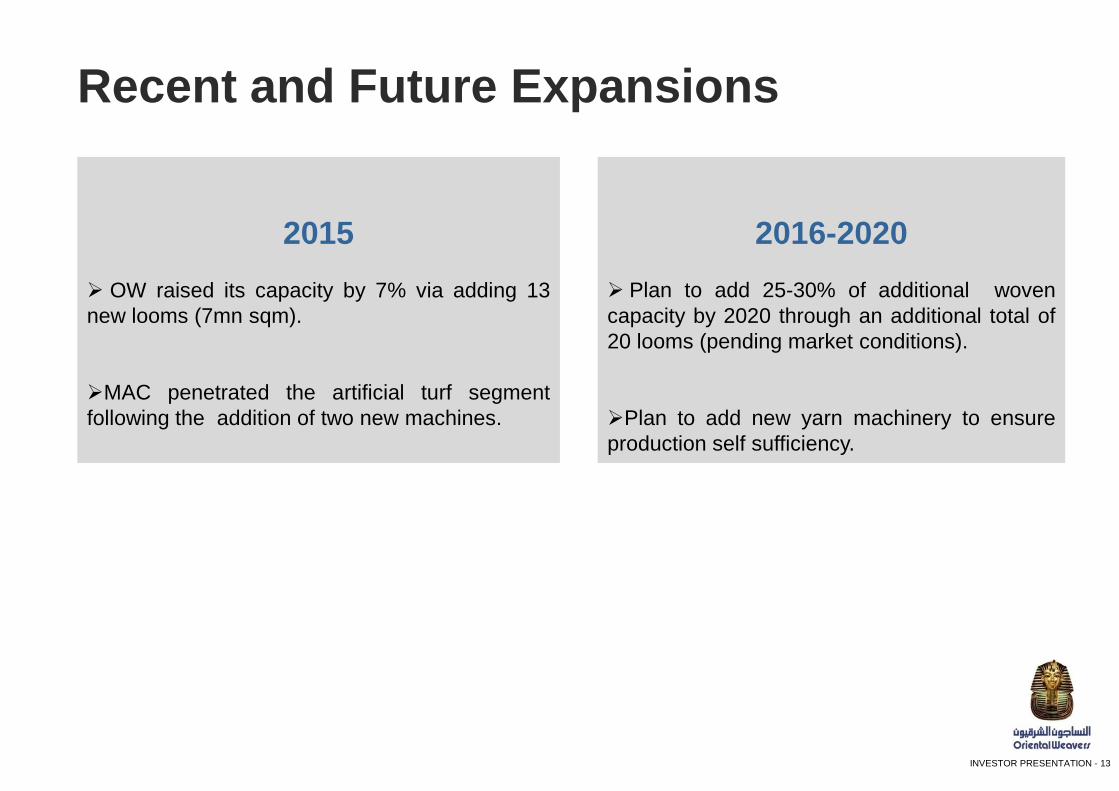
Recent and Future Expansions
2015
OW raised its capacity by 7% via adding 13
new looms (7mn sqm).
MAC penetrated the artificial turf segment
following the addition of two new machines.
2016-2020 Plan to add 25-30% of additional woven
capacity by 2020 through an additional total of
20 looms (pending market conditions).
Plan to add new yarn machinery to ensure
production self sufficiency.
INVESTOR PRESENTATION - 14
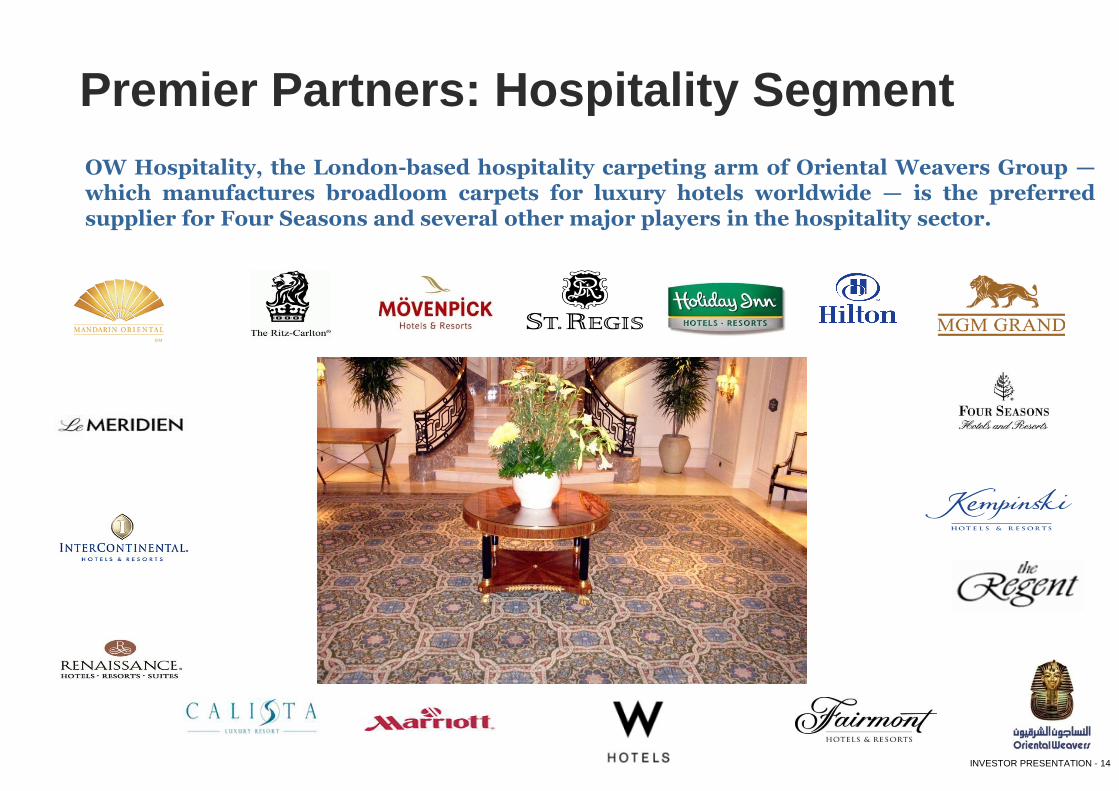
Premier Partners: Hospitality Segment
OW Hospitality, the London-based hospitality carpeting arm of Oriental Weavers Group — which manufactures broadloom carpets for luxury hotels worldwide — is the preferred supplier for Four Seasons and several other major players in the hospitality sector.
INVESTOR PRESENTATION - 15
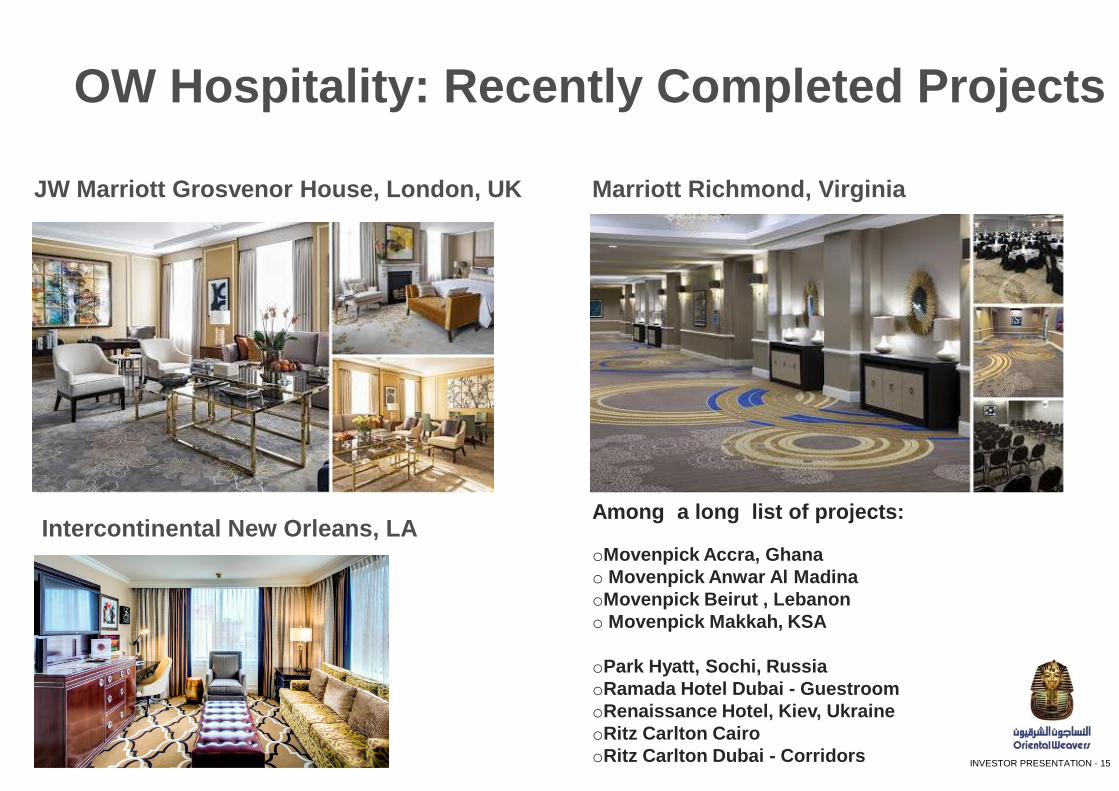
OW Hospitality: Recently Completed Projects
JW Marriott Grosvenor House, London, UK Marriott Richmond, Virginia
Intercontinental New Orleans, LA Among a long list of projects:
oMovenpick Accra, Ghana
o Movenpick Anwar Al Madina
oMovenpick Beirut , Lebanon
o Movenpick Makkah, KSA
oPark Hyatt, Sochi, Russia
oRamada Hotel Dubai - Guestroom
oRenaissance Hotel, Kiev, Ukraine
oRitz Carlton Cairo
oRitz Carlton Dubai - Corridors
INVESTOR PRESENTATION - 16
Financial and Operational Performance
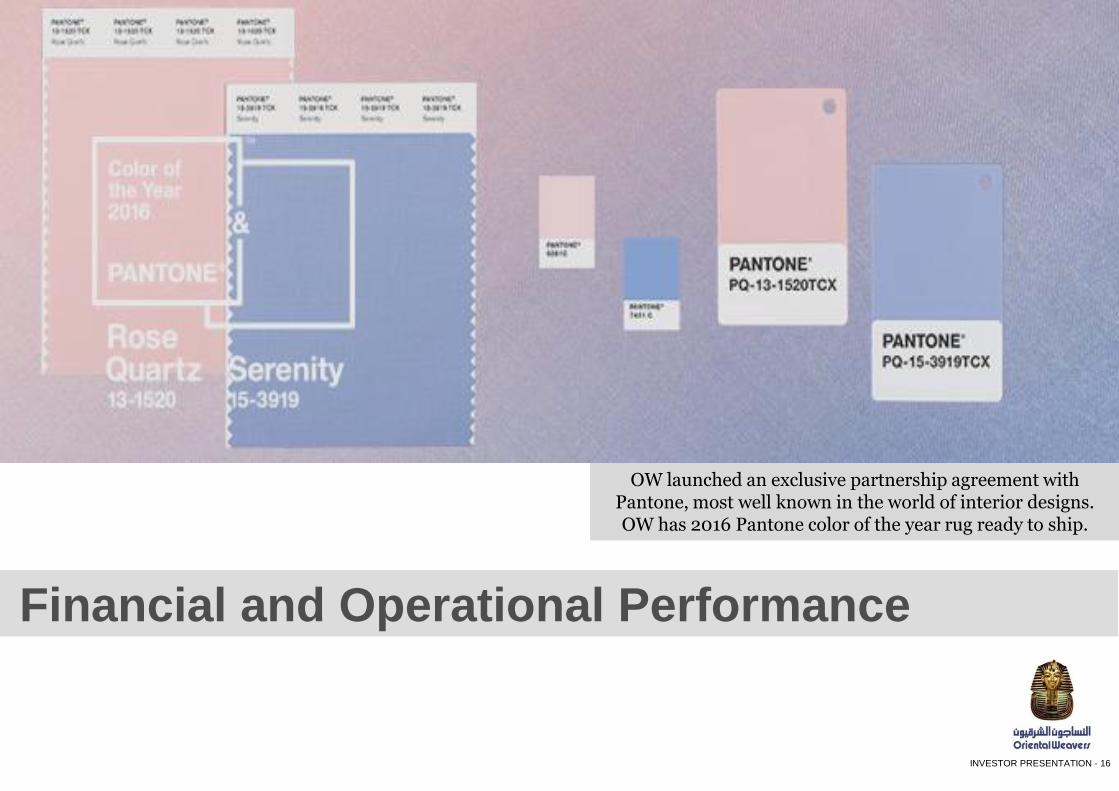
OW launched an exclusive partnership agreement with Pantone, most well known in the world of interior designs. OW has 2016 Pantone color of the year rug ready to ship.
INVESTOR PRESENTATION - 17
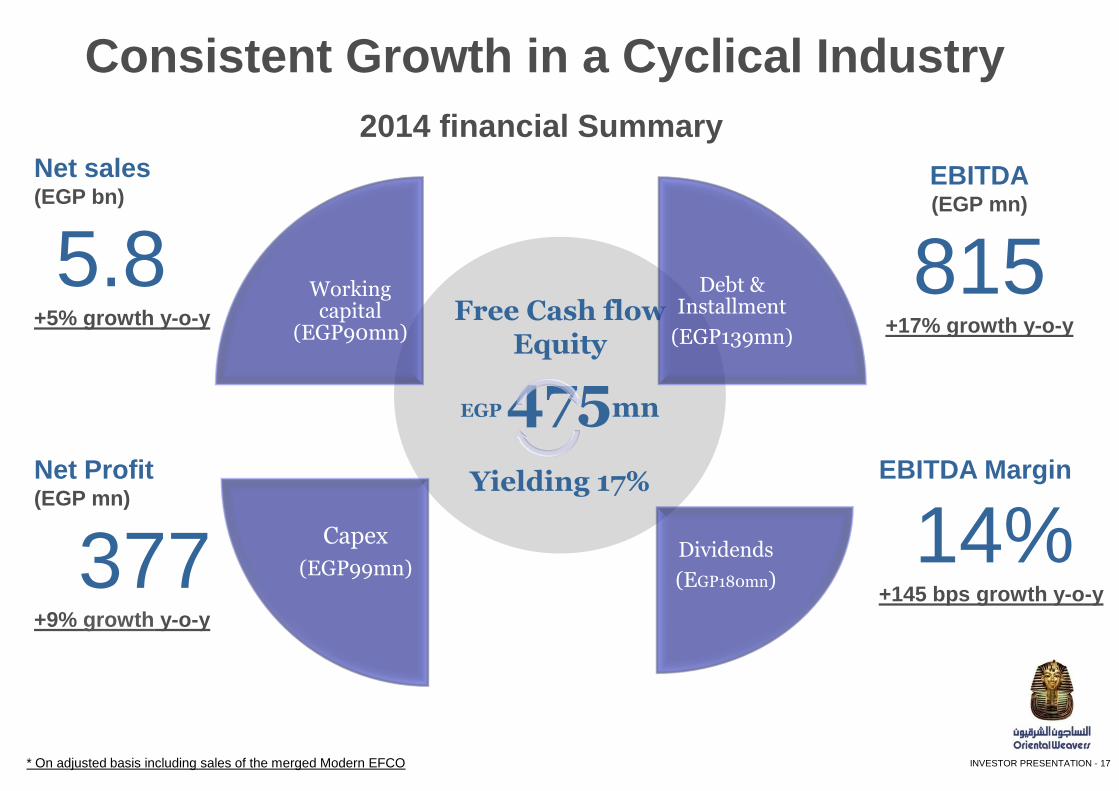
Consistent Growth in a Cyclical Industry
* On adjusted basis including sales of the merged Modern EFCO
Net sales (EGP bn)
5.8 +5% growth y-o-y
2014 financial Summary
Net Profit (EGP mn)
377 +9% growth y-o-y
EBITDA (EGP mn)
815 +17% growth y-o-y
EBITDA Margin
14% +145 bps growth y-o-y
Free Cash flow Equity
EGP 475mn
Yielding 17%
Working capital
(EGP90mn)
Debt & Installment
(EGP139mn)
Dividends
(EGP180mn)
Capex
(EGP99mn)
INVESTOR PRESENTATION - 18
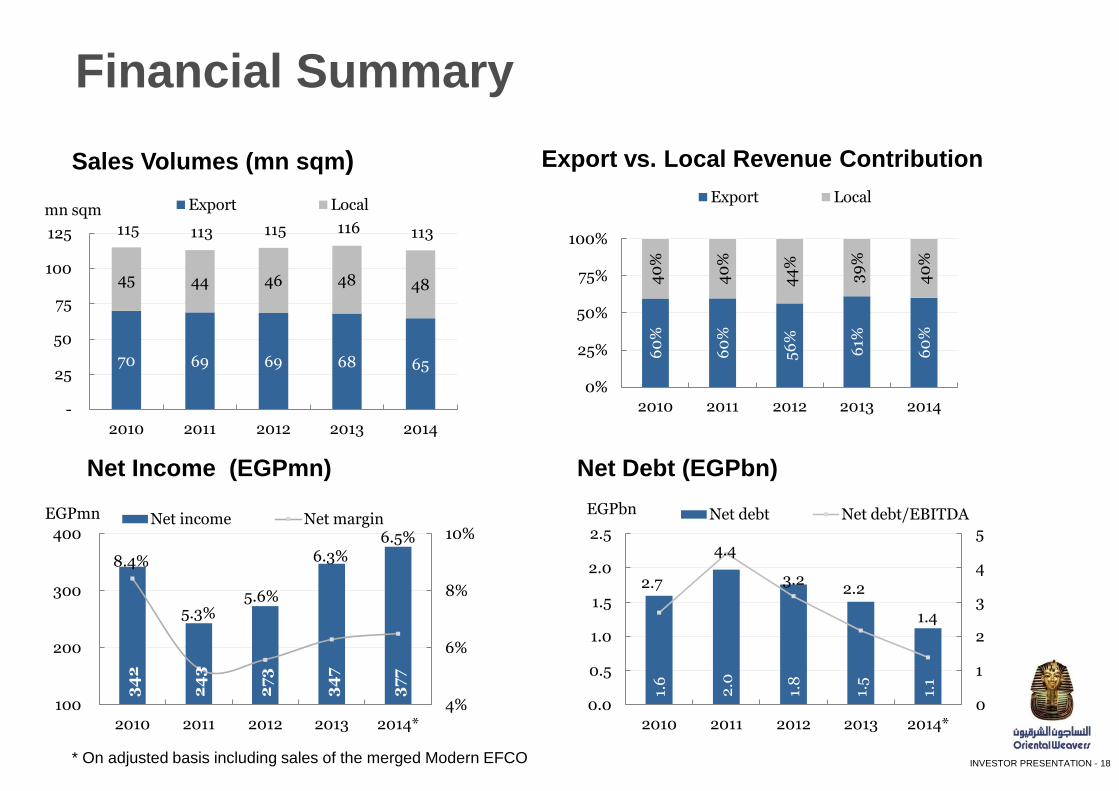
Financial Summary
Sales Volumes (mn sqm) Export vs. Local Revenue Contribution
Net Income (EGPmn) Net Debt (EGPbn)
70 69 69 68 65
45 44 46 48 48
115 113 115 116 113
-
25
50
75
100
125
2010 2011 2012 2013 2014
mn sqm Export Local
60
%
60
%
56
%
61%
60
%
40
%
40
%
44
%
39
%
40
%
0%
25%
50%
75%
100%
2010 2011 2012 2013 2014
Export Local
34
2
24
3
27
3
34
7
37
7
8.4%
5.3% 5.6%
6.3% 6.5%
4%
6%
8%
10%
100
200
300
400
2010 2011 2012 2013 2014*
EGPmn Net income Net margin
1.6
2.0
1.8
1.5
1.1
2.7
4.4
3.2 2.2
1.4
0
1
2
3
4
5
0.0
0.5
1.0
1.5
2.0
2.5
2010 2011 2012 2013 2014*
EGPbn Net debt Net debt/EBITDA
* On adjusted basis including sales of the merged Modern EFCO
INVESTOR PRESENTATION - 19
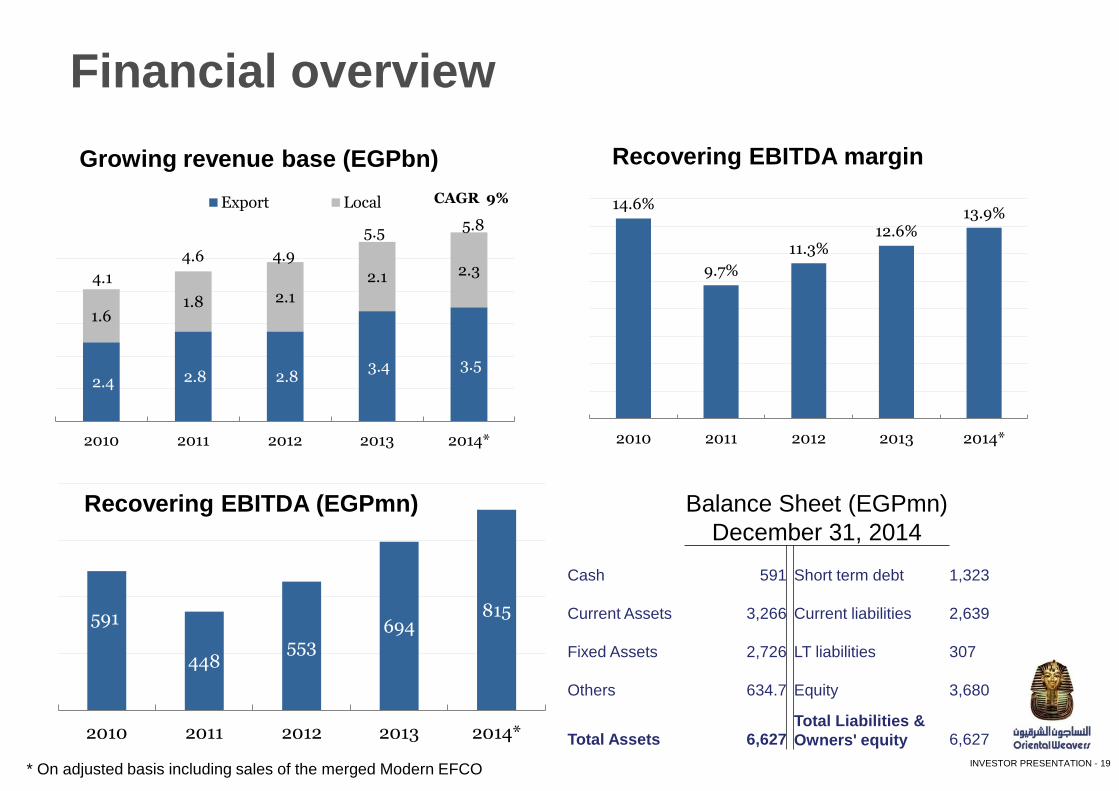
Financial overview
* On adjusted basis including sales of the merged Modern EFCO
2.4 2.8 2.8 3.4 3.5
1.6 1.8 2.1
2.1 2.3 4.1
4.6 4.9
5.5 5.8
2010 2011 2012 2013 2014*
Export Local CAGR 9%
Growing revenue base (EGPbn)
591
448 553
694 815
2010 2011 2012 2013 2014*
Recovering EBITDA (EGPmn)
14.6%
9.7%
11.3% 12.6%
13.9%
2010 2011 2012 2013 2014*
Recovering EBITDA margin
Balance Sheet (EGPmn)
December 31, 2014
Cash 591 Short term debt
1,323
Current Assets 3,266 Current liabilities
2,639
Fixed Assets 2,726 LT liabilities
307
Others 634.7 Equity
3,680
Total Assets 6,627 Total Liabilities &
Owners' equity
6,627
INVESTOR PRESENTATION - 20
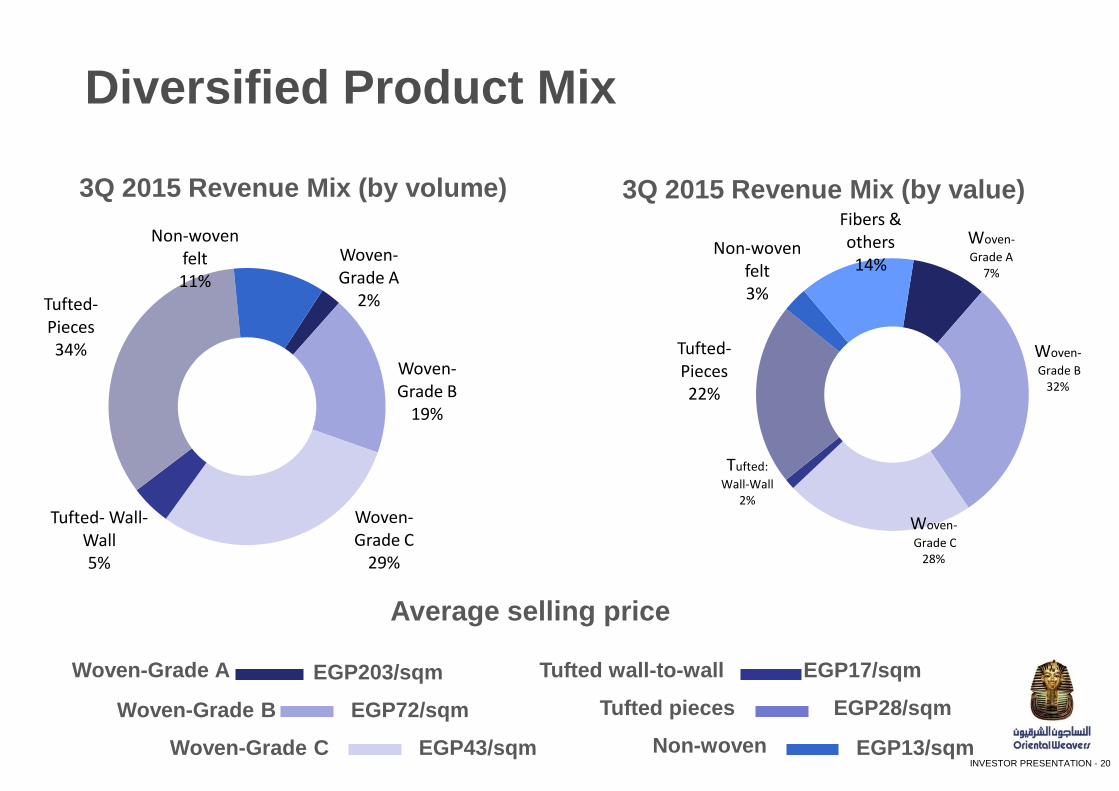
Diversified Product Mix
3Q 2015 Revenue Mix (by volume) 3Q 2015 Revenue Mix (by value)
Woven-
Grade A 7%
Woven-
Grade B 32%
Woven-
Grade C 28%
Tufted:
Wall-Wall 2%
Tufted- Pieces 22%
Non-woven felt 3%
Fibers & others 14%
Woven- Grade A
2%
Woven- Grade B
19%
Woven- Grade C
29%
Tufted- Wall-Wall 5%
Tufted- Pieces 34%
Non-woven felt 11%
EGP203/sqm
EGP72/sqm
EGP43/sqm
EGP17/sqm
EGP28/sqm
EGP13/sqm
Woven-Grade A
Non-woven
Tufted pieces
Tufted wall-to-wall
Woven-Grade C
Woven-Grade B
Average selling price
INVESTOR PRESENTATION - 21
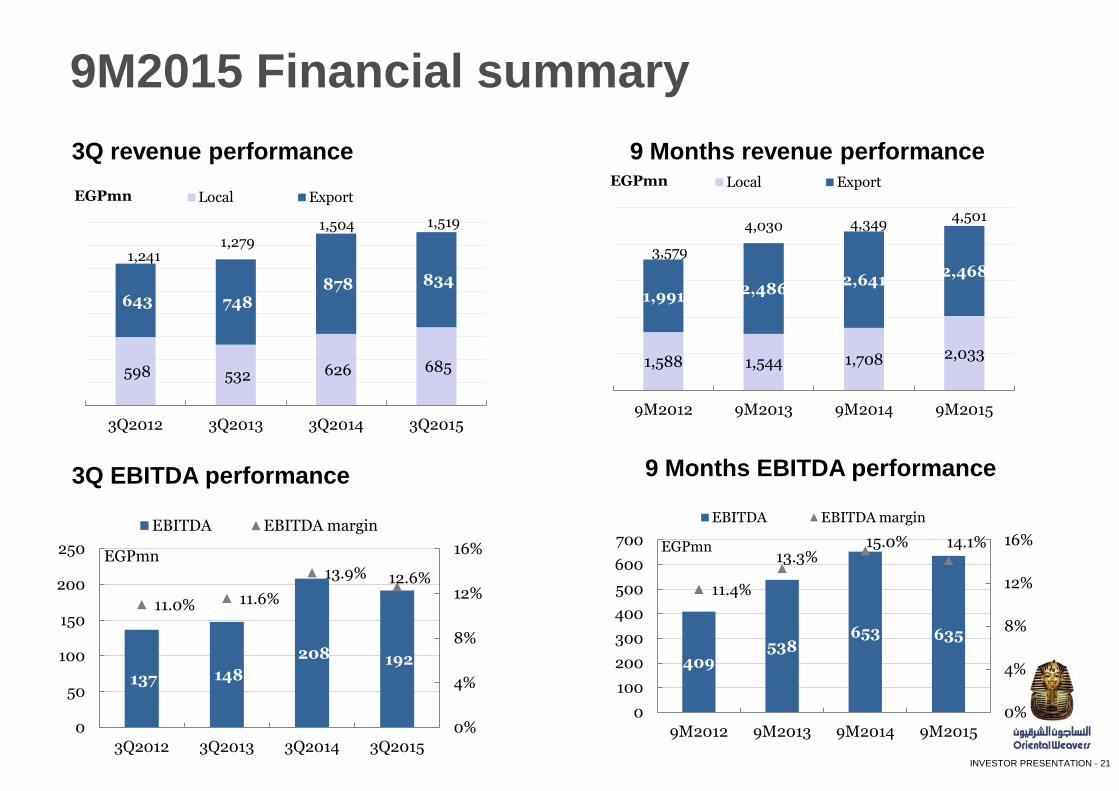
9M2015 Financial summary
3Q revenue performance
3Q EBITDA performance
9 Months revenue performance
9 Months EBITDA performance
598 532 626 685
643 748 878 834
1,241 1,279
1,504 1,519
3Q2012 3Q2013 3Q2014 3Q2015
EGPmn Local Export
1,588 1,544 1,708 2,033
1,991 2,486 2,641
2,468
3,579
4,030 4,349 4,501
9M2012 9M2013 9M2014 9M2015
EGPmn Local Export
409 538
653 635
11.4%
13.3% 15.0% 14.1%
0%
4%
8%
12%
16%
0
100
200
300
400
500
600
700
9M2012 9M2013 9M2014 9M2015
EGPmn
EBITDA EBITDA margin
137 148
208 192
11.0% 11.6%
13.9% 12.6%
0%
4%
8%
12%
16%
0
50
100
150
200
250
3Q2012 3Q2013 3Q2014 3Q2015
EGPmn
EBITDA EBITDA margin
INVESTOR PRESENTATION - 22
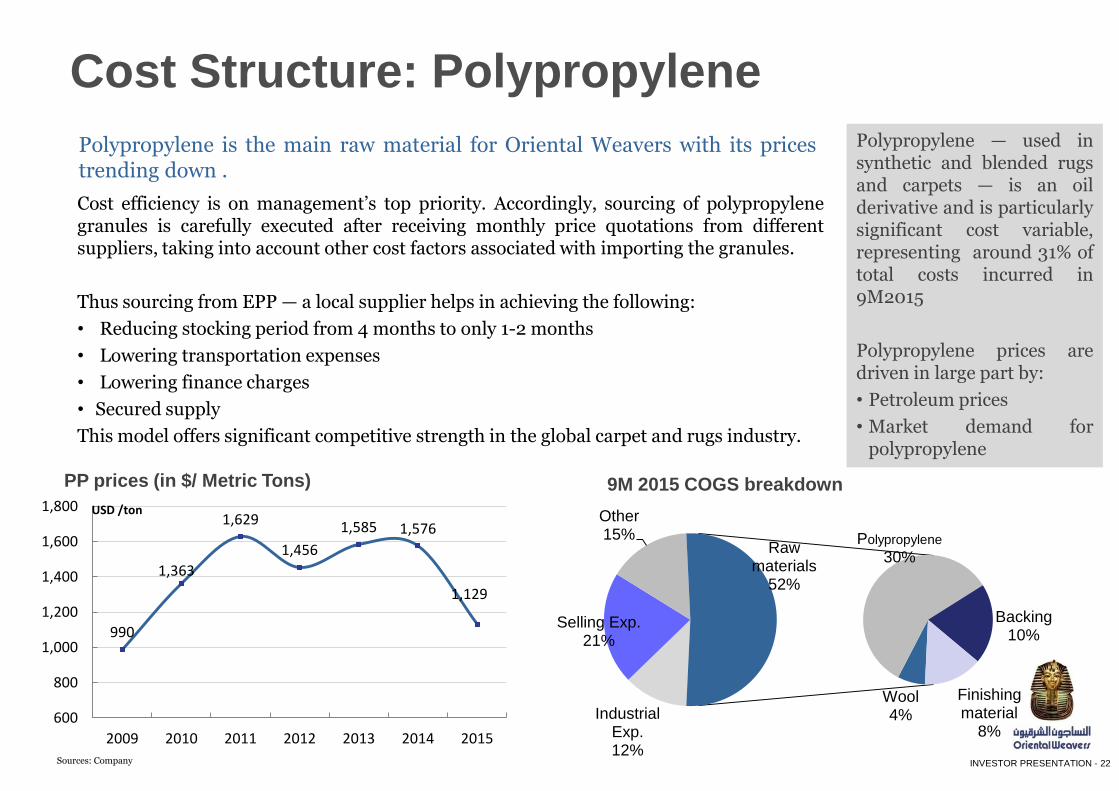
Cost Structure: Polypropylene
Polypropylene is the main raw material for Oriental Weavers with its prices trending down .
Cost efficiency is on management’s top priority. Accordingly, sourcing of polypropylene granules is carefully executed after receiving monthly price quotations from different suppliers, taking into account other cost factors associated with importing the granules.
Thus sourcing from EPP — a local supplier helps in achieving the following:
• Reducing stocking period from 4 months to only 1-2 months
• Lowering transportation expenses
• Lowering finance charges
• Secured supply
This model offers significant competitive strength in the global carpet and rugs industry.
Sources: Company
9M 2015 COGS breakdown
Polypropylene — used in synthetic and blended rugs and carpets — is an oil derivative and is particularly significant cost variable, representing around 31% of total costs incurred in 9M2015
Polypropylene prices are driven in large part by:
• Petroleum prices
• Market demand for polypropylene
PP prices (in $/ Metric Tons)
Industrial Exp. 12%
Selling Exp. 21%
Other 15%
Wool 4%
Polypropylene 30%
Backing 10%
Finishing material
8%
Raw materials
52%
990
1,363
1,629
1,456
1,585 1,576
1,129
600
800
1,000
1,200
1,400
1,600
1,800
2009 2010 2011 2012 2013 2014 2015
USD /ton
INVESTOR PRESENTATION - 23
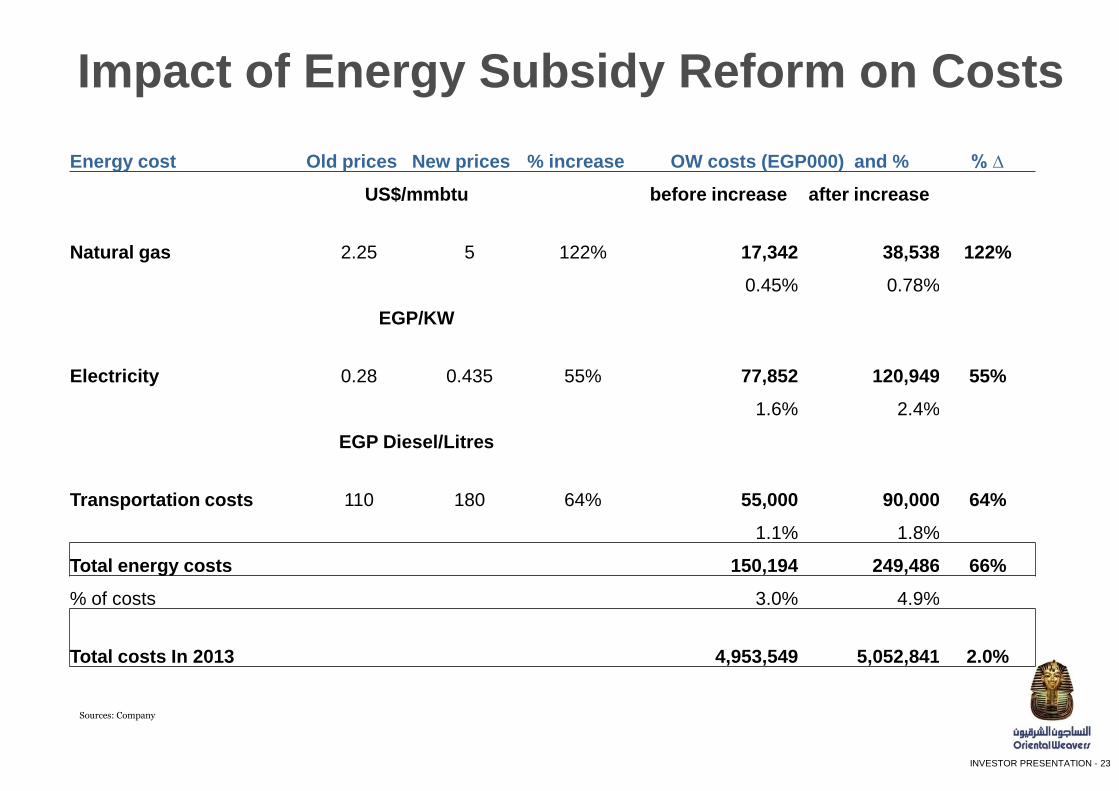
Impact of Energy Subsidy Reform on Costs
Sources: Company
Energy cost Old prices New prices % increase OW costs (EGP000) and % % ∆
US$/mmbtu before increase after increase
Natural gas 2.25 5 122%
17,342 38,538 122%
0.45% 0.78%
EGP/KW
Electricity 0.28 0.435 55%
77,852 120,949 55%
1.6% 2.4%
EGP Diesel/Litres
Transportation costs 110 180 64%
55,000 90,000 64%
1.1% 1.8%
Total energy costs 150,194 249,486 66%
% of costs 3.0% 4.9%
Total costs In 2013 4,953,549 5,052,841 2.0%
INVESTOR PRESENTATION - 24
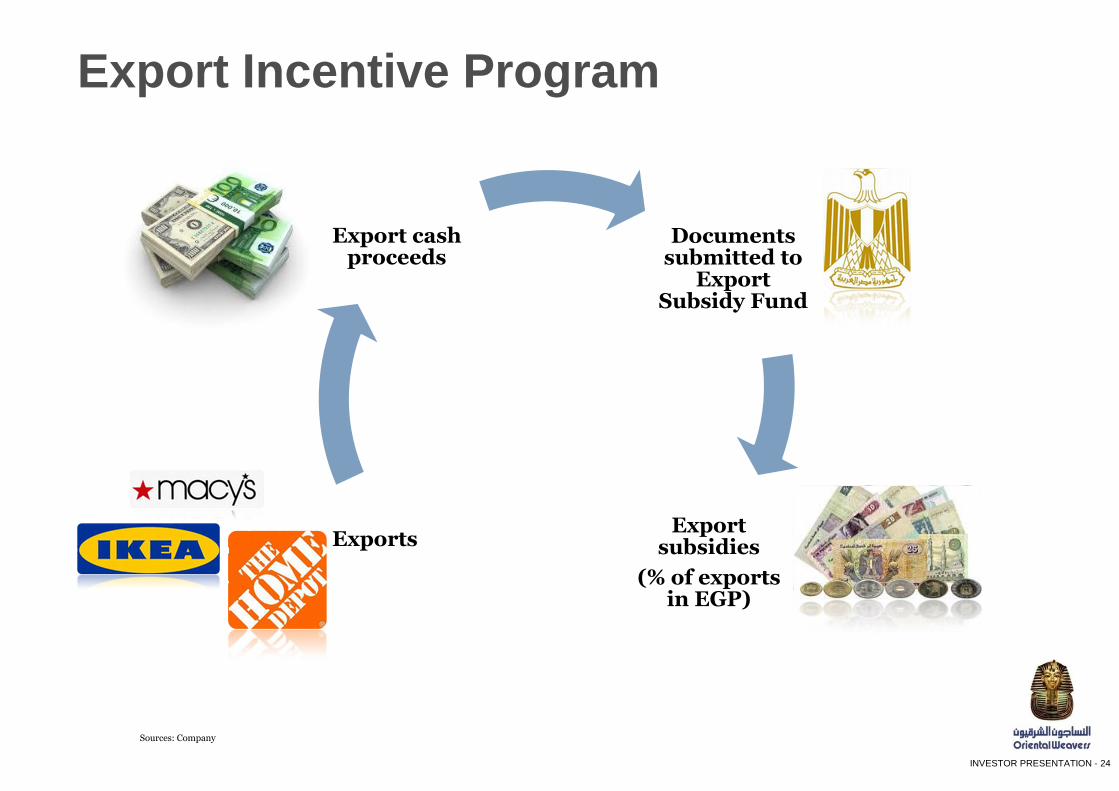
Documents submitted to
Export Subsidy Fund
Export subsidies
(% of exports in EGP)
Exports
Export cash proceeds
Export Incentive Program
Sources: Company
INVESTOR PRESENTATION - 25
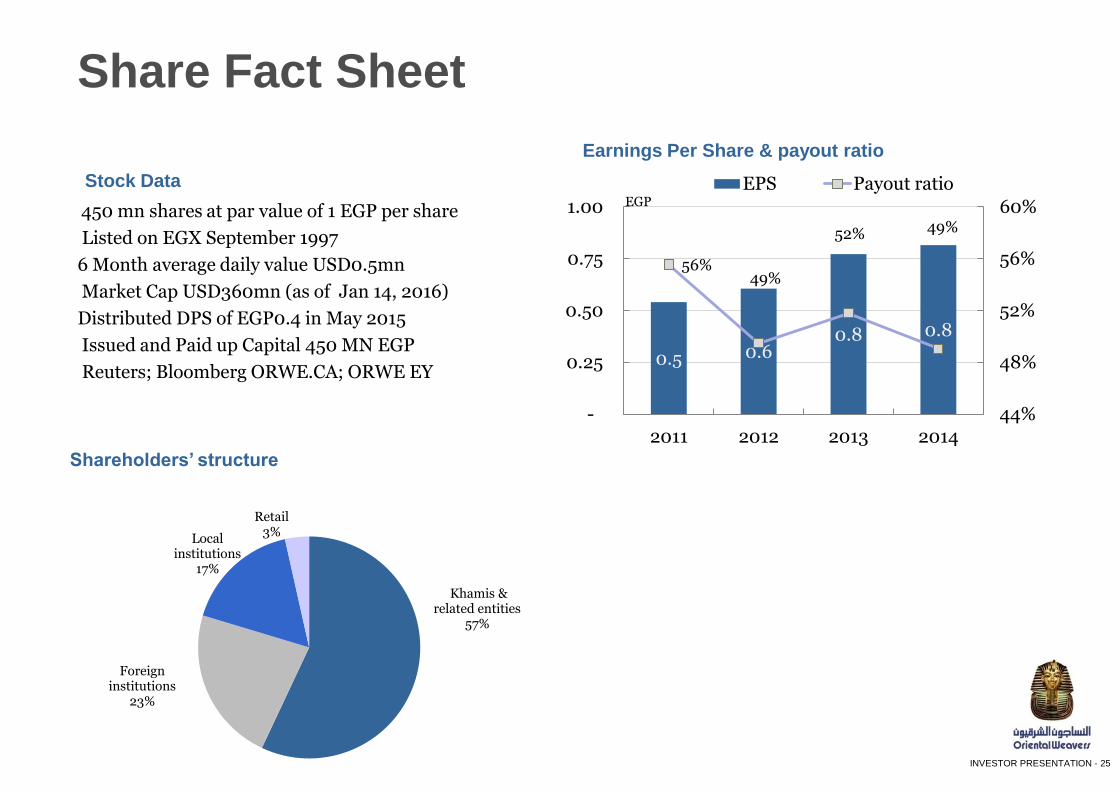
Share Fact Sheet
Stock Data
450 mn shares at par value of 1 EGP per share
Listed on EGX September 1997
6 Month average daily value USD0.5mn
Market Cap USD360mn (as of Jan 14, 2016)
Distributed DPS of EGP0.4 in May 2015
Issued and Paid up Capital 450 MN EGP
Reuters; Bloomberg ORWE.CA; ORWE EY
Shareholders’ structure
Earnings Per Share & payout ratio
0.5 0.6 0.8 0.8
56% 49%
52% 49%
44%
48%
52%
56%
60%
-
0.25
0.50
0.75
1.00
2011 2012 2013 2014
EGP
EPS Payout ratio
Khamis & related entities
57%
Foreign institutions
23%
Local institutions
17%
Retail 3%
INVESTOR PRESENTATION - 26
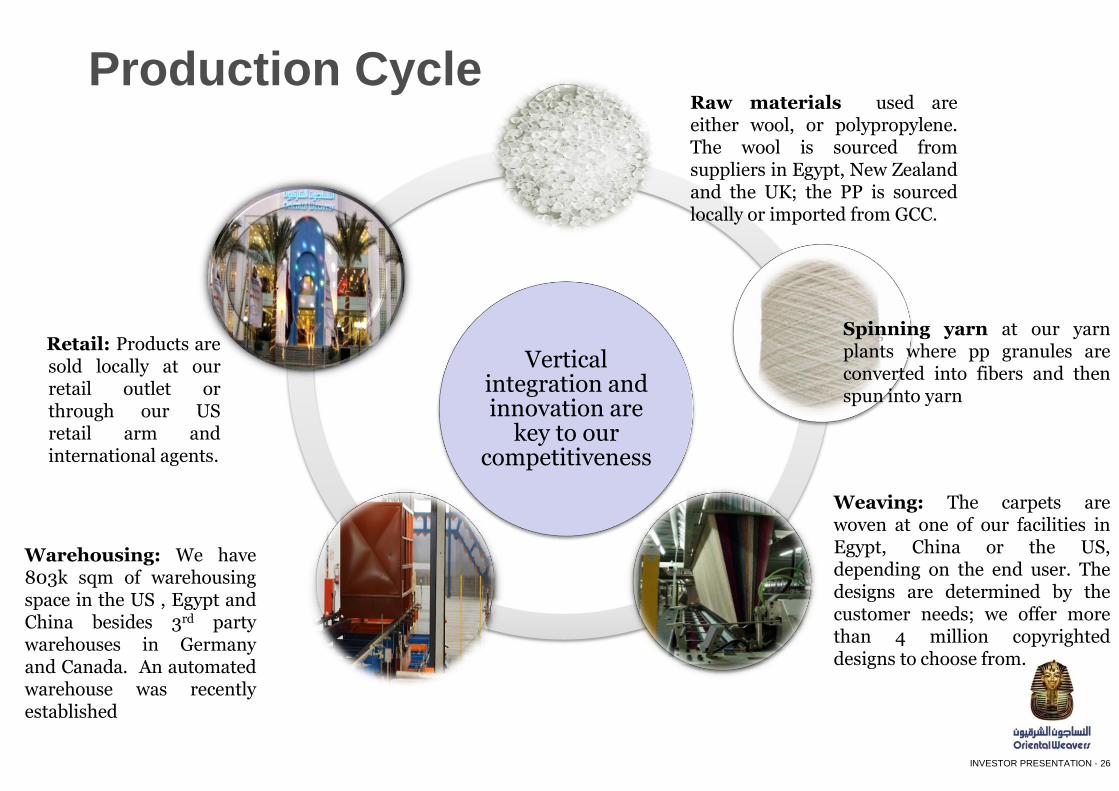
Vertical integration and innovation are
key to our competitiveness
Raw materials
Spinning & dying
Weaving & finishing
Warehousing
Retail stores
Raw materials used are either wool, or polypropylene. The wool is sourced from suppliers in Egypt, New Zealand and the UK; the PP is sourced locally or imported from GCC.
Spinning yarn at our yarn plants where pp granules are converted into fibers and then spun into yarn
Weaving: The carpets are woven at one of our facilities in Egypt, China or the US, depending on the end user. The designs are determined by the customer needs; we offer more than 4 million copyrighted designs to choose from.
Warehousing: We have 803k sqm of warehousing space in the US , Egypt and China besides 3rd party warehouses in Germany and Canada. An automated warehouse was recently established
Retail: Products are sold locally at our retail outlet or through our US retail arm and international agents.
Production Cycle
INVESTOR PRESENTATION - 27
Disclaimer
Certain information contained in this document consists of forward-looking statements reflecting the current view of the Company with respect to future events and are subject to certain risks, uncertainties and assumptions. Many factors could cause the actual results, performance or achievements of the Company to be materially different from any future results, performance, or achievements that may be expressed or implied by such forward-looking statements, including worldwide economic trends, the economic and political
climate of Egypt and the Middle East and changes in business strategy and various other factors. Should one or more of these risks or uncertainties materialize, or should underlying assumptions prove incorrect, actual results may vary materially from those described in such forward-looking statements. Recipients of this document are cautioned not to place any reliance on these forward-looking statements. The Company undertakes no obligation to republish revised forward-looking statements to reflect changed events or circumstances.
INVESTOR PRESENTATION - 28
For More Information:
Ingy Eldiwany
Investor Relations Manager
+202-22685166
www.orientalweavers.com


