138
Investor presentation 2015 annual results

Investor presentation2015 annual results

Notes
1Sanlam investor presentation 2015 annual results

Notes
The Sanlam strategy
Operating environment
Strategic delivery
Financial review
Priorities
Outlook
2 Sanlam investor presentation 2015 annual results

Notes
The Sanlam StrategyMaximising shareholder value
3Sanlam investor presentation 2015 annual results

Notes
Strategic focusOptimising value creation
Stra
tegi
c pi
llars
TransformationDiversification
Optimal capital utilisation
Operational efficienciesEarnings growth
Sustainable value creation for shareholders
Maximising RoGEV
4 Sanlam investor presentation 2015 annual results
Notes
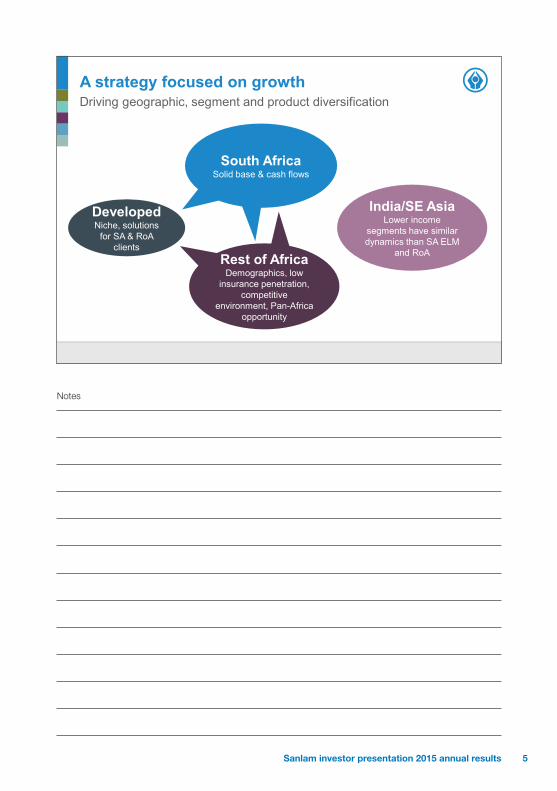
A strategy focused on growthDriving geographic, segment and product diversification
India/SE AsiaLower income
segments have similar dynamics than SA ELM
and RoA
DevelopedNiche, solutions
for SA & RoAclients
South AfricaSolid base & cash flows
Rest of AfricaDemographics, low
insurance penetration, competitive
environment, Pan-Africa opportunity
5Sanlam investor presentation 2015 annual results
Notes
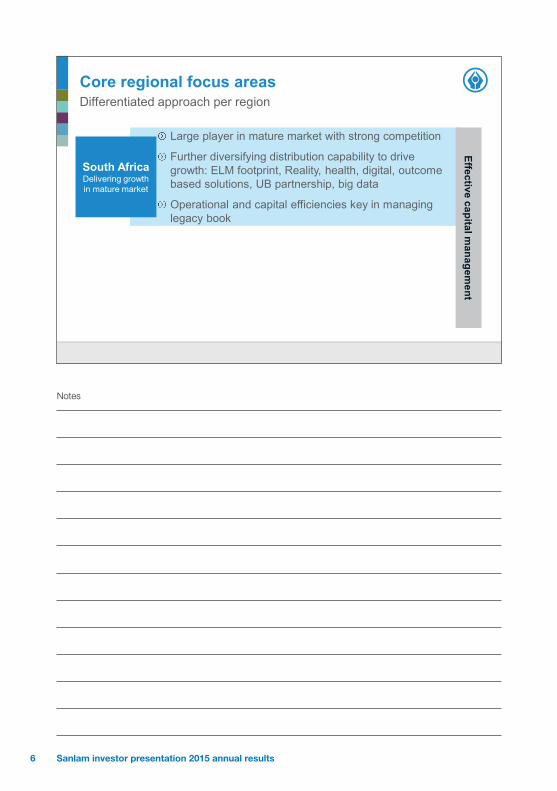
Core regional focus areasDifferentiated approach per region
Large player in mature market with strong competition
Further diversifying distribution capability to drive growth: ELM footprint, Reality, health, digital, outcome based solutions, UB partnership, big data
Operational and capital efficiencies key in managing legacy book
South AfricaDelivering growth in mature market
Effective capital managem
ent
6 Sanlam investor presentation 2015 annual results

Notes
Core regional focus areasDifferentiated approach per region
Large player in mature market with strong competition
Further diversifying distribution capability to drive growth: ELM footprint, Reality, health, digital, outcome based solutions, UB partnership, big data
Operational and capital efficiencies key in managing legacy book
South AfricaDelivering growth in
mature market
Focus on accelerated organic growth to obtain leadership position in all countries
Cross-border alliances and relationships; capitalise onexpanded footprint from Saham Finances transaction
Geographic expansion in line with client and intermediary needs
Other Emerging Markets
Balance structural and organic growth
Other Emerging Markets
Balance structural and organic growth
Other Emerging Markets
Balance structural and organic growth
Effective capital managem
ent
7Sanlam investor presentation 2015 annual results

Notes
Core regional focus areasDifferentiated approach per region
Focus on accelerated organic growth to obtain leadership position in all countries
Cross-border alliances and relationships; capitalise onexpanded footprint from Saham Finances transaction
Geographic expansion in line with client and intermediary needs
Other Emerging Markets
Balance structural and organic growth
Products and services for SA and Rest of Africa client base
Sanlam UK consolidation; focus on efficiencies and distribution under new CEO
Wealth and investment management focus
Developed Markets
Niche approach
Effective capital managem
ent
8 Sanlam investor presentation 2015 annual results

Notes
Operating EnvironmentEconomic, political and internal pressures
9Sanlam investor presentation 2015 annual results

Notes
External operating environmentGlobal events impacting on our key markets
Slower growth in
ChinaUS interest
rates
Government & consumer
debtCommodity
prices
Commodity-based
economies under pressure
10 Sanlam investor presentation 2015 annual results
Notes
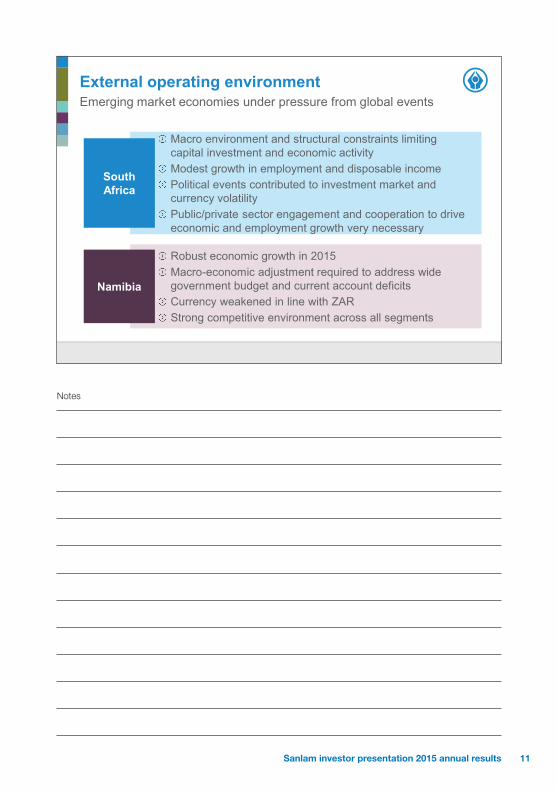
External operating environmentEmerging market economies under pressure from global events
Robust economic growth in 2015Macro-economic adjustment required to address wide government budget and current account deficitsCurrency weakened in line with ZARStrong competitive environment across all segments
Namibia
Macro environment and structural constraints limiting capital investment and economic activity Modest growth in employment and disposable incomePolitical events contributed to investment market and currency volatilityPublic/private sector engagement and cooperation to drive economic and employment growth very necessary
South Africa
11Sanlam investor presentation 2015 annual results

Notes
External operating environmentEmerging market economies under pressure from global events
Commodity prices and tight financial conditions impacting on growth and currencies of a number of countriesSofter economic growth to persist in 2016 Low insurance penetration enables new business growth despite short-term challengesLonger term growth potential remains intact
Rest of Africa
Best sovereign rating in Africa due to sound management of government financesRobust economic growth, but need to diversify economy away from reliance on diamondsBIHL maintains strong competitive advantage
Botswana
12 Sanlam investor presentation 2015 annual results
Notes
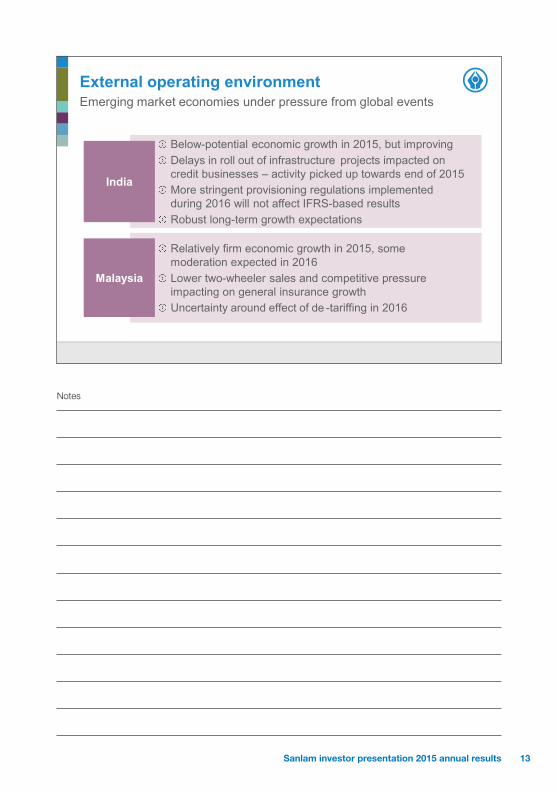
External operating environmentEmerging market economies under pressure from global events
Below-potential economic growth in 2015, but improvingDelays in roll out of infrastructure projects impacted on credit businesses – activity picked up towards end of 2015More stringent provisioning regulations implemented during 2016 will not affect IFRS-based resultsRobust long-term growth expectations
India
Relatively firm economic growth in 2015, some moderation expected in 2016Lower two-wheeler sales and competitive pressure impacting on general insurance growthUncertainty around effect of de -tariffing in 2016
Malaysia
13Sanlam investor presentation 2015 annual results

Notes
SA economy
Growth in real retail sales, GDP and PDI
Modest growth in all key metrics
-10%
-5%
0%
5%
10%
15%
20%
Growth y-o-y in real retail sales Growth y-o-y in real GDP Growth y-o-y in real PDI
14 Sanlam investor presentation 2015 annual results
Notes
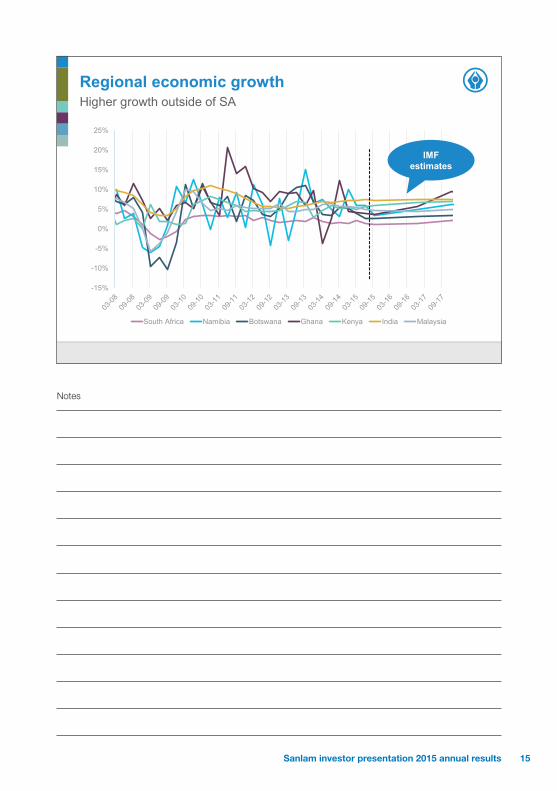
Regional economic growthHigher growth outside of SA
-15%
-10%
-5%
0%
5%
10%
15%
20%
25%
South Africa Namibia Botswana Ghana Kenya India Malaysia
IMF estimates
15Sanlam investor presentation 2015 annual results

Notes
4%
5%
6%
7%
8%
9%
10%
12-1
3
01-1
4
02-1
4
03-1
4
04-1
4
05-1
4
06-1
4
07-1
4
08-1
4
09-1
4
10-1
4
11-1
4
12-1
4
01-1
5
02-1
5
03-1
5
04-1
5
05-1
5
06-1
5
07-1
5
08-1
5
09-1
5
10-1
5
11-1
5
12-1
5
9-year 5-year Short-term Avg Short-term
+200bps
+40bps
Interest rates
SA bond yields and short-term interest rates
Higher SA rates; other regions stable
Impact on growthVNB overall -12%Sanlam Sky VNB -25%Higher float income
16 Sanlam investor presentation 2015 annual results
Notes
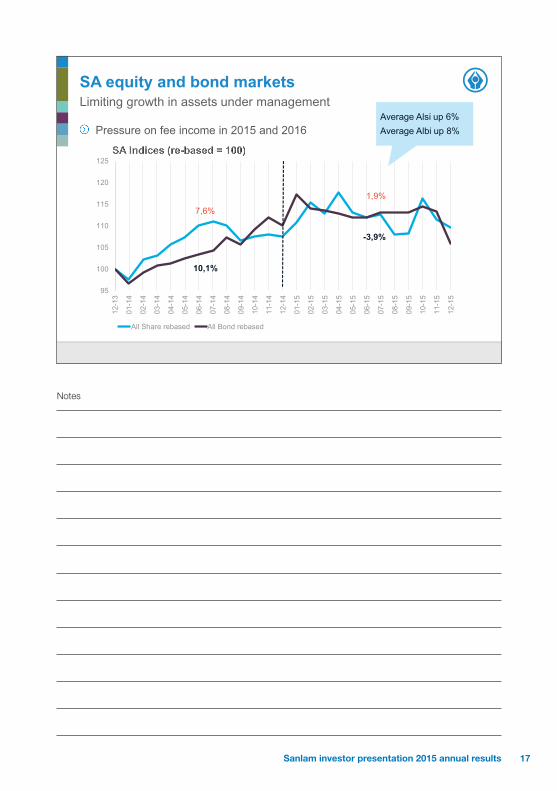
SA equity and bond markets
Pressure on fee income in 2015 and 2016
Limiting growth in assets under management
95
100
105
110
115
120
125
12-1
3
01-1
4
02-1
4
03-1
4
04-1
4
05-1
4
06-1
4
07-1
4
08-1
4
09-1
4
10-1
4
11-1
4
12-1
4
01-1
5
02-1
5
03-1
5
04-1
5
05-1
5
06-1
5
07-1
5
08-1
5
09-1
5
10-1
5
11-1
5
12-1
5
All Share rebased All Bond rebased
7,6%
1,9%
10,1%
-3,9%
Average Alsi up 6%Average Albi up 8%
17Sanlam investor presentation 2015 annual results

Notes
Rand exchange rateSharp depreciation in 2015 against most currencies
80
90
100
110
120
130
140
150
160
12-1
3
01-1
4
02-1
4
03-1
4
04-1
4
05-1
4
06-1
4
07-1
4
08-1
4
09-1
4
10-1
4
11-1
4
12-1
4
01-1
5
02-1
5
03-1
5
04-1
5
05-1
5
06-1
5
07-1
5
08-1
5
09-1
5
10-1
5
11-1
5
12-1
5
United Kingdom United States Botswana India Malaysia Rest of Africa
18 Sanlam investor presentation 2015 annual results
Notes
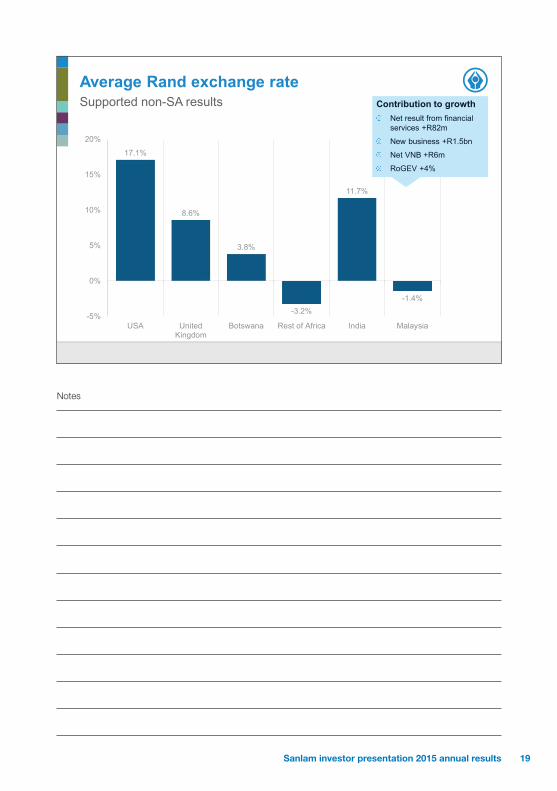
Average Rand exchange rateSupported non-SA results
17.1%
8.6%
3.8%
-3.2%
11.7%
-1.4%
-5%
0%
5%
10%
15%
20%
USA UnitedKingdom
Botswana Rest of Africa India Malaysia
Contribution to growthNet result from financial services +R82m
New business +R1.5bn
Net VNB +R6m
RoGEV +4%
19Sanlam investor presentation 2015 annual results

Notes
Internal operating environment2015 results impacted by internal challenges and one-offs
Bad debt provisioning at STFC equipment financeOne-off item in Shriram Capital 2014 base System implementation challenges in KenyaActuarial reserving in Malaysia
Sanlam Emerging Markets
Loss of PIC funds in 2014 and 2015 impacting on SI results SI admin costs elevated by projects, regulatory compliance and additional marketing spendOne-off items in 2014 base at SEB and SI International (UK)
Sanlam Investments
20 Sanlam investor presentation 2015 annual results
Notes
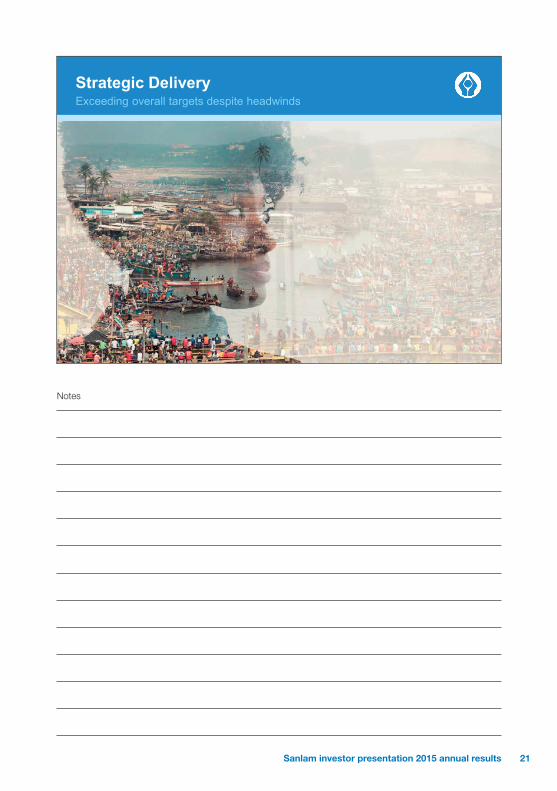
Strategic DeliveryExceeding overall targets despite headwinds
21Sanlam investor presentation 2015 annual results

Notes
Top-line earnings growth
Earnings per shareNet operating profit per share increased by 6% (11% excl one-offs)Normalised headline earnings per share up 6%
Business volumesNew business volumes increased by 16% to R211bnNet fund inflows of R19bnNet life VNB up 6% on comparable basis & excl large SEB policy in ‘14Net VNB margin of 2.91% on comparable basis
Group Equity ValueGroup Equity Value of R50.57 per shareRoGEV per share of 12.8%
Financial performance in 2015
22 Sanlam investor presentation 2015 annual results

Notes
DiversificationInternational positioning focused on emerging markets
India
Malaysia
Philippines
Ghana
The Gambia
KenyaUganda
RwandaBurundiTanzania
MalawiZambia
BotswanaNamibia
Swaziland
South Africa
Switzerland
United Kingdom
USA
Australia
Ireland
Mozambique
MoroccoAlgeria
Tunisia
MaliSenegal
GuineaBurkina Faso
Cote D’Ivoire
TogoBeninNigeria
CameroonGabon
Republic of the CongoAngola
Zimbabwe
MadagascarMauritius
Lesotho
Emerging Markets - Indirect presence
Emerging Markets - Direct presence
Developed Markets
Saham Finances presence
Sanlam and Saham Finances presence
23Sanlam investor presentation 2015 annual results
Notes
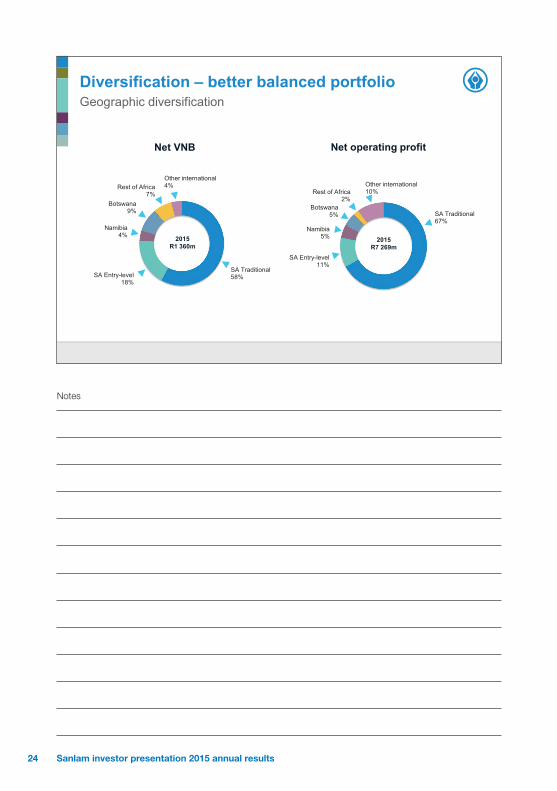
SA Traditional58%SA Entry-level
18%
Namibia4%
Botswana9%
Rest of Africa7%
Other international4%
2015R1 360m
SA Traditional67%
SA Entry-level11%
Namibia5%
Botswana5%
Rest of Africa2%
Other international10%
Diversification – better balanced portfolioGeographic diversification
Net VNB Net operating profit
2015R7 269m
24 Sanlam investor presentation 2015 annual results

Notes
Life business46%
General insurance15%
Investment management
14%
Credit & structuring10%
Admin, health & other15%
2015R103 506m
Life business62%
General insurance14%
Investment management
12%
Credit & structuring11%
Admin, health & other1%
Diversification – better balanced portfolioLine of business diversification
Group Equity Value Net operating profit
2015R7 269m
25Sanlam investor presentation 2015 annual results
Notes
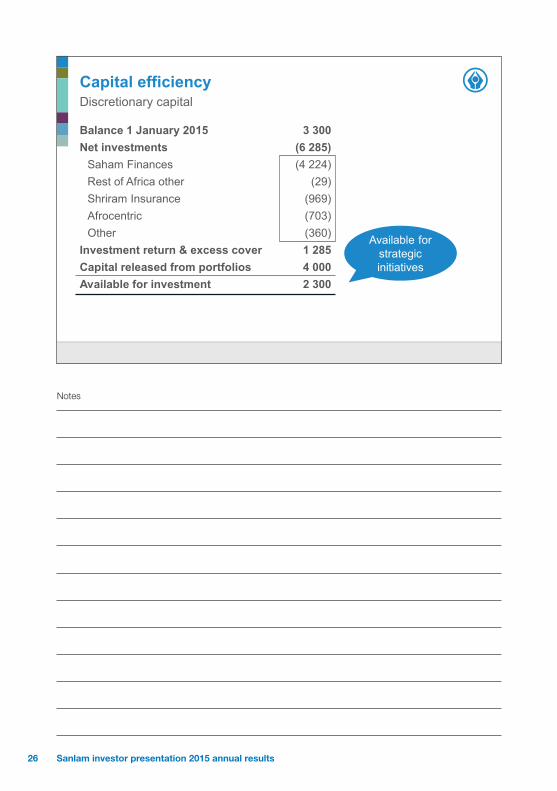
Capital efficiency
Balance 1 January 2015 3 300 Net investments (6 285)
Saham Finances (4 224)Rest of Africa other (29)Shriram Insurance (969)Afrocentric (703)Other (360)
Investment return & excess cover 1 285 Capital released from portfolios 4 000Available for investment 2 300
Discretionary capital
Available for strategic initiatives
26 Sanlam investor presentation 2015 annual results

Notes
Financial Review
27Sanlam investor presentation 2015 annual results

Notes
Changes in presentation / key assumptions
Accounting policies & basis of presentationNo change from 2014
Changes in RDR:Sanlam Life (10.1%): 200 bps up from December 2014Sanlam Sky (9.6%): 200 bps up from December 2014Negative impact on RoGEV and VNB
Weaker Rand exchange rate largely offset adverse impact of higher interest rates in SA and Namibia, apart from VNB
28 Sanlam investor presentation 2015 annual results
Notes
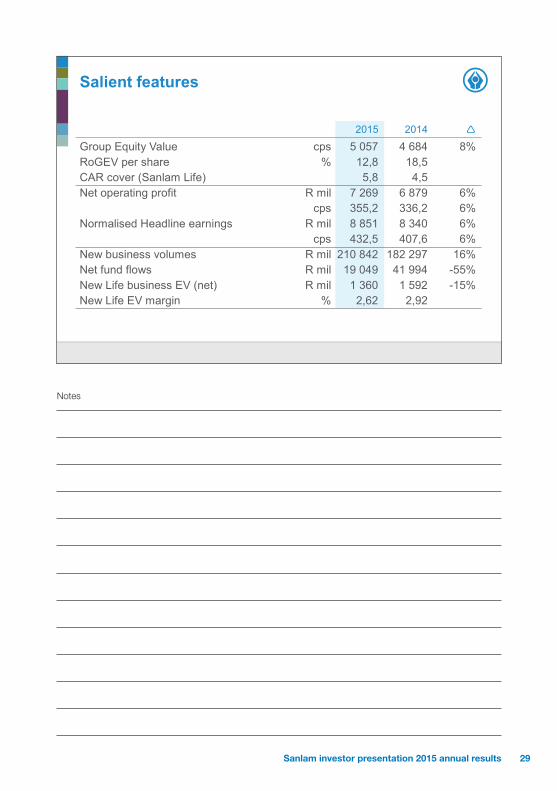
Salient features
2015 2014
Group Equity Value cps 5 057 4 684 8%RoGEV per share % 12,8 18,5CAR cover (Sanlam Life) 5,8 4,5Net operating profit R mil 7 269 6 879 6%
cps 355,2 336,2 6% Normalised Headline earnings R mil 8 851 8 340 6%
cps 432,5 407,6 6% New business volumes R mil 210 842 182 297 16% Net fund flows R mil 19 049 41 994 -55% New Life business EV (net) R mil 1 360 1 592 -15% New Life EV margin % 2,62 2,92
29Sanlam investor presentation 2015 annual results
Notes
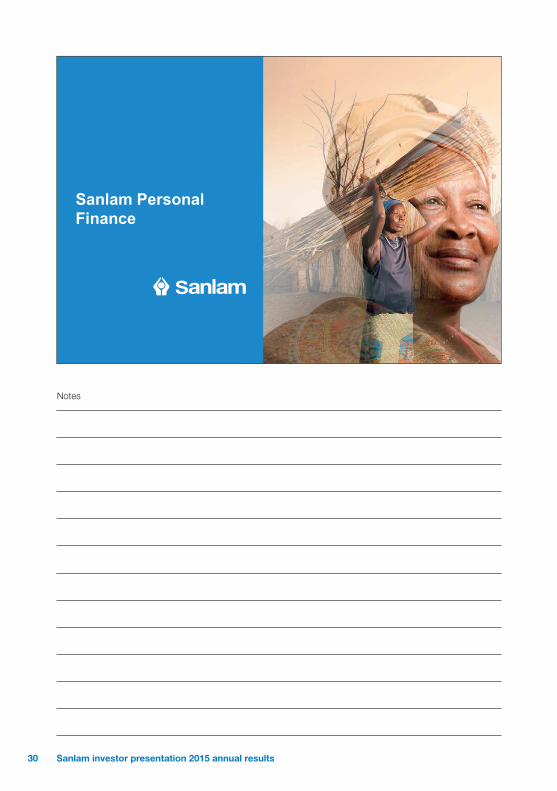
Sanlam Personal Finance
30 Sanlam investor presentation 2015 annual results
Notes
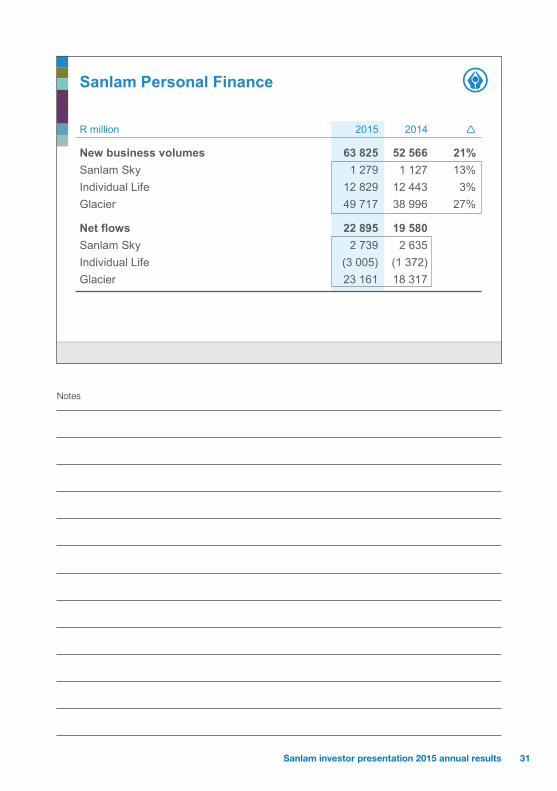
Sanlam Personal Finance
R million 2015 2014
New business volumes 63 825 52 566 21% Sanlam Sky 1 279 1 127 13% Individual Life 12 829 12 443 3% Glacier 49 717 38 996 27%
Net flows 22 895 19 580Sanlam Sky 2 739 2 635Individual Life (3 005) (1 372)Glacier 23 161 18 317
31Sanlam investor presentation 2015 annual results

Notes
Sanlam Personal Finance
R million 2015 2014
Value of new life business 955 1 084 -12% Sanlam Sky 241 361 -33% Individual Life 502 551 -9% Glacier 212 172 23%Comparable economic basis 1 148 1 084 6%
New business margin 2,48% 3,12%Sanlam Sky 5,86% 9,51%Individual Life 2,59% 2,88%Glacier 1,40% 1,45%Comparable economic basis 2,89% 3,12%
32 Sanlam investor presentation 2015 annual results
Notes
Sanlam Personal Finance
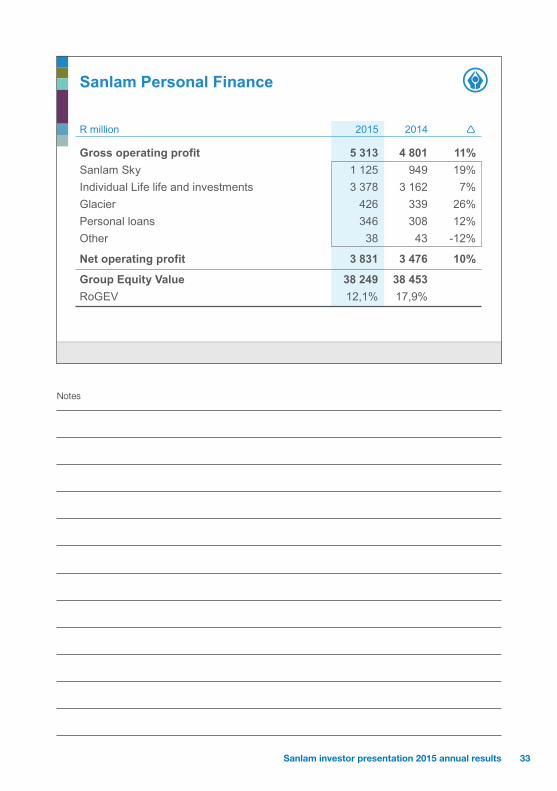
R million 2015 2014
Gross operating profit 5 313 4 801 11% Sanlam Sky 1 125 949 19% Individual Life life and investments 3 378 3 162 7% Glacier 426 339 26% Personal loans 346 308 12% Other 38 43 -12%
Net operating profit 3 831 3 476 10%
Group Equity Value 38 249 38 453 RoGEV 12,1% 17,9%
label
33Sanlam investor presentation 2015 annual results
Notes
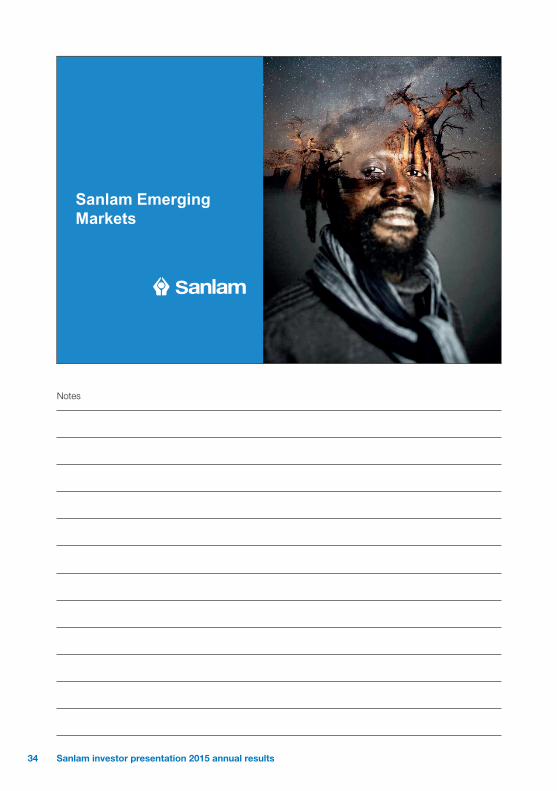
Sanlam Emerging Markets
34 Sanlam investor presentation 2015 annual results

Notes
Sanlam Emerging Markets
R million 2015 2014
New business volumes 11 913 9 259 29% Namibia 2 780 3 322 -16% Botswana 5 398 3 031 78% Rest of Africa 2 099 1 560 35% India/Malaysia 1 636 1 346 22%
Net fund flows (7 346) 3 971Namibia 358 1 021Botswana (9 781) 1 129Rest of Africa 1 459 1 451India/Malaysia 618 370
Value of new life business 448 431 4% Margin 5,97% 7,60%
35Sanlam investor presentation 2015 annual results

Notes
Sanlam Emerging Markets
R million 2015 2014
Gross operating profit 2 248 2 213 2% Namibia 618 534 16% Botswana 858 706 22%Rest of Africa 208 265 -22%India/Malaysia 572 749 -24%Corporate (8) (41) 80%
Net operating profit 1 197 1 241 -4%
Group equity value 18 047 14 571 RoGEV 29,9% 28,0%
36 Sanlam investor presentation 2015 annual results

Notes
Sanlam Investments
37Sanlam investor presentation 2015 annual results
Notes
Sanlam Investments
R million 2015 2014
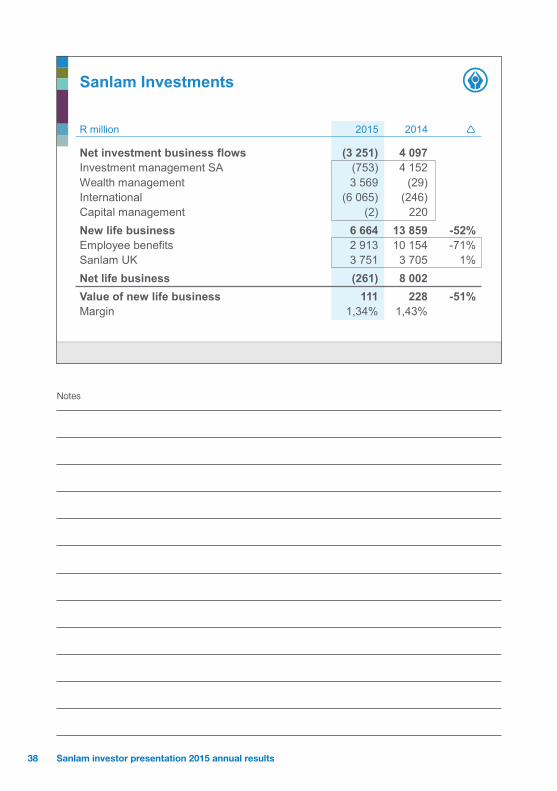
Net investment business flows (3 251) 4 097Investment management SA (753) 4 152Wealth management 3 569 (29)International (6 065) (246)Capital management (2) 220New life business 6 664 13 859 -52% Employee benefits 2 913 10 154 -71% Sanlam UK 3 751 3 705 1% Net life business (261) 8 002Value of new life business 111 228 -51% Margin 1,34% 1,43%
38 Sanlam investor presentation 2015 annual results

Notes
Sanlam Investments
R million 2015 2014
Gross operating profit 1 877 1 927 -3% Investment management 1 205 1 337 -10%Employee benefits 501 325 54% Capital management 171 265 -35%
Net operating profit 1 417 1 468 -3%
Group Equity Value 22 412 20 122 Covered business 7 210 7 833 Other 15 202 12 289 RoGEV 21,3% 20,4%
39Sanlam investor presentation 2015 annual results

Notes
Sanlam Investments
Percentage of SIM’s benchmark-managed funds exceeding hurdle
Investment performance
2011
2012
2013
2014
2015
Rolling 3 year Rolling 5 year
100% 80% 60% 40% 20% 0% 20% 40% 60% 80% 100%
40 Sanlam investor presentation 2015 annual results

Notes
Santam
41Sanlam investor presentation 2015 annual results
Notes
Santam
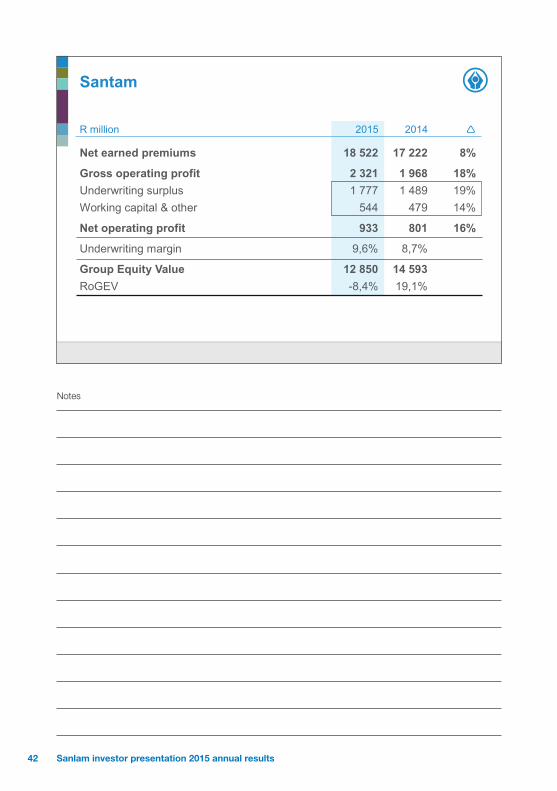
R million 2015 2014
Net earned premiums 18 522 17 222 8%
Gross operating profit 2 321 1 968 18% Underwriting surplus 1 777 1 489 19% Working capital & other 544 479 14%
Net operating profit 933 801 16%
Underwriting margin 9,6% 8,7%
Group Equity Value 12 850 14 593RoGEV -8,4% 19,1%
42 Sanlam investor presentation 2015 annual results
Notes
Sanlam Group
43Sanlam investor presentation 2015 annual results

Notes
Business flows
Gross NetR million 2015 2014 2015 2014
by businessPersonal Finance 63 825 52 566 21% 22 895 19 580 Emerging Markets 11 913 9 259 29% (7 346) 3 971 Sanlam Investments 116 582 103 250 13% (3 512) 12 099 Santam 18 522 17 222 8% 7 012 6 344
by licenceLife insurance 39 976 42 290 -5% 12 081 18 430 Investment 150 670 121 383 24% (523) 16 853 General insurance 20 196 18 624 8% 7 491 6 711
Total 210 842 182 297 16% 19 049 41 994
44 Sanlam investor presentation 2015 annual results

Notes
Operational efficiencies
Persistency – SA middle-income market
Focus on quality supports net fund flows
4.8
3.9 3.9 3.6
3.4 3.8 3.9
3.0 2.9 2.9 2.8 2.9 2.9
4.2 4.0
3.8 3.7 3.6
4.2
3.4
2.9 2.8 2.7 2.9 2.8 2.8
0
0.5
1
1.5
2
2.5
3
3.5
4
4.5
5
2003 2004 2005 2006 2007 2008 2009 2010 2011 2012 2013 2014 2015
Lapses, surrenders & fully paid-ups as % of in-force per half year
H1 H2
45Sanlam investor presentation 2015 annual results
Notes
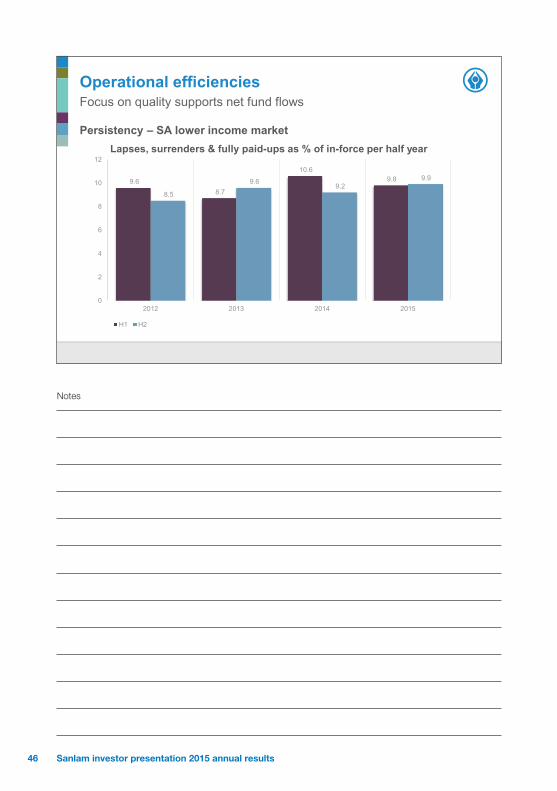
Operational efficiencies
Persistency – SA lower income market
Focus on quality supports net fund flows
9.6 8.7
10.6 9.8
8.5
9.6 9.2
9.9
0
2
4
6
8
10
12
2012 2013 2014 2015
Lapses, surrenders & fully paid-ups as % of in-force per half year
H1 H2
46 Sanlam investor presentation 2015 annual results

Notes
Value of new covered business
Value of New Business MarginR million 2015 2014 2015 2014
Personal Finance 955 1 084 -12% 2,48% 3,12%
Emerging Markets 448 431 4% 5,97% 7,60%
Employee Benefits 85 198 -57% 1,96% 1,66%
Sanlam UK 26 30 -13% 0,66% 0,75%
Total 1 514 1 743 -13% 2,80% 3,09%
Net of minorities 1 360 1 592 -15% 2,62% 2,92%
Comparable economic basis 1 545 1 592 -3% 2,91% 2,92%
47Sanlam investor presentation 2015 annual results
Notes
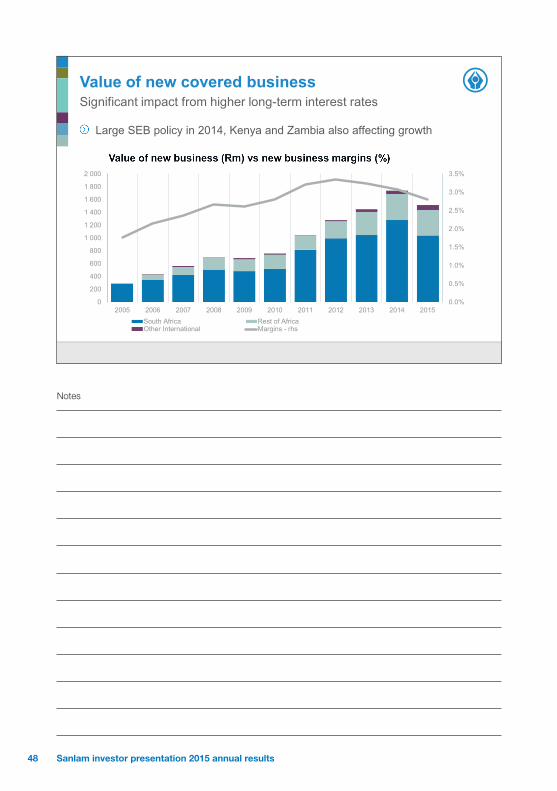
Value of new covered business
Large SEB policy in 2014, Kenya and Zambia also affecting growth
Significant impact from higher long-term interest rates
0.0%
0.5%
1.0%
1.5%
2.0%
2.5%
3.0%
3.5%
0
200
400
600
800
1 000
1 200
1 400
1 600
1 800
2 000
2005 2006 2007 2008 2009 2010 2011 2012 2013 2014 2015South Africa Rest of AfricaOther International Margins - rhs
48 Sanlam investor presentation 2015 annual results
Notes
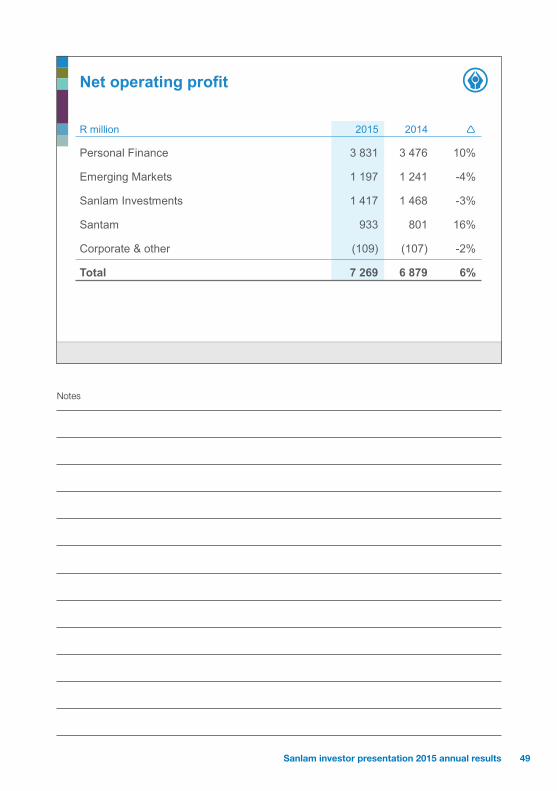
Net operating profit
R million 2015 2014
Personal Finance 3 831 3 476 10%
Emerging Markets 1 197 1 241 -4%
Sanlam Investments 1 417 1 468 -3%
Santam 933 801 16%
Corporate & other (109) (107) -2%
Total 7 269 6 879 6%
49Sanlam investor presentation 2015 annual results

Notes
Income statement
R million 2015 2014
Net operating profit 7 269 6 879 6% Per share 355,2 336,2 6%
Net investment return 1 946 1 794 8%
Other (364) (333) -9%
Normalised headline earnings 8 851 8 340 6% Per share 432,5 407,6 6%
Fund transfers 449 (15)
Headline earnings 9 300 8 325 12% Per share 459,5 411,6 12%
50 Sanlam investor presentation 2015 annual results
Notes
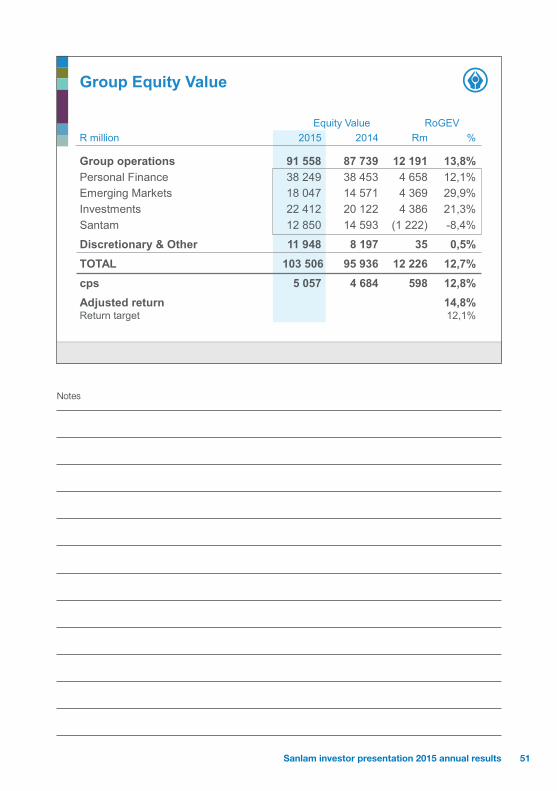
Group Equity Value
Equity Value RoGEVR million 2015 2014 Rm %
Group operations 91 558 87 739 12 191 13,8% Personal Finance 38 249 38 453 4 658 12,1% Emerging Markets 18 047 14 571 4 369 29,9% Investments 22 412 20 122 4 386 21,3% Santam 12 850 14 593 (1 222) -8,4%
Discretionary & Other 11 948 8 197 35 0,5%TOTAL 103 506 95 936 12 226 12,7% cps 5 057 4 684 598 12,8% Adjusted return 14,8% Return target 12,1%
51Sanlam investor presentation 2015 annual results

Notes
Group Equity Value earnings
R million 2015 2014
Net value of new business 1 360 1 592 -15%Existing business 5 328 4 881 9%Expected return on VIF 3 759 3 368 12%Operating experience variance 1 081 991 9%Operating assumption changes 488 522 -7%
6 688 6 473 3%Inv variances in-force 320 551 -42%Tax changes and goodwill (62) (168) 63%Economic assumption changes (1 608) 86 >-100%
5 338 6 942 -23%Return on net worth 1 699 1 297 31%EV earnings 7 037 8 239 -15%Non-life 5 189 7 344 -29%GEV earnings 12 226 15 583 -22%
52 Sanlam investor presentation 2015 annual results

Notes
Experience variancesPositive experience persisting
241
142 138
277 288 278
636
468
681
555
1 021 991
1 081
0.0%
0.5%
1.0%
1.5%
2.0%
2.5%
3.0%
3.5%
4.0%
4.5%
5.0%
0
200
400
600
800
1 000
1 200
2003 2004 2005 2006 2007 2008 2009 2010 2011 2012 2013 2014 2015
R'million % of VIF (rhs)
53Sanlam investor presentation 2015 annual results
Notes
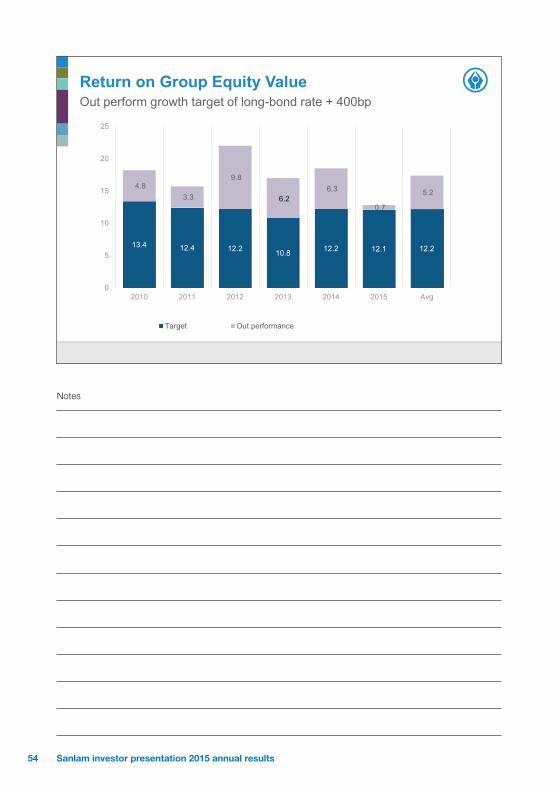
Return on Group Equity ValueOut perform growth target of long-bond rate + 400bp
13.4 12.4 12.2 10.8 12.2 12.1 12.2
4.8 3.3
9.8
6.26.3
0.7
5.2
0
5
10
15
20
25
2010 2011 2012 2013 2014 2015 Avg
Target Out performance
54 Sanlam investor presentation 2015 annual results

Notes
2016 Priorities
55Sanlam investor presentation 2015 annual results
Notes
Challenges
South African life businessMaintaining new business and profit growth over the long termNew business margins
Sanlam Emerging Markets headwindsAppropriate capacity and level of support
Sanlam InvestmentsGrowing the base, in particular institutional net flows
Addressing challenges a key priority
56 Sanlam investor presentation 2015 annual results
Notes
Sanlam Personal Finance
Continue to anticipate evolving consumer needs and demands
Focus on profitable sales growthAdapt and expand product range across entry-level, middle and affluent marketContinued focus on risk business in middle and affluent marketsExpand and adapt distribution footprint Enhance Glacier product set and intermediary supportImprove big data and advanced analytics capabilities
Focus on operational efficiencies in distribution and operations
Transforming with the high levels of regulatory change
Ensure that all business units are agile, cost efficient and market orientated
57Sanlam investor presentation 2015 annual results

Notes
Sanlam Emerging Markets
Shift in focus to accelerated organic growth through enhancing partnerships, strategic alliances and expanding product range sensibly
Increased visibility of Sanlam brand as partnership brand for markets and employees
Vest and integrate the Saham Finances acquisition
Deliver on corporate opportunities in Africa in line with client and broker service needs to support the retail growth
Increased collaboration on human resource development across the cluster
Continued focus on governance, compliance and ethics
58 Sanlam investor presentation 2015 annual results
Notes
Sanlam Investments
Maintain consistent superior investment performance
Further leverage business model in SA to grow net inflows in retail
Enhance competitive positioning for institutional segments
Focus on implemented solutions for both retail and institutional clients
Further align UK businesses to enhance competitiveness in international market
Continued focus on transformation and people development
Continue focus on passive (Satrix)
Grow Alternative Investments
Focus on operational efficiencies in low growth environment
59Sanlam investor presentation 2015 annual results
Notes
Santam
Focus on profitable growth – both in SA and emerging markets
Capital review to consider future regulatory requirements, pending SAM implementation, review asset allocations
Technical support to SEM general insurance partners to unlock value
Improve operational efficiencies to optimise acquisition cost ratio
Implementation of new underwriting platform for intermediated business in SA
Work with local municipalities to reduce risk on the ground
60 Sanlam investor presentation 2015 annual results
Notes
Outlook
61Sanlam investor presentation 2015 annual results
Notes
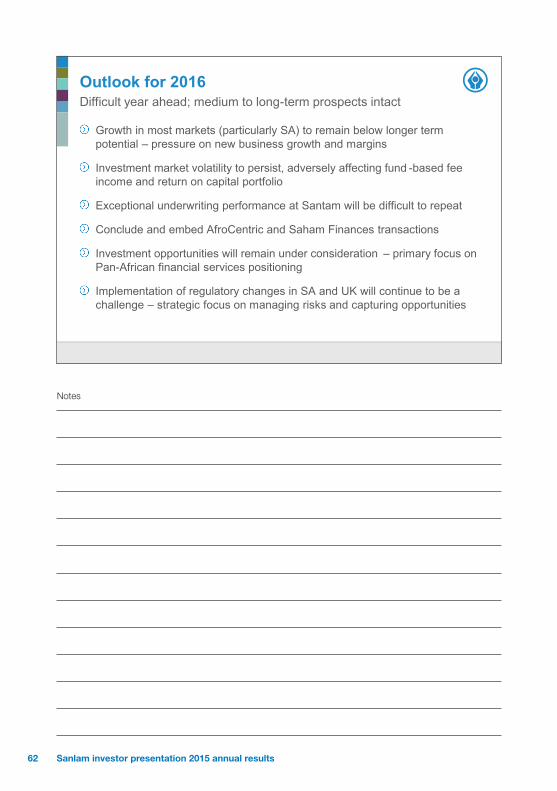
Outlook for 2016
Growth in most markets (particularly SA) to remain below longer term potential – pressure on new business growth and margins
Investment market volatility to persist, adversely affecting fund -based fee income and return on capital portfolio
Exceptional underwriting performance at Santam will be difficult to repeat
Conclude and embed AfroCentric and Saham Finances transactions
Investment opportunities will remain under consideration – primary focus on Pan-African financial services positioning
Implementation of regulatory changes in SA and UK will continue to be a challenge – strategic focus on managing risks and capturing opportunities
Difficult year ahead; medium to long-term prospects intact
62 Sanlam investor presentation 2015 annual results
Notes
thank you
63Sanlam investor presentation 2015 annual results
Notes
64 Sanlam investor presentation 2015 annual results

Financial information2015 annual results

Financial informationfor the year ended 31 December 2015
Contents
Overview
Key features 2
Salient features 3
Executive review 4
Comments on the results 7
Summarised Shareholders’ information
Group Equity Value 20
Change in Group Equity Value 21
Return of Group Equity Value 22
Group Equity Value sensitivity analysis 23
Shareholders’ fund at fair value 24
Shareholders’ fund at net asset value 26
Shareholders’ fund income statement 28
Notes to the shareholder’s information 30
Embedded value of covered business 57
1Sanlam investor presentation 2015
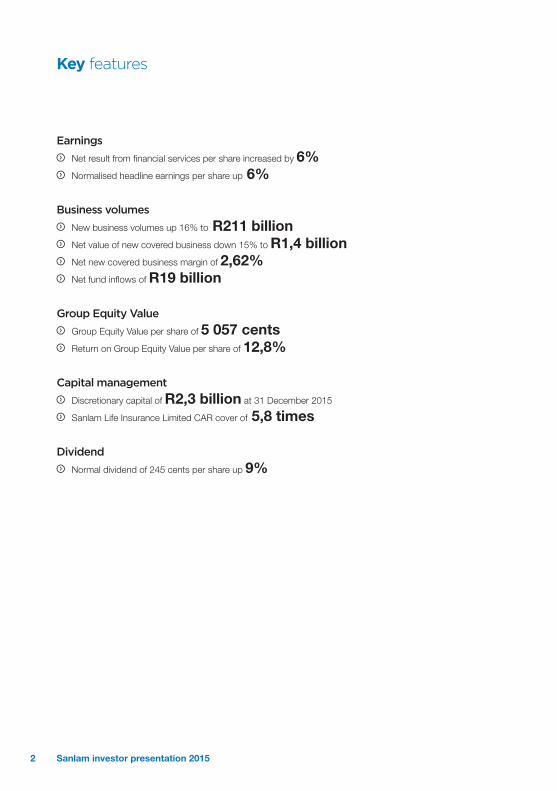
Key features
Earnings
Net result from financial services per share increased by 6% Normalised headline earnings per share up 6%
Business volumes
New business volumes up 16% to R211 billion Net value of new covered business down 15% to R1,4 billion Net new covered business margin of 2,62% Net fund inflows of R19 billion
Group Equity Value
Group Equity Value per share of 5 057 cents Return on Group Equity Value per share of 12,8%
Capital management
Discretionary capital of R2,3 billion at 31 December 2015
Sanlam Life Insurance Limited CAR cover of 5,8 times
Dividend
Normal dividend of 245 cents per share up 9%
2 Sanlam investor presentation 2015
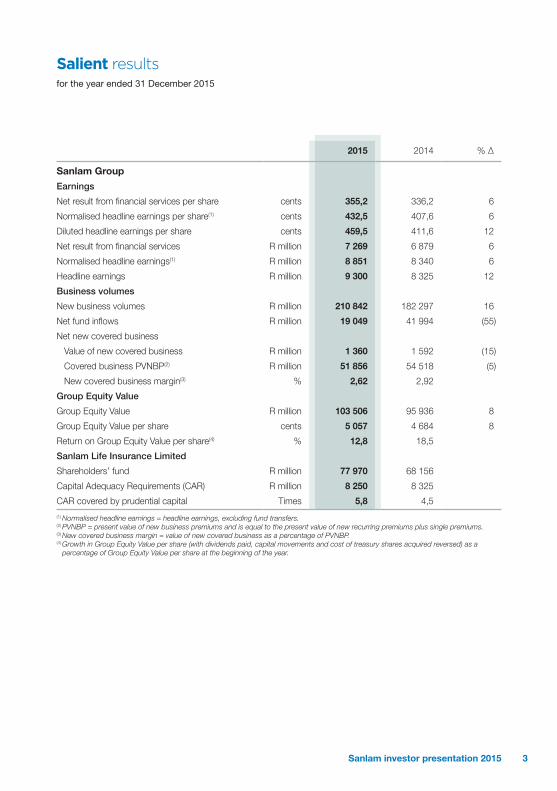
Salient resultsfor the year ended 31 December 2015
2015 2014 % ∆
Sanlam Group
Earnings
Net result from financial services per share cents 355,2 336,2 6
Normalised headline earnings per share(1) cents 432,5 407,6 6
Diluted headline earnings per share cents 459,5 411,6 12
Net result from financial services R million 7 269 6 879 6
Normalised headline earnings(1) R million 8 851 8 340 6
Headline earnings R million 9 300 8 325 12
Business volumes
New business volumes R million 210 842 182 297 16
Net fund inflows R million 19 049 41 994 (55)
Net new covered business
Value of new covered business R million 1 360 1 592 (15)
Covered business PVNBP(2) R million 51 856 54 518 (5)
New covered business margin(3) % 2,62 2,92
Group Equity Value
Group Equity Value R million 103 506 95 936 8
Group Equity Value per share cents 5 057 4 684 8
Return on Group Equity Value per share(4) % 12,8 18,5
Sanlam Life Insurance Limited
Shareholders’ fund R million 77 970 68 156
Capital Adequacy Requirements (CAR) R million 8 250 8 325
CAR covered by prudential capital Times 5,8 4,5
(1) Normalised headline earnings = headline earnings, excluding fund transfers.(2) PVNBP = present value of new business premiums and is equal to the present value of new recurring premiums plus single premiums.(3) New covered business margin = value of new covered business as a percentage of PVNBP.(4) Growth in Group Equity Value per share (with dividends paid, capital movements and cost of treasury shares acquired reversed) as a
percentage of Group Equity Value per share at the beginning of the year.
3Sanlam investor presentation 2015

2015 was one of the toughest years for business in and outside South Africa since the financial crisis in 2008. However, our solid strategy and diversification across geographies, market segments and product solutions again provided the resilience that enabled us to withstand these conditions and deliver a satisfactory performance.
The following are some of our salient features for the year:
Return on Group Equity Value (RoGEV) per share of 12,8% (adjusted 14,8%)
Net result from financial services per share increased by 6%
New business volumes increased by 16% to R211 billion
Net fund inflows of R19 billion Net value of new life business (VNB) down
15% to R1,4 billion Net VNB margin of 2,62%
The Group strategy was reviewed and approved by the Board of directors of Sanlam (Board) in December 2015. This followed a six-month process driven by the Group Executive committee who identified refinements and shifts in some of the underlying plans. In essence the strategy remains unchanged and focuses on two geographic approaches:
In South Africa, the Group aims to retain and extend its leadership position in financial services.
Outside South Africa, the Group aims to deepen and enhance its existing relationships and product ranges to become a leading player in targeted territories through accelerated organic growth. This is augmented by continued focus on identifying further opportunities for expansion to new businesses and territories.
2015 strategic initiativesThe five pillars of our strategy remain constant:
Improving performance through top-line earnings growth by increasing market share in key segments and diversifying the base (including diversification of geographical presence, products, market segments and distribution platforms).
Optimising operational efficiencies. Enhancing capital utilisation on an ongoing
basis, including the allocation of capital to business units in a manner that will best achieve stated RoGEV targets.
Prioritising diversification by enhancing the Group’s international positioning and growing the relative importance and contribution of the international business to the Group, with a specific Pan-African focus.
Commitment to the promotion of transformation and diversity within operations and broadly through the contribution to socio-economic development in the countries and markets in which the Group operates, whether that be directly, or via collaboration with business partners.
We continue to place a high premium on strategy execution. The specific pace of implementation of the strategy and the quantification of performance measures are driven through the Group’s business plans and the budgets of the respective clusters. This is influenced significantly by factors such as specific opportunities and the capabilities available within each of the businesses.
We have made good progress in the implementation of the elements of the five-pillar strategy. Below is a brief overview of our main achievements in 2015 against the strategic pillars.
Executive review
4 Sanlam investor presentation 2015

Earnings growthEarnings growth for Sanlam Personal Finance (SPF) and Santam remained strong despite operating in mature markets. Sanlam Emerging Markets (SEM) and Sanlam Investments (SI) had more muted earnings growth, with SEM most significantly affected by the provisioning in Shriram Equipment Finance in India and the business environment in Zambia. Low investor confidence due to challenging macro-economic factors and major investment market volatility impaired the ability of the investment businesses to show growth at the same levels as in the past few years.
Operating and cost efficienciesCosts remain under control despite the need to invest in systems and capacity creation. At SPF, additional capacity was created at Glacier and Sanlam Sky, whereas Sanlam Individual Life retained tight control on costs. SEM is making progress with system transitions to standardise a platform among its partners. The cluster is starting to experience efficiency benefits from centralised buying, IT support and standardised product roll-outs.
Following a period of extensive and careful planning, Sanlam Collective Investments’ administration and IT outsourcing to Silica went live in October 2015. All client and funds data was successfully migrated and the process of supporting all stakeholders continues as they adjust to the new system.
The ability to manage claims costs is critical at Santam, given the deterioration in the exchange rate and the subsequent negative impact on prices of motor vehicle parts and paint costs. Santam’s suppliers form an integral part of the claims management process, necessitating building a sustainable network that enables Santam to improve pricing and refine its product offering, which ultimately attracts and retains policyholders.
Optimal capital utilisationGroup businesses are each allocated an optimal level of capital and are measured against appropriate return hurdles. By using capital optimisation opportunities available within a Solvency Assessment and Management (SAM) regulatory environment, the Group released an additional R2,5 billion in 2015 for investment in expansion opportunities.
SPF continued to focus on the capital efficiency of its product range and especially new products, ensuring that product pricing compensates for the underlying capital requirements. The cluster is maintaining an optimal level of capital.
SEM continued balancing the need to achieve the hurdle rate with sensitivity towards the countries and stakeholder expectations where the cluster operates. Excess capital is extracted via dividends as appropriate when taking these considerations into account. Major new investments, subject to final regulatory approvals include a 30% interest in Saham Finances and 23% additional interests in Shriram Life Insurance and Shriram General Insurance, with the Shriram insurance transactions still being finalised.
The unwinding of Santam’s BBBEE scheme delivered a combined value of R1,1 billion to participants. The unwinding also presented Santam with an opportunity to improve the efficiency of its capital structure by using a share buy back at R190 per share to facilitate the unwinding. This reduced Santam’s capital base by R801 million.
DiversificationPrior to the Saham Finances transaction, the Group (through SEM) had nearly 40 operating life insurance, general insurance and asset management businesses across 19 countries (through either a direct or an indirect presence) compared to about 10 operating businesses five years ago. The Saham Finances transaction, which is one of the Group’s biggest transactions yet, will provide access to new markets including Côte d’Ivoire, Gabon, Senegal and Cameroon in Francophone West Africa, the Arabic-speaking North African country of Morocco and Lebanon in the Middle East, and Angola in Lusophone Southern Africa. This will increase the number of operating businesses to more than 60.
Diversification opportunities within the Group were realised through the launch of MiWayLife to broaden SPF’s direct offering. MiWayLife operates under the Sanlam Life licence, but is managed independently under its own brand. Santam’s claims card is being rolled out in the Group and general insurance products have been launched in the Sanlam Life agency network. SPF identified geographic areas
5Sanlam investor presentation 2015

where it is under-represented and is developing further capacity in Limpopo and the northern parts of the country. The cluster is also improving its penetration of the middle market in Gauteng.
Implemented Consulting, which formalises the investment implementation process through an investment committee framework, was a key solution for SI to enable further growth and to assist with flows into the building blocks and solution funds of the cluster.
TransformationOngoing transformation of the Group is driven from the centre and implemented at individual business unit level. Accelerated transformation initiatives were identified within each cluster to ensure improvement in the demographics at management levels.
SI is creating a strong pipeline of black leaders through its Alternative Investment Academy, which is aimed at setting up graduates to ultimately being
able to manage their own funds. Just over 80% of the recruited employees for 2014 and 2015 were black. 87% of SI’s employees under the age of 30 are black. They have excellent capability and potential to develop into leaders of the business over the longer term.
Transformation at SEM takes consideration of the emphasis in many markets on citizen empowerment and localisation of jobs. The cluster is focusing on training and development across the whole value chain of in-country employees and increased regional support capacity to transfer skills.
The unwinding of Santam’s BBBEE scheme delivered on its objectives of empowerment and transformation, particularly through the community trust. The trust created value through its support of education, arts, culture, skills development and job creation – and will continue funding transformation initiatives on a projects basis.
Executive review continued
Forward looking statementsIn this report we make certain statements that are not historical facts and relate to analyses and other information based on forecasts of future results not yet determinable, relating, among others, to new business volumes, investment returns (including exchange rate fluctuations) and actuarial assumptions. These statements may also relate to our future prospects, developments and business strategies. These are forward looking statements as defined in the United States Private Securities Litigation Reform Act of 1995. Words such as “believe”, “anticipate”, “intend”, “seek”, “will”, “plan”, “could”, “may”, “endeavour” and “project” and similar expressions are intended to identify such forward looking statements, but are not the exclusive means of identifying such statements. Forward looking statements involve inherent risks and uncertainties and, if one or more of these risks materialise, or should underlying assumptions prove incorrect, actual results may be very different from those anticipated. Forward looking statements apply only as of the date on which they are made, and Sanlam does not undertake any obligation to update or revise any of them, whether as a result of new information, future events or otherwise.
6 Sanlam investor presentation 2015

IntroductionThe Sanlam Group International Financial Reporting Standards (IFRS) financial statements for the year ended 31 December 2015 are presented based on and in compliance with IFRS. The basis of presentation and accounting policies for the IFRS financial statements and shareholders’ information are in all material respects consistent with those applied in the 2014 Annual Report.
Group Equity ValueGroup Equity Value (GEV) amounted to R103,5 billion or 5 057 cents per share on 31 December 2015, exceeding R100 billion for the first time. Including the dividend of 225 cents per share paid during the year, a RoGEV per share of 12,8% was achieved for 2015. This exceeds the 2015 target of 12,1% despite the challenges faced by the Group and a significant rise in long-term interest rates in South Africa. Adjusted RoGEV per share, which excludes the impact of investment return earned in excess of the long-term assumptions, interest rate changes and other one-off effects not under management control (such as tax changes), amounted to 14,8% – well in excess of the target.
South African long-term interest rates increased by 200bp during 2015, with a corresponding 200bp rise in the risk discount rate (RDR) used to value the Group’s South African businesses for GEV purposes. A discounted cash flow (DCF) valuation basis is now used for essentially all of the Group’s operations, with the increase in RDR having a pronounced negative effect on the end-2015 valuations and RoGEV for 2015. The diversification of the Group outside of South Africa assisted in largely offsetting this negative impact, with the valuation and RoGEV of the Group’s international operations benefiting from the sharp weakening in the rand exchange rate, particularly against developed market currencies and the Indian rupee, and more stable long-term interest rates. Exchange rate gains contributed some 4% to RoGEV per share. The strong investment market performance of 2014 also did not repeat in 2015, contributing to relatively lower RoGEV in the 2015 financial year compared to 2014. Adjusted RoGEV is a more comparable measure of the underlying operational performance, which continues to reflect solid results.
Group Equity Value at 31 December 2015GEV RoGEV
R million 2015 2014 Earnings %
Group operations 91 558 87 739 12 191 13,8
Sanlam Personal Finance 38 249 38 453 4 658 12,1
Sanlam Emerging Markets 18 047 14 571 4 369 29,9
Sanlam Investments 22 412 20 122 4 386 21,3
Santam 12 850 14 593 (1 222) (8,4)
Covered business 47 222 48 393 7 037 14,5
Value of in-force 32 114 31 207 5 338 17,1
Adjusted net worth 15 108 17 186 1 699 9,9
Other operations 44 336 39 346 5 154 12,9
Group operations 91 558 87 739 12 191 13,8
Discretionary capital and other 11 948 8 197 35 0,5
Group Equity Value 103 506 95 936 12 226 12,7
Per share (cents) 5 057 4 684 599 12,8
Comments on the results
7Sanlam investor presentation 2015
Group operations yielded an overall return of 13,8% in 2015, the combination of 14,5% return on covered business and 12,9% on other Group operations.
The Group’s covered business operations (comprising 46% of GEV) achieved a solid performance, exceeding the Group hurdle rate by a healthy margin despite the adverse impact of higher interest rates. The mature South African covered business operations exceeded the 12,1% hurdle rate by 0,6% with an overall return of 12,7% (17,4% on an adjusted basis), augmented by a return of 20% from the non-South African businesses. The latter benefited from the release of relatively higher discount rates applied in the valuation base of these businesses and the weakening in the rand exchange rate during 2015. The main items contributing to the return are:
Value of new covered business (VNB): A 0,9% lower return from VNB in 2015 is largely attributable to the base effect of the AECI policy written in 2014 and the negative change in economic basis in 2015.
Positive operating experience variances persisted in 2015, with positive risk experience of some R800 million still being the largest contributor. Particularly satisfactory is positive persistency experience of R170 million, a sound performance in a low-growth economic environment with consumer disposable income under pressure. This is testimony to the success of the Group’s strategic focus on client-centricity and efforts to improve the quality of the in-force book. Positive working capital experience was largely offset by negative one-off expense experience due to a number of large regulatory and other projects currently being implemented across the Group.
Operating assumption changes contributed slightly less to the return in 2015. A major contributor in 2015 is positive risk experience assumption changes of R810 million. The level of positive operating risk experience variances over a number of years indicates some expected continuance in these trends and required the capitalisation of a portion thereof in the value of in-force covered business (VIF) to align more
closely to the SAM requirements. This was partly offset by a strengthening in one-off expense assumptions given the level of regulatory change currently being experienced in most operations, and a number of other modelling changes.
The largest return variance compared to 2014 relates to economic assumption changes, turning from a positive return contribution of 0,2% in 2014 to negative 3,3% in 2015. This is attributable to the rise in long-term interest rates in South Africa, with the higher RDR only partly compensated for by an increase in the future investment return assumptions on the underlying asset base.
Investment variances contributed less to the overall RoGEV due to a weaker investment market performance in 2015 compared to 2014, partly offset by foreign exchange gains.
Capital allocated to covered business (adjusted net worth) declined from R17,2 billion at the end of 2014 to R15,1 billion at 31 December 2015, representing 32% of covered business compared to 36% at the end of 2014. The reduction is largely due to the revised capital allocation approach applied to Sanlam Life’s covered business with effect from 2015 (refer Capital management below).
Other Group operations (comprising 43% of GEV) achieved a return of 12,9% (23,2% on an adjusted basis). The valuation and return of the South African businesses were adversely impacted by the higher RDR, somewhat offset by good growth in assets under management in a number of the asset management boutiques. Sanlam Investment Management, the traditional retail and institutional asset manager in South Africa, experienced only a marginal increase in assets under management due to large net outflows, particularly from the Public Investment Corporation (PIC).
The return on SI and SEM’s non-South African businesses was in general supported by the weakening in the rand exchange rate. The Group’s investment in Santam is valued at its listed share price, which declined in 2015 commensurate with other financial services stocks, resulting in a negative 8,4% RoGEV contribution from Santam.
Comments on the results continued
8 Sanlam investor presentation 2015

The low return on discretionary and other capital is essentially the combined effect of the following: Net corporate expenses of R109 million recognised in net result from financial services. A relatively low level of return earned on the portfolio’s exposure to low yielding liquid assets. Hedging of the Saham Finances and Shriram life and general insurance transactions. The transactions
were hedged through the acquisition of foreign currency, which earns a very low rate of interest due to the US dollar denomination. The application of hedge accounting principles in the GEV presentation furthermore eliminated the foreign currency gains, essentially exposing the portfolio to some R5 billion of assets that earned close to zero return.
EarningsShareholders’ fund income statement for the year ended 31 December 2015
R million 2015 2014Change
%
Net result from financial services 7 269 6 879 6
Sanlam Personal Finance 3 831 3 476 10
Sanlam Emerging Markets 1 197 1 241 (4)
Sanlam Investments 1 417 1 468 (3)
Santam 933 801 16
Corporate and other (109) (107) (2)
Net investment return 1 946 1 794 8
Project costs and amortisation (321) (224) (43)
Equity participation costs (43) (109) 61
Normalised headline earnings 8 851 8 340 6
Per share (cents) 433 408 6
Net result from financial services (net operating profit) of R7,3 billion increased by 6% in 2014, with solid performances by SPF and Santam more than compensating for lower earnings at SI and SEM. Santam achieved an exceptional underwriting performance, with its underwriting margin of 9,6% exceeding the new longer term target range of between 4% and 8%. As indicated in the introduction, the Group faced a challenging operating environment in 2015, which together with a number of internal one-off items had a pronounced impact on growth in net result from financial services. These items were:
In SI, performance fees declined by 21% from 2014. A significant portion of the performance fees earned by SI in 2014 related to funds managed on behalf of the Public Investment Corporation (PIC). The cumulative withdrawal by the PIC of some R20 billion of funds under management in 2014 and 2015 as part of the restructuring of their portfolios, reduced the base on which fees can be earned, with no performance fees accruing in 2015 on the PIC funds. A relatively lower level of outperformance of benchmarks in 2015 compared to the 2014 financial year also resulted in lower performance fees being earned on collective investment schemes.
9Sanlam investor presentation 2015
The 2014 comparative earnings of SI’s International business included one-off profit of R58 million realised on the disposal of Intrinsic in the United Kingdom (UK).
One-off expenditure increased SI’s administration costs by R83 million after tax in 2015, including the outsourcing of Sanlam Collective Investments’ administration platform, further leveraging off the Group’s repositioned WealthsmithsTM branding, restructuring of the UK private wealth business and costs associated with regulatory compliance in the UK.
Sanlam Employee Benefits (SEB) wrote one of the largest insurance policies in history in South Africa during 2014 when it concluded an R8,3 billion pensions outsourcing agreement with the AECI retirement fund. This policy generated effective net new business strain of R138 million in 2014, with a further R14 million being recognised in the 2015 earnings in respect of the additional premium received during the year.
Capital Management experienced abnormal marked-to-market losses of R92 million in its debt and equity-structuring units related to commodity market conditions, entity specific issues and political events in South Africa. Credit spreads on Eurobonds issued by African governments and South African institutions widened significantly during the year. In the case of African government bonds it is largely attributable to unfavourable investor sentiment towards emerging markets following the severe slump in commodity prices that is likely to have an adverse impact on many governments’ ability to service debt. Investors’ risk perception of South African institutional debt rose sharply during 2015 from a combination of some company specific issues such as the regulatory penalty levied against MTN in Nigeria, and general negative investor sentiment following the changes in Finance Ministers at the end of 2015. The widening of credit spreads culminated in marked-to-market losses in Capital Management’s debt business that has exposure to these Eurobonds. In addition, Capital Management also incurred marked-to-market losses on financing transactions backed by
commodity stocks. The share prices of commodity companies declined sharply during 2015 in line with the slump in commodity prices, which reduced the underlying level of security within these instruments. This had a consequential negative impact on their fair values. In the absence of defaults, these marked-to-market losses should reverse in future reporting periods.
SEM experienced a difficult 2015, with its Indian, Malaysian and Zambian operations underperforming against 2014 and the target for 2015.
The Shriram Capital results in India were affected by one-off items in both the 2014 and 2015 financial years, causing a R154 million adverse change in net result from financial services. Shriram Transport Finance Company’s subsidiary focused on equipment financing experienced abnormal levels of arrears in 2015. The subsidiary expanded its lending book in anticipation of the newly elected government’s infrastructure projects. Delays in the roll-out of these projects placed a large number of clients under financial pressure, with the outstanding loan book growing outside of normal parameters during the year. This required a significant strengthening in the provision for bad debts. The position stabilised recently with some projects being initiated. An improvement in recoveries and the arrears position is expected during 2016. In addition, the 2014 comparative results for Shriram Capital included a R51 million one-off release of provisions relating to Shriram General Insurance’s third party pool book, thereby increasing the comparative base.
The Zambian economy and currency are under severe pressure from low commodity prices, in particular copper that is its main source of income and foreign currency inflows, unplanned elections and severe flooding during the year. Despite a number of management actions, SEM’s Zambian operations could not escape the impact of the economic environment on consumer disposable income, resulting in significantly lower operating earnings due to lower new business sales and negative persistency experience.
Comments on the results continued
10 Sanlam investor presentation 2015
Pacific & Orient, SEM’s general insurance business in Malaysia, appointed a new statutory actuary during 2015 in line with Malaysian regulations. The new actuary required a strengthening of the reserving basis, which reduced the 2015 net result from financial services by R30 million. This reserve can be released in future periods should actual experience prove to be more favourable than that assumed in the current basis.
Excluding these items, net result from financial services grew by 11%, a solid performance against the overall challenging backdrop.
SPF achieved solid growth for a largely mature business. Sanlam Individual Life remains the largest contributor to SPF’s operating earnings with growth in its net result from financial services of 7% in 2015. Profit from investment products grew by 27%, benefiting from strong guaranteed product sales over the last few years that increased the book size of this line of business. Market-related investment products also contributed to the growth, supported by a 14% increase in the average level of assets under management – partly attributable to the strong investment market performance of 2014. The profit contribution of risk products declined by 8%, with a further improvement on the exceptionally favourable mortality experience of 2014 difficult to achieve and due to an increase in new business strain in 2015 following the strong growth in new risk business sales. Profit released from the asset mismatch reserve held in respect of non-participating risk business declined by 14% in line with the lower level of this reserve during 2015. Mortality experience in the annuity book normalised during 2015, which together with a lower level of asset mismatch profits contributed to a decline in earnings from this line of business. This was offset by higher profit from other products, which include the legacy universal life book.
Sanlam Sky’s net result from financial services increased by 19%. Growth in the size of the in-force book, positive investment variances and economic basis changes as well as improved persistency and premium variances supported the earnings growth.
Glacier grew its profit contribution by 21% after tax. Fund-based fee income benefited from an increase in assets under management due to strong net fund inflows and favourable investment market performance in prior years.
SEM grew its net result from financial services by a satisfactory 14% excluding the abnormal items highlighted before.
Namibia (up 10% net of tax and non-controlling interests; 16% on a gross basis) benefited from sound profit growth at Santam Namibia and Capricorn Investment Holdings (CIH). Santam Namibia experienced a benign claims environment during 2015, similar to Santam’s South African experience. Bank Windhoek, CIH’s major investment, continued to deliver good growth. Profit realised in 2014 in the closed fund life book from credit spread moves did not repeat in 2015, which together with a shrinking book contributed to lower operating earnings from this business. The renegotiation of the Bank Windhoek credit life profit share arrangement also had a negative impact on earnings growth in 2015. The variance between gross and net growth is mostly attributable to relatively stronger growth in the businesses with non-controlling interests.
Botswana achieved good growth of 17% in its net result from financial services (22% before tax and non-controlling interests). The life business’ results benefited from good annuity volumes and margins and an increase in the size of the book following the strong new business performance over the last number of years. Letshego, which earns more than half of its profit outside Botswana, experienced currency translation losses as well as a higher effective tax rate due to a change in the various countries’ contribution to overall earnings. Its profit contribution was in line with 2014. The general insurance business Legal Guard made a welcome recovery and turned around from a net loss in 2014 to a small net profit in 2015. Botswana Insurance Fund Management (BIFM), the Botswana asset manager, was adversely impacted by the withdrawal of R12,4 billion of assets under management by the Botswana Public Officers Pension Fund (BPOPF). Restructuring of the business limited the negative profit impact to some R10 million.
11Sanlam investor presentation 2015

The Rest of Africa operations, excluding Zambia, achieved growth in net result from financial services of 17%. Most countries and lines of business delivered strong growth. The exception was general insurance where all businesses experienced claims pressure, apart from the Ghanaian operations.
Net result from financial services in India rose 13% excluding structural changes and the abnormal items listed before. The credit and general insurance businesses achieved satisfactory growth, while the life insurance business continued to invest in expanding its distribution footprint.
In Malaysia, growth in general insurance business premiums came under pressure from a combination of lower sales of two-wheelers and increased competition. Appropriate management action has been taken, which limited the impact on profitability to some extent. The life business also did not perform in line with expectations due to losses in the medical portfolio, contributing to a disappointing overall performance. A new Regional Executive for Malaysia has been appointed towards the end of the year. His focus will be on improving the performance of the individual businesses, but also extracting synergies from the combined operations.
SI achieved overall growth of 6% in its net result from financial services excluding abnormal items.
The relatively weaker investment market performance in 2015 impacted adversely on the Investment Management businesses’ ability to grow assets under management, aggravated by:
Continued net outflows from the South African life book and capital portfolio. The legacy life book managed by SI is running off while SPF’s open architecture results in only a portion of its new business being managed by SI. Outflows from the older life books are therefore not replaced by new inflows, resulting in consistent net outflows of assets under management for SI. SI’s strategic focus remains on replacing the life outflows with third-party business and an increase in the proportion of SPF open architecture business managed. A consequence of the Group’s strategic focus on capital efficiency has been a reduction in the capital backing the South African life business, which is
managed by SI. A further R4 billion has been released during 2015, which will be redeployed for investment in strategic operations on which SI does not earn any fee income.
The R20 billion of funds under management withdrawn by the PIC over the last two years.
The funds withdrawn from SEM by the BPOPF during 2015 included some R3 billion of funds managed by SI’s International business.
Average assets under management of the South African investment manager, the largest contributor to the sub-clusters’ profit, increased by only 6% as a result. Growth of 8% in net result from financial services, excluding abnormal items, represents a solid performance in this context.
SEB’s profit contribution grew marginally by 1% if the new business strain from the AECI policy is excluded. A reduction in losses from the administration businesses and 32% growth at SEB investments were offset by a 7% decline in risk profits following a normalisation in claims experience during 2015 from a particularly favourable experience in 2014.
Capital Management managed to achieve 11% growth in its net result from financial services, excluding marked-to-market losses from widening credit spreads on Eurobonds and equity-backed financing structures.
Santam had an exceptional year, with its underwriting margin improving from an already high base of 8,7% in 2014 to 9,6% in 2015. The benign claims environment of 2014 persisted into 2015, which together with disciplined underwriting action contributed to the 16% growth in Santam’s net result from financial services. Premium growth was less than planned for 2015 in a competitive environment, commercial business in particular.
Normalised headline earnings of R8,9 billion are 6% up on 2014. This is the combined effect of the 6% increase in net result from financial services, 8% growth in net investment return earned on the capital portfolio and a 43% increase in amortisation of intangible assets. The latter is essentially due to intangible assets recognised in respect of the acquisition of MCIS in Malaysia during 2014.
Comments on the results continued
12 Sanlam investor presentation 2015
Despite the relatively weaker investment market performance in 2015, net investment surpluses earned on the capital portfolio increased by 16% due to a well-timed change in strategic asset allocation (refer capital section below) and the international exposure in the portfolio. The change in strategic asset allocation from unhedged to hedged equities was implemented before the decline in the South African equity market in December, protecting the portfolio against these losses and locking in the gains made up to that stage. In addition, investment return earned on the international exposure in the portfolio benefited from the sharp weakening of the rand exchange rate against developed market currencies during 2015.
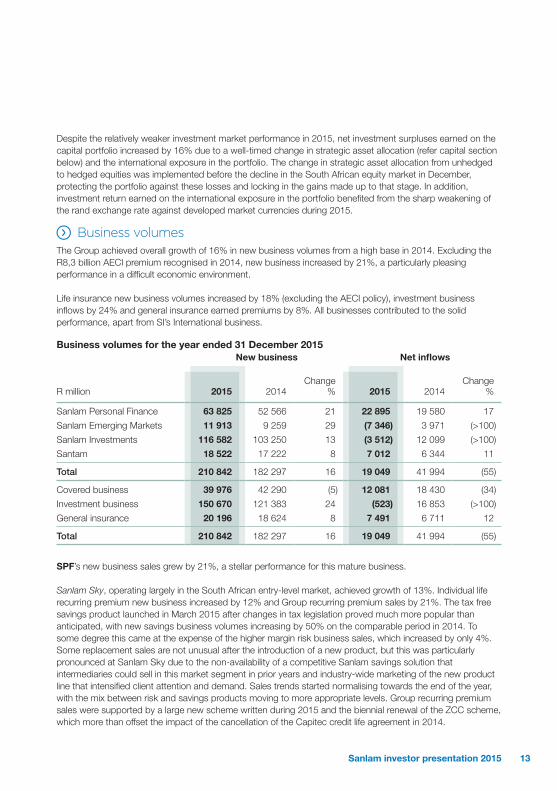
Business volumesThe Group achieved overall growth of 16% in new business volumes from a high base in 2014. Excluding the R8,3 billion AECI premium recognised in 2014, new business increased by 21%, a particularly pleasing performance in a difficult economic environment.
Life insurance new business volumes increased by 18% (excluding the AECI policy), investment business inflows by 24% and general insurance earned premiums by 8%. All businesses contributed to the solid performance, apart from SI’s International business.
Business volumes for the year ended 31 December 2015New business Net inflows
R million 2015 2014Change
% 2015 2014Change
%
Sanlam Personal Finance 63 825 52 566 21 22 895 19 580 17
Sanlam Emerging Markets 11 913 9 259 29 (7 346) 3 971 (>100)
Sanlam Investments 116 582 103 250 13 (3 512) 12 099 (>100)
Santam 18 522 17 222 8 7 012 6 344 11
Total 210 842 182 297 16 19 049 41 994 (55)
Covered business 39 976 42 290 (5) 12 081 18 430 (34)
Investment business 150 670 121 383 24 (523) 16 853 (>100)
General insurance 20 196 18 624 8 7 491 6 711 12
Total 210 842 182 297 16 19 049 41 994 (55)
SPF’s new business sales grew by 21%, a stellar performance for this mature business.
Sanlam Sky, operating largely in the South African entry-level market, achieved growth of 13%. Individual life recurring premium new business increased by 12% and Group recurring premium sales by 21%. The tax free savings product launched in March 2015 after changes in tax legislation proved much more popular than anticipated, with new savings business volumes increasing by 50% on the comparable period in 2014. To some degree this came at the expense of the higher margin risk business sales, which increased by only 4%. Some replacement sales are not unusual after the introduction of a new product, but this was particularly pronounced at Sanlam Sky due to the non-availability of a competitive Sanlam savings solution that intermediaries could sell in this market segment in prior years and industry-wide marketing of the new product line that intensified client attention and demand. Sales trends started normalising towards the end of the year, with the mix between risk and savings products moving to more appropriate levels. Group recurring premium sales were supported by a large new scheme written during 2015 and the biennial renewal of the ZCC scheme, which more than offset the impact of the cancellation of the Capitec credit life agreement in 2014.
13Sanlam investor presentation 2015
New business volumes in the Individual Life segment, which is largely focused on the middle income segment in South Africa, increased by 3%. Single premium sales increased by 3%, reflecting pressure on disposable income, the competitive environment and a shift in sales to the Glacier platform. Annuity and guaranteed plan sales reflected good growth, offset by lower sales from bank brokers as these channels increasingly focused on their own in-house products. New recurring premium sales grew by 10% with all lines of business contributing to the growth. A strong recovery in the sales of risk business was particularly satisfactory, with this line of business growing by 17% in the second half of 2015 (flat for the six months to 30 June 2015) to reach overall growth of 9% for the full 2015 financial year. Similar to the entry-level market, the mix of recurring premium savings products changed towards the new tax-free savings products, although in this market segment the tax-free savings products was favoured above existing low margin endowments.
Glacier achieved another exemplary performance in 2015, growing its new business volumes by 27%. Demand for offshore and wrap solutions were particularly strong, driven by a weaker rand and competitive investment performance offered by the wrap solutions respectively.
The SEM operations grew their new business contribution by 29% – new life business increased by 32%, investment business inflows by 29% and general insurance earned premiums by 19%. The growth in life and general insurance business was to some extent supported by acquisitions during 2014 and 2015.
New business volumes in Namibia declined by 16%, the combined result of 36% growth in new life business and a 23% decline in unit trust inflows in a competitive environment. The strong growth in life business is largely due to an increase in per policy premium size in the affluent market.
The Botswana operations had another sterling year with new business volumes rising by 78%. Strong annuity sales continue to be the main driver of new
life business (up 41%), augmented by a more than doubling in new investment mandates at the asset management operations.
A 35% increase in Rest of Africa new business volumes is attributable to a twofold increase in investment business inflows and a 94% rise in general insurance business, the latter partly due to the base effect of new acquisitions. Life business growth disappointed at 2%. The Zambian operations struggled in difficult economic conditions, recording a 37% decline in new business sales. The Kenyan business made progress in rebuilding its agency force after the major impact of the system implementation issues experienced in the first half of the year. As anticipated, a major improvement in sales volumes will only reflect in 2016 as new agent productivity improves. New life business sales for the full year declined by 19%, with some improvement evident in the second-half performance. Excluding Zambia and Kenya, Rest of Africa new life business volumes increased by 30%, with all regions contributing to the strong growth.
New business growth in India persisted in line with the first-half 2015 trends. New life and general insurance business sales increased by 60% and 24% respectively, benefiting from the investments made in growing the distribution footprint.
As indicated before, lower two-wheeler sales and competitive pressures impacted negatively on Pacific & Orient in Malaysia. This is evident in its earned premiums that declined by 22%. The base effect of the MCIS acquisition during 2014 supported a more than doubling in Malaysian new life business sales.
The AECI policy written by SEB in 2014 had a major negative impact on the 13% overall growth in SI’s new business volumes. Excluding the AECI policy, new business volumes increased by 23%. All business units achieved growth in excess of 20%, apart from International where an 18% decline in inflows is largely attributable to the disposal of Intrinsic during 2014. A 57% increase in new life business at SEB (excluding AECI) is particularly satisfactory. Recurring and single premium new business grew by 60% and 57% respectively.
Comments on the results continued
14 Sanlam investor presentation 2015

Another highlight for the year was the success of the SI retail unit in yielding new inflows. By partnering with intermediaries through the Implemented Consulting initiative, the unit attracted new inflows of more than R8 billion during 2015. Also pleasing is the significant portion of the funds that flowed to the SI investment core, supporting strong net inflows into Sanlam Collective Investments.
The bulk of Santam’s premiums are still written in the highly competitive South African market. Earned premiums grew by 8%, reflecting the maturity of the South African market and the current low-growth economic environment. The severe drought experienced in large parts of the country manifested in reduced planting and commensurately lower premiums written in the agricultural business line. MiWay, Santam’s direct insurance business, continues to make inroads and grew its premium base by 19%.
Net fund inflows of R19,1 billion in 2015 is an acceptable performance given the large withdrawals experienced from the PIC and BPOPF and the economic and investment market headwinds faced in the 2015 financial year.
Value of new covered business for the year ended 31 December 20152015 economic basis 2014 economic basis
R million 2015 2014Change
% 2015 2014Change
%
Value of new covered business 1 514 1 743 (13) 1 707 1 743 (2)
Sanlam Personal Finance 955 1 084 (12) 1 148 1 084 6
Sanlam Emerging Markets 448 431 4 467 431 8
Sanlam Investments 111 228 (51) 92 228 (60)
Net of non-controlling interest 1 360 1 592 (15) 1 545 1 592 (3)
Present value of new business premiums 54 362 56 394 (4) 55 555 56 394 (1)
Sanlam Personal Finance 38 572 34 798 11 39 712 34 798 14
Sanlam Emerging Markets 7 510 5 673 32 7 600 5 673 34
Sanlam Investments 8 280 15 923 (48) 8 243 15 923 (48)
Net of non-controlling interest 51 856 54 518 (5) 53 005 54 518 (3)
New covered business margin 2,80% 3,09% 3,07% 3,09%
Sanlam Personal Finance 2,48% 3,12% 2,89% 3,12%
Sanlam Emerging Markets 5,97% 7,60% 6,14% 7,60%
Sanlam Investments 1,34% 1,43% 1,12% 1,43%
Net of non-controlling interest 2,62% 2,92% 2,91% 2,92%
The discount rate used to determine VNB is directly linked to long-term interest rates. The 200bp rise in the South African five and nine-year benchmark rates during 2015 resulted in a commensurate increase in the risk discount rate and a significant negative impact on VNB growth and margins. This was aggravated by the high base in 2014 related to the AECI policy. VNB at actual discount rates declined by 13% (6% excluding AECI). On a comparable basis (before economic assumption changes) VNB decreased by 2% (increased by 6% excluding AECI).
15Sanlam investor presentation 2015
SPF achieved overall growth of 6% on a comparable basis. The significant change in business mix in Sanlam Sky to the lower margin tax free savings products contributed to a 9% decline in Sanlam Sky’s VNB and a reduction in new business margins from 9,51% in 2014 to 7,44% in 2015. The normalisation in business mix towards the end of the year should support VNB growth in 2016. The strong growth in recurring premium risk business in the Individual Life segment more than compensated for the change in mix of savings business to tax-free savings products. VNB margins improved from 2,88% to 2,97%, driving VNB growth of 9% in this mature segment. Glacier’s VNB growth was in line with its new business performance.
VNB growth and margins at SEM were negatively impacted by the significantly lower new business production in Kenya and Zambia, the renegotiation of the Bank Windhoek credit life profit sharing arrangement and higher long-term interest rates in Namibia. All of the other businesses achieved strong VNB growth largely in line with their new business performance. On a consistent economic basis, overall VNB increased by 8% to R467 million. Excluding Kenya and Zambia, VNB grew by 24% and Rest of Africa’s contribution by 35%.
SI’s VNB declined by 60%, largely due to the base effect of the AECI transaction concluded in 2014 and a lower contribution from the International business in line with its lower new business volumes.
VNB margins were in general maintained at a product level, apart from the Namibian credit life business.
Capital managementSanlam Life capital allocation approachUnder the current Financial Soundness Valuation (FSV) regime, participations or strategic investments held by a life insurance company can be taken into account for purposes of the statutory capital available to cover its CAR. This creates an opportunity in a diversified group to optimise its capital allocation by using strategic investments to
cover a portion of the capital required to meet its targeted CAR ratio, with the remainder being held in the form of a balanced portfolio and/or subordinated debt. This is referred to as capital diversification. In the transition to SAM, the new solvency regime, some uncertainty existed as to whether any capital diversification would also be allowed under the SAM regime. The Group therefore followed a prudent capital allocation approach during the development phase of the SAM specifications, essentially capitalising each life insurance business on a standalone basis without any allowance for diversification. The SAM specifications have largely been finalised during 2015, with the outcome that participations will be allowed to contribute to available capital (own funds) under SAM, both at a company (solo) and group level, with a corresponding capital requirement (SCR). Prescribed valuation bases are applicable at a solo and group level. The valuation and SCR bases for participations provide some stability to the entity’s SCR cover ratio and potentially generate surplus own funds that can be redeployed.
The improved clarity on the final SAM specifications enabled the Group to extract further capital efficiencies during 2015. This was achieved through a combination of capital diversification and a more conservative asset allocation for the balanced portfolio backing Sanlam Life’s covered business.
For Sanlam Life, the Group’s target under the FSV basis is to ensure that its CAR cover would be at least 1.5 times over a 10-year period, within a 95% confidence level. At the end of 2014 this translated into IFRS-based required capital of some R14,7 billion for Sanlam Life’s covered business. Consistent with the prudent approach then followed, this capital requirement was fully covered by subordinated debt of R2 billion and a balanced portfolio of R12,7 billion, with no allowance for the value attributed to investments in strategic businesses. This basis of capital allocation contributed to Sanlam Life’s high CAR cover ratio under the FSV regime, as its investment in Santam alone contributes more than R4 billion in available statutory capital.
Comments on the results continued
16 Sanlam investor presentation 2015
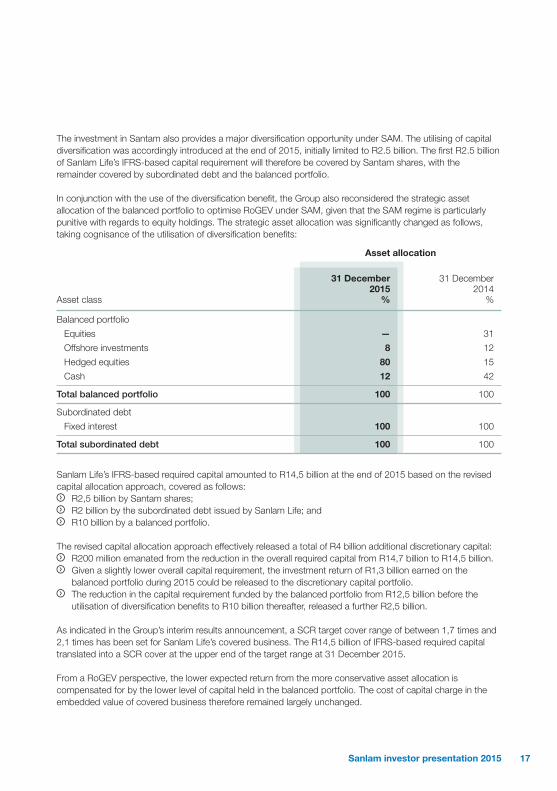
The investment in Santam also provides a major diversification opportunity under SAM. The utilising of capital diversification was accordingly introduced at the end of 2015, initially limited to R2.5 billion. The first R2.5 billion of Sanlam Life’s IFRS-based capital requirement will therefore be covered by Santam shares, with the remainder covered by subordinated debt and the balanced portfolio.
In conjunction with the use of the diversification benefit, the Group also reconsidered the strategic asset allocation of the balanced portfolio to optimise RoGEV under SAM, given that the SAM regime is particularly punitive with regards to equity holdings. The strategic asset allocation was significantly changed as follows, taking cognisance of the utilisation of diversification benefits:
Asset allocation
Asset class
31 December 2015
%
31 December 2014
%
Balanced portfolio
Equities — 31
Offshore investments 8 12
Hedged equities 80 15
Cash 12 42
Total balanced portfolio 100 100
Subordinated debt
Fixed interest 100 100
Total subordinated debt 100 100
Sanlam Life’s IFRS-based required capital amounted to R14,5 billion at the end of 2015 based on the revised capital allocation approach, covered as follows:
R2,5 billion by Santam shares; R2 billion by the subordinated debt issued by Sanlam Life; and R10 billion by a balanced portfolio.
The revised capital allocation approach effectively released a total of R4 billion additional discretionary capital: R200 million emanated from the reduction in the overall required capital from R14,7 billion to R14,5 billion. Given a slightly lower overall capital requirement, the investment return of R1,3 billion earned on the
balanced portfolio during 2015 could be released to the discretionary capital portfolio. The reduction in the capital requirement funded by the balanced portfolio from R12,5 billion before the
utilisation of diversification benefits to R10 billion thereafter, released a further R2,5 billion.
As indicated in the Group’s interim results announcement, a SCR target cover range of between 1,7 times and 2,1 times has been set for Sanlam Life’s covered business. The R14,5 billion of IFRS-based required capital translated into a SCR cover at the upper end of the target range at 31 December 2015.
From a RoGEV perspective, the lower expected return from the more conservative asset allocation is compensated for by the lower level of capital held in the balanced portfolio. The cost of capital charge in the embedded value of covered business therefore remained largely unchanged.
17Sanlam investor presentation 2015

Discretionary capitalThe Group started the year with discretionary capital of R3,3 billion, which was earmarked for new growth and expansion opportunities as well as to strengthen existing relationships. A net total of R6 billion was redeployed in the year, which included the following:
R4,2 billion (excluding Santam’s contribution) allocated to the acquisition of Saham Finances, which will significantly expand the Group’s African footprint and general insurance diversification. The acquisition price is payable in US dollars, which the Group hedged during 2015 by acquiring the foreign currency. In terms of the IFRS hedge accounting specifications, the investment will be recognised in 2016 at the US dollar/R14,08 exchange rate at which the foreign currency was acquired.
The Group also indicated after the release of the interim results in September 2015 that it will acquire a 23% additional stake in the Shiram life and general insurance businesses. A total of some R970 million has been earmarked for this transaction, which has also been hedged during 2015 against exchange rate movements.
R703 million was utilised for the acquisition of an effective 27% stake in Medscheme, which improves the Group’s healthcare proposition for clients in addition to offering a number of potential synergies. The first of these has been realised through the roll-out of the Reality loyalty scheme to medical aid members administered by Medscheme.
Some R240 million was invested by SEM to enter the Mozambique and Zimbabwe markets and to increase its stakes in the Nigerian and Tanzanian general insurance businesses.
As indicated in the 2014 Sanlam Annual Report, the Group extended its relationship with its empowerment partner, Ubuntu-Botho Investments (UB), for an additional 10 years with
the aim, among others, to jointly explore mutually beneficial transactions. The first transaction concluded in terms of this arrangement is the transformation of Indwe Brokers Holdings (Indwe), a general insurance intermediary, into a black-owned company through the disposal by Santam of a 51% shareholding in the business to African Rainbow Capital, a wholly owned subsidiary of UB. Sanlam also acquired a 25% stake in Indwe for a total amount of R69 million. The transaction better positions Indwe in a highly competitive market, opens up new opportunities for the business and enabled the Group to further execute on the transformation pillar of its strategy.
R46 million was received from Santam as its contribution to recent general insurance investments made in Africa.
SI utilised R36 million for investment in its US-based asset manager and for trail payments for the acquisition of the Vukile property management agreement.
SPF invested R57 million in a distribution business in the entry-level market in South Africa.
SI established a seeding capital portfolio that will be utilised to grow some of their new products and portfolios while building a track record. Discretionary capital of R200 million was utilised to bolster the portfolio.
A special dividend of R226 million was received from MCIS in Malaysia as part of its capital optimisation initiatives.
R165 million was realised from the disposal of SEM’s direct stake in Nico Holdings in Malawi to Botswana Insurance Holdings, SEM’s subsidiary in Botswana. Not only does this transaction enhance the potential to extract synergies between the businesses, but it also effectively released illiquid excess capital held in the Botswana operations.
Comments on the results continued
18 Sanlam investor presentation 2015

Investment return earned on the discretionary capital portfolio and the 2014 dividend cover in excess of cash operating earnings added some R1 billion of discretionary capital. Together with the R4 billion of capital released from the capital allocation changes in Sanlam Life, unallocated discretionary capital amounted to R2,3 billion at the end of December 2015. We remain focused on utilising the available discretionary capital for value-accretive investment opportunities.
SolvencyAll of the life insurance businesses within the Group were sufficiently capitalised at the end of December 2015. The total admissible regulatory capital (including identified discretionary capital) of Sanlam Life Insurance Limited, the holding company of the Group’s major life insurance subsidiaries, of R47,8 billion, covered its CAR 5.8 times. No policyholder portfolio had a negative bonus stabilisation reserve at the end of December 2015.
The Group appointed Standard & Poor’s (S&P) during 2015 to replace Fitch Ratings as the Group’s credit ratings agency following the cancellation of Fitch Ratings’ registration as a ratings agency for regulatory purposes by the FSB. S&P issued the following South Africa National Scale ratings at the beginning of 2016: Sanlam Limited: zaAA-; Sanlam Life Insurance Limited: zaAAA, Subordinated debt: zaAA+. These ratings confirm the strength of the Group’s balance sheet and operations.
DividendThe Group only declares an annual dividend due to the costs involved in distributing an interim dividend to our large shareholder base. Sustainable growth in dividend payments is an important consideration for the Board in determining the dividend for the year. The Board uses cash operating earnings as a guideline in setting the level of the normal dividend, subject to the Group’s liquidity and solvency requirements. The operational performance of the Group in the 2015 financial year enabled the Board to increase the normal dividend per share by 9% to 245 cents. This will maintain a cash operating earnings cover of approximately 1.1 times. The South African dividend withholding tax regime applies in respect of this dividend. The dividend will in full be subject to the 15% withholding tax, where applicable, which will result in a net final dividend, to those shareholders who are not exempt from paying dividend tax, of 208,25 cents per ordinary share. The number of ordinary shares in issue in the company’s share capital at the date of the declaration is 2 003 141 288 (excluding treasury shares of 163 330 518). The company’s tax reference number is 9536/346/84/5.
Shareholders are advised that the final gross cash dividend of 245 cents for the year ended 31 December 2015 is payable on Monday, 11 April 2016 by way of electronic bank transfers to ordinary shareholders recorded in the register of Sanlam at close of business on Friday, 8 April 2016. The last date to trade to qualify for this dividend will be Friday, 1 April 2016, and Sanlam shares will trade ex-dividend from Monday, 4 April 2016.
Share certificates may not be dematerialised or rematerialised between Monday, 4 April 2016 and Friday, 8 April 2016, both days included.
19Sanlam investor presentation 2015
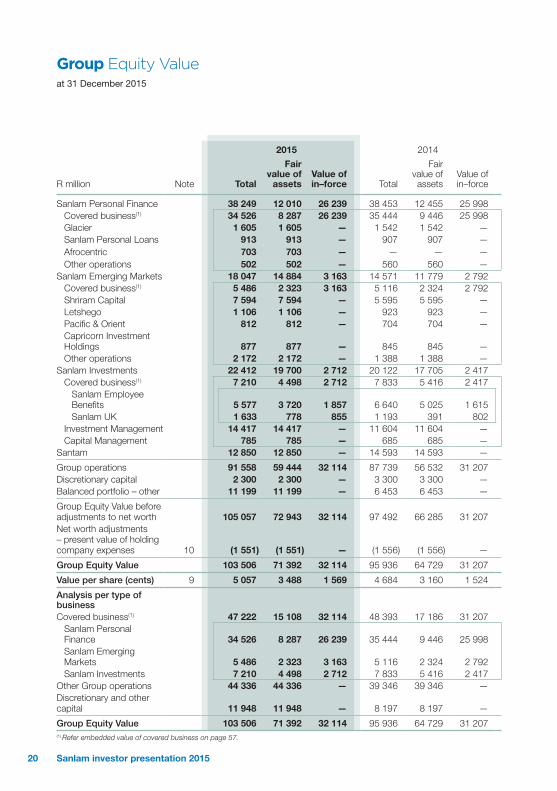
Group Equity Valueat 31 December 2015
2015 2014
R million Note Total
Fair value of
assetsValue of in–force Total
Fair value of assets
Value of in–force
Sanlam Personal Finance 38 249 12 010 26 239 38 453 12 455 25 998 Covered business(1) 34 526 8 287 26 239 35 444 9 446 25 998 Glacier 1 605 1 605 — 1 542 1 542 —Sanlam Personal Loans 913 913 — 907 907 —Afrocentric 703 703 — — — —Other operations 502 502 — 560 560 —
Sanlam Emerging Markets 18 047 14 884 3 163 14 571 11 779 2 792 Covered business(1) 5 486 2 323 3 163 5 116 2 324 2 792 Shriram Capital 7 594 7 594 — 5 595 5 595 —Letshego 1 106 1 106 — 923 923 —Pacific & Orient 812 812 — 704 704 —Capricorn Investment Holdings 877 877 — 845 845 —Other operations 2 172 2 172 — 1 388 1 388 —
Sanlam Investments 22 412 19 700 2 712 20 122 17 705 2 417 Covered business(1) 7 210 4 498 2 712 7 833 5 416 2 417
Sanlam Employee Benefits 5 577 3 720 1 857 6 640 5 025 1 615 Sanlam UK 1 633 778 855 1 193 391 802
Investment Management 14 417 14 417 — 11 604 11 604 —Capital Management 785 785 — 685 685 —
Santam 12 850 12 850 — 14 593 14 593 —
Group operations 91 558 59 444 32 114 87 739 56 532 31 207 Discretionary capital 2 300 2 300 — 3 300 3 300 —Balanced portfolio – other 11 199 11 199 — 6 453 6 453 —
Group Equity Value before adjustments to net worth 105 057 72 943 32 114 97 492 66 285 31 207 Net worth adjustments – present value of holding company expenses 10 (1 551) (1 551) — (1 556) (1 556) —
Group Equity Value 103 506 71 392 32 114 95 936 64 729 31 207
Value per share (cents) 9 5 057 3 488 1 569 4 684 3 160 1 524
Analysis per type of businessCovered business(1) 47 222 15 108 32 114 48 393 17 186 31 207
Sanlam Personal Finance 34 526 8 287 26 239 35 444 9 446 25 998 Sanlam Emerging Markets 5 486 2 323 3 163 5 116 2 324 2 792 Sanlam Investments 7 210 4 498 2 712 7 833 5 416 2 417
Other Group operations 44 336 44 336 — 39 346 39 346 —Discretionary and other capital 11 948 11 948 — 8 197 8 197 —
Group Equity Value 103 506 71 392 32 114 95 936 64 729 31 207 (1) Refer embedded value of covered business on page 57.
20 Sanlam investor presentation 2015
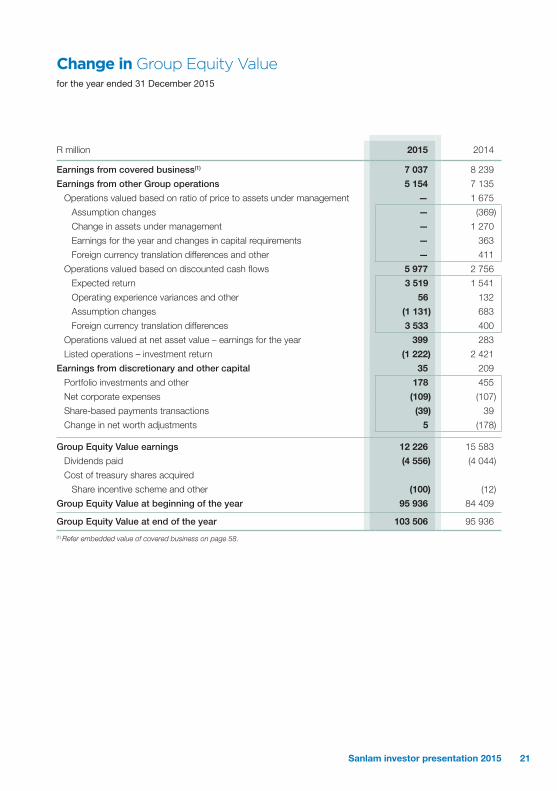
Change in Group Equity Valuefor the year ended 31 December 2015
R million 2015 2014
Earnings from covered business(1) 7 037 8 239
Earnings from other Group operations 5 154 7 135
Operations valued based on ratio of price to assets under management — 1 675
Assumption changes — (369)
Change in assets under management — 1 270
Earnings for the year and changes in capital requirements — 363
Foreign currency translation differences and other — 411
Operations valued based on discounted cash flows 5 977 2 756
Expected return 3 519 1 541
Operating experience variances and other 56 132
Assumption changes (1 131) 683
Foreign currency translation differences 3 533 400
Operations valued at net asset value – earnings for the year 399 283
Listed operations – investment return (1 222) 2 421
Earnings from discretionary and other capital 35 209
Portfolio investments and other 178 455
Net corporate expenses (109) (107)
Share-based payments transactions (39) 39
Change in net worth adjustments 5 (178)
Group Equity Value earnings 12 226 15 583
Dividends paid (4 556) (4 044)
Cost of treasury shares acquired
Share incentive scheme and other (100) (12)
Group Equity Value at beginning of the year 95 936 84 409
Group Equity Value at end of the year 103 506 95 936
(1) Refer embedded value of covered business on page 58.
21Sanlam investor presentation 2015

Return on Group Equity Valuefor the year ended 31 December 2015
2015 2014
EarningsR million
Return%
EarningsR million
Return%
Sanlam Personal Finance 4 658 12,1 6 372 17,9
Covered business(1) 4 363 12,3 5 805 17,6
Other operations 295 9,8 567 21,5
Sanlam Emerging Markets 4 369 29,9 2 910 28,0
Covered business(1) 1 403 27,4 932 26,3
Other operations 2 966 31,2 1 978 28,9
Sanlam Investments 4 386 21,3 3 671 20,4
Covered business(1) 1 271 16,2 1 502 21,8
Other operations 3 115 24,5 2 169 19,6
Santam (1 222) (8,4) 2 421 19,1
Discretionary and other capital 35 209
Return on Group Equity Value 12 226 12,7 15 583 18,5
Return on Group Equity Value per share 12,8 18,5
(1) Refer embedded value of covered business on page 58.
R million 2015 2014
Reconciliation of return on Group Equity Value:
The return on Group Equity Value reconciles as follows to normalised attributable earnings:
Normalised attributable earnings per shareholders’ fund income statement on page 28. 8 942 8 744
Net foreign currency translation gains recognised in other comprehensive income 3 011 536
Earnings recognised directly in equity
Share-based payment transactions 45 82
Net cost of treasury shares delivered (364) (294)
Share-based payments 409 376
Other comprehensive income 461 128
Change in ownership of subsidiaries (268) (56)
Movement in fair value adjustment – shareholders’ fund at fair value (914) 3 200
Movement in adjustments to net worth 95 (104)
Present value of holding company expenses 5 (178)
Change in goodwill and value of business acquired adjustments less value of in-force acquired 90 74
Growth from covered business: value of in-force(1) 854 3 053
Return on Group Equity Value 12 226 15 583
(1) Refer embedded value of covered business on page 58.
22 Sanlam investor presentation 2015
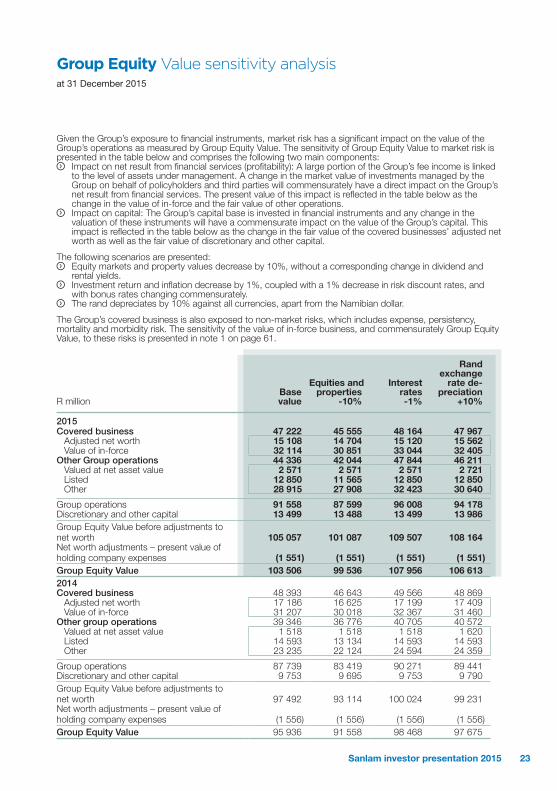
Group Equity Value sensitivity analysisat 31 December 2015
Given the Group’s exposure to financial instruments, market risk has a significant impact on the value of the Group’s operations as measured by Group Equity Value. The sensitivity of Group Equity Value to market risk is presented in the table below and comprises the following two main components:
Impact on net result from financial services (profitability): A large portion of the Group’s fee income is linked to the level of assets under management. A change in the market value of investments managed by the Group on behalf of policyholders and third parties will commensurately have a direct impact on the Group’s net result from financial services. The present value of this impact is reflected in the table below as the change in the value of in-force and the fair value of other operations.
Impact on capital: The Group’s capital base is invested in financial instruments and any change in the valuation of these instruments will have a commensurate impact on the value of the Group’s capital. This impact is reflected in the table below as the change in the fair value of the covered businesses’ adjusted net worth as well as the fair value of discretionary and other capital.
The following scenarios are presented: Equity markets and property values decrease by 10%, without a corresponding change in dividend and
rental yields. Investment return and inflation decrease by 1%, coupled with a 1% decrease in risk discount rates, and
with bonus rates changing commensurately. The rand depreciates by 10% against all currencies, apart from the Namibian dollar.
The Group’s covered business is also exposed to non-market risks, which includes expense, persistency, mortality and morbidity risk. The sensitivity of the value of in-force business, and commensurately Group Equity Value, to these risks is presented in note 1 on page 61.
R millionBase value
Equities andproperties
-10%
Interest rates-1%
Rand exchange
rate de-preciation
+10%
2015Covered business 47 222 45 555 48 164 47 967
Adjusted net worth 15 108 14 704 15 120 15 562Value of in-force 32 114 30 851 33 044 32 405
Other Group operations 44 336 42 044 47 844 46 211Valued at net asset value 2 571 2 571 2 571 2 721Listed 12 850 11 565 12 850 12 850Other 28 915 27 908 32 423 30 640
Group operations 91 558 87 599 96 008 94 178Discretionary and other capital 13 499 13 488 13 499 13 986Group Equity Value before adjustments to net worth 105 057 101 087 109 507 108 164Net worth adjustments – present value of holding company expenses (1 551) (1 551) (1 551) (1 551)Group Equity Value 103 506 99 536 107 956 106 6132014Covered business 48 393 46 643 49 566 48 869
Adjusted net worth 17 186 16 625 17 199 17 409 Value of in-force 31 207 30 018 32 367 31 460
Other group operations 39 346 36 776 40 705 40 572 Valued at net asset value 1 518 1 518 1 518 1 620 Listed 14 593 13 134 14 593 14 593 Other 23 235 22 124 24 594 24 359
Group operations 87 739 83 419 90 271 89 441 Discretionary and other capital 9 753 9 695 9 753 9 790 Group Equity Value before adjustments to net worth 97 492 93 114 100 024 99 231 Net worth adjustments – present value of holding company expenses (1 556) (1 556) (1 556) (1 556) Group Equity Value 95 936 91 558 98 468 97 675
23Sanlam investor presentation 2015

Shareholders’ fund at fair valueat 31 December 2015
2015 2014
R million NoteFair
value
Fair value
adjust-ment
Net asset value
Fair value
Fair value
adjust-ment
Net asset value
Covered business, discretionary and other capital 30 324 (419) 30 743 28 691 112 28 579 Property and equipment 458 — 458 360 — 360 Owner-occupied properties 668 — 668 470 — 470 Goodwill(2) 679 — 679 648 — 648 Value of business acquired(2) 1 177 — 1 177 1 214 — 1 214 Other intangible assets 195 — 195 153 — 153 Deferred acquisition costs 2 572 — 2 572 2 457 — 2 457 Investments 27 412 (574) 27 986 25 365 112 25 253
Properties 456 — 456 338 — 338 Associated companies 2 304 — 2 304 1 540 — 1 540 Equities and similar securities 3 130 — 3 130 5 157 112 5 045 Other interest-bearing and preference share investments 8 351 — 8 351 9 792 — 9 792 Structured transactions 821 — 821 737 — 737 Investment funds 4 780 — 4 780 4 883 — 4 883 Cash, deposits and similar securities 7 570 (574) 8 144 2 918 — 2 918
Net term finance — — — — — —Term finance (3 698) — (3 698) (3 875) — (3 875) Assets held in respect of term finance 3 698 — 3 698 3 875 — 3 875
Net deferred tax (870) — (870) (1 145) — (1 145) Net defined benefit asset — — — 144 — 144 Net working capital 803 155 648 1 563 — 1 563 Structured transactions liability (31) — (31) (2) — (2) Non-controlling interest (2 739) — (2 739) (2 536) — (2 536) Other Group operations 44 336 19 615 24 721 39 346 19 998 19 348 Sanlam Investments 15 202 10 645 4 557 12 289 8 588 3 701
Investment Management 14 417 10 507 3 910 11 604 8 536 3 068 Capital Management 785 138 647 685 52 633
Sanlam Personal Finance 3 723 1 942 1 781 3 009 2 092 917 Glacier 1 605 1 239 366 1 542 1 235 307 Sanlam Personal Loans(4) 913 314 599 907 365 542 Afrocentric 703 — 703 — — —Other operations 502 389 113 560 492 68
Sanlam Emerging Markets 12 561 512 12 049 9 455 415 9 040 Shriram Capital 7 594 863 6 731 5 595 516 5 079 Letshego 1 106 83 1 023 923 70 853 Pacific & Orient 812 75 737 704 71 633 Capricorn Investment Holdings 877 31 846 845 84 761 Other operations 2 172 (540) 2 712 1 388 (326) 1 714
Santam 12 850 7 713 5 137 14 593 10 150 4 443 Goodwill held on Group level in respect of the above businesses — (1 197) 1 197 — (1 247) 1 247
Shareholders’ fund at fair value 74 660 19 196 55 464 68 037 20 110 47 927
Value per share (cents) 9 3 648 938 2 710 3 322 982 2 340
24 Sanlam investor presentation 2015
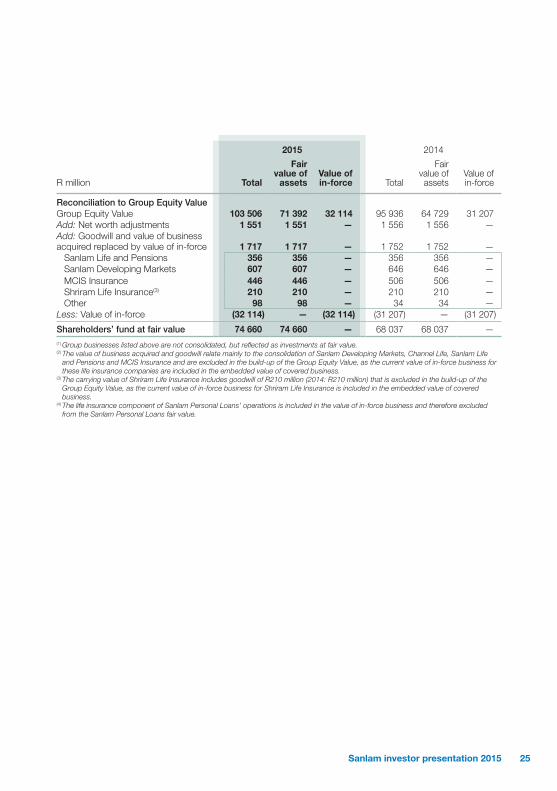
2015 2014
R million Total
Fair value of
assetsValue of in-force Total
Fair value of assets
Value of in-force
Reconciliation to Group Equity ValueGroup Equity Value 103 506 71 392 32 114 95 936 64 729 31 207 Add: Net worth adjustments 1 551 1 551 — 1 556 1 556 —Add: Goodwill and value of business acquired replaced by value of in-force 1 717 1 717 — 1 752 1 752 —
Sanlam Life and Pensions 356 356 — 356 356 —Sanlam Developing Markets 607 607 — 646 646 —MCIS Insurance 446 446 — 506 506 —Shriram Life Insurance(3) 210 210 — 210 210 —Other 98 98 — 34 34 —
Less: Value of in-force (32 114) — (32 114) (31 207) — (31 207)
Shareholders’ fund at fair value 74 660 74 660 — 68 037 68 037 —(1) Group businesses listed above are not consolidated, but reflected as investments at fair value.(2) The value of business acquired and goodwill relate mainly to the consolidation of Sanlam Developing Markets, Channel Life, Sanlam Life
and Pensions and MCIS Insurance and are excluded in the build-up of the Group Equity Value, as the current value of in-force business for these life insurance companies are included in the embedded value of covered business.
(3) The carrying value of Shriram Life Insurance includes goodwill of R210 million (2014: R210 million) that is excluded in the build-up of the Group Equity Value, as the current value of in-force business for Shriram Life Insurance is included in the embedded value of covered business.
(4) The life insurance component of Sanlam Personal Loans’ operations is included in the value of in-force business and therefore excluded from the Sanlam Personal Loans fair value.
25Sanlam investor presentation 2015

Shareholders’ fund at net asset valueat 31 December 2015
Sanlam Life(1)
Sanlam Emerging Markets(2) Santam
Investment Management
Capital Management
Corporate and Other(3)
Consolidation entries(4) Total
R million Note 2015 2014 2015 2014 2015 2014 2015 2014 2015 2014 2015 2014 2015 2014 2015 2014
Property and equipment 291 252 195 125 296 269 71 44 12 5 — — 1 1 866 696 Owner-occupied properties 470 470 260 53 1 1 114 109 — — — — — — 845 633 Goodwill 278 301 350 273 770 1 005 1 300 1 148 — — — — 1 197 1 247 3 895 3 974 Other intangible assets 22 — 183 158 35 23 203 214 — — — — — — 443 395 Value of business acquired 543 527 705 767 — 89 695 662 — — — — — — 1 943 2 045 Deferred acquisition costs 2 851 2 696 2 3 — — — — — — — — — — 2 853 2 699 Investments 3.3 33 383 30 869 18 393 15 139 10 668 9 557 2 282 1 314 — — 1 746 2 022 (8 727) (10 334) 57 745 48 567
Properties 130 139 880 550 — — — — — — — — — — 1 010 689 Associated companies 3.1 706 2 13 557 10 575 996 1 038 404 215 — — — — (989) (879) 14 674 10 951 Joint ventures 3.2 805 626 — — 66 — 1 — — — — — — — 872 626 Equities and similar securities 10 206 12 850 707 973 1 694 3 068 288 164 — — 543 556 (7 468) (8 530) 5 970 9 081 Interest-bearing investments 8 061 9 302 1 648 1 941 5 076 4 245 180 197 — — 1 195 1 464 (270) (925) 15 890 16 224Structured transactions 1 197 900 — — 503 248 3 — — — — — — — 1 703 1 148 Investment funds 4 967 5 059 241 170 310 364 837 326 — — — — — — 6 355 5 919Cash, deposits and similar securities 7 311 1 991 1 360 930 2 023 594 569 412 — — 8 2 — — 11 271 3 929
Net deferred tax (689) (848) (217) (292) 63 (120) 43 69 67 59 — (45) 3 18 (730) (1 159) Deferred tax asset 56 42 40 7 140 161 57 73 67 59 — 5 8 18 368 365 Deferred tax liability (745) (890) (257) (299) (77) (281) (14) (4) — — — (50) (5) — (1 098) (1 524)
Disposal groups classified as held for sale — — — — 540 427 — — — — — — — — 540 427 Assets of disposal groups classified as held for sale — — — 1 466 540 427 — — — — — — — — 540 1 893 Liabilities of disposal groups classified as held for sale — — — (1 466) — — — — — — — — — — — (1 466)
Net general insurance technical provisions — — (388) (153) (8 884) (8 475) — — — — — — — — (9 272) (8 628) General insurance technical assets — — 109 12 4 142 3 952 — — — — — — — — 4 251 3 964 General insurance technical provisions — — (497) (165) (13 026) (12 427) — — — — — — — — (13 523) (12 592)
Net defined benefit asset — 144 — — — — — — — — — — — — — 144 Net working capital assets/(liabilities) (191) (3 335) (6) 5 7 081 6 703 1 637 1 627 725 816 (480) (62) 339 3 820 9 105 9 574
Trade and other receivables 2 842 4 409 1 361 1 035 3 584 2 871 1 619 1 564 21 365 22 887 2 899 2 826 (5 586) (5 255) 28 084 30 337 Cash, deposits and similar securities 4 618 3 705 599 560 7 489 6 854 1 983 1 866 3 771 2 090 650 513 (195) (199) 18 915 15 389 Trade and other payables (6 177) (10 239) (1 961) (1 614) (3 629) (2 776) (1 819) (1 613) (24 380) (24 133) (4 032) (3 407) 6 123 9 297 (35 875) (34 485) Provisions (134) (138) — — (45) (25) (102) (84) — — (21) (18) (17) (18) (319) (283) Taxation (1 340) (1 072) (5) 24 (318) (221) (44) (106) (31) (28) 24 24 14 (5) (1 700) (1 384)
Term finance (2 260) (2 340) (69) (12) (998) (1 024) (419) (403) — — (1 438) (1 536) — — (5 184) (5 315) Structured transactions liabilities (31) (2) — — (3) — — — — — — — — — (34) (2) Cell owners’ interest — — — — (980) (925) — — — — — — — — (980) (925) Non-controlling interest (36) (36) (4 032) (3 603) (3 452) (3 087) (73) (48) — — — — 1 022 1 576 (6 571) (5 198)
Shareholders’ fund at net asset value 34 631 28 698 15 376 12 463 5 137 4 443 5 853 4 736 804 880 (172) 379 (6 165) (3 672) 55 464 47 927
Analysis of shareholders’ fundCovered business 12 007 14 471 2 323 2 324 — — 778 391 — — — — — — 15 108 17 186 Other operations 1 781 917 12 049 9 040 5 137 4 443 3 910 3 068 647 633 — — 1 197 1 247 24 721 19 348Discretionary and other capital 20 843 13 310 1 004 1 099 — — 1 165 1 277 157 247 (172) 379 (7 362) (4 919) 15 635 11 393
Shareholders’ fund at net asset value 34 631 28 698 15 376 12 463 5 137 4 443 5 853 4 736 804 880 (172) 379 (6 165) (3 672) 55 464 47 927 Consolidation reserve — — — — — — — — — — — — (1 843) (1 890) (1 843) (1 890)
Shareholders’ fund per Group statement of financial position 34 631 28 698 15 376 12 463 5 137 4 443 5 853 4 736 804 880 (172) 379 (8 008) (5 562) 53 621 46 037 (1) Includes the operations of Sanlam Personal Finance and Sanlam Employee Benefits as well as discretionary capital held by Sanlam Life.
Equities and similar securities include an investment of R7 114 million (2014: R8 196 million) in Sanlam shares, which is eliminated in the consolidation column.
(2) Includes discretionary capital held by Sanlam Emerging Markets.
(3) Corporate and Other includes the assets of Genbel Securities and Sanlam Limited Corporate on a consolidated basis.(4) The investment in treasury shares is reversed within the consolidation column. Intercompany balances, other investments and term finance
between companies within the Group are also eliminated.
26 Sanlam investor presentation 2015
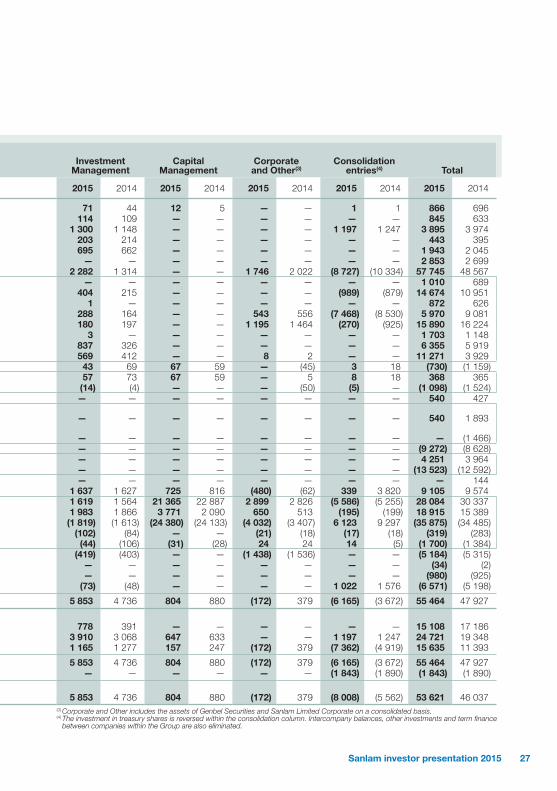
Sanlam Life(1)
Sanlam Emerging Markets(2) Santam
Investment Management
Capital Management
Corporate and Other(3)
Consolidation entries(4) Total
R million Note 2015 2014 2015 2014 2015 2014 2015 2014 2015 2014 2015 2014 2015 2014 2015 2014
Property and equipment 291 252 195 125 296 269 71 44 12 5 — — 1 1 866 696 Owner-occupied properties 470 470 260 53 1 1 114 109 — — — — — — 845 633 Goodwill 278 301 350 273 770 1 005 1 300 1 148 — — — — 1 197 1 247 3 895 3 974 Other intangible assets 22 — 183 158 35 23 203 214 — — — — — — 443 395 Value of business acquired 543 527 705 767 — 89 695 662 — — — — — — 1 943 2 045 Deferred acquisition costs 2 851 2 696 2 3 — — — — — — — — — — 2 853 2 699 Investments 3.3 33 383 30 869 18 393 15 139 10 668 9 557 2 282 1 314 — — 1 746 2 022 (8 727) (10 334) 57 745 48 567
Properties 130 139 880 550 — — — — — — — — — — 1 010 689 Associated companies 3.1 706 2 13 557 10 575 996 1 038 404 215 — — — — (989) (879) 14 674 10 951 Joint ventures 3.2 805 626 — — 66 — 1 — — — — — — — 872 626 Equities and similar securities 10 206 12 850 707 973 1 694 3 068 288 164 — — 543 556 (7 468) (8 530) 5 970 9 081 Interest-bearing investments 8 061 9 302 1 648 1 941 5 076 4 245 180 197 — — 1 195 1 464 (270) (925) 15 890 16 224Structured transactions 1 197 900 — — 503 248 3 — — — — — — — 1 703 1 148 Investment funds 4 967 5 059 241 170 310 364 837 326 — — — — — — 6 355 5 919Cash, deposits and similar securities 7 311 1 991 1 360 930 2 023 594 569 412 — — 8 2 — — 11 271 3 929
Net deferred tax (689) (848) (217) (292) 63 (120) 43 69 67 59 — (45) 3 18 (730) (1 159) Deferred tax asset 56 42 40 7 140 161 57 73 67 59 — 5 8 18 368 365 Deferred tax liability (745) (890) (257) (299) (77) (281) (14) (4) — — — (50) (5) — (1 098) (1 524)
Disposal groups classified as held for sale — — — — 540 427 — — — — — — — — 540 427 Assets of disposal groups classified as held for sale — — — 1 466 540 427 — — — — — — — — 540 1 893 Liabilities of disposal groups classified as held for sale — — — (1 466) — — — — — — — — — — — (1 466)
Net general insurance technical provisions — — (388) (153) (8 884) (8 475) — — — — — — — — (9 272) (8 628) General insurance technical assets — — 109 12 4 142 3 952 — — — — — — — — 4 251 3 964 General insurance technical provisions — — (497) (165) (13 026) (12 427) — — — — — — — — (13 523) (12 592)
Net defined benefit asset — 144 — — — — — — — — — — — — — 144 Net working capital assets/(liabilities) (191) (3 335) (6) 5 7 081 6 703 1 637 1 627 725 816 (480) (62) 339 3 820 9 105 9 574
Trade and other receivables 2 842 4 409 1 361 1 035 3 584 2 871 1 619 1 564 21 365 22 887 2 899 2 826 (5 586) (5 255) 28 084 30 337 Cash, deposits and similar securities 4 618 3 705 599 560 7 489 6 854 1 983 1 866 3 771 2 090 650 513 (195) (199) 18 915 15 389 Trade and other payables (6 177) (10 239) (1 961) (1 614) (3 629) (2 776) (1 819) (1 613) (24 380) (24 133) (4 032) (3 407) 6 123 9 297 (35 875) (34 485) Provisions (134) (138) — — (45) (25) (102) (84) — — (21) (18) (17) (18) (319) (283) Taxation (1 340) (1 072) (5) 24 (318) (221) (44) (106) (31) (28) 24 24 14 (5) (1 700) (1 384)
Term finance (2 260) (2 340) (69) (12) (998) (1 024) (419) (403) — — (1 438) (1 536) — — (5 184) (5 315) Structured transactions liabilities (31) (2) — — (3) — — — — — — — — — (34) (2) Cell owners’ interest — — — — (980) (925) — — — — — — — — (980) (925) Non-controlling interest (36) (36) (4 032) (3 603) (3 452) (3 087) (73) (48) — — — — 1 022 1 576 (6 571) (5 198)
Shareholders’ fund at net asset value 34 631 28 698 15 376 12 463 5 137 4 443 5 853 4 736 804 880 (172) 379 (6 165) (3 672) 55 464 47 927
Analysis of shareholders’ fundCovered business 12 007 14 471 2 323 2 324 — — 778 391 — — — — — — 15 108 17 186 Other operations 1 781 917 12 049 9 040 5 137 4 443 3 910 3 068 647 633 — — 1 197 1 247 24 721 19 348Discretionary and other capital 20 843 13 310 1 004 1 099 — — 1 165 1 277 157 247 (172) 379 (7 362) (4 919) 15 635 11 393
Shareholders’ fund at net asset value 34 631 28 698 15 376 12 463 5 137 4 443 5 853 4 736 804 880 (172) 379 (6 165) (3 672) 55 464 47 927 Consolidation reserve — — — — — — — — — — — — (1 843) (1 890) (1 843) (1 890)
Shareholders’ fund per Group statement of financial position 34 631 28 698 15 376 12 463 5 137 4 443 5 853 4 736 804 880 (172) 379 (8 008) (5 562) 53 621 46 037 (1) Includes the operations of Sanlam Personal Finance and Sanlam Employee Benefits as well as discretionary capital held by Sanlam Life.
Equities and similar securities include an investment of R7 114 million (2014: R8 196 million) in Sanlam shares, which is eliminated in the consolidation column.
(2) Includes discretionary capital held by Sanlam Emerging Markets.
(3) Corporate and Other includes the assets of Genbel Securities and Sanlam Limited Corporate on a consolidated basis.(4) The investment in treasury shares is reversed within the consolidation column. Intercompany balances, other investments and term finance
between companies within the Group are also eliminated.
27Sanlam investor presentation 2015

Shareholders’ fund income statementfor the year ended 31 December 2015
Sanlam Personal Finance
Sanlam Emerging Markets
Sanlam Investments Santam
Corporate and Other(1) Total
R million Note 2015 2014 2015 2014 2015 2014 2015 2014 2015 2014 2015 2014
Financial services income 4 15 221 14 364 6 078 5 236 8 859 8 286 19 066 17 700 141 127 49 365 45 713 Sales remuneration 5 (2 656) (2 369) (1 091) (842) (248) (249) (2 004) (1 863) — — (5 999) (5 323)
Income after sales remuneration 12 565 11 995 4 987 4 394 8 611 8 037 17 062 15 837 141 127 43 366 40 390 Underwriting policy benefits (3 236) (3 442) (1 258) (1 070) (2 135) (2 063) (11 510) (10 878) — — (18 139) (17 453) Administration costs 6 (4 016) (3 752) (1 481) (1 111) (4 599) (4 047) (3 231) (2 991) (305) (292) (13 632) (12 193)
Result from financial services before tax 5 313 4 801 2 248 2 213 1 877 1 927 2 321 1 968 (164) (165) 11 595 10 744 Tax on result from financial services (1 478) (1 325) (579) (604) (426) (425) (670) (553) 55 58 (3 098) (2 849)
Result from financial services after tax 3 835 3 476 1 669 1 609 1 451 1 502 1 651 1 415 (109) (107) 8 497 7 895 Non-controlling interest (4) — (472) (368) (34) (34) (718) (614) — — (1 228) (1 016)
Net result from financial services 3 831 3 476 1 197 1 241 1 417 1 468 933 801 (109) (107) 7 269 6 879 Net investment income 746 735 129 112 189 178 93 94 (189) (188) 968 931
Dividends received – Group companies 263 235 — — — — — — (263) (235) — —Other investment income 7 642 649 277 217 224 224 191 181 19 59 1 353 1 330 Tax on investment income (159) (149) (101) (72) (35) (46) (28) (18) 55 (12) (268) (297) Non-controlling interest — — (47) (33) — — (70) (69) — — (117) (102)
Project expenses — — (14) (13) — (1) — — (1) — (15) (14) Amortisation of value of business acquired and other intangibles (50) (39) (58) (13) (179) (143) (19) (15) — — (306) (210) Equity participation costs — — — — — (60) (43) (49) — — (43) (109) Net equity-accounted headline earnings — — 7 11 1 — 24 35 — — 32 46
Equity-accounted headline earnings — — 16 30 1 — 40 58 — — 57 88 Tax on equity-accounted headline earnings — — (3) (2) — — — — — — (3) (2) Non-controlling interest — — (6) (17) — — (16) (23) — — (22) (40)
Net investment surpluses (800) 2 406 238 111 197 221 210 93 1 101 (2 014) 946 817 Investment surpluses – Group companies (1 099) 1 964 — — — — — — 1 099 (1 964) — —Other investment surpluses 345 558 426 209 243 270 448 234 2 (50) 1 464 1 221 Tax on investment surpluses (46) (116) 14 (48) (46) (49) (105) (77) — — (183) (290) Non-controlling interest — — (202) (50) — — (133) (64) — — (335) (114)
Normalised headline earnings 3 727 6 578 1 499 1 449 1 625 1 663 1 198 959 802 (2 309) 8 851 8 340 Net profit/(loss) on disposal of subsidiaries and associated companies — — (1) 95 — 292 201 — — — 200 387
Profit/(loss) on disposal of subsidiaries and associated companies — — (2) 119 — 312 428 — — — 426 431 Tax on profit/(loss) on disposal of subsidiaries and associated companies — — — (32) — (20) (99) — — — (99) (52) Non-controlling interest — — 1 8 — — (128) — — — (127) 8
Impairments (17) — (53) (40) (7) (18) (32) (43) — — (109) (101) Net equity-accounted non-headline earnings — — — — — 118 — — — — — 118
Normalised attributable earnings 3 710 6 578 1 445 1 504 1 618 2 055 1 367 916 802 (2 309) 8 942 8 744 Fund transfers — — — — — — — — 449 (15) 449 (15)
Attributable earnings per Group statement of comprehensive income 3 710 6 578 1 445 1 504 1 618 2 055 1 367 916 1 251 (2 324) 9 391 8 729
Diluted earnings per share 8Adjusted weighted average number of shares (million) 2 046,3 2 046,2 Net result from financial services (cents) 187,2 169,9 58,5 60,6 69,2 71,7 45,6 39,1 (5,3) (5,2) 355,2 336,2
(1) Corporate and Other includes the consolidation entries in respect of the dividends received and the investment surpluses on the Sanlam Limited shares held by Sanlam Life Insurance Limited.
28 Sanlam investor presentation 2015
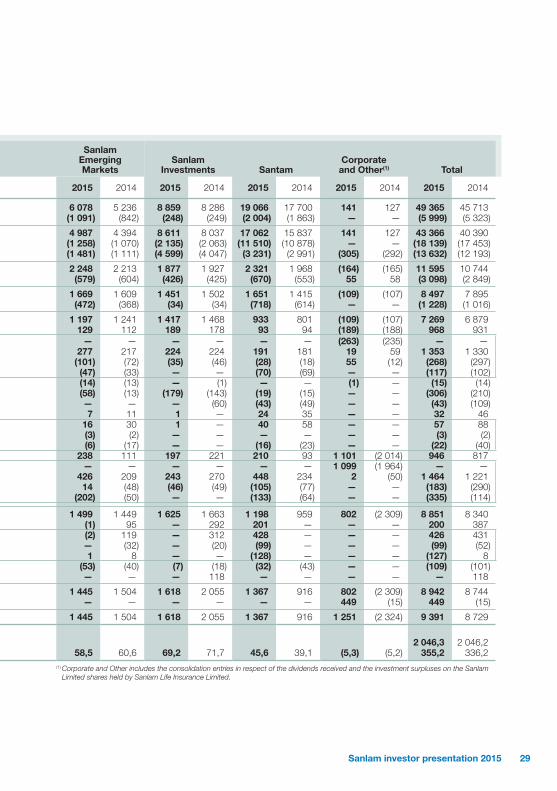
Sanlam Personal Finance
Sanlam Emerging Markets
Sanlam Investments Santam
Corporate and Other(1) Total
R million Note 2015 2014 2015 2014 2015 2014 2015 2014 2015 2014 2015 2014
Financial services income 4 15 221 14 364 6 078 5 236 8 859 8 286 19 066 17 700 141 127 49 365 45 713 Sales remuneration 5 (2 656) (2 369) (1 091) (842) (248) (249) (2 004) (1 863) — — (5 999) (5 323)
Income after sales remuneration 12 565 11 995 4 987 4 394 8 611 8 037 17 062 15 837 141 127 43 366 40 390 Underwriting policy benefits (3 236) (3 442) (1 258) (1 070) (2 135) (2 063) (11 510) (10 878) — — (18 139) (17 453) Administration costs 6 (4 016) (3 752) (1 481) (1 111) (4 599) (4 047) (3 231) (2 991) (305) (292) (13 632) (12 193)
Result from financial services before tax 5 313 4 801 2 248 2 213 1 877 1 927 2 321 1 968 (164) (165) 11 595 10 744 Tax on result from financial services (1 478) (1 325) (579) (604) (426) (425) (670) (553) 55 58 (3 098) (2 849)
Result from financial services after tax 3 835 3 476 1 669 1 609 1 451 1 502 1 651 1 415 (109) (107) 8 497 7 895 Non-controlling interest (4) — (472) (368) (34) (34) (718) (614) — — (1 228) (1 016)
Net result from financial services 3 831 3 476 1 197 1 241 1 417 1 468 933 801 (109) (107) 7 269 6 879 Net investment income 746 735 129 112 189 178 93 94 (189) (188) 968 931
Dividends received – Group companies 263 235 — — — — — — (263) (235) — —Other investment income 7 642 649 277 217 224 224 191 181 19 59 1 353 1 330 Tax on investment income (159) (149) (101) (72) (35) (46) (28) (18) 55 (12) (268) (297) Non-controlling interest — — (47) (33) — — (70) (69) — — (117) (102)
Project expenses — — (14) (13) — (1) — — (1) — (15) (14) Amortisation of value of business acquired and other intangibles (50) (39) (58) (13) (179) (143) (19) (15) — — (306) (210) Equity participation costs — — — — — (60) (43) (49) — — (43) (109) Net equity-accounted headline earnings — — 7 11 1 — 24 35 — — 32 46
Equity-accounted headline earnings — — 16 30 1 — 40 58 — — 57 88 Tax on equity-accounted headline earnings — — (3) (2) — — — — — — (3) (2) Non-controlling interest — — (6) (17) — — (16) (23) — — (22) (40)
Net investment surpluses (800) 2 406 238 111 197 221 210 93 1 101 (2 014) 946 817 Investment surpluses – Group companies (1 099) 1 964 — — — — — — 1 099 (1 964) — —Other investment surpluses 345 558 426 209 243 270 448 234 2 (50) 1 464 1 221 Tax on investment surpluses (46) (116) 14 (48) (46) (49) (105) (77) — — (183) (290) Non-controlling interest — — (202) (50) — — (133) (64) — — (335) (114)
Normalised headline earnings 3 727 6 578 1 499 1 449 1 625 1 663 1 198 959 802 (2 309) 8 851 8 340 Net profit/(loss) on disposal of subsidiaries and associated companies — — (1) 95 — 292 201 — — — 200 387
Profit/(loss) on disposal of subsidiaries and associated companies — — (2) 119 — 312 428 — — — 426 431 Tax on profit/(loss) on disposal of subsidiaries and associated companies — — — (32) — (20) (99) — — — (99) (52) Non-controlling interest — — 1 8 — — (128) — — — (127) 8
Impairments (17) — (53) (40) (7) (18) (32) (43) — — (109) (101) Net equity-accounted non-headline earnings — — — — — 118 — — — — — 118
Normalised attributable earnings 3 710 6 578 1 445 1 504 1 618 2 055 1 367 916 802 (2 309) 8 942 8 744 Fund transfers — — — — — — — — 449 (15) 449 (15)
Attributable earnings per Group statement of comprehensive income 3 710 6 578 1 445 1 504 1 618 2 055 1 367 916 1 251 (2 324) 9 391 8 729
Diluted earnings per share 8Adjusted weighted average number of shares (million) 2 046,3 2 046,2 Net result from financial services (cents) 187,2 169,9 58,5 60,6 69,2 71,7 45,6 39,1 (5,3) (5,2) 355,2 336,2
(1) Corporate and Other includes the consolidation entries in respect of the dividends received and the investment surpluses on the Sanlam Limited shares held by Sanlam Life Insurance Limited.
29Sanlam investor presentation 2015

Notes to the shareholders’ fund informationfor the year ended 31 December 2015
1. Business volumes1.1 Analysis of new business and total funds received
Analysed per business, reflecting the split between life and general insurance business
Life insurance(1)
General insurance
Investment business(2) Total
R million 2015 2014 2015 2014 2015 2014 2015 2014
Sanlam Personal Finance 28 974 25 145 — — 34 851 27 421 63 825 52 566 Sanlam Sky 1 279 1 127 — — — — 1 279 1 127 Individual Life 12 562 12 137 — — 267 306 12 829 12 443 Glacier 15 133 11 881 — — 34 584 27 115 49 717 38 996 Sanlam Emerging Markets 4 338 3 286 1 674 1 402 5 901 4 571 11 913 9 259 Namibia 491 362 — — 2 289 2 960 2 780 3 322
Recurring 151 153 — — — — 151 153 Single 340 209 — — 2 289 2 960 2 629 3 169
Botswana 2 087 1 477 57 54 3 254 1 500 5 398 3 031 Recurring 299 261 57 54 — — 356 315 Single 1 788 1 216 — — 3 254 1 500 5 042 2 716
Rest of Africa 1 185 1 163 556 286 358 111 2 099 1 560 Recurring 690 614 556 286 — — 1 246 900 Single 495 549 — — 358 111 853 660
India 234 146 628 508 — — 862 654 Recurring 147 67 628 508 — — 775 575 Single 87 79 — — — — 87 79
South-East Asia 341 138 433 554 — — 774 692 Recurring 255 104 433 554 — — 688 658 Single 86 34 — — — — 86 34
Sanlam Investments 6 664 13 859 — — 109 918 89 391 116 582 103 250 Employee benefits 2 913 10 154 — — — — 2 913 10 154
Recurring 487 305 — — — — 487 305 Single 2 426 9 849 — — — — 2 426 9 849
Investment Management 3 751 3 705 — — 109 909 89 391 113 660 93 096 Investment Management SA — — — — 83 132 63 314 83 132 63 314 Wealth Management — — — — 18 387 14 716 18 387 14 716 International 3 751 3 705 — — 8 390 11 141 12 141 14 846
Recurring 52 68 — — 16 32 68 100 Single 3 699 3 637 — — 8 374 11 109 12 073 14 746
Capital Management — — — — 9 220 9 220
Santam — — 18 522 17 222 — — 18 522 17 222
Total new business 39 976 42 290 20 196 18 624 150 670 121 383 210 842 182 297
(1) Life insurance business relates to business written under a life licence that is included in the calculation of embedded value of covered business.
(2) Includes life licence and investment business. Life licence business relates to investment products provided by means of a life insurance policy where there is very little or no insurance risk. Life licence business is excluded from the calculation of embedded value of covered business.
30 Sanlam investor presentation 2015
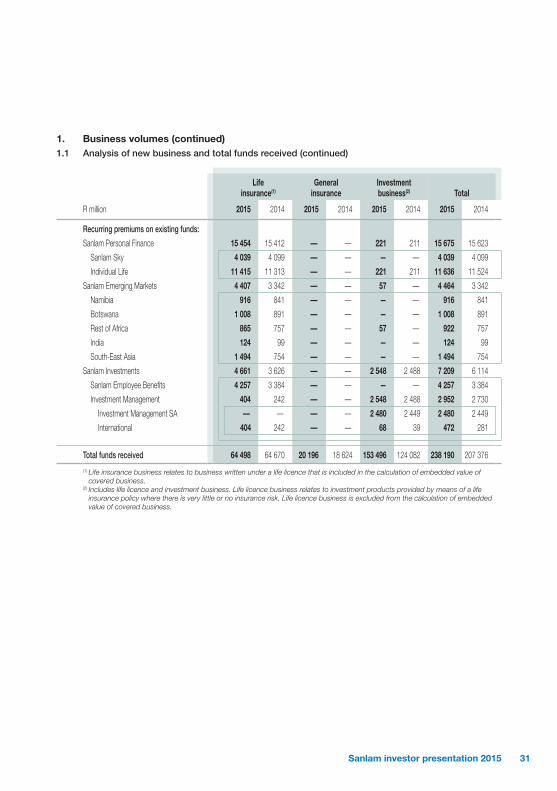
1. Business volumes (continued)1.1 Analysis of new business and total funds received (continued)
Life insurance(1)
General insurance
Investment business(2) Total
R million 2015 2014 2015 2014 2015 2014 2015 2014
Recurring premiums on existing funds:
Sanlam Personal Finance 15 454 15 412 — — 221 211 15 675 15 623
Sanlam Sky 4 039 4 099 — — — — 4 039 4 099
Individual Life 11 415 11 313 — — 221 211 11 636 11 524
Sanlam Emerging Markets 4 407 3 342 — — 57 — 4 464 3 342
Namibia 916 841 — — — — 916 841
Botswana 1 008 891 — — — — 1 008 891
Rest of Africa 865 757 — — 57 — 922 757
India 124 99 — — — — 124 99
South-East Asia 1 494 754 — — — — 1 494 754
Sanlam Investments 4 661 3 626 — — 2 548 2 488 7 209 6 114
Sanlam Employee Benefits 4 257 3 384 — — — — 4 257 3 384
Investment Management 404 242 — — 2 548 2 488 2 952 2 730
Investment Management SA — — — — 2 480 2 449 2 480 2 449
International 404 242 — — 68 39 472 281
Total funds received 64 498 64 670 20 196 18 624 153 496 124 082 238 190 207 376
(1) Life insurance business relates to business written under a life licence that is included in the calculation of embedded value of covered business.
(2) Includes life licence and investment business. Life licence business relates to investment products provided by means of a life insurance policy where there is very little or no insurance risk. Life licence business is excluded from the calculation of embedded value of covered business.
31Sanlam investor presentation 2015
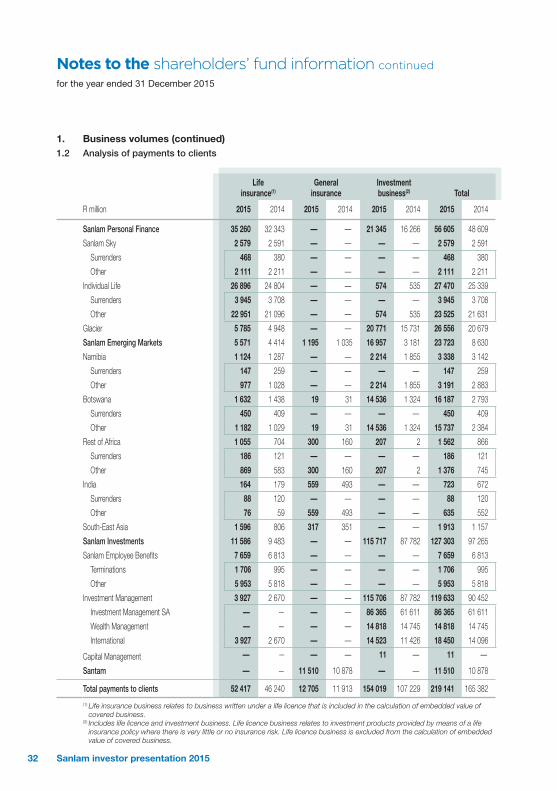
Notes to the shareholders’ fund information continued
for the year ended 31 December 2015
1. Business volumes (continued)1.2 Analysis of payments to clients
Life insurance(1)
General insurance
Investment business(2) Total
R million 2015 2014 2015 2014 2015 2014 2015 2014
Sanlam Personal Finance 35 260 32 343 — — 21 345 16 266 56 605 48 609
Sanlam Sky 2 579 2 591 — — — — 2 579 2 591
Surrenders 468 380 — — — — 468 380
Other 2 111 2 211 — — — — 2 111 2 211
Individual Life 26 896 24 804 — — 574 535 27 470 25 339
Surrenders 3 945 3 708 — — — — 3 945 3 708
Other 22 951 21 096 — — 574 535 23 525 21 631
Glacier 5 785 4 948 — — 20 771 15 731 26 556 20 679
Sanlam Emerging Markets 5 571 4 414 1 195 1 035 16 957 3 181 23 723 8 630
Namibia 1 124 1 287 — — 2 214 1 855 3 338 3 142
Surrenders 147 259 — — — — 147 259
Other 977 1 028 — — 2 214 1 855 3 191 2 883
Botswana 1 632 1 438 19 31 14 536 1 324 16 187 2 793
Surrenders 450 409 — — — — 450 409
Other 1 182 1 029 19 31 14 536 1 324 15 737 2 384
Rest of Africa 1 055 704 300 160 207 2 1 562 866
Surrenders 186 121 — — — — 186 121
Other 869 583 300 160 207 2 1 376 745
India 164 179 559 493 — — 723 672
Surrenders 88 120 — — — — 88 120
Other 76 59 559 493 — — 635 552
South-East Asia 1 596 806 317 351 — — 1 913 1 157
Sanlam Investments 11 586 9 483 — — 115 717 87 782 127 303 97 265
Sanlam Employee Benefits 7 659 6 813 — — — — 7 659 6 813
Terminations 1 706 995 — — — — 1 706 995
Other 5 953 5 818 — — — — 5 953 5 818
Investment Management 3 927 2 670 — — 115 706 87 782 119 633 90 452
Investment Management SA — — — — 86 365 61 611 86 365 61 611
Wealth Management — — — — 14 818 14 745 14 818 14 745
International 3 927 2 670 — — 14 523 11 426 18 450 14 096
Capital Management — — — — 11 — 11 —
Santam — — 11 510 10 878 — — 11 510 10 878
Total payments to clients 52 417 46 240 12 705 11 913 154 019 107 229 219 141 165 382
(1) Life insurance business relates to business written under a life licence that is included in the calculation of embedded value of covered business.
(2) Includes life licence and investment business. Life licence business relates to investment products provided by means of a life insurance policy where there is very little or no insurance risk. Life licence business is excluded from the calculation of embedded value of covered business.
32 Sanlam investor presentation 2015
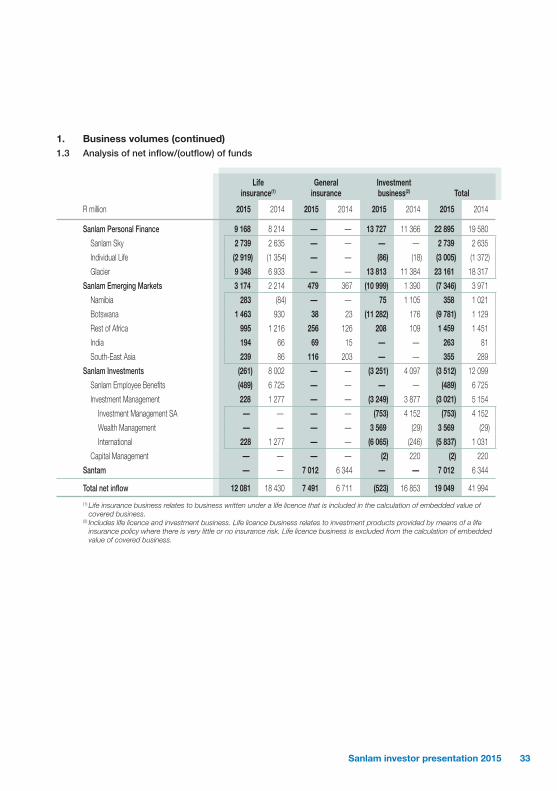
1. Business volumes (continued)1.3 Analysis of net inflow/(outflow) of funds
Life insurance(1)
General insurance
Investment business(2) Total
R million 2015 2014 2015 2014 2015 2014 2015 2014
Sanlam Personal Finance 9 168 8 214 — — 13 727 11 366 22 895 19 580
Sanlam Sky 2 739 2 635 — — — — 2 739 2 635
Individual Life (2 919) (1 354) — — (86) (18) (3 005) (1 372)
Glacier 9 348 6 933 — — 13 813 11 384 23 161 18 317
Sanlam Emerging Markets 3 174 2 214 479 367 (10 999) 1 390 (7 346) 3 971
Namibia 283 (84) — — 75 1 105 358 1 021
Botswana 1 463 930 38 23 (11 282) 176 (9 781) 1 129
Rest of Africa 995 1 216 256 126 208 109 1 459 1 451
India 194 66 69 15 — — 263 81
South-East Asia 239 86 116 203 — — 355 289
Sanlam Investments (261) 8 002 — — (3 251) 4 097 (3 512) 12 099
Sanlam Employee Benefits (489) 6 725 — — — — (489) 6 725
Investment Management 228 1 277 — — (3 249) 3 877 (3 021) 5 154
Investment Management SA — — — — (753) 4 152 (753) 4 152
Wealth Management — — — — 3 569 (29) 3 569 (29)
International 228 1 277 — — (6 065) (246) (5 837) 1 031
Capital Management — — — — (2) 220 (2) 220
Santam — — 7 012 6 344 — — 7 012 6 344
Total net inflow 12 081 18 430 7 491 6 711 (523) 16 853 19 049 41 994
(1) Life insurance business relates to business written under a life licence that is included in the calculation of embedded value of covered business.
(2) Includes life licence and investment business. Life licence business relates to investment products provided by means of a life insurance policy where there is very little or no insurance risk. Life licence business is excluded from the calculation of embedded value of covered business.
33Sanlam investor presentation 2015
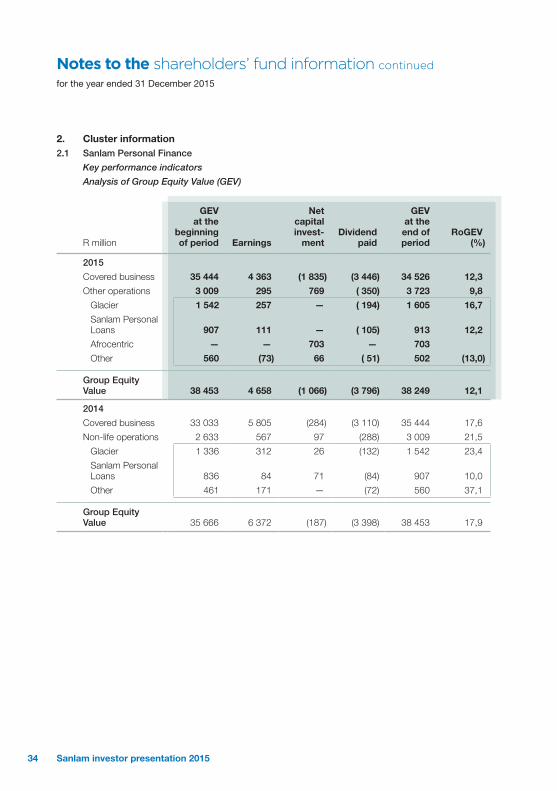
Notes to the shareholders’ fund information continued
for the year ended 31 December 2015
2. Cluster information2.1 Sanlam Personal Finance
Key performance indicators
Analysis of Group Equity Value (GEV)
R million
GEV at the
beginning of period Earnings
Net capital invest-
ment Dividend
paid
GEV at the end of period
RoGEV (%)
2015
Covered business 35 444 4 363 (1 835) (3 446) 34 526 12,3
Other operations 3 009 295 769 ( 350) 3 723 9,8
Glacier 1 542 257 — ( 194) 1 605 16,7
Sanlam Personal Loans 907 111 — ( 105) 913 12,2
Afrocentric — — 703 — 703
Other 560 (73) 66 ( 51) 502 (13,0)
Group Equity Value 38 453 4 658 (1 066) (3 796) 38 249 12,1
2014
Covered business 33 033 5 805 (284) (3 110) 35 444 17,6
Non-life operations 2 633 567 97 (288) 3 009 21,5
Glacier 1 336 312 26 (132) 1 542 23,4
Sanlam Personal Loans 836 84 71 (84) 907 10,0
Other 461 171 — (72) 560 37,1
Group Equity Value 35 666 6 372 (187) (3 398) 38 453 17,9
34 Sanlam investor presentation 2015
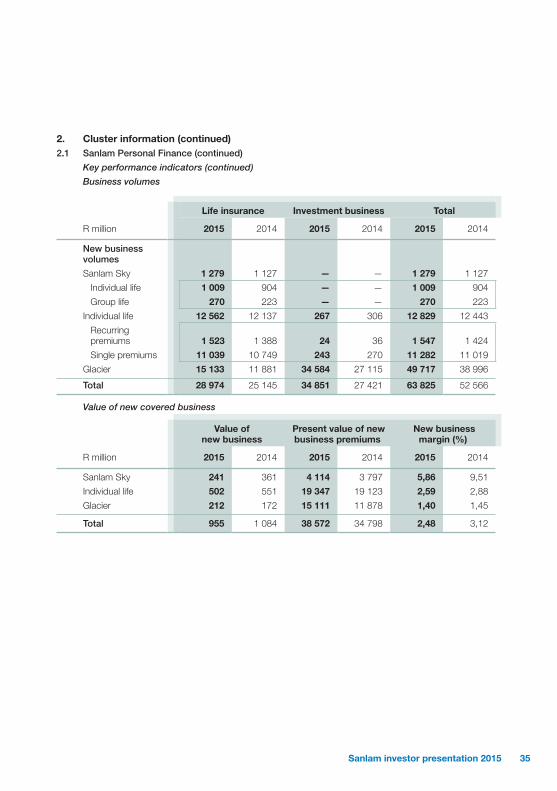
2. Cluster information (continued)2.1 Sanlam Personal Finance (continued)
Key performance indicators (continued)
Business volumes
Life insurance Investment business Total
R million 2015 2014 2015 2014 2015 2014
New business volumes
Sanlam Sky 1 279 1 127 — — 1 279 1 127
Individual life 1 009 904 — — 1 009 904
Group life 270 223 — — 270 223
Individual life 12 562 12 137 267 306 12 829 12 443
Recurring premiums 1 523 1 388 24 36 1 547 1 424
Single premiums 11 039 10 749 243 270 11 282 11 019
Glacier 15 133 11 881 34 584 27 115 49 717 38 996
Total 28 974 25 145 34 851 27 421 63 825 52 566
Value of new covered business
Value of new business
Present value of new business premiums
New business margin (%)
R million 2015 2014 2015 2014 2015 2014
Sanlam Sky 241 361 4 114 3 797 5,86 9,51
Individual life 502 551 19 347 19 123 2,59 2,88
Glacier 212 172 15 111 11 878 1,40 1,45
Total 955 1 084 38 572 34 798 2,48 3,12
35Sanlam investor presentation 2015

Notes to the shareholders’ fund information continued
for the year ended 31 December 2015
2. Cluster information (continued)2.1 Sanlam Personal Finance (continued)
Analysis of earnings
Life insurance Non-life operations Total
R million 2015 2014 2015 2014 2015 2014
Gross result from financial services 4 778 4 318 535 483 5 313 4 801
Entry-level market 1 125 949 — — 1 125 949
Middle-income market life and investment 3 348 3 116 30 46 3 378 3 162
Investment products 1 269 1 001 — — 1 269 1 001
Risk products 826 900 — — 826 900
Asset mismatch reserve release 468 543 — — 468 543
Annuities, combined products and other 785 672 30 46 815 718
Glacier 184 145 242 194 426 339
Sanlam Personal Loans 121 108 225 200 346 308
Other operations — — 38 43 38 43
Tax on result from financial services (1 332) (1 208) (146) (117) (1 478) (1 325)
Non-controlling interest — — (4) — (4) —
Net result from financial services 3 446 3 110 385 366 3 831 3 476
Net investment return 676 689 (730) 2 452 (54) 3 141
Net other earnings — — (67) (39) (67) (39)
Normalised attributable earnings 4 122 3 799 (412) 2 779 3 710 6 578
36 Sanlam investor presentation 2015

2. Cluster information (continued)2.1 Sanlam Personal Finance (continued)
Assets under management
R million 2015 2014
Sanlam Sky: Life insurance operations 5 318 5 153
Individual life 226 626 220 820
Life insurance operations 224 302 218 503
Investment operations 2 324 2 317
Glacier 199 092 156 904
Life insurance operations 81 491 67 656
Investment operations 117 601 89 248
Total 431 036 382 877
Life insurance operations 311 111 291 312
Investment operations 119 925 91 565
431 036 382 877
Sanlam Personal Loans
Size of loan book (R million) 4 195 3 984
Interest margin 17,0% 16,5%
Bad debt ratio 5,4% 5,6%
Administration cost as % of net interest 27,4% 27,9%
37Sanlam investor presentation 2015
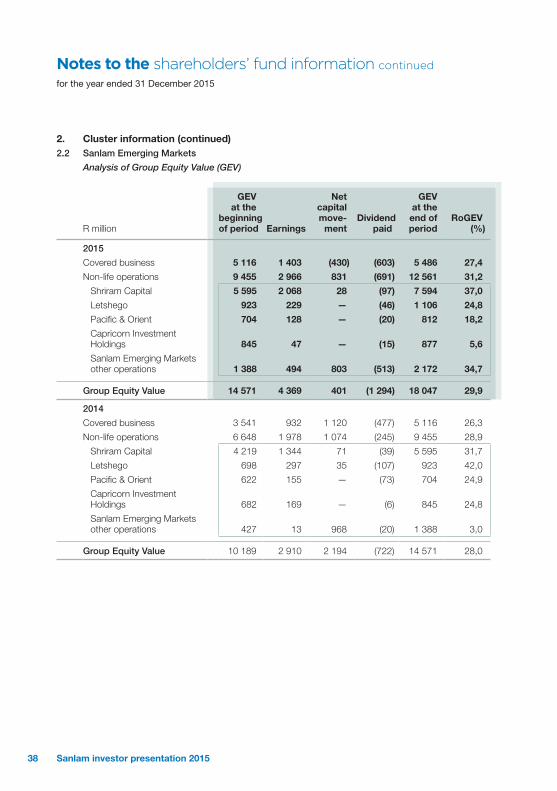
Notes to the shareholders’ fund information continued
for the year ended 31 December 2015
2. Cluster information (continued)2.2 Sanlam Emerging Markets
Analysis of Group Equity Value (GEV)
R million
GEV at the
beginning of period Earnings
Net capital move-
ment Dividend
paid
GEV at the end of period
RoGEV (%)
2015
Covered business 5 116 1 403 (430) (603) 5 486 27,4
Non-life operations 9 455 2 966 831 (691) 12 561 31,2
Shriram Capital 5 595 2 068 28 (97) 7 594 37,0
Letshego 923 229 — (46) 1 106 24,8
Pacific & Orient 704 128 — (20) 812 18,2
Capricorn Investment Holdings 845 47 — (15) 877 5,6
Sanlam Emerging Markets other operations 1 388 494 803 (513) 2 172 34,7
Group Equity Value 14 571 4 369 401 (1 294) 18 047 29,9
2014
Covered business 3 541 932 1 120 (477) 5 116 26,3
Non-life operations 6 648 1 978 1 074 (245) 9 455 28,9
Shriram Capital 4 219 1 344 71 (39) 5 595 31,7
Letshego 698 297 35 (107) 923 42,0
Pacific & Orient 622 155 — (73) 704 24,9
Capricorn Investment Holdings 682 169 — (6) 845 24,8
Sanlam Emerging Markets other operations 427 13 968 (20) 1 388 3,0
Group Equity Value 10 189 2 910 2 194 (722) 14 571 28,0
38 Sanlam investor presentation 2015
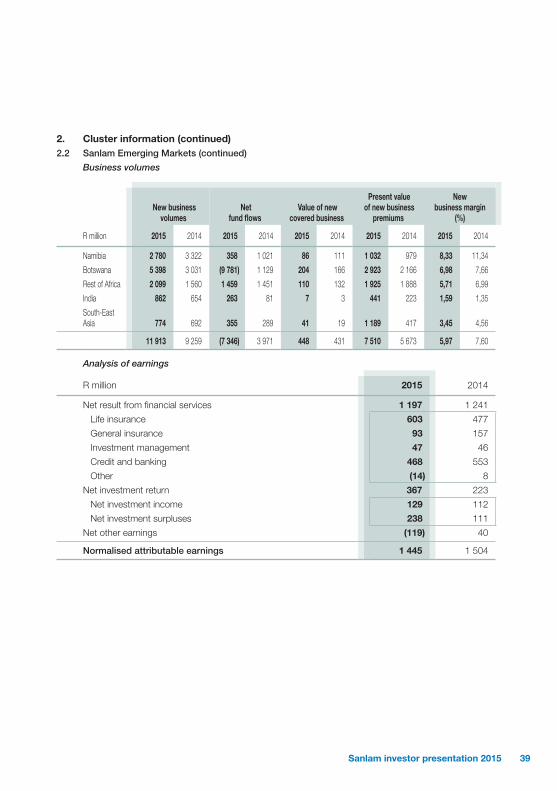
2. Cluster information (continued)2.2 Sanlam Emerging Markets (continued)
Business volumes
New business volumes
Net fund flows
Value of new covered business
Present value of new business
premiums
New business margin
(%)
R million 2015 2014 2015 2014 2015 2014 2015 2014 2015 2014
Namibia 2 780 3 322 358 1 021 86 111 1 032 979 8,33 11,34
Botswana 5 398 3 031 (9 781) 1 129 204 166 2 923 2 166 6,98 7,66
Rest of Africa 2 099 1 560 1 459 1 451 110 132 1 925 1 888 5,71 6,99
India 862 654 263 81 7 3 441 223 1,59 1,35
South-East Asia 774 692 355 289 41 19 1 189 417 3,45 4,56
11 913 9 259 (7 346) 3 971 448 431 7 510 5 673 5,97 7,60
Analysis of earnings
R million 2015 2014
Net result from financial services 1 197 1 241
Life insurance 603 477
General insurance 93 157
Investment management 47 46
Credit and banking 468 553
Other (14) 8
Net investment return 367 223
Net investment income 129 112
Net investment surpluses 238 111
Net other earnings (119) 40
Normalised attributable earnings 1 445 1 504
39Sanlam investor presentation 2015

Notes to the shareholders’ fund information continued
for the year ended 31 December 2015
2. Cluster information (continued)2.2 Sanlam Emerging Markets (continued)
Analysis of net result from financial services
Life insurance Non-life
operations Total
R million 2015 2014* 2015 2014* 2015 2014*
Namibia 197 192 148 122 345 314
Botswana 232 179 141 139 373 318
Rest of Africa 138 90 (9) 36 129 126
South-East Asia 21 5 8 51 29 56
India 12 18 311 438 323 456
Corporate and other — (7)* (2) (22)* (2) (29)*
Net result from financial services 600 477 597 764 1 197 1 241
* Comparative information has been adjusted to reflect unallocated corporate cost on a separate line.
Assets under management
R million 2015 2014
Life insurance operations 40 991 37 823
Investment operations 15 583 23 873
Namibia 7 872 8 326
Botswana 7 482 15 004
Rest of Africa 229 543
Assets under management 56 574 61 696
40 Sanlam investor presentation 2015

2. Cluster information (continued)2.3 Sanlam Investments
Analysis of Group Equity Value (GEV)
R million
GEV at the
beginning of period Earnings
Net capital invest-
ment Dividend
paid
GEV at the end of period
RoGEV (%)
2015
Investment Management 12 797 3 130 1 144 (1 021) 16 050 24,5
Investment Management SA 4 823 1 059 566 (346) 6 102 20,1
Wealth Management 2 522 485 — (139) 2 868 19,2
International 5 452 1 586 578 (536) 7 080 29,1
Covered business 1 193 277 237 (74) 1 633 23,2
Other operations 4 259 1 309 341 (462) 5 447 30,8
Sanlam Employee Benefits 6 640 994 (1 696) (361) 5 577 15,0
Sanlam Capital Management 685 262 — (162) 785 38,2
Group Equity Value 20 122 4 386 (552) (1 544) 22 412 21,3
2014
Sanlam Investment Management 11 648 2 075 (154) (772) 12 797 17,9
Investment Management SA 4 974 58 167 (376) 4 823 1,2
Wealth Management 2 105 528 — (111) 2 522 25,1
International 4 569 1 489 (321) (285) 5 452 32,6
Covered business 1 194 147 (80) (68) 1 193 12,3
Other operations 3 375 1 342 (241) (217) 4 259 40,7
Sanlam Employee Benefits 5 707 1 355 (188) (234) 6 640 23,7
Sanlam Capital Management 616 241 75 (247) 685 34,9
Group Equity Value 17 971 3 671 (267) (1 253) 20 122 20,4
41Sanlam investor presentation 2015

Notes to the shareholders’ fund information continued
for the year ended 31 December 2015
2. Cluster information (continued)2.3 Sanlam Investments (continued)
Business volumes
New business volumes Net fund flows Value of new
covered business Present value of new business premiums New business margin
R million 2015 2014 2015 2014 2015 2014 2015 2014 2015 2014
Investment Management 113 660 92 876 (3 021) 5 154 26 30 3 947 3 978 0,66% 0,75%
Investment Management SA 83 132 63 314 (753) 4 152 — — — — — —
Wealth Management 18 387 14 716 3 569 (29) — — — — — —
International 12 141 14 846 (5 837) 1 031 26 30 3 947 3 978 0,66% 0,75%
Sanlam Employee Benefits 2 913 10 154 (489) 6 725 85 198 4 333 11 945 1,96% 1,66%
Sanlam Capital Management 9 220 (2) 220 — — — — — —
116 582 103 250 (3 512) 12 099 111 228 8 280 15 923 1,34% 1,43%
Analysis of earnings
Investment Management
Capital Management
Sanlam Employee Benefits
Intra-cluster consolidation Total
R million 2015 2014* 2015 2014* 2015 2014 2015 2014 2015 2014
Financial services income** 4 491 4 108 445 570 3 573 3 252 (22) (19) 8 487 7 911
Sales remuneration (198) (194) — — (50) (55) — — (248) (249)
Income after sales remuneration 4 293 3 914 445 570 3 523 3 197 (22) (19) 8 239 7 662
Underwriting policy benefits — — — — (2 135) (2 063) — — (2 135) (2 063)
Administration cost** (3 278) (2 824) (298) (330) (887) (809) 22 19 (4 441) (3 944)
Results from financial services before performance fees 1 015 1 090 147 240 501 325 — — 1 663 1 655
Net performance fees 190 247 24 25 — — — — 214 272
Results from financial services 1 205 1 337 171 265 501 325 — — 1 877 1 927
Tax on result from financial services (277) (301) (9) (33) (140) (91) — — (426) (425)
Non-controlling interest (34) (34) — — — — — — (34) (34)
Net result from financial services 894 1 002 162 232 361 234 — — 1 417 1 468
Net investment return 6 29 (12) (16) 392 386 — — 386 399
Net investment income 9 22 — — 180 156 — — 189 178
Net investment surpluses (3) 7 (12) (16) 212 230 — — 197 221
Net other earnings (185) 188 — — — — — — (185) 188
Normalised attributable earnings 715 1 219 150 216 753 620 — — 1 618 2 055
* Comparative information has been adjusted for the reallocation of the Sanlam Africa Funds from Capital Management to Investment Management.
** Financial services income and administration costs on page 28 includes performance fees and its related administration costs.
42 Sanlam investor presentation 2015
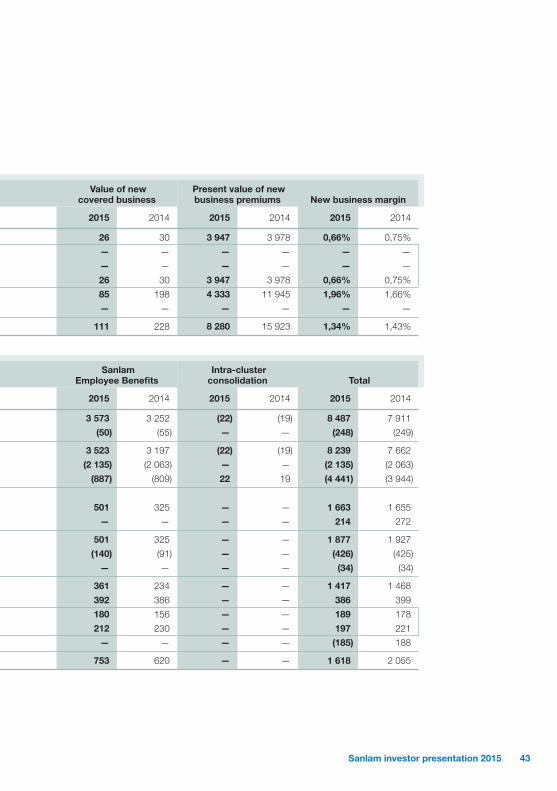
2. Cluster information (continued)2.3 Sanlam Investments (continued)
Business volumes
New business volumes Net fund flows Value of new
covered business Present value of new business premiums New business margin
R million 2015 2014 2015 2014 2015 2014 2015 2014 2015 2014
Investment Management 113 660 92 876 (3 021) 5 154 26 30 3 947 3 978 0,66% 0,75%
Investment Management SA 83 132 63 314 (753) 4 152 — — — — — —
Wealth Management 18 387 14 716 3 569 (29) — — — — — —
International 12 141 14 846 (5 837) 1 031 26 30 3 947 3 978 0,66% 0,75%
Sanlam Employee Benefits 2 913 10 154 (489) 6 725 85 198 4 333 11 945 1,96% 1,66%
Sanlam Capital Management 9 220 (2) 220 — — — — — —
116 582 103 250 (3 512) 12 099 111 228 8 280 15 923 1,34% 1,43%
Analysis of earnings
Investment Management
Capital Management
Sanlam Employee Benefits
Intra-cluster consolidation Total
R million 2015 2014* 2015 2014* 2015 2014 2015 2014 2015 2014
Financial services income** 4 491 4 108 445 570 3 573 3 252 (22) (19) 8 487 7 911
Sales remuneration (198) (194) — — (50) (55) — — (248) (249)
Income after sales remuneration 4 293 3 914 445 570 3 523 3 197 (22) (19) 8 239 7 662
Underwriting policy benefits — — — — (2 135) (2 063) — — (2 135) (2 063)
Administration cost** (3 278) (2 824) (298) (330) (887) (809) 22 19 (4 441) (3 944)
Results from financial services before performance fees 1 015 1 090 147 240 501 325 — — 1 663 1 655
Net performance fees 190 247 24 25 — — — — 214 272
Results from financial services 1 205 1 337 171 265 501 325 — — 1 877 1 927
Tax on result from financial services (277) (301) (9) (33) (140) (91) — — (426) (425)
Non-controlling interest (34) (34) — — — — — — (34) (34)
Net result from financial services 894 1 002 162 232 361 234 — — 1 417 1 468
Net investment return 6 29 (12) (16) 392 386 — — 386 399
Net investment income 9 22 — — 180 156 — — 189 178
Net investment surpluses (3) 7 (12) (16) 212 230 — — 197 221
Net other earnings (185) 188 — — — — — — (185) 188
Normalised attributable earnings 715 1 219 150 216 753 620 — — 1 618 2 055
* Comparative information has been adjusted for the reallocation of the Sanlam Africa Funds from Capital Management to Investment Management.
** Financial services income and administration costs on page 28 includes performance fees and its related administration costs.
43Sanlam investor presentation 2015

Notes to the shareholders’ fund information continued
for the year ended 31 December 2015
2. Cluster information (continued)2.3 Sanlam Investments (continued)
Analysis of net result from financial services
R million 2015 2014*
Investment Management 820 934 Investment Management SA 515 536 Wealth Management 153 163 International 192 242 Support services (40) (7)
Capital Management 162 232
Asset management operations 982 1 166 Covered business:
Sanlam Employee Benefits 361 234 Sanlam UK 74 68
Sanlam Investments total 1 417 1 468
* Comparative information has been adjusted for the reallocation of the Sanlam Africa Funds from Capital Management to Investment Management.
Assets under management
Assets under management Fee income
Administration cost
2015 R million
2014 R million
2015 %
2014 %
2015 %
2014 %
Investment Management 782 685 758 132
Investment Management SA 623 414 604 309 0,31 0,30 0,22 0,21 Wealth Management 177 655 163 091 0,73 0,72 0,61 0,58 International 143 962 131 863 0,71 0,71 0,54 0,53 Inter-cluster eliminations (162 346) (141 131) — —
Capital Management 3 860 3 372 0,74 0,75 0,70 0,71
Asset management operations 786 545 761 504 Covered business
Sanlam Employee Benefits 76 191 74 115 Sanlam UK 51 787 39 787
Sanlam Investments total 914 523 875 406
44 Sanlam investor presentation 2015
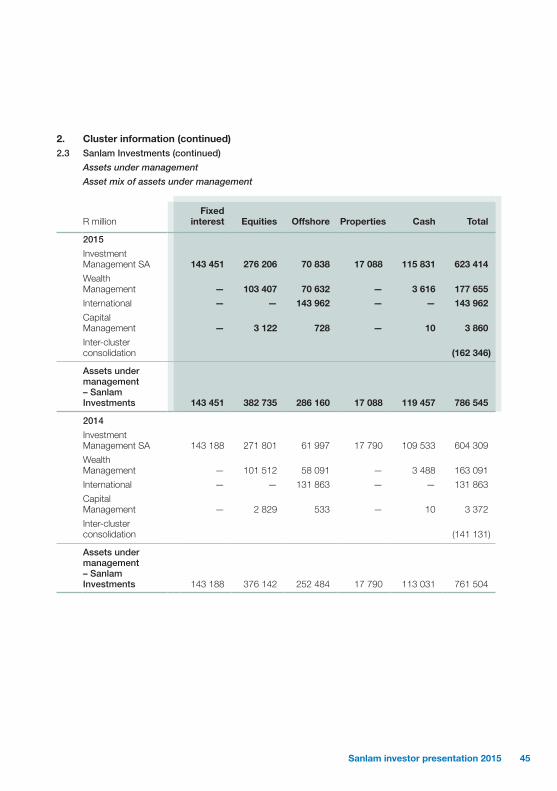
2. Cluster information (continued)2.3 Sanlam Investments (continued)
Assets under management
Asset mix of assets under management
R million Fixed
interest Equities Offshore Properties Cash Total
2015
Investment Management SA 143 451 276 206 70 838 17 088 115 831 623 414
Wealth Management — 103 407 70 632 — 3 616 177 655
International — — 143 962 — — 143 962
Capital Management — 3 122 728 — 10 3 860
Inter-cluster consolidation (162 346)
Assets under management – Sanlam Investments 143 451 382 735 286 160 17 088 119 457 786 545
2014
Investment Management SA 143 188 271 801 61 997 17 790 109 533 604 309
Wealth Management — 101 512 58 091 — 3 488 163 091
International — — 131 863 — — 131 863
Capital Management — 2 829 533 — 10 3 372
Inter-cluster consolidation (141 131)
Assets under management – Sanlam Investments 143 188 376 142 252 484 17 790 113 031 761 504
45Sanlam investor presentation 2015
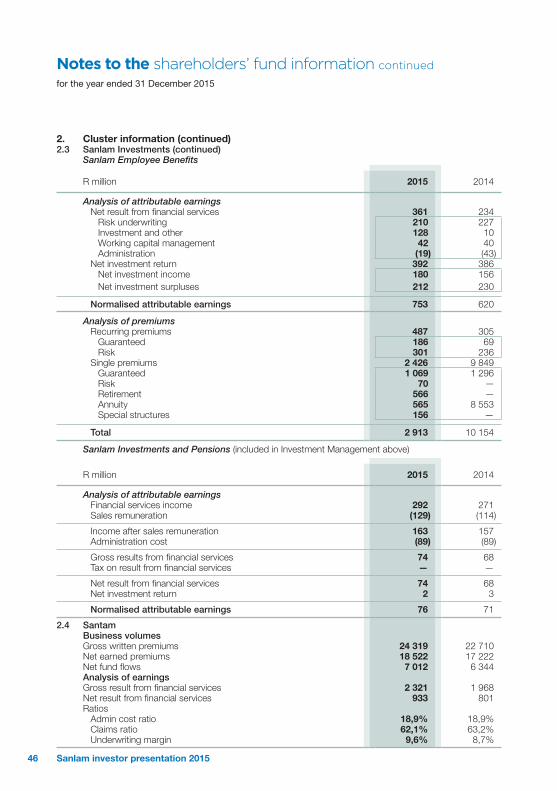
Notes to the shareholders’ fund information continued
for the year ended 31 December 2015
2. Cluster information (continued)2.3 Sanlam Investments (continued)
Sanlam Employee Benefits
R million 2015 2014
Analysis of attributable earningsNet result from financial services 361 234
Risk underwriting 210 227 Investment and other 128 10 Working capital management 42 40 Administration (19) (43)
Net investment return 392 386 Net investment income 180 156 Net investment surpluses 212 230
Normalised attributable earnings 753 620
Analysis of premiumsRecurring premiums 487 305
Guaranteed 186 69 Risk 301 236
Single premiums 2 426 9 849 Guaranteed 1 069 1 296 Risk 70 —Retirement 566 —Annuity 565 8 553Special structures 156 —
Total 2 913 10 154
Sanlam Investments and Pensions (included in Investment Management above)
R million 2015 2014
Analysis of attributable earnings Financial services income 292 271 Sales remuneration (129) (114)
Income after sales remuneration 163 157 Administration cost (89) (89)
Gross results from financial services 74 68 Tax on result from financial services — —
Net result from financial services 74 68 Net investment return 2 3
Normalised attributable earnings 76 71
2.4 SantamBusiness volumes Gross written premiums 24 319 22 710 Net earned premiums 18 522 17 222 Net fund flows 7 012 6 344 Analysis of earningsGross result from financial services 2 321 1 968 Net result from financial services 933 801 Ratios
Admin cost ratio 18,9% 18,9%Claims ratio 62,1% 63,2%Underwriting margin 9,6% 8,7%
46 Sanlam investor presentation 2015
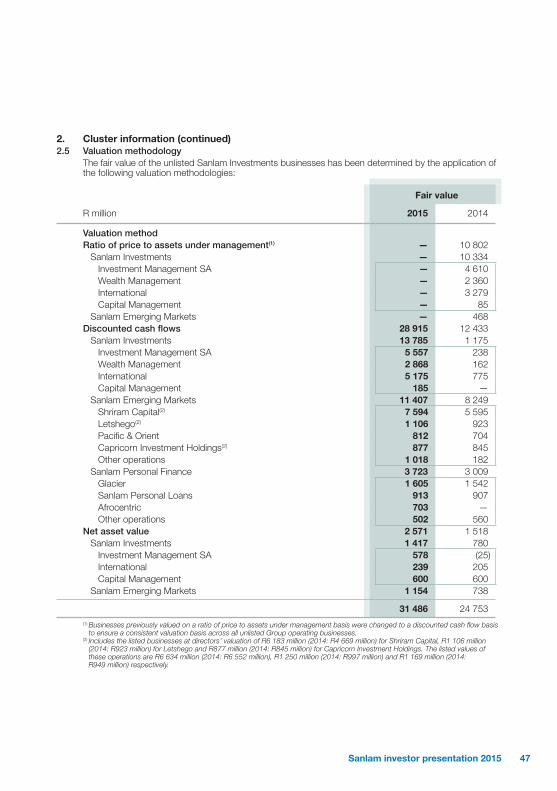
2. Cluster information (continued)2.5 Valuation methodology
The fair value of the unlisted Sanlam Investments businesses has been determined by the application of the following valuation methodologies:
Fair value
R million 2015 2014
Valuation methodRatio of price to assets under management(1) — 10 802
Sanlam Investments — 10 334 Investment Management SA — 4 610 Wealth Management — 2 360 International — 3 279 Capital Management — 85
Sanlam Emerging Markets — 468 Discounted cash flows 28 915 12 433
Sanlam Investments 13 785 1 175 Investment Management SA 5 557 238 Wealth Management 2 868 162 International 5 175 775 Capital Management 185 —
Sanlam Emerging Markets 11 407 8 249 Shriram Capital(2) 7 594 5 595 Letshego(2) 1 106 923 Pacific & Orient 812 704 Capricorn Investment Holdings(2) 877 845 Other operations 1 018 182
Sanlam Personal Finance 3 723 3 009 Glacier 1 605 1 542 Sanlam Personal Loans 913 907 Afrocentric 703 —Other operations 502 560
Net asset value 2 571 1 518 Sanlam Investments 1 417 780
Investment Management SA 578 (25) International 239 205 Capital Management 600 600
Sanlam Emerging Markets 1 154 738
31 486 24 753 (1) Businesses previously valued on a ratio of price to assets under management basis were changed to a discounted cash flow basis
to ensure a consistent valuation basis across all unlisted Group operating businesses.(2) Includes the listed businesses at directors’ valuation of R6 183 million (2014: R4 669 million) for Shriram Capital, R1 106 million
(2014: R923 million) for Letshego and R877 million (2014: R845 million) for Capricorn Investment Holdings. The listed values of these operations are R6 634 million (2014: R6 552 million), R1 250 million (2014: R997 million) and R1 169 million (2014: R949 million) respectively.
47Sanlam investor presentation 2015

Notes to the shareholders’ fund information continued
for the year ended 31 December 2015
2. Cluster information (continued)2.5 Valuation methodology (continued)
The main assumptions applied in the primary valuation for the unlisted businesses are presented below. The sensitivity analysis is based on the following changes in assumptions:
Change in assumption
2015
Risk discount rate (RDR) 1,0
Perpetuity growth rate (PGR) 1,0
R millionWeighted average assumption Base value
Decrease in assumption
Increase in assumption
Discounted cash flows RDR = 15,4% (2014: 16,6%) 28 915 32 504 26 057
Perpetuity growth rate PGR = 2,5 – 5% (2014: 2,5 – 5%) 28 915 27 533 30 664
3. Investments
R million 2015 2014
3.1 Investment in associated companies
Shriram Capital and Shriram Transport Finance Company 7 704 5 648
Letshego 1 784 1 523
Pacific & Orient 1 043 1 005
Capricorn Investment Holdings 920 844
Afrocentric 703 —
Other associated companies 2 520 1 931
Total investment in associated companies 14 674 10 951
Details of the investments in the material associated companies are reflected in note 7 of the Sanlam Group financial statements.
3.2 Investment in joint ventures
Sanlam Personal Loans 739 626
Other joint ventures 133 —
Total investment in joint ventures 872 626
Details of the investments in material joint ventures are reflected in note 7 of the Sanlam Group financial statements.
48 Sanlam investor presentation 2015

3. Investments (continued)3.3 Investments include the following offshore investments
R million 2015 2014
Investment properties 880 549
Equities 305 922
Structured transactions (10) —
Interest-bearing investments 2 518 2 363
Investment funds 2 519 2 079
Cash, deposits and similar securities 7 255 1 009
Total offshore investments 13 467 6 922
4. Financial services income
Equity-accounted earnings included in financial services income
Sanlam Personal Finance 225 200
Sanlam Emerging Markets 1 392 1 498
Santam 45 54
Sanlam Investments 37 27
1 699 1 779
5. Sales remunerationLife operations 3 830 3 308
Non-life operations 2 169 2 015
5 999 5 323
6. Administration costsLife operations 5 502 4 941
Non-life operations 8 130 7 252
13 632 12 193
Depreciation included in administration costs:
Sanlam Personal Finance 106 93
Sanlam Emerging Markets 66 40
Sanlam Investments 21 19
Santam 67 58
260 210
49Sanlam investor presentation 2015

Notes to the shareholders’ fund information continued
for the year ended 31 December 2015
7. Investment income
R million 2015 2014
Equities and similar securities 654 491
Interest-bearing, preference shares and similar securities 679 794
Properties 20 45
Rental income 21 46
Contingent rental income 4 4
Rental-related expenses (5) (5)
Total investment income 1 353 1 330
Interest expense netted off against investment income 398 379
8. Normalised diluted earnings per share
Cents 2015 2014
Normalised diluted earnings per share:
Net result from financial services 355,2 336,2
Headline earnings 432,5 407,6
Profit attributable to shareholders’ fund 437,0 427,3
R million
Analysis of normalised earnings (refer shareholders’ fund income statement on page 28):
Net result from financial services 7 269 6 879
Headline earnings 8 851 8 340
Profit attributable to shareholders’ fund 8 942 8 744
Reconciliation of normalised headline earnings:
Headline earnings 9 300 8 325
(Less)/Add: Fund transfers (449) 15
Normalised headline earnings 8 851 8 340
Million
Adjusted number of shares:
Weighted average number of shares for diluted earnings per share 2 024,0 2 022,8
Add: Weighted average Sanlam shares held by policyholders 22,3 23,4
Adjusted weighted average number of shares for normalised diluted earnings per share 2 046,3 2 046,2
50 Sanlam investor presentation 2015

9. Value per share
R million 2015 2014
Fair value per share is calculated on the Group shareholders’ fund at fair value of R74 660 million (2014: R68 037 million), divided by 2 046,6 million (2014: 2 048,3 million) shares.
Net asset value per share is calculated on the Group shareholders’ fund at net asset value of 55 464 million (2014: R47 927 million), divided by 2 046,6 million (2014: 2 048,3 million) shares.
Equity value per share is calculated on the Group Equity Value of R103 506 million (2014: R95 936 million), divided by 2 046,6 million (2014: 2 048,3 million) shares.
Number of shares for value per share
Number of ordinary shares in issue 2 166,5 2 166,5
Shares held by subsidiaries in shareholders’ fund (141,2) (142,1)
Outstanding shares in respect of Sanlam Limited long-term incentive schemes 21,3 23,9
Adjusted number of shares for value per share 2 046,6 2 048,3
10. Present value of holding company expensesThe present value of holding company expenses has been calculated by applying a multiple of 8,8 (2014: 8,4) to the after-tax recurring corporate expenses.
11. Share repurchasesThe Sanlam shareholders granted general authorities to the Group at the 2015 and 2014 annual general meetings to repurchase Sanlam shares in the market. A negligible number of share repurchases were done in respect of these authorities.
51Sanlam investor presentation 2015

Notes to the shareholders’ fund information continued
for the year ended 31 December 2015
12. Reconciliations12.1 Reconciliation between Group statement of comprehensive income and shareholders’ fund
income statement
2015 2014
R million Total
Share-holder
activities
Policy-holder
activities(1)
IFRS adjust-ments(2) Total
Share-holder
activities
Policy-holder
activities(1)
IFRS adjust-ments(2)
Net income 85 293 52 608 30 018 2 667 92 060 48 813 41 428 1 819 Financial services income 53 754 49 365 — 4 389 49 683 45 713 — 3 970 Reinsurance premiums paid (6 831) — — (6 831) (6 341) — — (6 341) Reinsurance commission received 1 275 — — 1 275 1 125 — — 1 125 Investment income 25 241 1 353 17 903 5 985 22 491 1 330 16 236 4 925 Investment surpluses 13 942 1 890 12 115 (63) 28 891 1 770 25 192 1 929 Finance cost – margin business (101) — — (101) (105) — — (105) Change in fair value of external investors liability (1 987) — — (1 987) (3 684) — — (3 684)
Net insurance and investment contract benefits and claims (47 675) (18 139) (29 550) 14 (58 626) (17 453) (41 185) 12
Long-term insurance contract benefits (15 247) (6 629) (7 814) (804) (26 388) (6 575) (19 017) (796) Long-term investment contract benefits (21 736) — (21 736) — (22 168) — (22 168) —General insurance claims (14 206) (11 510) — (2 696) (14 404) (10 878) — (3 526) Reinsurance claims received 3 514 — — 3 514 4 334 — — 4 334
Expenses (23 024) (19 689) — (3 335) (20 811) (17 639) — (3 172) Sales remuneration (7 269) (5 999) — (1 270) (6 442) (5 323) — (1 119) Administration costs (15 755) (13 690) — (2 065) (14 369) (12 316) — (2 053)
Impairments (173) (109) — (64) (140) (101) — (39) Amortisation of intangibles (382) (306) — (76) (240) (210) — (30)
Net operating result 14 039 14 365 468 (794) 12 243 13 410 243 (1 410) Equity-accounted earnings 1 310 57 — 1 253 1 603 88 — 1 515 Finance cost – other (580) — — (580) (517) — — (517)
Profit before tax 14 769 14 422 468 (121) 13 329 13 498 243 (412) Tax expense (3 859) (3 651) (468) 260 (3 534) (3 490) (243) 199
Shareholders’ fund (3 078) (3 651) — 573 (3 007) (3 490) — 483 Policyholders’ fund (781) — (468) (313) (527) — (243) (284)
Profit from continuing operations 10 910 10 771 — 139 9 795 10 008 — (213)
Profit for the year 10 910 10 771 — 139 9 795 10 008 — (213)
Attributable to: Shareholders’ fund 9 391 8 942 — 449 8 729 8 744 — (15) Non-controlling interest 1 519 1 829 — (310) 1 066 1 264 — (198)
10 910 10 771 — 139 9 795 10 008 — (213)
(1) Policyholder activities relate to the inclusion of policyholders’ after-tax investment return, and the allocation thereof to policy liabilities, in the Group statement of comprehensive income.
(2) IFRS adjustments relate to amounts that have been set-off in the shareholders’ fund income statement that is not permitted in terms of IFRS, and fund transfers relating to investments in treasury shares and subsidiaries held by the policyholders’ fund.
52 Sanlam investor presentation 2015
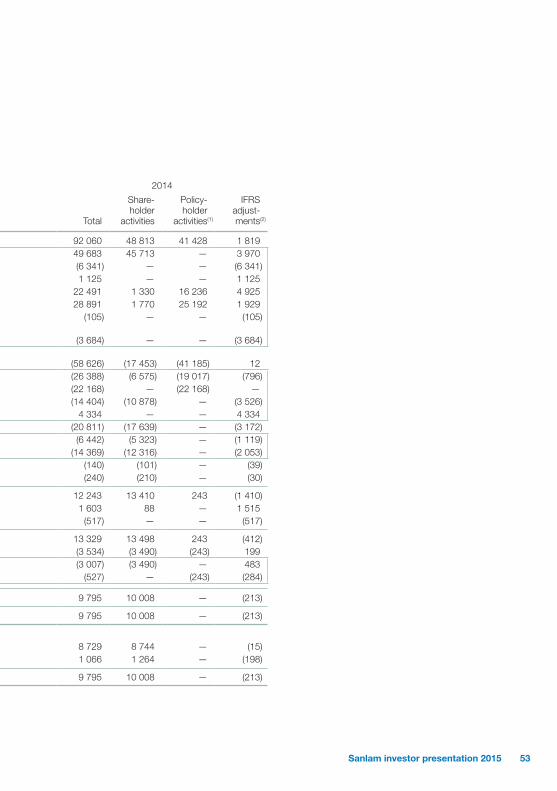
12. Reconciliations12.1 Reconciliation between Group statement of comprehensive income and shareholders’ fund
income statement
2015 2014
R million Total
Share-holder
activities
Policy-holder
activities(1)
IFRS adjust-ments(2) Total
Share-holder
activities
Policy-holder
activities(1)
IFRS adjust-ments(2)
Net income 85 293 52 608 30 018 2 667 92 060 48 813 41 428 1 819 Financial services income 53 754 49 365 — 4 389 49 683 45 713 — 3 970 Reinsurance premiums paid (6 831) — — (6 831) (6 341) — — (6 341) Reinsurance commission received 1 275 — — 1 275 1 125 — — 1 125 Investment income 25 241 1 353 17 903 5 985 22 491 1 330 16 236 4 925 Investment surpluses 13 942 1 890 12 115 (63) 28 891 1 770 25 192 1 929 Finance cost – margin business (101) — — (101) (105) — — (105) Change in fair value of external investors liability (1 987) — — (1 987) (3 684) — — (3 684)
Net insurance and investment contract benefits and claims (47 675) (18 139) (29 550) 14 (58 626) (17 453) (41 185) 12
Long-term insurance contract benefits (15 247) (6 629) (7 814) (804) (26 388) (6 575) (19 017) (796) Long-term investment contract benefits (21 736) — (21 736) — (22 168) — (22 168) —General insurance claims (14 206) (11 510) — (2 696) (14 404) (10 878) — (3 526) Reinsurance claims received 3 514 — — 3 514 4 334 — — 4 334
Expenses (23 024) (19 689) — (3 335) (20 811) (17 639) — (3 172) Sales remuneration (7 269) (5 999) — (1 270) (6 442) (5 323) — (1 119) Administration costs (15 755) (13 690) — (2 065) (14 369) (12 316) — (2 053)
Impairments (173) (109) — (64) (140) (101) — (39) Amortisation of intangibles (382) (306) — (76) (240) (210) — (30)
Net operating result 14 039 14 365 468 (794) 12 243 13 410 243 (1 410) Equity-accounted earnings 1 310 57 — 1 253 1 603 88 — 1 515 Finance cost – other (580) — — (580) (517) — — (517)
Profit before tax 14 769 14 422 468 (121) 13 329 13 498 243 (412) Tax expense (3 859) (3 651) (468) 260 (3 534) (3 490) (243) 199
Shareholders’ fund (3 078) (3 651) — 573 (3 007) (3 490) — 483 Policyholders’ fund (781) — (468) (313) (527) — (243) (284)
Profit from continuing operations 10 910 10 771 — 139 9 795 10 008 — (213)
Profit for the year 10 910 10 771 — 139 9 795 10 008 — (213)
Attributable to: Shareholders’ fund 9 391 8 942 — 449 8 729 8 744 — (15) Non-controlling interest 1 519 1 829 — (310) 1 066 1 264 — (198)
10 910 10 771 — 139 9 795 10 008 — (213)
(1) Policyholder activities relate to the inclusion of policyholders’ after-tax investment return, and the allocation thereof to policy liabilities, in the Group statement of comprehensive income.
(2) IFRS adjustments relate to amounts that have been set-off in the shareholders’ fund income statement that is not permitted in terms of IFRS, and fund transfers relating to investments in treasury shares and subsidiaries held by the policyholders’ fund.
53Sanlam investor presentation 2015
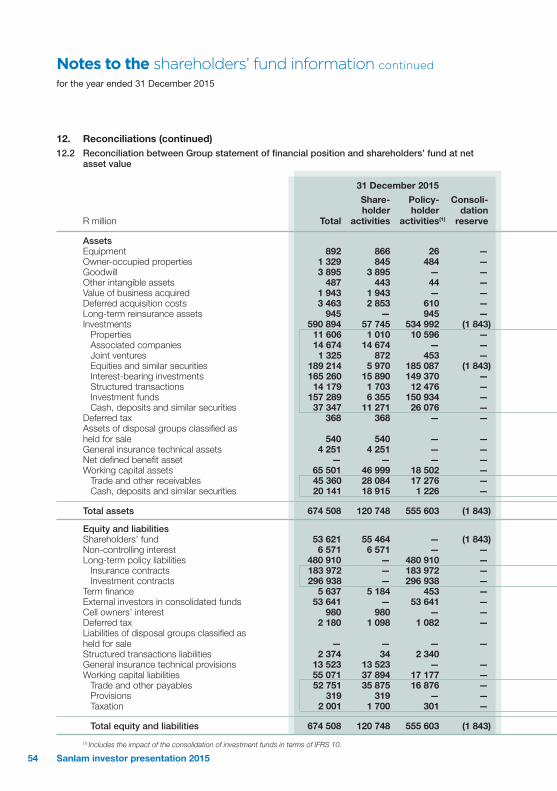
Notes to the shareholders’ fund information continued
for the year ended 31 December 2015
12. Reconciliations (continued)12.2 Reconciliation between Group statement of financial position and shareholders’ fund at net
asset value
31 December 2015 31 December 2014
R million Total
Share-holder
activities
Policy-holder
activities(1)
Consoli-dation
reserve Total
Share-holder
activities
Policy-holder
activities(1)
Consoli-dation
reserve
AssetsEquipment 892 866 26 — 723 696 27 —Owner-occupied properties 1 329 845 484 — 1 096 633 463 —Goodwill 3 895 3 895 — — 3 974 3 974 — —Other intangible assets 487 443 44 — 439 395 44 —Value of business acquired 1 943 1 943 — — 2 045 2 045 — —Deferred acquisition costs 3 463 2 853 610 — 3 281 2 699 582 —Long-term reinsurance assets 945 — 945 — 941 — 941 —Investments 590 894 57 745 534 992 (1 843) 538 155 48 567 491 478 (1 890)
Properties 11 606 1 010 10 596 — 10 333 689 9 644 —Associated companies 14 674 14 674 — — 10 951 10 951 — —Joint ventures 1 325 872 453 — 944 626 318 —Equities and similar securities 189 214 5 970 185 087 (1 843) 183 040 9 081 175 849 (1 890) Interest-bearing investments 165 260 15 890 149 370 — 161 778 16 224 145 554 —Structured transactions 14 179 1 703 12 476 — 12 348 1 148 11 200 —Investment funds 157 289 6 355 150 934 — 133 552 5 919 127 633 —Cash, deposits and similar securities 37 347 11 271 26 076 — 25 209 3 929 21 280 —
Deferred tax 368 368 — — 365 365 — —Assets of disposal groups classified as held for sale 540 540 — — 1 893 1 893 — —General insurance technical assets 4 251 4 251 — — 3 964 3 964 — —Net defined benefit asset — — — — 144 144 — —Working capital assets 65 501 46 999 18 502 — 54 233 45 726 8 507 —
Trade and other receivables 45 360 28 084 17 276 — 37 974 30 337 7 637 —Cash, deposits and similar securities 20 141 18 915 1 226 — 16 259 15 389 870 —
Total assets 674 508 120 748 555 603 (1 843) 611 253 111 101 502 042 (1 890)
Equity and liabilitiesShareholders’ fund 53 621 55 464 — (1 843) 46 037 47 927 — (1 890) Non-controlling interest 6 571 6 571 — — 5 198 5 198 — —Long-term policy liabilities 480 910 — 480 910 — 443 672 — 443 672 —
Insurance contracts 183 972 — 183 972 — 186 626 — 186 626 —Investment contracts 296 938 — 296 938 — 257 046 — 257 046 —
Term finance 5 637 5 184 453 — 5 775 5 315 460 —External investors in consolidated funds 53 641 — 53 641 — 49 625 — 49 625 —Cell owners’ interest 980 980 — — 925 925 — —Deferred tax 2 180 1 098 1 082 — 2 498 1 524 974 —Liabilities of disposal groups classified as held for sale — — — — 1 466 1 466 — —Structured transactions liabilities 2 374 34 2 340 766 2 764 General insurance technical provisions 13 523 13 523 — — 12 592 12 592 — —Working capital liabilities 55 071 37 894 17 177 — 42 699 36 152 6 547 —
Trade and other payables 52 751 35 875 16 876 — 40 529 34 485 6 044 —Provisions 319 319 — — 283 283 — —Taxation 2 001 1 700 301 — 1 887 1 384 503 —
Total equity and liabilities 674 508 120 748 555 603 (1 843) 611 253 111 101 502 042 (1 890)
(1) Includes the impact of the consolidation of investment funds in terms of IFRS 10.
54 Sanlam investor presentation 2015
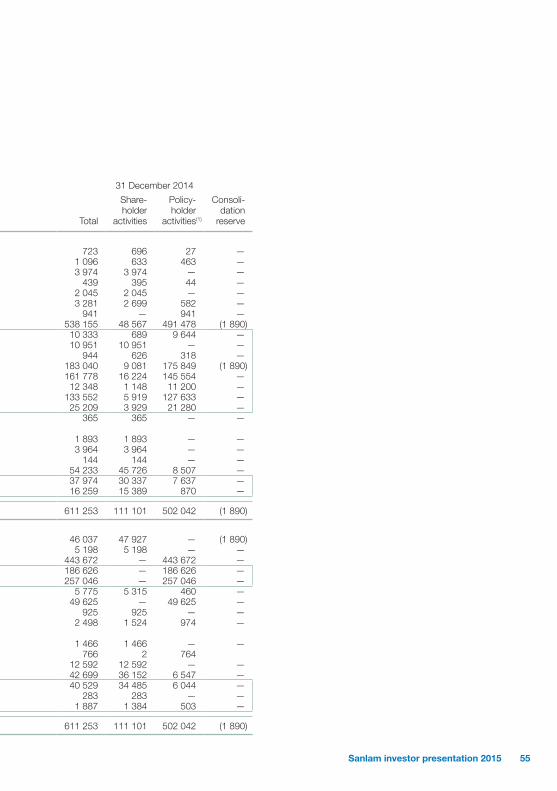
12. Reconciliations (continued)12.2 Reconciliation between Group statement of financial position and shareholders’ fund at net
asset value
31 December 2015 31 December 2014
R million Total
Share-holder
activities
Policy-holder
activities(1)
Consoli-dation
reserve Total
Share-holder
activities
Policy-holder
activities(1)
Consoli-dation
reserve
AssetsEquipment 892 866 26 — 723 696 27 —Owner-occupied properties 1 329 845 484 — 1 096 633 463 —Goodwill 3 895 3 895 — — 3 974 3 974 — —Other intangible assets 487 443 44 — 439 395 44 —Value of business acquired 1 943 1 943 — — 2 045 2 045 — —Deferred acquisition costs 3 463 2 853 610 — 3 281 2 699 582 —Long-term reinsurance assets 945 — 945 — 941 — 941 —Investments 590 894 57 745 534 992 (1 843) 538 155 48 567 491 478 (1 890)
Properties 11 606 1 010 10 596 — 10 333 689 9 644 —Associated companies 14 674 14 674 — — 10 951 10 951 — —Joint ventures 1 325 872 453 — 944 626 318 —Equities and similar securities 189 214 5 970 185 087 (1 843) 183 040 9 081 175 849 (1 890) Interest-bearing investments 165 260 15 890 149 370 — 161 778 16 224 145 554 —Structured transactions 14 179 1 703 12 476 — 12 348 1 148 11 200 —Investment funds 157 289 6 355 150 934 — 133 552 5 919 127 633 —Cash, deposits and similar securities 37 347 11 271 26 076 — 25 209 3 929 21 280 —
Deferred tax 368 368 — — 365 365 — —Assets of disposal groups classified as held for sale 540 540 — — 1 893 1 893 — —General insurance technical assets 4 251 4 251 — — 3 964 3 964 — —Net defined benefit asset — — — — 144 144 — —Working capital assets 65 501 46 999 18 502 — 54 233 45 726 8 507 —
Trade and other receivables 45 360 28 084 17 276 — 37 974 30 337 7 637 —Cash, deposits and similar securities 20 141 18 915 1 226 — 16 259 15 389 870 —
Total assets 674 508 120 748 555 603 (1 843) 611 253 111 101 502 042 (1 890)
Equity and liabilitiesShareholders’ fund 53 621 55 464 — (1 843) 46 037 47 927 — (1 890) Non-controlling interest 6 571 6 571 — — 5 198 5 198 — —Long-term policy liabilities 480 910 — 480 910 — 443 672 — 443 672 —
Insurance contracts 183 972 — 183 972 — 186 626 — 186 626 —Investment contracts 296 938 — 296 938 — 257 046 — 257 046 —
Term finance 5 637 5 184 453 — 5 775 5 315 460 —External investors in consolidated funds 53 641 — 53 641 — 49 625 — 49 625 —Cell owners’ interest 980 980 — — 925 925 — —Deferred tax 2 180 1 098 1 082 — 2 498 1 524 974 —Liabilities of disposal groups classified as held for sale — — — — 1 466 1 466 — —Structured transactions liabilities 2 374 34 2 340 766 2 764 General insurance technical provisions 13 523 13 523 — — 12 592 12 592 — —Working capital liabilities 55 071 37 894 17 177 — 42 699 36 152 6 547 —
Trade and other payables 52 751 35 875 16 876 — 40 529 34 485 6 044 —Provisions 319 319 — — 283 283 — —Taxation 2 001 1 700 301 — 1 887 1 384 503 —
Total equity and liabilities 674 508 120 748 555 603 (1 843) 611 253 111 101 502 042 (1 890)
(1) Includes the impact of the consolidation of investment funds in terms of IFRS 10.
55Sanlam investor presentation 2015

Notes to the shareholders’ fund information continued
for the year ended 31 December 2015
13. Geographical analysis
R million
Per share-holders’
fund income
statement on
page 28
IFRS adjust-ments (refer
note 12.1) Total
Financial services incomeFinancial services income is attributed to individual countries, based on where the holding company or subsidiaries are located.
2015 49 365 4 389 53 754 South Africa 41 327 5 094 46 421 Rest of Africa 4 769 (462) 4 307 Other international(1) 3 269 (243) 3 026
2014 45 713 3 970 49 683 South Africa 38 587 4 882 43 469 Rest of Africa 4 122 (446) 3 676 Other international(1) 3 004 (466) 2 538
R million
Per analysis
of share-holders’ fund on page 26
Policy-holders’
fund Total
Non-current assets(2)
2015 11 385 1 164 12 549 South Africa 8 509 437 8 946 Rest of Africa 513 219 732 Other international(1) 2 363 508 2 871
2014 12 335 1 116 13 451 South Africa 8 465 437 8 902 Rest of Africa 231 187 418 Other international(1) 3 639 492 4 131
R million 2015 2014
Attributable earnings (per shareholders’ fund income statement on page 28) 9 391 8 729
South Africa 7 940 6 920 Rest of Africa 1 015 797 Other international(1) 436 1 012
(1) Other international comprises business in the Netherlands, Europe, United Kingdom, Australia, India and South-East Asia.(2) Non-current assets include property and equipment, owner-occupied properties, goodwill, value of business acquired, other
intangible assets, non-current assets held for sale and deferred acquisition costs.
56 Sanlam investor presentation 2015
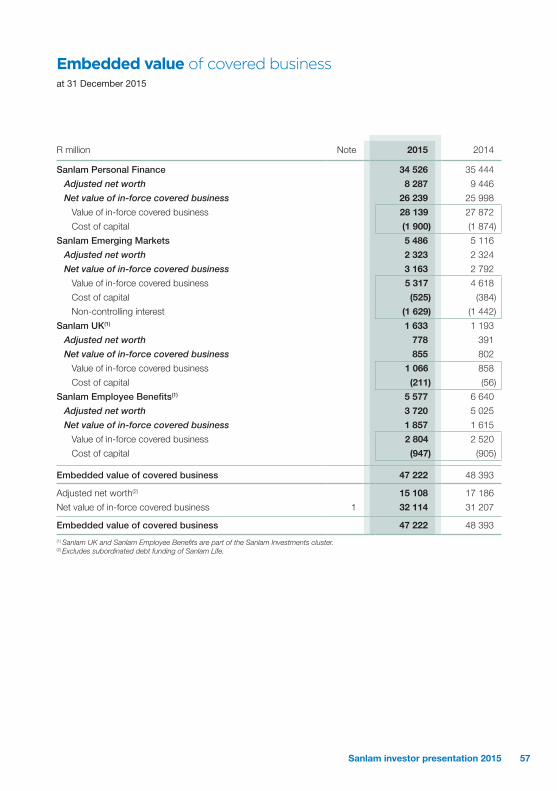
Embedded value of covered businessat 31 December 2015
R million Note 2015 2014
Sanlam Personal Finance 34 526 35 444
Adjusted net worth 8 287 9 446
Net value of in-force covered business 26 239 25 998
Value of in-force covered business 28 139 27 872
Cost of capital (1 900) (1 874)
Sanlam Emerging Markets 5 486 5 116
Adjusted net worth 2 323 2 324
Net value of in-force covered business 3 163 2 792
Value of in-force covered business 5 317 4 618
Cost of capital (525) (384)
Non-controlling interest (1 629) (1 442)
Sanlam UK(1) 1 633 1 193
Adjusted net worth 778 391
Net value of in-force covered business 855 802
Value of in-force covered business 1 066 858
Cost of capital (211) (56)
Sanlam Employee Benefits(1) 5 577 6 640
Adjusted net worth 3 720 5 025
Net value of in-force covered business 1 857 1 615
Value of in-force covered business 2 804 2 520
Cost of capital (947) (905)
Embedded value of covered business 47 222 48 393
Adjusted net worth(2) 15 108 17 186
Net value of in-force covered business 1 32 114 31 207
Embedded value of covered business 47 222 48 393
(1) Sanlam UK and Sanlam Employee Benefits are part of the Sanlam Investments cluster.(2) Excludes subordinated debt funding of Sanlam Life.
57Sanlam investor presentation 2015
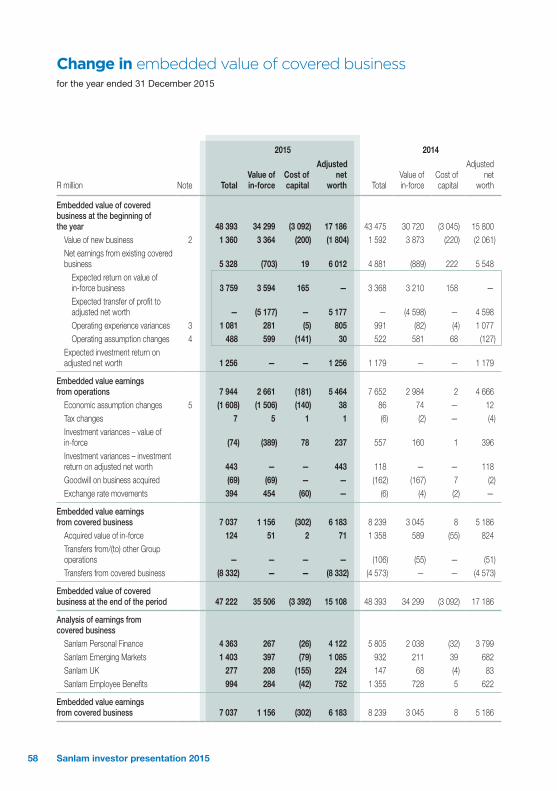
Change in embedded value of covered businessfor the year ended 31 December 2015
2015 2014
R million Note Total Value of in-force
Cost of capital
Adjusted net
worth TotalValue of in-force
Cost of capital
Adjusted net
worth
Embedded value of covered business at the beginning of the year 48 393 34 299 (3 092) 17 186 43 475 30 720 (3 045) 15 800
Value of new business 2 1 360 3 364 (200) (1 804) 1 592 3 873 (220) (2 061)Net earnings from existing covered business 5 328 (703) 19 6 012 4 881 (889) 222 5 548
Expected return on value of in-force business 3 759 3 594 165 — 3 368 3 210 158 —Expected transfer of profit to adjusted net worth — (5 177) — 5 177 — (4 598) — 4 598 Operating experience variances 3 1 081 281 (5) 805 991 (82) (4) 1 077 Operating assumption changes 4 488 599 (141) 30 522 581 68 (127)
Expected investment return on adjusted net worth 1 256 — — 1 256 1 179 — — 1 179
Embedded value earnings from operations 7 944 2 661 (181) 5 464 7 652 2 984 2 4 666
Economic assumption changes 5 (1 608) (1 506) (140) 38 86 74 — 12 Tax changes 7 5 1 1 (6) (2) — (4)Investment variances – value of in-force (74) (389) 78 237 557 160 1 396 Investment variances – investment return on adjusted net worth 443 — — 443 118 — — 118 Goodwill on business acquired (69) (69) — — (162) (167) 7 (2)Exchange rate movements 394 454 (60) — (6) (4) (2) —
Embedded value earnings from covered business 7 037 1 156 (302) 6 183 8 239 3 045 8 5 186
Acquired value of in-force 124 51 2 71 1 358 589 (55) 824 Transfers from/(to) other Group operations — — — — (106) (55) — (51)Transfers from covered business (8 332) — — (8 332) (4 573) — — (4 573)
Embedded value of covered business at the end of the period 47 222 35 506 (3 392) 15 108 48 393 34 299 (3 092) 17 186
Analysis of earnings from covered business
Sanlam Personal Finance 4 363 267 (26) 4 122 5 805 2 038 (32) 3 799 Sanlam Emerging Markets 1 403 397 (79) 1 085 932 211 39 682 Sanlam UK 277 208 (155) 224 147 68 (4) 83 Sanlam Employee Benefits 994 284 (42) 752 1 355 728 5 622
Embedded value earnings from covered business 7 037 1 156 (302) 6 183 8 239 3 045 8 5 186
58 Sanlam investor presentation 2015

Value of new businessfor the year ended 31 December 2015
R million Note 2015 2014
Value of new business (at point of sale):Gross value of new business 1 729 1 979
Sanlam Personal Finance 1 065 1 191
Sanlam Emerging Markets 499 466
Sanlam UK 28 33
Sanlam Employee Benefits 137 289
Cost of capital (215) (236)
Sanlam Personal Finance (110) (107)
Sanlam Emerging Markets (51) (35)
Sanlam UK (2) (3)
Sanlam Employee Benefits (52) (91)
Value of new business 1 514 1 743
Sanlam Personal Finance 955 1 084
Sanlam Emerging Markets 448 431
Sanlam UK 26 30
Sanlam Employee Benefits 85 198
Value of new business attributable to:
Shareholders’ fund 2 1 360 1 592
Sanlam Personal Finance 955 1 084
Sanlam Emerging Markets 294 280
Sanlam UK 26 30
Sanlam Employee Benefits 85 198
Non-controlling interest 154 151
Sanlam Personal Finance — —
Sanlam Emerging Markets 154 151
Sanlam UK — —
Sanlam Employee Benefits — —
Value of new business 1 514 1 743
Geographical analysis:
South Africa 1 040 1 282
Africa 400 409
Other international 74 52
Value of new business 1 514 1 743
59Sanlam investor presentation 2015
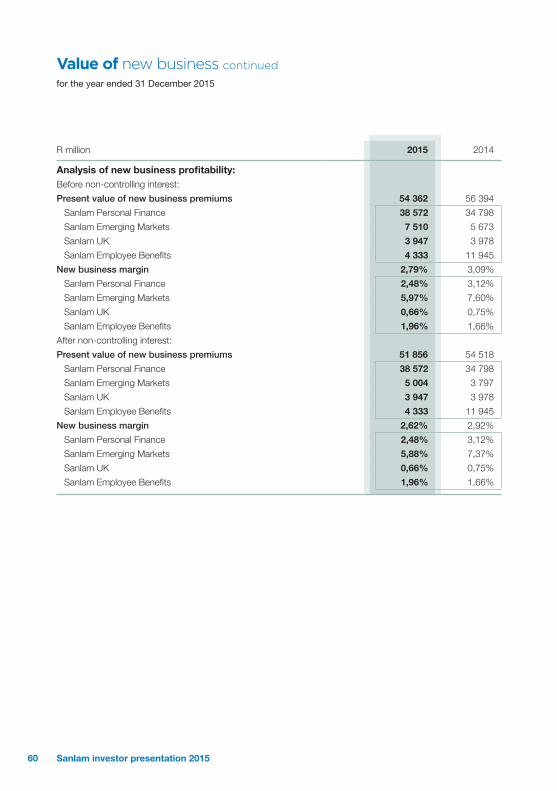
Value of new business continued
for the year ended 31 December 2015
R million 2015 2014
Analysis of new business profitability:Before non-controlling interest:
Present value of new business premiums 54 362 56 394
Sanlam Personal Finance 38 572 34 798
Sanlam Emerging Markets 7 510 5 673
Sanlam UK 3 947 3 978
Sanlam Employee Benefits 4 333 11 945
New business margin 2,79% 3,09%
Sanlam Personal Finance 2,48% 3,12%
Sanlam Emerging Markets 5,97% 7,60%
Sanlam UK 0,66% 0,75%
Sanlam Employee Benefits 1,96% 1,66%
After non-controlling interest:
Present value of new business premiums 51 856 54 518
Sanlam Personal Finance 38 572 34 798
Sanlam Emerging Markets 5 004 3 797
Sanlam UK 3 947 3 978
Sanlam Employee Benefits 4 333 11 945
New business margin 2,62% 2,92%
Sanlam Personal Finance 2,48% 3,12%
Sanlam Emerging Markets 5,88% 7,37%
Sanlam UK 0,66% 0,75%
Sanlam Employee Benefits 1,96% 1,66%
60 Sanlam investor presentation 2015

Notes to the embedded value of covered businessfor the year ended 31 December 2015
1. Value of in-force sensitivity analysis
Gross value of in-force
businessR million
Cost of capital
R million
Net value of in-force
businessR million
Change from base value
%
Base value at 31 December 2015 35 506 (3 392) 32 114 Risk discount rate increase by 1% 33 675 (4 025) 29 650 (8) Investment return and inflation decrease by
1%, coupled with a 1% decrease in risk discount rates, and with bonus rates changing commensurately 36 250 (3 206) 33 044 3
Equity and property values decrease by 10%, without a corresponding change in dividend and rental yields 34 166 (3 315) 30 851 (4)
Expected return on equity and property investments increase by 1%, without a corresponding change in discount rates 35 986 (3 083) 32 903 2
Expenses and persistency Non-commission maintenance expenses
(excluding investment expenses) decrease by 10% 36 688 (3 392) 33 296 4
Discontinuance rates decrease by 10% 36 547 (3 492) 33 055 3 Insurance risk
Mortality and morbidity decrease by 5% for life assurance business 36 927 (3 384) 33 543 4
Mortality and morbidity decrease by 5% for annuity business 35 248 (3 413) 31 835 (1)
Base value at 31 December 2014 34 299 (3 092) 31 207 Risk discount rate increase by 1% 32 429 (3 792) 28 637 (8) Investment return and inflation decrease by
1%, coupled with a 1% decrease in risk discount rates, and with bonus rates changing commensurately 35 445 (3 078) 32 367 4
Equity and property values decrease by 10%, without a corresponding change in dividend and rental yields 33 042 (3 024) 30 018 (4)
Expected return on equity and property investments increase by 1%, without a corresponding change in discount rates 34 806 (2 789) 32 017 3
Expenses and persistency Non-commission maintenance expenses
(excluding investment expenses) decrease by 10% 35 415 (3 092) 32 323 4
Discontinuance rates decrease by 10% 35 292 (3 185) 32 107 3Insurance risk
Mortality and morbidity decrease by 5% for life assurance business 35 856 (3 074) 32 782 5
Mortality and morbidity decrease by 5% for annuity business 34 009 (3 130) 30 879 (1)
61Sanlam investor presentation 2015

Notes to the embedded value of covered business continued
for the year ended 31 December 2015
2. Value of new business sensitivity analysis
Gross value
of new businessR million
Cost of capital
R million
Net value of
new businessR million
Change from base value
%
Base value at 31 December 2015 1 560 (200) 1 360 Risk discount rate increase by 1% 1 373 (242) 1 131 (17) Investment return and inflation decrease by
1%, coupled with a 1% decrease in risk discount rates, and with bonus rates changing commensurately 1 608 (197) 1 411 4
Expenses and persistency Non-commission maintenance expenses
(excluding investment expenses) decrease by 10% 1 686 (200) 1 486 9
Acquisition expenses (excluding commission and commission related expenses) decrease by 10% 1 707 (200) 1 507 11
Discontinuance rates decrease by 10% 1 767 (210) 1 557 14 Insurance risk
Mortality and morbidity decrease by 5% for life assurance business 1 720 (198) 1 522 12
Mortality and morbidity decrease by 5% for annuity business 1 552 (199) 1 353 (1)
62 Sanlam investor presentation 2015

3. Operating experience variances
R million TotalValue of in-force
Cost of capital
Adjusted net
worth
31 December 2015
Risk experience 816 205 — 611
Persistency 174 168 (2) 8
Maintenance expenses (16) (12) (1) (3)
Working capital and other 107 (80) (2) 189
Total operating experience variances 1 081 281 (5) 805
31 December 2014
Risk experience 842 38 5 799
Persistency (64) (22) (39) (3)
Maintenance expenses 22 1 1 20
Working capital and other 191 (99) 29 261
Total operating experience variances 991 (82) (4) 1 077
63Sanlam investor presentation 2015

Notes to the embedded value of covered business continued
for the year ended 31 December 2015
R million TotalValue ofin-force
Cost of capital
Adjusted net
worth
4. Operating assumption changes31 December 2015
Risk experience 810 756 5 49
Persistency (60) 13 (18) (55)
Maintenance expenses (3) 23 5 (31)
Modelling improvements and other (259) (193) (133) 67
Total operating assumption changes 488 599 (141) 30
31 December 2014
Risk experience 167 107 (2) 62
Persistency 88 (56) 25 119
Maintenance expenses 32 48 (2) (14)
Modelling improvements and other 235 482 47 (294)
Total operating assumption changes 522 581 68 (127)
5. Economic assumption changes31 December 2015
Investment yields (1 603) (1 501) (140) 38
Long-term asset mix assumptions and other (5) (5) — —
Total economic assumption changes (1 608) (1 506) (140) 38
31 December 2014
Investment yields 86 73 1 12
Long-term asset mix assumptions and other — 1 (1) —
Total economic assumption changes 86 74 — 12
64 Sanlam investor presentation 2015

6. Reconciliation of growth from covered business
R million 2015 2014
The embedded value earnings from covered business reconciles as follows to the net result from financial services for the year:
Net result from financial services of covered business 4 484 3 889
Sanlam Personal Finance 3 446 3 110
Sanlam Emerging Markets 603 477
Sanlam UK 74 68
Sanlam Employee Benefits 361 234
Investment return on adjusted net worth 1 699 1 297
Embedded value earnings from covered business: value of in-force 854 3 053
Embedded value earnings from covered business 7 037 8 239
7. Economic assumptionsGross investment return, risk discount rate and inflation
Sanlam Life
Point used on the relevant yield curve 9 year 9 year
Fixed-interest securities 10,1% 8,1%
Equities and offshore investments 13,6% 11,6%
Hedged equities 9,5% 8,6%
Property 11,1% 9,1%
Cash 9,1% 7,1%
Gross return on required capital(1) 9,8% 9,3%
Net return on required capital(1) 8,4% 7,6%
Inflation rate(2) 8,1% 6,1%
Risk discount rate 12,6% 10,6%
(1) 2014 return has been adjusted to exclude the assets matching the subordinated debt. This is consistent with the 2015 disclosure and in line with how the asset mix was modelled in the 2014 and 2015 valuations.
(2) Expense inflation of 10,1% (2014: 8,1%) assumed for retail business administered on old platforms.
65Sanlam investor presentation 2015
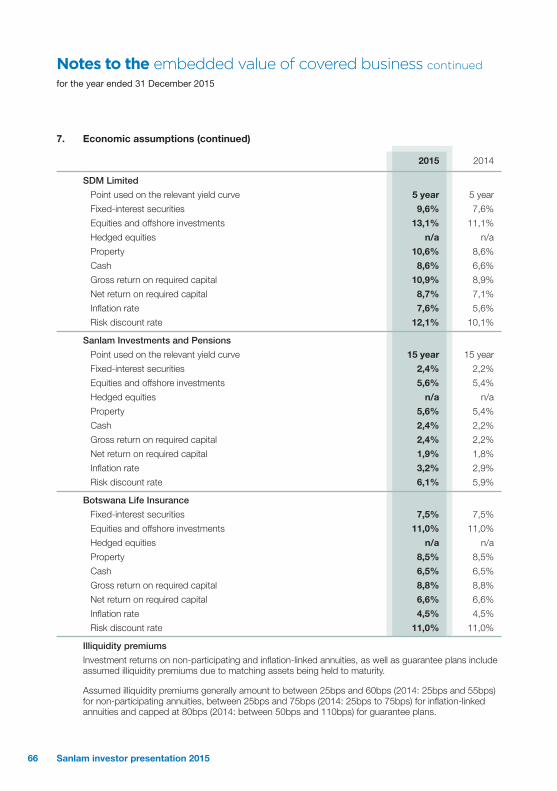
Notes to the embedded value of covered business continued
for the year ended 31 December 2015
7. Economic assumptions (continued)
2015 2014
SDM Limited
Point used on the relevant yield curve 5 year 5 year
Fixed-interest securities 9,6% 7,6%
Equities and offshore investments 13,1% 11,1%
Hedged equities n/a n/a
Property 10,6% 8,6%
Cash 8,6% 6,6%
Gross return on required capital 10,9% 8,9%
Net return on required capital 8,7% 7,1%
Inflation rate 7,6% 5,6%
Risk discount rate 12,1% 10,1%
Sanlam Investments and Pensions
Point used on the relevant yield curve 15 year 15 year
Fixed-interest securities 2,4% 2,2%
Equities and offshore investments 5,6% 5,4%
Hedged equities n/a n/a
Property 5,6% 5,4%
Cash 2,4% 2,2%
Gross return on required capital 2,4% 2,2%
Net return on required capital 1,9% 1,8%
Inflation rate 3,2% 2,9%
Risk discount rate 6,1% 5,9%
Botswana Life Insurance
Fixed-interest securities 7,5% 7,5%
Equities and offshore investments 11,0% 11,0%
Hedged equities n/a n/a
Property 8,5% 8,5%
Cash 6,5% 6,5%
Gross return on required capital 8,8% 8,8%
Net return on required capital 6,6% 6,6%
Inflation rate 4,5% 4,5%
Risk discount rate 11,0% 11,0%
Illiquidity premiums
Investment returns on non-participating and inflation-linked annuities, as well as guarantee plans include assumed illiquidity premiums due to matching assets being held to maturity.
Assumed illiquidity premiums generally amount to between 25bps and 60bps (2014: 25bps and 55bps) for non-participating annuities, between 25bps and 75bps (2014: 25bps to 75bps) for inflation-linked annuities and capped at 80bps (2014: between 50bps and 110bps) for guarantee plans.
66 Sanlam investor presentation 2015
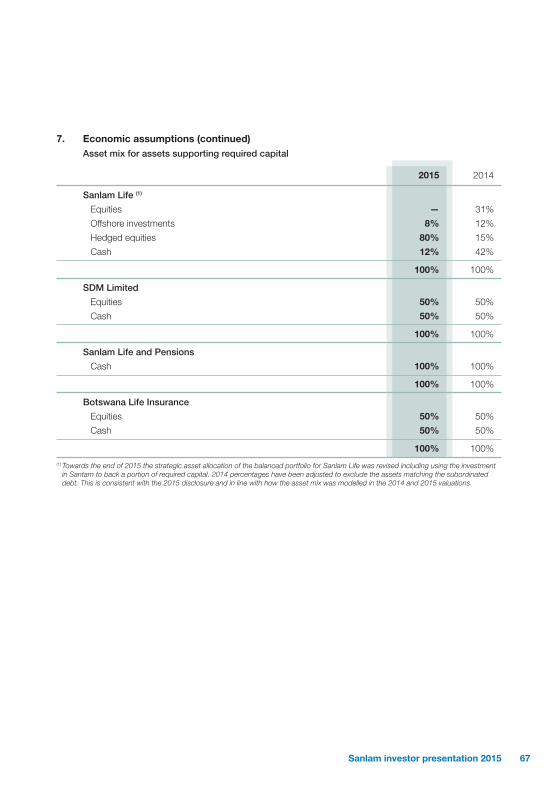
7. Economic assumptions (continued)Asset mix for assets supporting required capital
2015 2014
Sanlam Life (1)
Equities — 31%
Offshore investments 8% 12%
Hedged equities 80% 15%
Cash 12% 42%
100% 100%
SDM Limited
Equities 50% 50%
Cash 50% 50%
100% 100%
Sanlam Life and Pensions
Cash 100% 100%
100% 100%
Botswana Life Insurance
Equities 50% 50%
Cash 50% 50%
100% 100%
(1) Towards the end of 2015 the strategic asset allocation of the balanced portfolio for Sanlam Life was revised including using the investment in Santam to back a portion of required capital. 2014 percentages have been adjusted to exclude the assets matching the subordinated debt. This is consistent with the 2015 disclosure and in line with how the asset mix was modelled in the 2014 and 2015 valuations.
67Sanlam investor presentation 2015

BASTION GRAPHICS

BASTION GRAPHICS


