31
INVESTOR PRESENTATION - 1 Investor Presentation 3Q 2016 Results
INVESTOR PRESENTATION - 1
Investor Presentation
3Q 2016 Results

INVESTOR PRESENTATION - 2
Egyptian Market International Markets
Global Macro Fundamentals
o Sustained economic growth GDP is expected to record a growth ranging
from 4 -5% annually up to 2021 as per the IMF.
o Healthy demographics The demand for floor coverings is increasing as
almost 50% of the Egyptian population are near
the marriage with around 800,000 marriages
taking place annually.
o Housing gap The market gap for housing is about 3 million
units which creates potential for the development
of new private and social housing projects.
o US fundamentals are strong.
o Strong potential in African
beside East Asian markets.
o European markets start to
recover.

INVESTOR PRESENTATION - 3
Demand Triggers in Egypt
o Strong growth in the real estate market driven
by economic growth, increasing interest in
gated-urban communities and increasing
government social housing.
o Sizeable youth population with 50% below
the age of 25.
o Increasing stringent procedures on imports
of rugs starting March 2016.
o Challenging environment for rug importers
on limited supply of foreign currency.
Sizeable youth bracket
INVESTOR PRESENTATION - 4
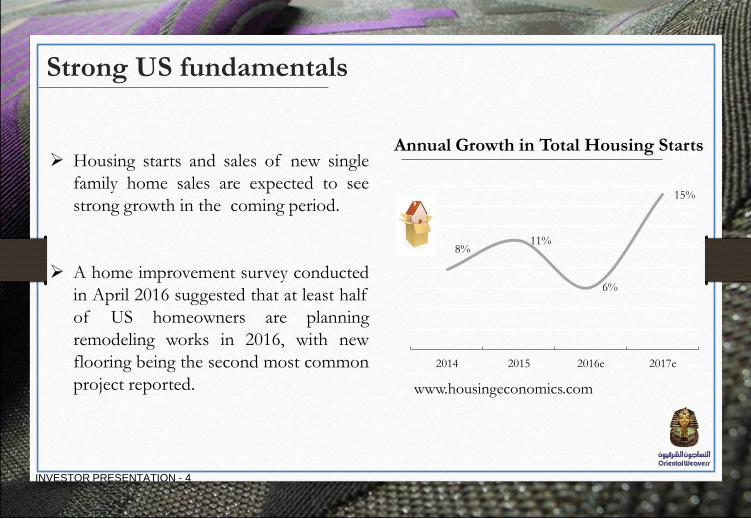
Strong US fundamentals
Housing starts and sales of new single
family home sales are expected to see
strong growth in the coming period.
A home improvement survey conducted
in April 2016 suggested that at least half
of US homeowners are planning
remodeling works in 2016, with new
flooring being the second most common
project reported.
8% 11%
6%
15%
2014 2015 2016e 2017e
www.housingeconomics.com
Annual Growth in Total Housing Starts

INVESTOR PRESENTATION - 5
Oriental Weavers in Numbers
37 years
In the global rugs
market
230
Showrooms in
Egypt
111
mn sqm sold in
2015
51%
Export
contribution in
9M2016
10
Manufacturing
facilities
130
Export countries
INVESTOR PRESENTATION - 6
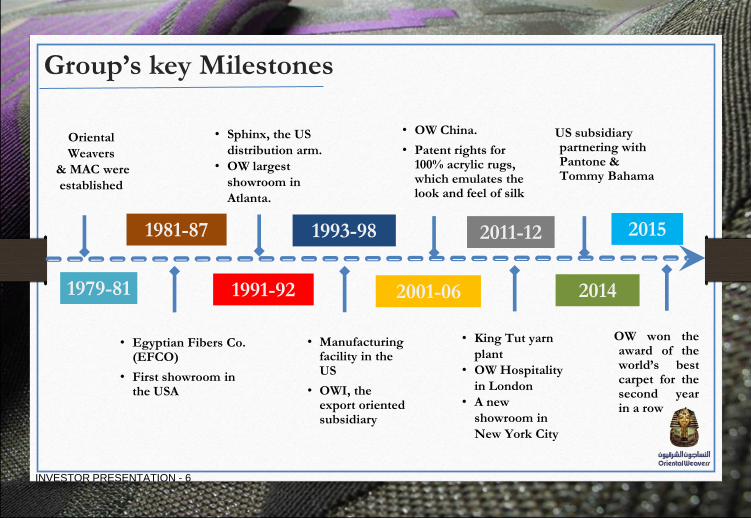
2014
2011-12
2001-06
1993-98
Group’s key Milestones
US subsidiary partnering with Pantone & Tommy Bahama
• King Tut yarn
plant
• OW Hospitality
in London
• A new
showroom in
New York City
• OW China.
• Patent rights for 100% acrylic rugs, which emulates the look and feel of silk
• Manufacturing facility in the US
• OWI, the export oriented subsidiary
1981-87
1991-92 1979-81
• Egyptian Fibers Co. (EFCO)
• First showroom in the USA
Oriental
Weavers
& MAC were
established
• Sphinx, the US
distribution arm.
• OW largest
showroom in
Atlanta.
2015
OW won the award of the world’s best carpet for the second year in a row
INVESTOR PRESENTATION - 7
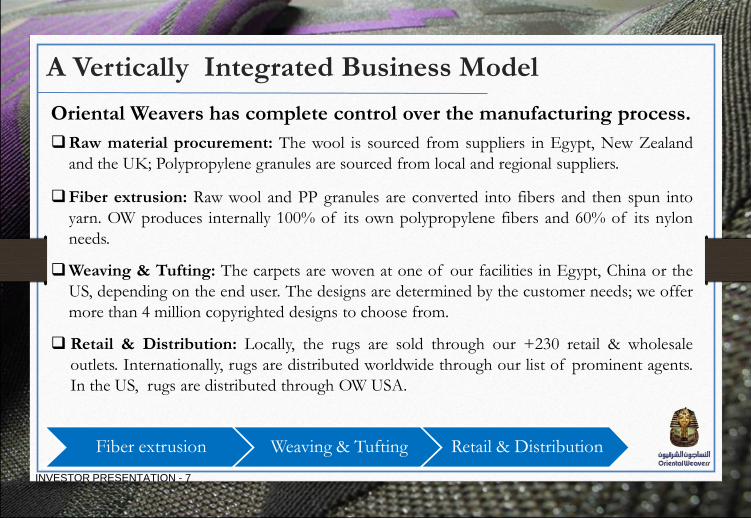
A Vertically Integrated Business Model
Oriental Weavers has complete control over the manufacturing process.
Raw material procurement: The wool is sourced from suppliers in Egypt, New Zealand
and the UK; Polypropylene granules are sourced from local and regional suppliers.
Fiber extrusion: Raw wool and PP granules are converted into fibers and then spun into
yarn. OW produces internally 100% of its own polypropylene fibers and 60% of its nylon
needs.
Weaving & Tufting: The carpets are woven at one of our facilities in Egypt, China or the
US, depending on the end user. The designs are determined by the customer needs; we offer
more than 4 million copyrighted designs to choose from.
Retail & Distribution: Locally, the rugs are sold through our +230 retail & wholesale
outlets. Internationally, rugs are distributed worldwide through our list of prominent agents.
In the US, rugs are distributed through OW USA.
Fiber extrusion Weaving & Tufting Retail & Distribution
INVESTOR PRESENTATION - 8
Sizeable Export base Ensures Dollar Self
Sufficiency
OW has been immune to the dollar shortage in Egypt thanks to the over
50% export contribution.
Current efforts to shift some of the dollar based debt facilities to Euro to
continue ensuring the naturally-hedged business model.
OW’s solid dollar position enables the company to source funding at
attractive costs.
INVESTOR PRESENTATION - 9
INVESTOR PRESENTATION - 9
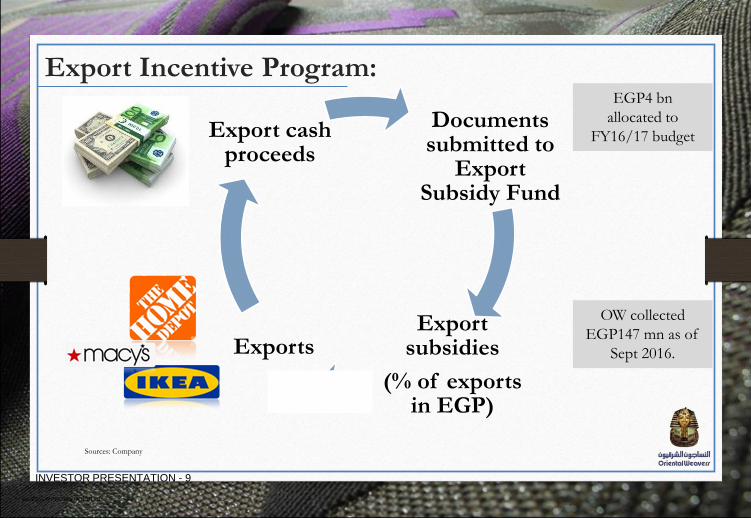
Documents submitted to
Export Subsidy Fund
Export subsidies
(% of exports in EGP)
Exports
Export cash proceeds
Export Incentive Program:
Sources: Company
EGP4 bn
allocated to
FY16/17 budget
OW collected
EGP147 mn as of
Sept 2016.
INVESTOR PRESENTATION - 10
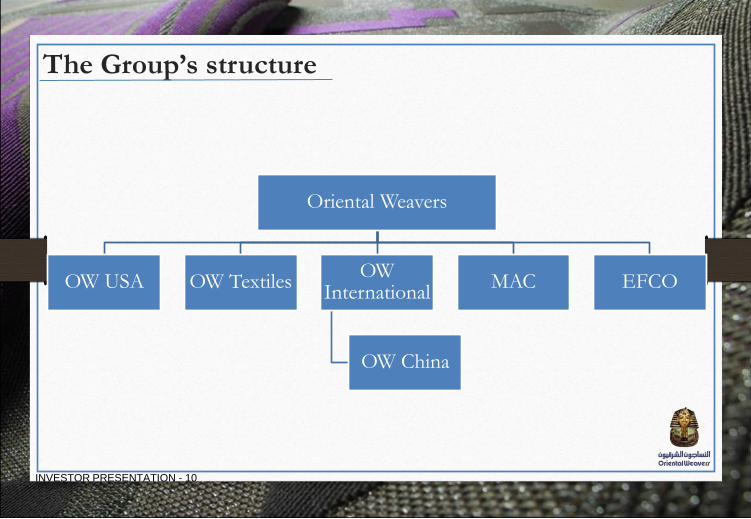
The Group’s structure
Oriental Weavers
OW USA OW Textiles OW
International
OW China
MAC EFCO
INVESTOR PRESENTATION - 11
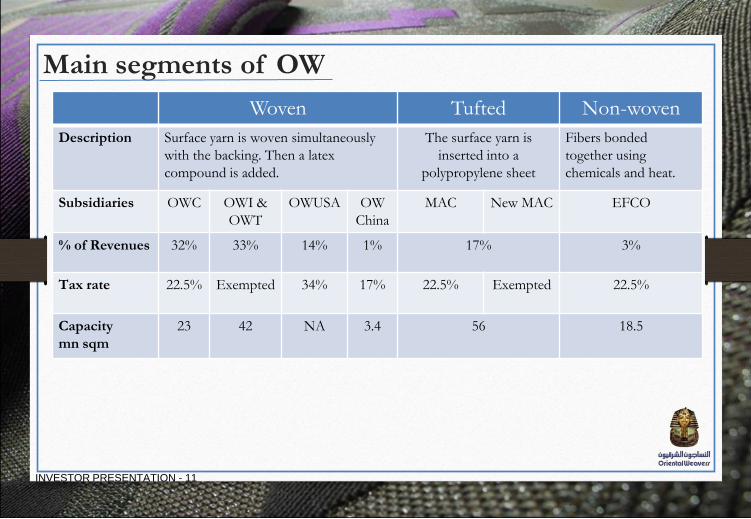
Main segments of OW
Woven Tufted Non-woven
Description Surface yarn is woven simultaneously
with the backing. Then a latex
compound is added.
The surface yarn is
inserted into a
polypropylene sheet
Fibers bonded
together using
chemicals and heat.
Subsidiaries OWC OWI &
OWT
OWUSA OW
China
MAC New MAC EFCO
% of Revenues 32% 33% 14% 1% 17% 3%
Tax rate 22.5% Exempted 34% 17% 22.5% Exempted 22.5%
Capacity
mn sqm
23 42 NA 3.4 56 18.5
INVESTOR PRESENTATION - 12
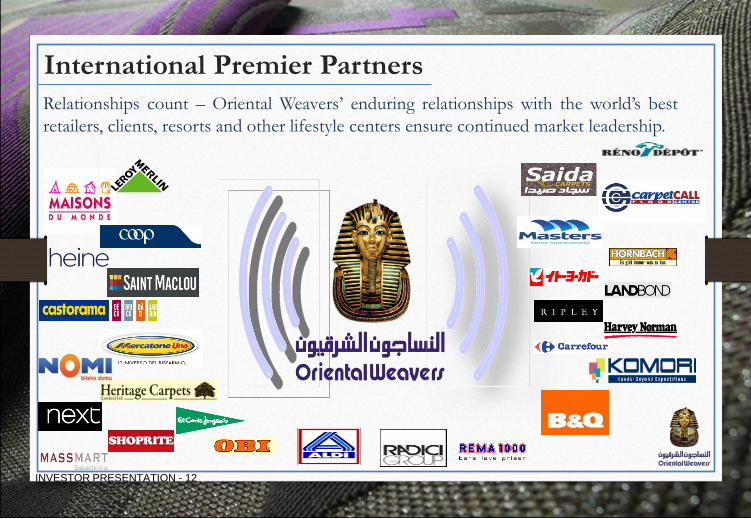
International Premier Partners
Relationships count – Oriental Weavers’ enduring relationships with the world’s best
retailers, clients, resorts and other lifestyle centers ensure continued market leadership.

INVESTOR PRESENTATION - 13
American & Canadian Premier Partners
INVESTOR PRESENTATION - 14
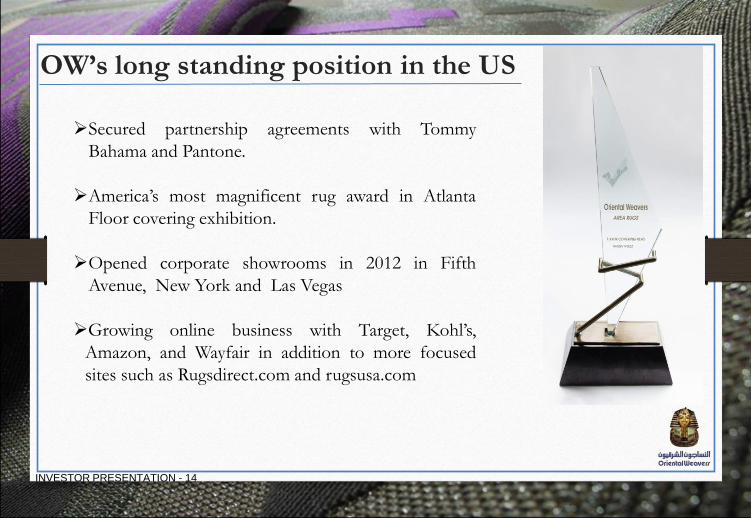
Secured partnership agreements with Tommy
Bahama and Pantone.
America’s most magnificent rug award in Atlanta
Floor covering exhibition.
Opened corporate showrooms in 2012 in Fifth
Avenue, New York and Las Vegas
Growing online business with Target, Kohl’s,
Amazon, and Wayfair in addition to more focused
sites such as Rugsdirect.com and rugsusa.com
OW’s long standing position in the US
INVESTOR PRESENTATION - 15
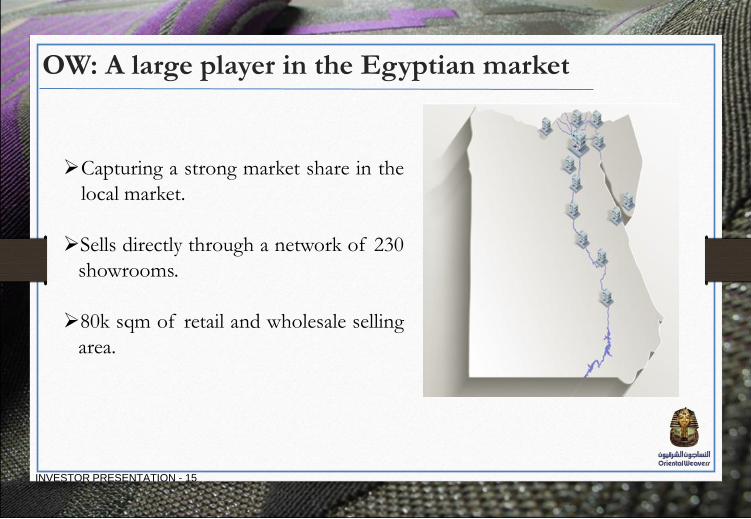
OW: A large player in the Egyptian market
Capturing a strong market share in the
local market.
Sells directly through a network of 230
showrooms.
80k sqm of retail and wholesale selling
area.

INVESTOR PRESENTATION - 16
Premier Partners: Hospitality Segment
OW Hospitality, the London-based hospitality carpeting arm, is the preferred supplier
for the Four Seasons and several other major hotel chains.
We continue to see solid and continuous growth in the US and the KSA.

INVESTOR PRESENTATION - 17
OW Hospitality: Recently Completed Projects
JW Marriott Grosvenor House,
London
Marriott Richmond, Virginia
In the US
Ritz Chicago
Four seasons Dallas
Disney Cruise
Fairmont Empress
Caesars main Casino
In the UAE
The Atlantis
Fountainview Towers 1,2,3 and 4
Damac Paramount Towers
The Westin
In Egypt: 140% growth in 9M 2016
Part of Al-Azhar Mosque
Four Seasons renovations, Marriott Mena
House, Radisson Blu, Hilton Ramses
Cinemas of the Mall of Egypt and Citystars
Terminal 2 of Cairo Airport
INVESTOR PRESENTATION - 18
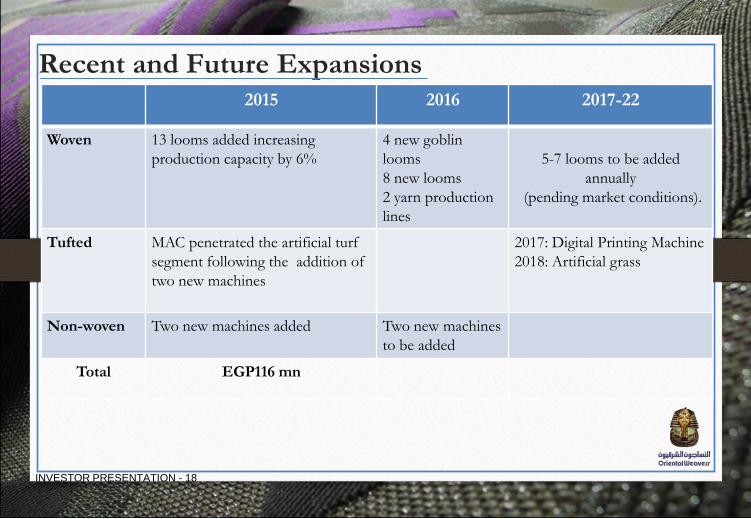
Recent and Future Expansions
2016-2020
2015 2016 2017-22
Woven 13 looms added increasing
production capacity by 6%
4 new goblin
looms
8 new looms
2 yarn production
lines
5-7 looms to be added
annually
(pending market conditions).
Tufted MAC penetrated the artificial turf
segment following the addition of
two new machines
2017: Digital Printing Machine
2018: Artificial grass
Non-woven Two new machines added Two new machines
to be added
Total EGP116 mn
INVESTOR PRESENTATION - 19
Merger of Rosetex with OW Textiles
OW finalized the necessary producers to merge Rostex with Oriental Weavers
Textiles (OWT). Hence, OWT became one of the subsidiaries of Oriental Weavers
Carpets.
The merger added 6% to 9M 2016 attributable net earnings of OW with 2% lower
revenues given the intercompany transactions between Oriental Weavers Textiles
and the subsidiaries of Oriental Weavers Carpets.
Increasing consolidated assets by EGP354 mn, while consolidated liabilities
should increase by EGP142 mn.
Oriental Weavers Textiles provides enough land area eligible for any future
expansions.
INVESTOR PRESENTATION - 20
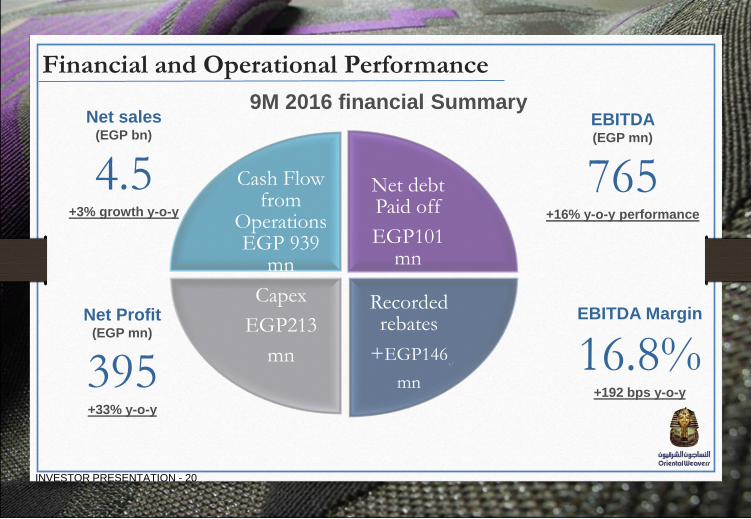
Net sales (EGP bn)
4.5 +3% growth y-o-y
9M 2016 financial Summary
Net Profit (EGP mn)
395 +33% y-o-y
EBITDA (EGP mn)
765 +16% y-o-y performance
EBITDA Margin
16.8% +192 bps y-o-y
Cash Flow from
Operations EGP 939
mn
Net debt Paid off
EGP101 mn
Recorded rebates
+EGP146
mn
Capex
EGP213
mn
Financial and Operational Performance
INVESTOR PRESENTATION - 21
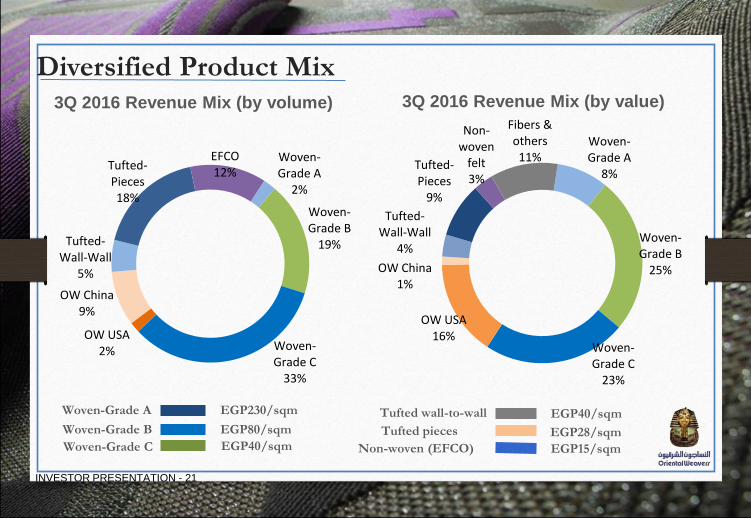
Diversified Product Mix 3Q 2016 Revenue Mix (by volume) 3Q 2016 Revenue Mix (by value)
EGP230/sqm
EGP80/sqm
EGP40/sqm
EGP40/sqm
EGP28/sqm
EGP15/sqm
Woven-Grade A
Non-woven (EFCO)
Tufted pieces
Tufted wall-to-wall
Woven-Grade C
Woven-Grade B
Woven- Grade A
8%
Woven- Grade B
25%
Woven- Grade C
23%
OW USA 16%
OW China 1%
Tufted- Wall-Wall
4%
Tufted- Pieces
9%
Non-woven
felt 3%
Fibers & others 11% Woven-
Grade A 2%
Woven- Grade B
19%
Woven- Grade C
33%
OW USA 2%
OW China 9%
Tufted- Wall-Wall
5%
Tufted- Pieces 18%
EFCO 12%
INVESTOR PRESENTATION - 22
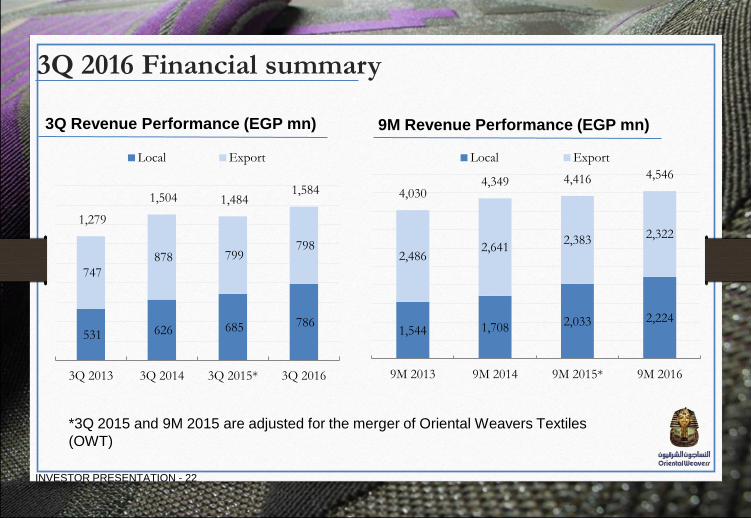
3Q 2016 Financial summary
3Q Revenue Performance (EGP mn) 9M Revenue Performance (EGP mn)
1,544 1,708 2,033 2,224
2,486 2,641
2,383 2,322
4,030 4,349 4,416 4,546
9M 2013 9M 2014 9M 2015* 9M 2016
Local Export
*3Q 2015 and 9M 2015 are adjusted for the merger of Oriental Weavers Textiles
(OWT)
531 626 685 786
747
878 799 798
1,279
1,504 1,484 1,584
3Q 2013 3Q 2014 3Q 2015* 3Q 2016
Local Export
INVESTOR PRESENTATION - 23
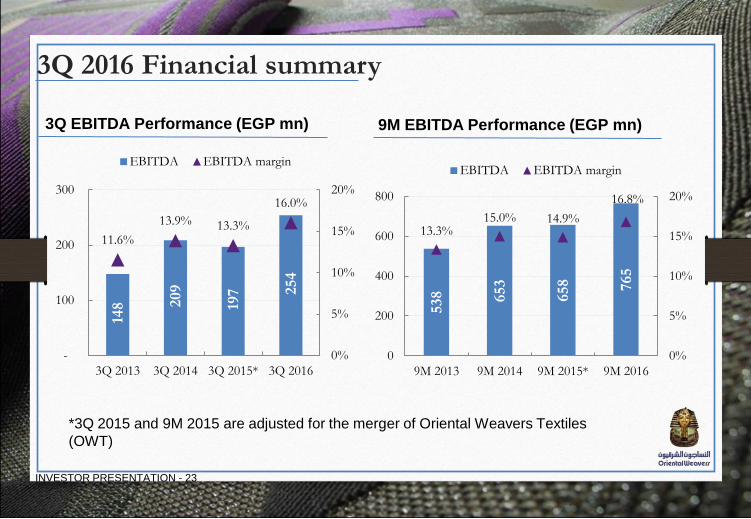
3Q 2016 Financial summary
3Q EBITDA Performance (EGP mn) 9M EBITDA Performance (EGP mn)
538
653
658
765
13.3% 15.0% 14.9%
16.8%
0%
5%
10%
15%
20%
0
200
400
600
800
9M 2013 9M 2014 9M 2015* 9M 2016
EBITDA EBITDA margin
148
209
197
254
11.6%
13.9% 13.3%
16.0%
0%
5%
10%
15%
20%
-
100
200
300
3Q 2013 3Q 2014 3Q 2015* 3Q 2016
EBITDA EBITDA margin
*3Q 2015 and 9M 2015 are adjusted for the merger of Oriental Weavers Textiles
(OWT)
INVESTOR PRESENTATION - 24
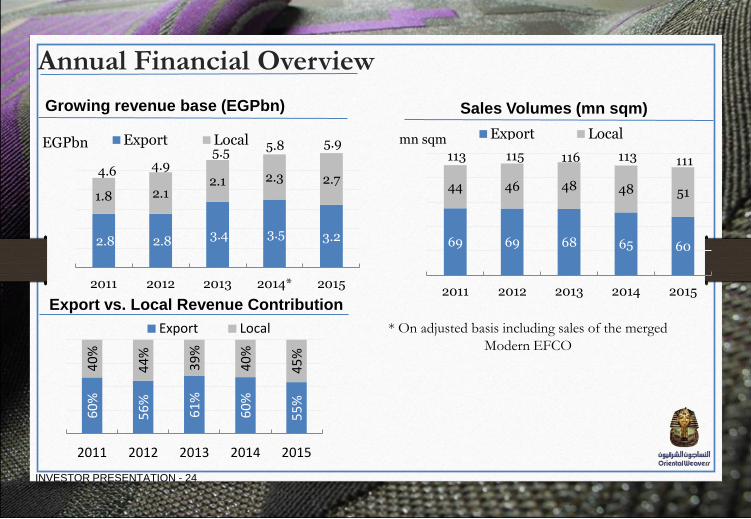
Annual Financial Overview
* On adjusted basis including sales of the merged
Modern EFCO
Growing revenue base (EGPbn)
2.8 2.8 3.4 3.5 3.2
1.8 2.1 2.1 2.3 2.7
4.6 4.9 5.5
5.8 5.9
2011 2012 2013 2014* 2015
EGPbn Export Local
60
%
56
%
61
%
60
%
55
%
40
%
44
%
39
%
40
%
45
%
2011 2012 2013 2014 2015
Export Local
Sales Volumes (mn sqm)
69 69 68 65 60
44 46 48 48 51
113 115 116 113 111
2011 2012 2013 2014 2015
mn sqm Export Local
Export vs. Local Revenue Contribution
INVESTOR PRESENTATION - 25
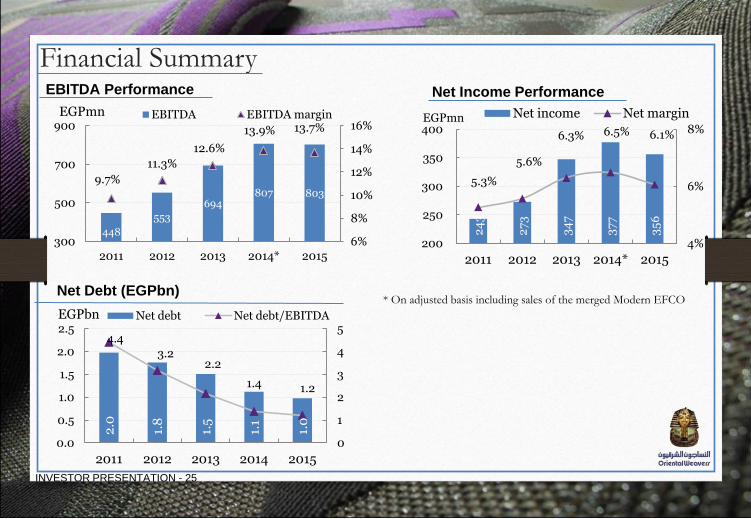
Financial Summary
Net Debt (EGPbn) * On adjusted basis including sales of the merged Modern EFCO
2.0
1.8
1.5
1.1
1.0
4.4
3.2 2.2
1.4 1.2
0
1
2
3
4
5
0.0
0.5
1.0
1.5
2.0
2.5
2011 2012 2013 2014 2015
EGPbn Net debt Net debt/EBITDA
24
3
27
3
34
7
37
7
35
6
5.3%
5.6%
6.3% 6.5% 6.1%
4%
6%
8%
200
250
300
350
400
2011 2012 2013 2014* 2015
EGPmn Net income Net margin
448
553
694 807 803
9.7%
11.3%
12.6%
13.9% 13.7%
6%
8%
10%
12%
14%
16%
300
500
700
900
2011 2012 2013 2014* 2015
EGPmn EBITDA EBITDA margin
EBITDA Performance Net Income Performance

INVESTOR PRESENTATION - 26
Cost Structure: Polypropylene is OW main raw material
Polypropylene granules are carefully sourced after receiving monthly price quotations from
different suppliers, taking into account other cost factors associated with importing the
granules.
Almost 50% of the polypropylene needs are sourced locally and the remaining needs are
imported from regional suppliers.
Sources: Company
Polypropylene — used in synthetic and blended rugs and carpets — is an oil derivative, representing
around 26% of costs. Polypropylene prices are driven in large part by:
i) Petroleum prices ii) Market demand for polypropylene
PP prices (in $/ Metric Tons)
990
1,363
1,629 1,456
1,585 1,576
1,184 979
300
900
1,500
2,100
2009 2010 2011 2012 2013 2014 2015 2016
USD /ton
INVESTOR PRESENTATION - 27
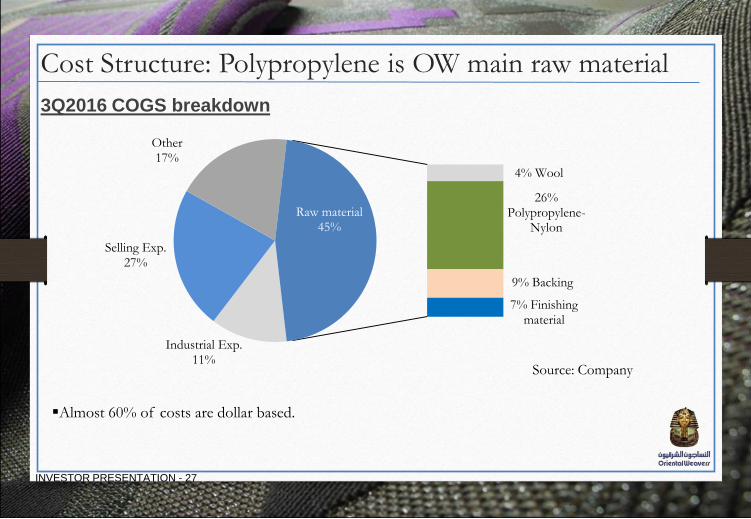
Cost Structure: Polypropylene is OW main raw material
Source: Company
3Q2016 COGS breakdown
Almost 60% of costs are dollar based.
Industrial Exp. 11%
Selling Exp. 27%
Other 17%
4% Wool
26% Polypropylene-
Nylon
9% Backing
7% Finishing material
Raw material 45%
INVESTOR PRESENTATION - 28
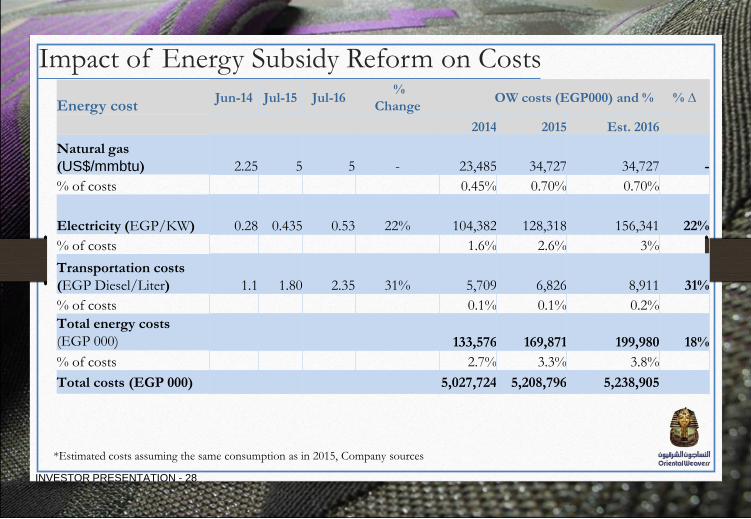
Impact of Energy Subsidy Reform on Costs
*Estimated costs assuming the same consumption as in 2015, Company sources
Energy cost Jun-14 Jul-15 Jul-16
%
Change OW costs (EGP000) and % % ∆
2014 2015 Est. 2016
Natural gas
(US$/mmbtu) 2.25 5 5 -
23,485
34,727
34,727 -
% of costs 0.45% 0.70% 0.70%
Electricity (EGP/KW) 0.28 0.435 0.53 22%
104,382
128,318 156,341 22%
% of costs 1.6% 2.6% 3%
Transportation costs
(EGP Diesel/Liter) 1.1 1.80 2.35 31%
5,709
6,826 8,911 31%
% of costs 0.1% 0.1% 0.2%
Total energy costs
(EGP 000)
133,576
169,871 199,980 18%
% of costs 2.7% 3.3% 3.8%
Total costs (EGP 000) 5,027,724 5,208,796 5,238,905

INVESTOR PRESENTATION - 29
Share Data
Sources: Company 0
.54
0.6
1
0.7
7
0.8
2
0.7
9
56%
49% 52%
49%
63%
20%
40%
60%
80%
0.40
0.60
0.80
2011 2012 2013 2014 2015
EGP EPS Payout ratio
o 450 mn shares at par value of EGP 1 per share.
o Issued and Paid-in Capital EGP 450 mn.
o Listed in EGX since September 1997.
o 3 Month average daily value USD0.5mn.
o Market Cap USD300mn (as of Nov 20, 2016).
o Distributed DPS of EGP0.5 in May 2016.
o Reuters; Bloomberg ORWE.CA; ORWE EY.
Khamis Family & Related Entities 57%
Institutions 38%
Retail 5%
SHAREHOLDER STRUCTURE
INVESTOR PRESENTATION - 30
Disclaimer
Certain information contained in this document consists of forward-looking statements reflecting the
current view of the Company with respect to future events and are subject to certain risks,
uncertainties and assumptions. Many factors could cause the actual results, performance or
achievements of the Company to be materially different from any future results, performance, or
achievements that may be expressed or implied by such forward-looking statements, including
worldwide economic trends, the economic and political climate of Egypt and the Middle East and
changes in business strategy and various other factors. Should one or more of these risks or
uncertainties materialize, or should underlying assumptions prove incorrect, actual results may vary
materially from those described in such forward-looking statements. Recipients of this document are
cautioned not to place any reliance on these forward-looking statements. The Company undertakes no
obligation to republish revised forward-looking statements to reflect changed events or circumstances.

INVESTOR PRESENTATION - 31
For More Information, please contact Ingy El-Diwany
Investor Relations Manager
+202-22685166
www.orientalweavers.com


