36
Investor Presentation August’ 2011

Investor Presentation
August’ 2011
Environment
INR
1300 bn
FMCG
sector
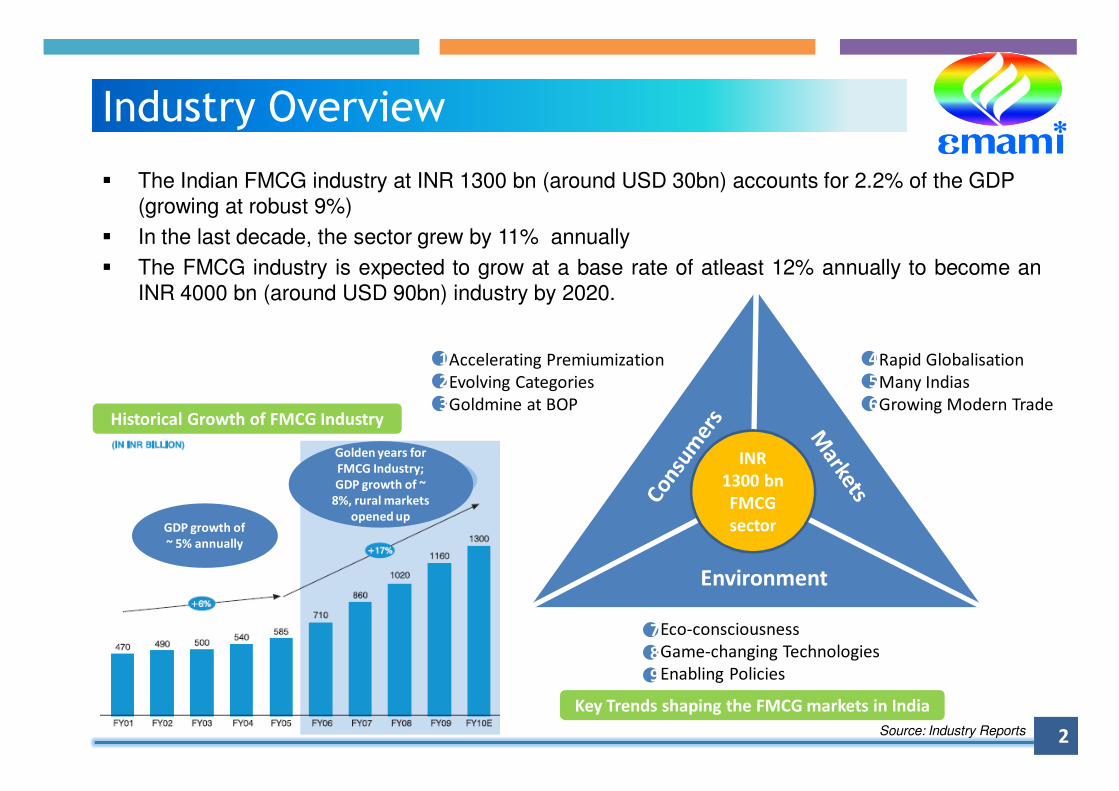
Accelerating Premiumization
Evolving Categories
Goldmine at BOP
Rapid Globalisation
Many Indias
Growing Modern Trade
Eco-consciousness
Game-changing Technologies
Enabling Policies
1
2
3
4
5
6
7
8
9
Industry Overview
GDP growth of
~ 5% annually
Golden years for
FMCG Industry;
GDP growth of ~
8%, rural markets
opened up
Key Trends shaping the FMCG markets in India
Historical Growth of FMCG Industry
� The Indian FMCG industry at INR 1300 bn (around USD 30bn) accounts for 2.2% of the GDP (growing at robust 9%)
� In the last decade, the sector grew by 11% annually
� The FMCG industry is expected to grow at a base rate of atleast 12% annually to become anINR 4000 bn (around USD 90bn) industry by 2020.
Source: Industry Reports 2

Key Drivers of the FMCG industry in India
Source: Industry Reports 3

Low penetration ….Big opportunity
95.6%92.3%
88.6%
74.2%
64.3%
55.7%51.6%
17.1%
1.7% 1.3%0.0%
10.0%
20.0%
30.0%
40.0%
50.0%
60.0%
70.0%
80.0%
90.0%
100.0%
Toilet
Soap
Washing
Powders
Detergent
Bar
Hair
Oil
Toothpaste Shampoo Talcum
Powder
Fairness
Cream
Antiseptic
Cream
Cold
Cream
Low penetration of major segments indicates long term growth story
Source: Industry Reports 4

� Emami Limited, the flagship company of the Emami Group, is a leading FMCG player in India
� The Company is promoted by Mr. R.S. Agarwal and Mr. R.S. Goenka
� Emami has been in the health, beauty and personal care since the last 35 years and hassustained its prominent position in Ayurvedic products
� Aided by state-of-the-art R&D, it has developed power brands like ‘Navratna’, ‘BoroPlus’ and ‘Fair and Handsome’
� About 80% of the Company’s production comes from tax exempt zones
� Gross revenue of over Rs 12 bn ($284mn) in FY 2011 with a CAGR of 26% over last 5 years
To make people Healthy and Beautiful, naturally
Company Overview
5

Shareholding Pattern
6
Promoters
72.7%
MFs /
FIIs, 17.1%
Others,
10.2%
� Listed on the NSE, BSE and Kolkata stock exchanges
� Market capitalisation in excess of Rs. 65 bn (USD 1.4bn)
� Return to investors of over 175% following its QIP in July 2009
7
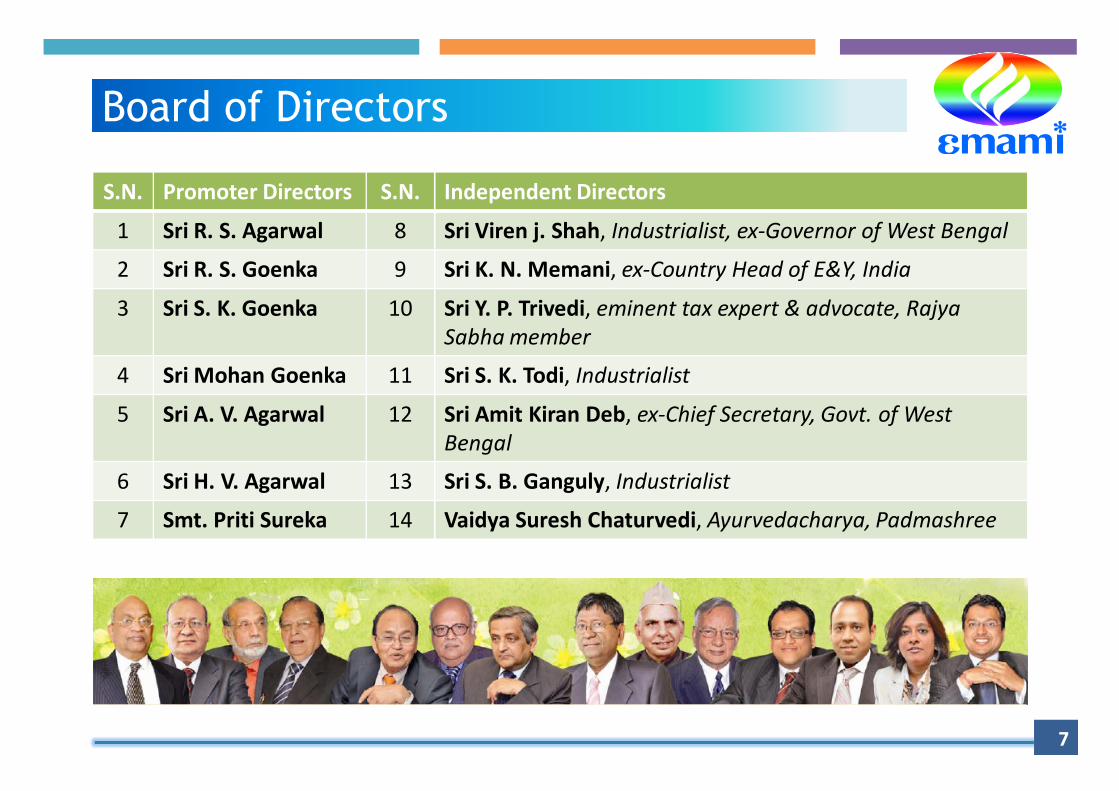
Board of Directors
S.N. Promoter Directors S.N. Independent Directors
1 Sri R. S. Agarwal 8 Sri Viren j. Shah, Industrialist, ex-Governor of West Bengal
2 Sri R. S. Goenka 9 Sri K. N. Memani, ex-Country Head of E&Y, India
3 Sri S. K. Goenka 10 Sri Y. P. Trivedi, eminent tax expert & advocate, Rajya
Sabha member
4 Sri Mohan Goenka 11 Sri S. K. Todi, Industrialist
5 Sri A. V. Agarwal 12 Sri Amit Kiran Deb, ex-Chief Secretary, Govt. of West
Bengal
6 Sri H. V. Agarwal 13 Sri S. B. Ganguly, Industrialist
7 Smt. Priti Sureka 14 Vaidya Suresh Chaturvedi, Ayurvedacharya, Padmashree
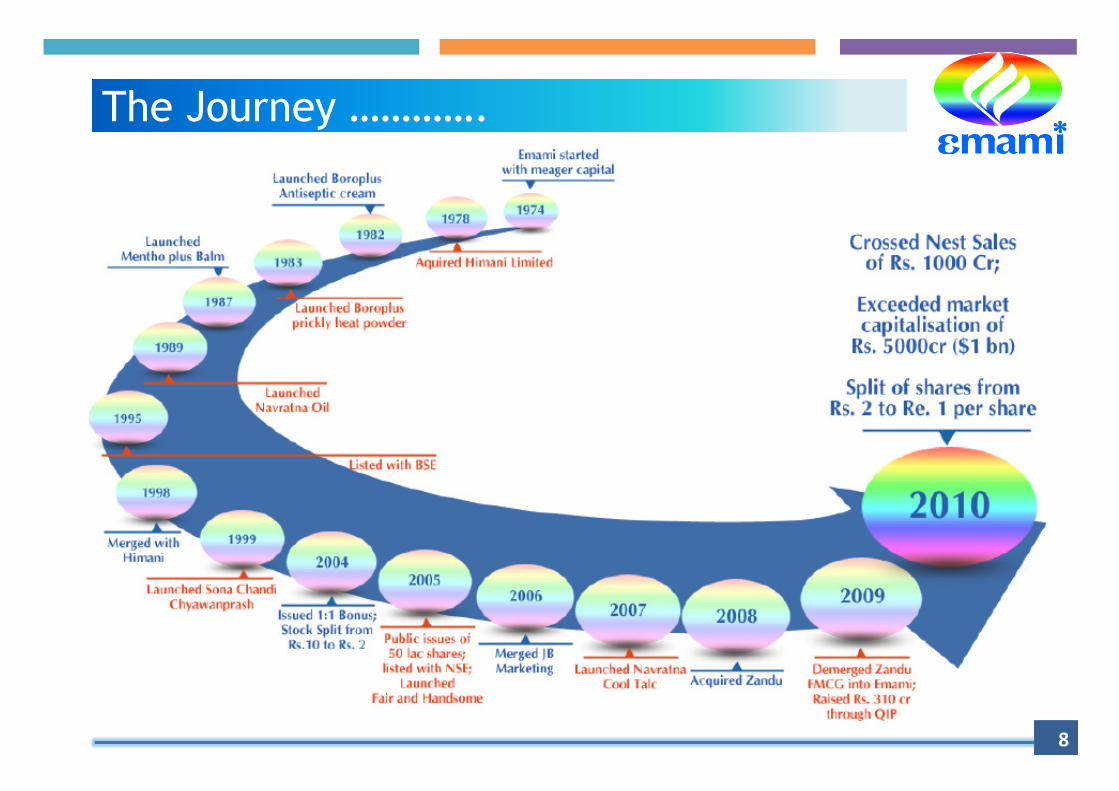
The Journey ………….
8

� Aggressive promotion through celebrities� Expand distribution – reach rural � Differentiated ‘Value For Money’ products� Product innovation to enter new categories� Brand extensions� Entry in new geographies – drive exports� Leveraging existing distribution network
� Aggressive promotion through celebrities� Expand distribution – reach rural � Differentiated ‘Value For Money’ products� Product innovation to enter new categories� Brand extensions� Entry in new geographies – drive exports� Leveraging existing distribution network
Drive Revenue
� Benchmark A&P spends to industry� Stabilization of new launches and brands� Continuous Cost control initiatives� Fiscal efficiency for manufacturing facilities in
tax exempt zones
� Benchmark A&P spends to industry� Stabilization of new launches and brands� Continuous Cost control initiatives� Fiscal efficiency for manufacturing facilities in
tax exempt zones
Grow Net profit
Foray into new categories and International business
to drive revenue growth
Strategy
9

Power Brand Segment
Market Size
(INR in Millions)
Market Size
(USD in Millions)
Emami’s Market Share in %
2005 2010
Navratna Oil Cooling oil 5,800 129 47 49
Boroplus Cream Antiseptic Cr. 2,600 58 65 75
Zandu & MenthoPlus Balm
Balm 4,900 109 13* 57
Fair & Handsome Men's fairness cream
2,100 47 -- 60
Boroplus Powder Prickly heat powder
3,150 70 16 10
Navratna Cool Talc Cool Talc 3,150 70 -- 13
Fast Relief Pain reliever 4,000 89 7 9
Sona Chandi & Zandu
Chyawanprash 2,100 47 10# 15
Source: AC Nielsen * Only Menthoplus
# Only Sona Chandi
10
Snapshot of Power Brands
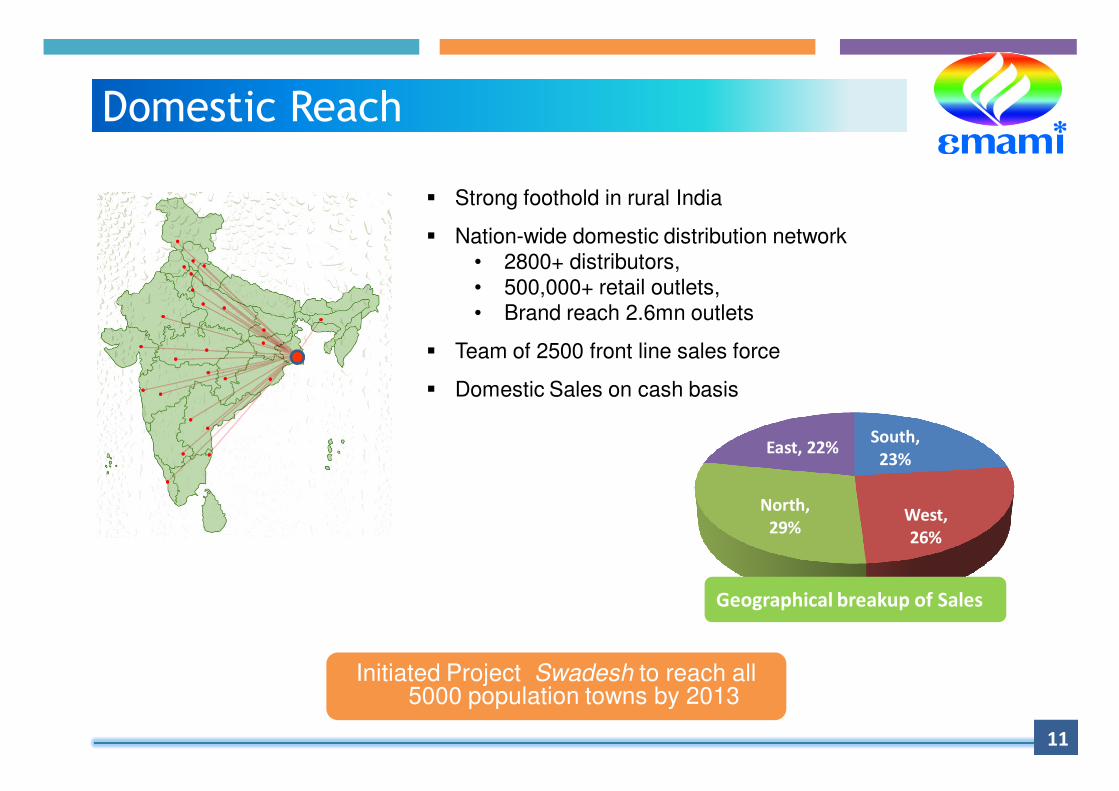
� Strong foothold in rural India
� Nation-wide domestic distribution network • 2800+ distributors, • 500,000+ retail outlets, • Brand reach 2.6mn outlets
� Team of 2500 front line sales force
� Domestic Sales on cash basis
11
Domestic Reach
South,
23%
West,
26%
North,
29%
East, 22%
Geographical breakup of Sales
Initiated Project Swadesh to reach all 5000 population towns by 2013
12
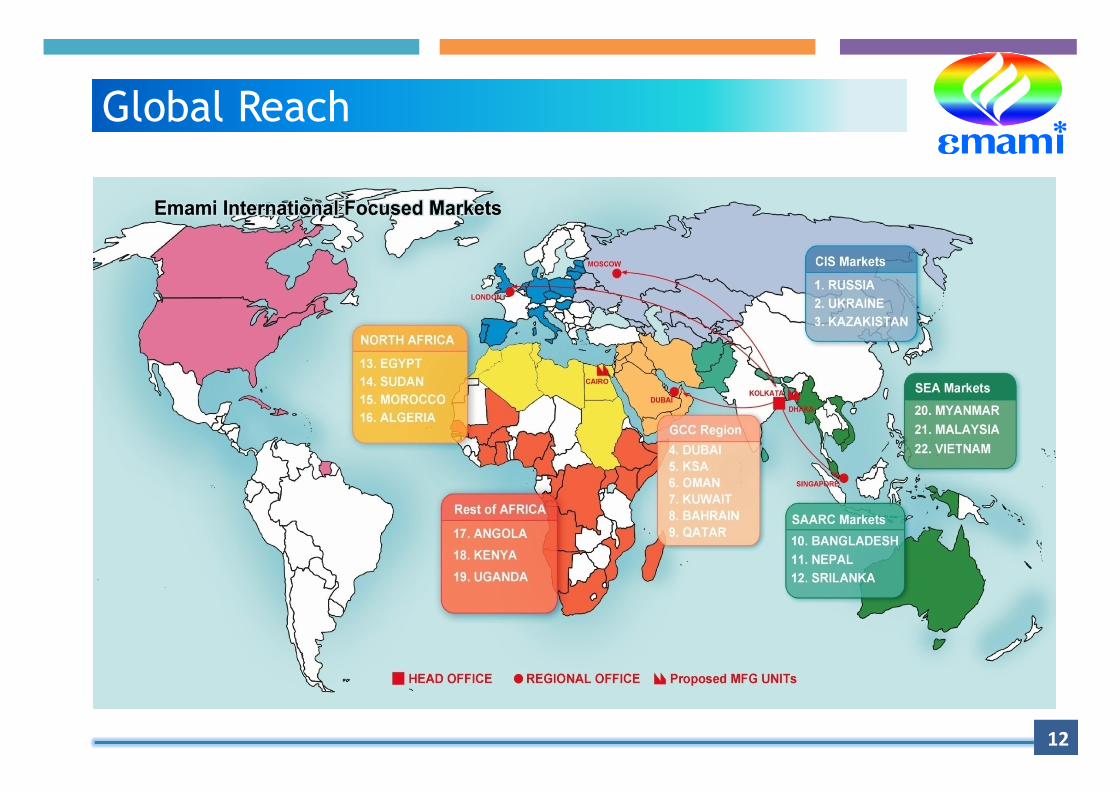
Global Reach
13
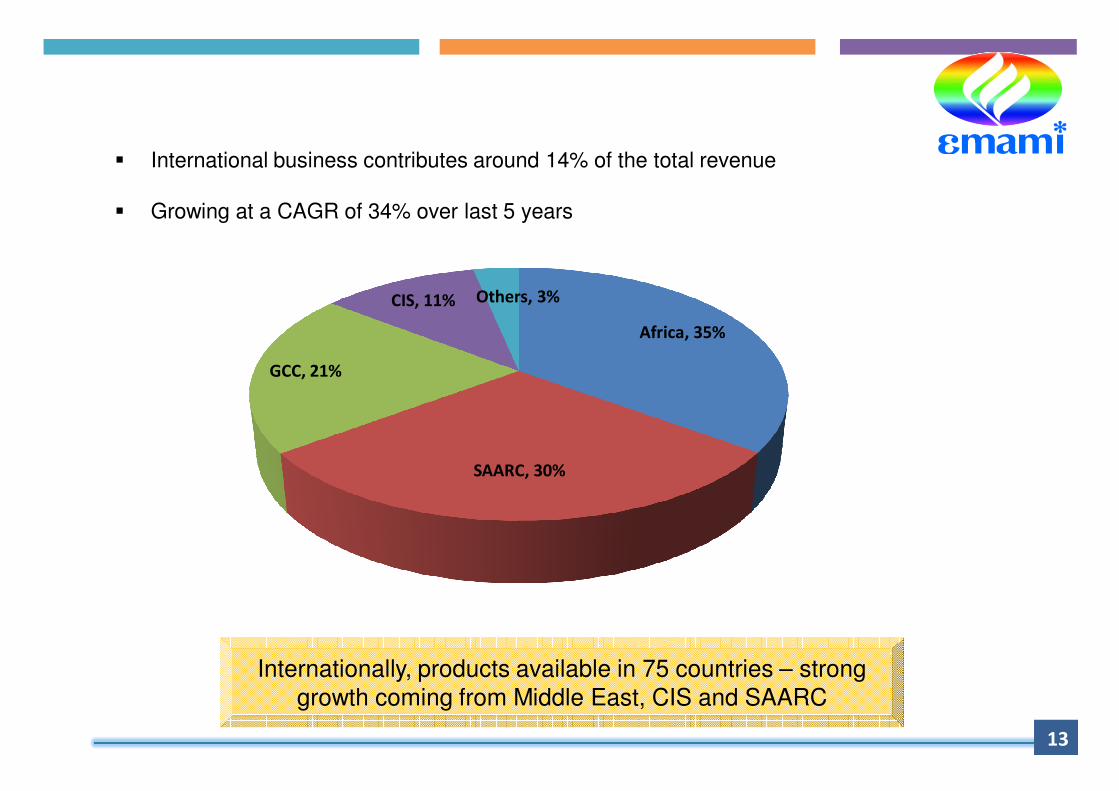
� International business contributes around 14% of the total revenue
� Growing at a CAGR of 34% over last 5 years
Internationally, products available in 75 countries – strong growth coming from Middle East, CIS and SAARC
Africa, 35%
SAARC, 30%
GCC, 21%
CIS, 11% Others, 3%
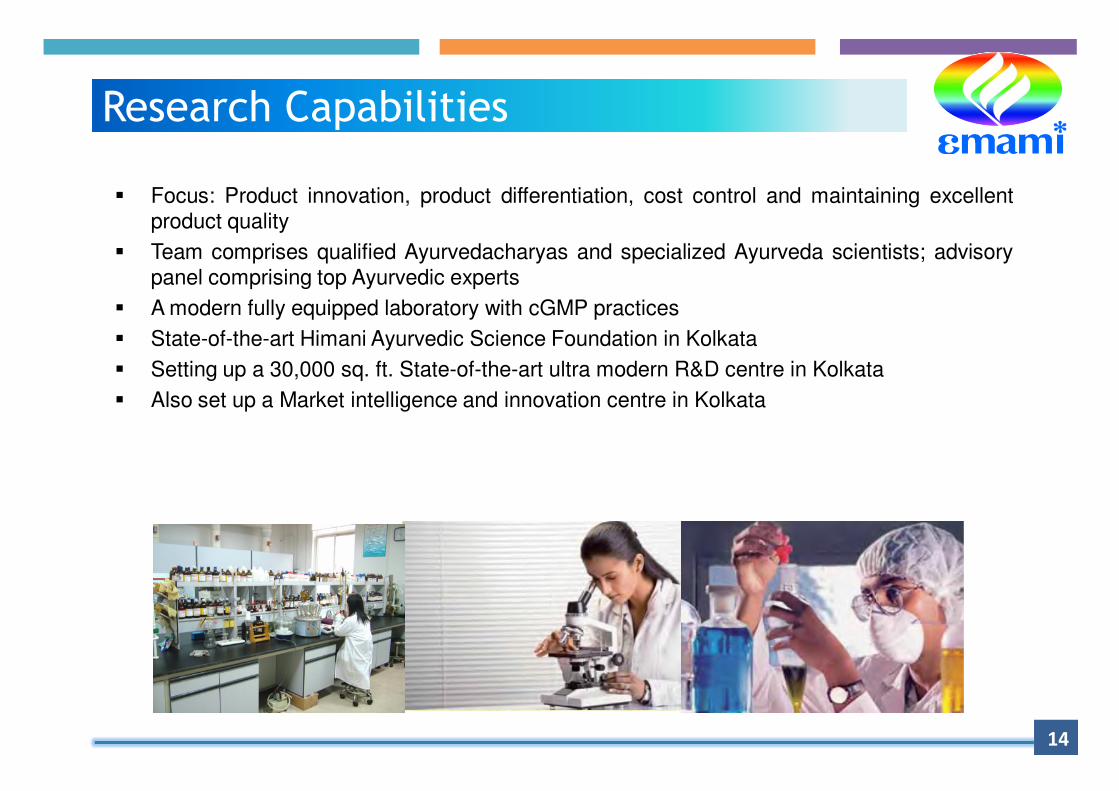
� Focus: Product innovation, product differentiation, cost control and maintaining excellentproduct quality
� Team comprises qualified Ayurvedacharyas and specialized Ayurveda scientists; advisorypanel comprising top Ayurvedic experts
� A modern fully equipped laboratory with cGMP practices
� State-of-the-art Himani Ayurvedic Science Foundation in Kolkata
� Setting up a 30,000 sq. ft. State-of-the-art ultra modern R&D centre in Kolkata
� Also set up a Market intelligence and innovation centre in Kolkata
14
Research Capabilities

Celebrity Endorsements
15

� The new launches like Navratna Cool Talc, Boroplus Body Lotion, Navratna Extra ThandaOil, Malai Kesar Cold Cream and Vasocare Petroleum Jelly are performing very well
� Launched Boroplus Healthy and Fair Winter Cream last winter, Navratna Coconut Cool Oiland Boroplus Sun Protection Lotion in this year
� Continue to launch 2-3 innovative products / brand extensions every year
� Ayurvedic healthcare, Hair care and Skin care will be the focus area
16
New Launches
Strong pipeline of new products
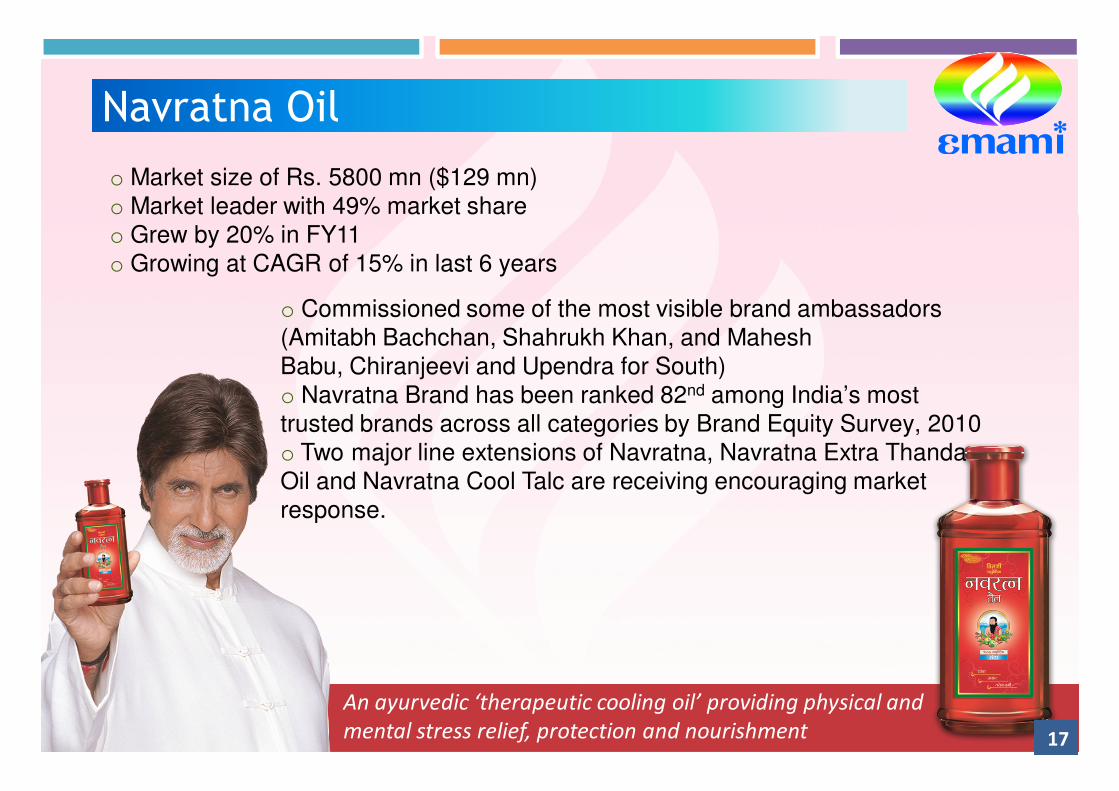
o Market size of Rs. 5800 mn ($129 mn)o Market leader with 49% market shareo Grew by 20% in FY11o Growing at CAGR of 15% in last 6 years
An ayurvedic ‘therapeutic cooling oil’ providing physical and
mental stress relief, protection and nourishment
o Commissioned some of the most visible brand ambassadors (Amitabh Bachchan, Shahrukh Khan, and Mahesh Babu, Chiranjeevi and Upendra for South)o Navratna Brand has been ranked 82nd among India’s most trusted brands across all categories by Brand Equity Survey, 2010o Two major line extensions of Navratna, Navratna Extra ThandaOil and Navratna Cool Talc are receiving encouraging market response.
17
Navratna Oil

An ayurvedic antiseptic and protective cream ideal for harsh winter conditions and minor skin problems (chapped, cracked and dry skin)
o Market size of Rs. 2600 mn ($58 mn)o Leader in the antiseptic cream market with a 75% share o Largest selling antiseptic cream not only in India but also in
Ukraine, Russia and Nepal
o Sales grew by 9 in FY11o Growing at CAGR of 17% in last 6 yearso Boroplus Brand improved its rating to 46th from 77th last year, among India’s most trusted brands across all categories by Brand Equity Survey, 2010o Launched brand extension – Body Lotion and Healthy and Fair winter cream
18
Boroplus Antiseptic Cream

o Launched in October 2005; first fairness cream for men in India
o Market size at Rs. 2100 mn ($47 mn) with a market share of 60%
o Sales grew by 11% in FY11
o Launched 7ml and 15ml LUPs.
Five power formula contains double-strength peptide complex (patented in US) for tougher male skin 19
Fair & Handsome Fairness Cream

o Market size of Rs. 4900 mn ($109 mn)
oZandu, a dominant player in pain management category
oSales grew by 22% in FY11
o Market share of 57%
o CAGR of 20% over the last 6 years in Menthoplus
Relief from headaches, body aches and cold20
Zandu & Menthoplus Balm

o Market size of Rs. 2100 mn ($47 mn)
o Market share of 15%
Immunity builder - Surakshit tan
aur tez dimag
oGrew by 12% in FY11
oSona Chandi endorsed by Shah Rukh Khan, Sunny Deol and Dharmendra.
21
Zandu & Sona Chandi Chyawanprash
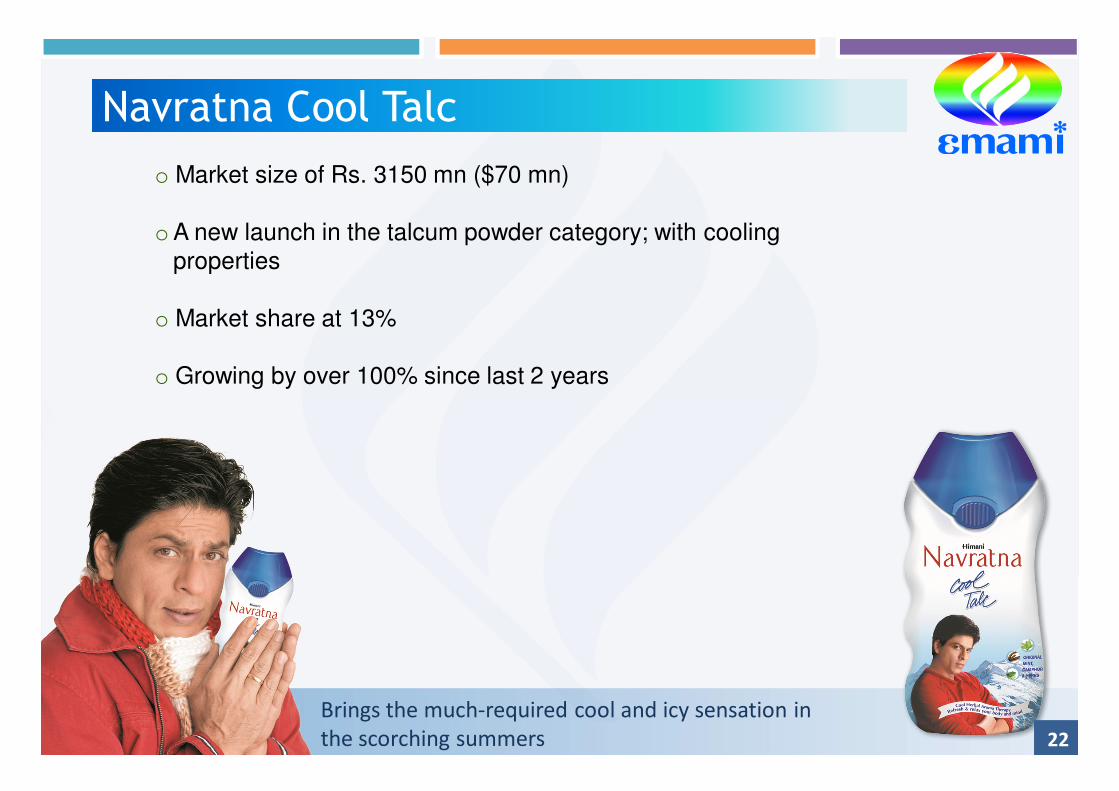
Navratna Cool Talc
o Market size of Rs. 3150 mn ($70 mn)
oA new launch in the talcum powder category; with cooling properties
o Market share at 13%
o Growing by over 100% since last 2 years
Brings the much-required cool and icy sensation in
the scorching summers 22

o Market size of Rs. 4000 mn ($89 mn)
o Market share of 9%
o Grown at a CAGR of 18% in last 6 years.
Provides instant relief from backache, muscle
pain and other joint pains
oBrand revamped with enhanced formulation in new packaging as Himani Fast Relief ultra fast formula
o Launched Fast Relief Max – in cream based not sticky format
oAmitabh Bachchan is the Brand Ambassador
oWidely accepted in the states of Delhi, UP and Punjab
23
Fast Relief

� 7 manufacturing facilities; 2 in Guwahati and 1 in Pantnagar, Uttaranchal enjoying fiscalbenefits
� Most of the facilities are cGMP and ISO 9000 compliant.
� Units follow highest standards of safety and environment protection
24
Operations

As at March 31, 2011
25
Summarised Balance Sheet
LIABILITIES Rs. in
Millions
USD in
Millions
ASSETS Rs. in
Millions
USD in
Millions
Share Capital & Reserves 6,898.5 153.3 Net Fixed Assets 2,257.7 50.2
Deferred Tax 137.0 3.0 Goodwill 2,651.6 58.9
Loan Funds 2,293.7 51.0 Investments 66.2 1.5
Less : Cash & Bank Bal (2,105.0) (46.8) Net Current Assets 2,248.7 50.0
7,224.2 160.5 7,224.2 160.5

Consolidated
Growing at CAGR of 27% over last 5 years
In Millions
26
Net SalesG
row
th
Aggressive
Growth
continues
4,269
5,217 5,881
7,662
10,380
12,778
34.2%22.2%
12.7%
30.3%35.5%
23.1%
-
2,000
4,000
6,000
8,000
10,000
12,000
14,000
2005-06 2006-07 2007-08 2008-09 2009-10 2010-11
$94.9
$115.9$130.7
$170.3$230.7
$284.0

Consolidated
Growing at CAGR of 36% over last 5 years
In Millions
27
Gro
wth
PAT
494
662
902 919
1,697
2,287
66.3%
34.0% 36.2%
1.9%
84.8%
34.8%
-
500
1,000
1,500
2,000
2,500
2005-06 2006-07 2007-08 2008-09 2009-10 2010-11
$11.0
$14.7
$20.4$20.0
$37.7
$50.8
In Millions
28
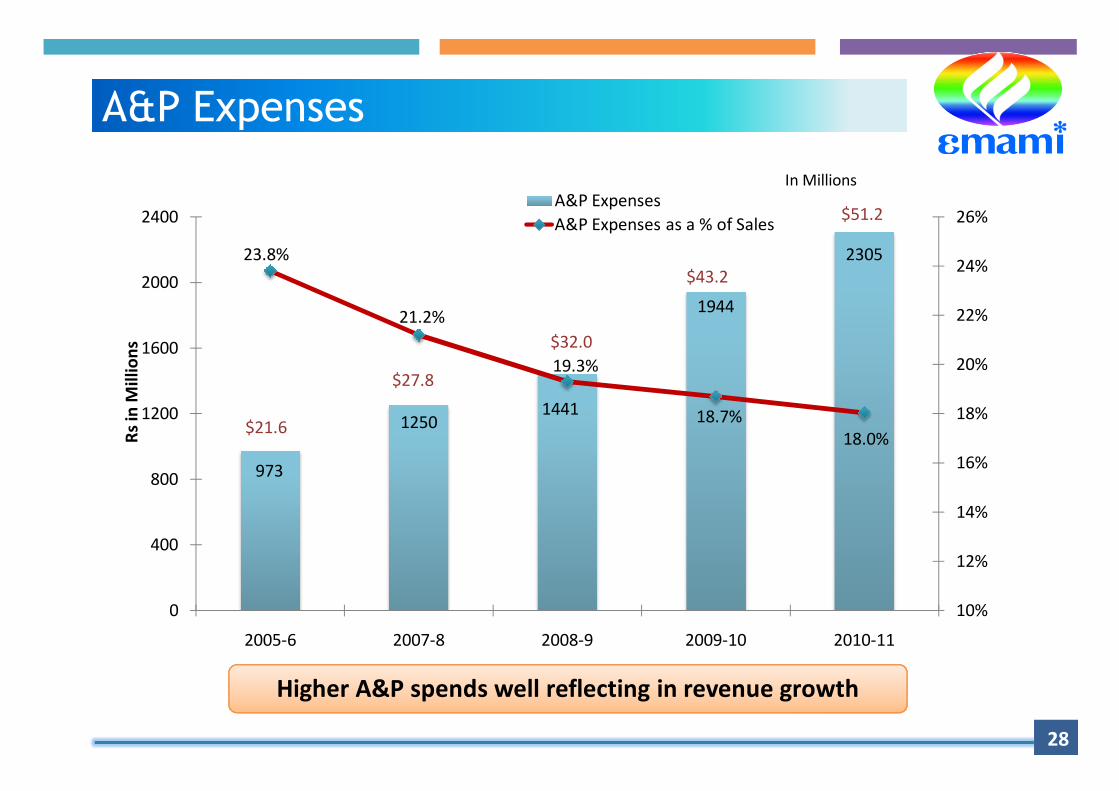
A&P Expenses
Higher A&P spends well reflecting in revenue growth
973
12501441
1944
230523.8%
21.2%
19.3%
18.7%
18.0%
10%
12%
14%
16%
18%
20%
22%
24%
26%
0
400
800
1200
1600
2000
2400
2005-6 2007-8 2008-9 2009-10 2010-11
Rs
in M
illi
on
s
A&P Expenses
A&P Expenses as a % of Sales
$21.6
$27.8
$32.0
$43.2
$51.2

Div
ide
nd
(%
) Pa
y-O
ut (%
)
29
Dividend
Stock Split from Rs. 2/- per share to Rs. 1/- per share in FY11
200%
225%
225%
300%
350%
43.1%
36.3%
43.4%
31.3%
27.0%
10%
15%
20%
25%
30%
35%
40%
45%
50%
0%
50%
100%
150%
200%
250%
300%
350%
2006-07 2007-08 2008-09 2009-10 2010-11
Dividend % Pay-Out %
Ma
rke
t C
ap
(R
s. i
n M
n)
30
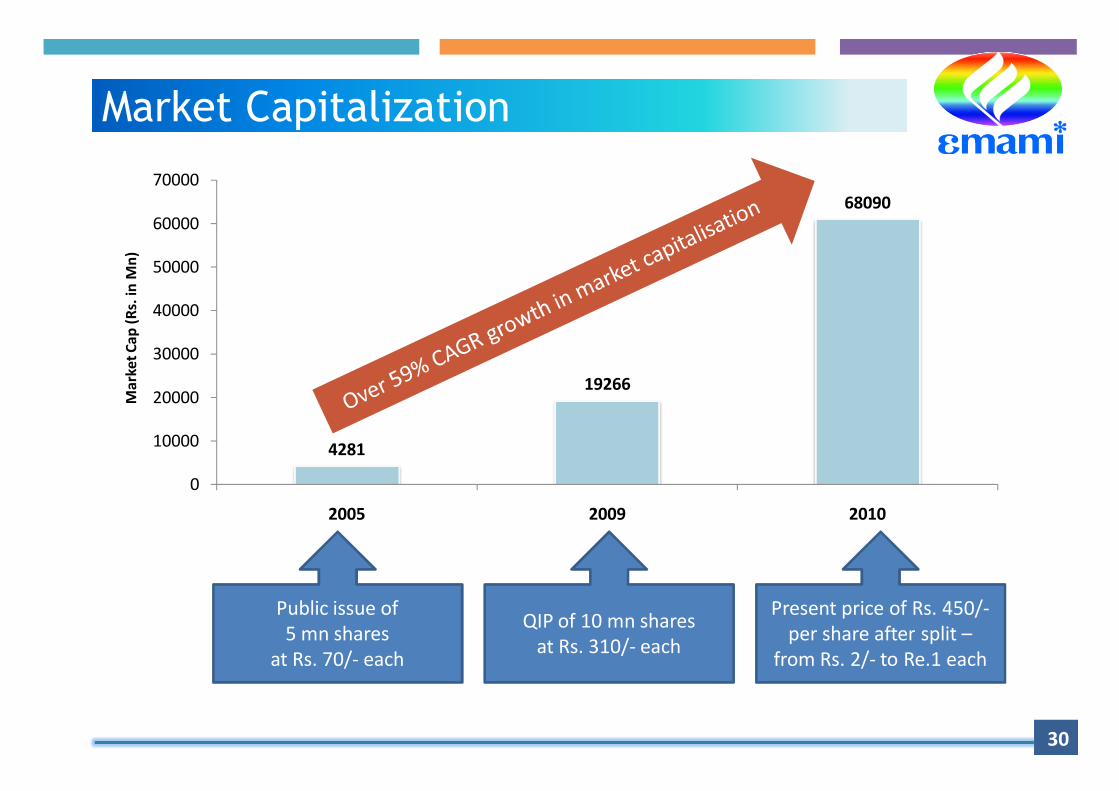
Market Capitalization
4281
19266
68090
0
10000
20000
30000
40000
50000
60000
70000
2005 2009 2010
Public issue of
5 mn shares
at Rs. 70/- each
QIP of 10 mn shares
at Rs. 310/- each
Present price of Rs. 450/-
per share after split –
from Rs. 2/- to Re.1 each

Q1FY12 Update
2420
2999
0
500
1000
1500
2000
2500
3000
3500
Q1FY11 Q1FY12
+24.0%
353
415
0
50
100
150
200
250
300
350
400
450
Q1FY11 Q1FY12
+17.7%
SALES PAT
31

Q1FY12 Results
32
Particulars Q1FY12 % of
Sales
Q1FY11 % of
Sales
Growth
%
FY11 % of
Sales
Net Sales 2,999.1 100% 2,419.5 100% 24.0% 12,777.8 100%
Other Income 31.1 1.0% 8.9 0.4% 249.4% 185.1 1.4%
Materials Cost 1,347.0 44.9% 931.0 38.5% 44.7% 5,231.8 40.9%
A&P 585.7 19.6% 544.1 22.5% 7.6% 2,305.0 18.0%
Staff Cost 203.1 6.8% 163.5 6.8% 24.2% 737.1 5.8%
Admn & Other Exp 457.0 15.2% 376.2 15.5% 21.5% 1,969.5 15.4%
EBITDA 437.4 14.6% 413.6 17.1% 5.8% 2,719.5 21.3%
Interest (Net) (33.2) -1.1% (12.7) -0.5% 161.4% (111.7) -0.9%
Depreciation 297.5 9.9% 291.5 12.0% 2.1% 1,160.9 9.1%
Transfer from General Reserve (255.2) -8.5% (255.2) -10.5% 0.0% (1,020.9) -8.0%
PBT 428.3 14.3% 390.0 16.1% 9.8% 2,691.2 21.1%
Tax 13.3 0.4% 37.5 1.5% -64.5% 404.1 3.2%
PAT 415.0 13.8% 352.5 14.6% 17.7% 2,287.1 17.9%
EPS - Rs. 2.7 2.3 17.7% 15.1
Rs. in Millions
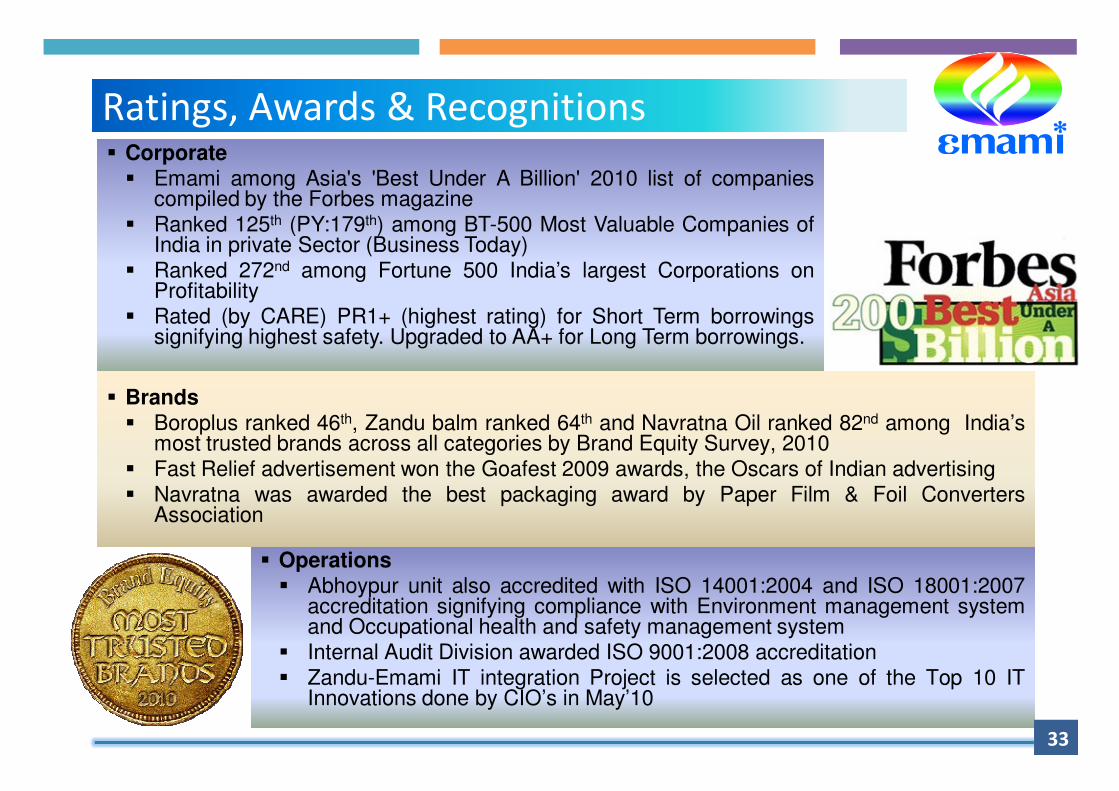
� Corporate� Emami among Asia's 'Best Under A Billion' 2010 list of companies
compiled by the Forbes magazine� Ranked 125th (PY:179th) among BT-500 Most Valuable Companies of
India in private Sector (Business Today)� Ranked 272nd among Fortune 500 India’s largest Corporations on
Profitability� Rated (by CARE) PR1+ (highest rating) for Short Term borrowings
signifying highest safety. Upgraded to AA+ for Long Term borrowings.
� Brands� Boroplus ranked 46th, Zandu balm ranked 64th and Navratna Oil ranked 82nd among India’s
most trusted brands across all categories by Brand Equity Survey, 2010� Fast Relief advertisement won the Goafest 2009 awards, the Oscars of Indian advertising� Navratna was awarded the best packaging award by Paper Film & Foil Converters
Association
� Operations� Abhoypur unit also accredited with ISO 14001:2004 and ISO 18001:2007
accreditation signifying compliance with Environment management systemand Occupational health and safety management system
� Internal Audit Division awarded ISO 9001:2008 accreditation� Zandu-Emami IT integration Project is selected as one of the Top 10 IT
Innovations done by CIO’s in May’10
33
Ratings, Awards & Recognitions

34
� Received INDIASTAR 2010 NATIONAL AWARDS for excellence
in packaging in :
- Emami VasoCare Petroleum Jelly in In-Built Flip Top Cap
- Zandu Balm 10 G Pack in Bi-Colour Container and Cap
- Emami 5-in-1 shampoo Sachet
- Emami Hairlife Single Piece Carton
� Individual Recognition
� Mr. Naresh Bhansali, CEO-Finance, Strategy and Business Development, has beenawarded CFO 100 Roll of Honour – an award that recognises the top 100 senior financeprofessionals in India who have made a difference with their acumen, who brilliantlymanage risk, construct a safety net and yet drive growth.
� Mr. Vikram Saxena, AVP – IT, has been consistent
winner of CIO-100 since last 4 years
� CII awarded 1st Prize for sustained level of High
Productivity in Eastern Region to Amingaon unit.
� One of the fastest growing FMCG company
� Niche category player + innovator – in Therapeutic and Ayurvedic segment - strong entrybarriers for the competition
� Key brands are strong market leaders in their respective categories
� With the acquisition of Zandu, we have one the strongest Ayurvedic Brand in our portfolio
� Bigger basket of power brands and entry in new segments
� Over 80% of the business comes from Wellness categories.
� Focus on each Brand with patience and continuous investment.
� Superior gross margins in the industry – EBITDA margin before A & P at 39%
� Production from tax free zones
35
Key Investment Highlights
Thank YouThank YouThank YouThank You


