45
Your worldwide training partner of choice Investor Presentation November 2017

Your worldwide
training partner
of choice
Investor PresentationNovember 2017

CAE Inc. Proprietary Information and/or Confidential
CAUTION REGARDING FORWARD LOOKING STATEMENTS
This document includes forward-looking statements about our activities, events and developments that we expect to or anticipate may occur in the
future including, for example, statements about our vision, strategies, market trends and outlook, future revenues, capital spending, expansions and
new initiatives, financial obligations and expected sales. Forward-looking statements normally contain words like believe, expect, anticipate, plan,
intend, continue, estimate, may, will, should, strategy, future and similar expressions. By their nature, forward-looking statements require us to make
assumptions and are subject to inherent risks and uncertainties associated with our business which may cause actual results in future periods to
differ materially from results indicated in forward-looking statements. While these statements are based on management’s expectations and
assumptions regarding historical trends, current conditions and expected future developments, as well as other factors that we believe are
reasonable and appropriate in the circumstances, readers are cautioned not to place undue reliance on these forward-looking statements as there
is a risk that they may not be accurate.
You will find more information in the Business risk and uncertainties section of our second quarter fiscal 2018 MD&A and in our annual information
form for the year ended March 31, 2017. These documents have been filed with the Canadian securities commissions and are available on our
website (www.cae.com) and on SEDAR (www.sedar.com). They have also been filed with the U.S. Securities and Exchange Commission under
Form 40-F and are available on EDGAR (www.sec.gov). Forward-looking statements in this document represent our expectations as of November
10, 2017, and, accordingly, are subject to change after this date. We caution readers that the risks described are not necessarily the only ones we
face; additional risks and uncertainties that are presently unknown to us or that we may currently deem immaterial may adversely affect our
business. Additionally, differences could arise because of events that are announced or completed after the date of this document, including
mergers, acquisitions, other business combinations and divestitures.
Except as required by law, we disclaim any intention or obligation to update or revise any forward-looking statements whether as a result of new
information, future events or otherwise. The forward-looking information and statements contained in this report are expressly qualified by this
cautionary statement.
2

3

CAE Inc. Proprietary Information and/or Confidential
CAE AT A GLANCE
4
Leader in three business segments
▪ Commercial Aviation
▪ Business Aviation
▪ Training equipment
▪ Ab Initio Training
▪ Crew sourcing
▪ Training Systems Integrator
▪ Virtual and live training
▪ Training equipment
▪ Patient simulation
▪ Imaging/Interventional simulation
▪ Courseware & Audiovisual
solutions
▪ Turnkey training solutions
Civil Aviation Training Solutions Defence and Security Healthcare

CAE Inc. Proprietary Information and/or Confidential
Diversified base of business with a high
degree of recurring revenue
CAE AT A GLANCE
5
38
4
58%
Defence and Security
Civil Aviation Training Solutions
Healthcare
%
36
28
36
Asia
Australia
Canada
Central and
South America
Middle East
U.S.A.
Europe
Total FY17 revenue: $2.7B
40
60%
Products
Services
CAE Inc. Proprietary Information and/or Confidential
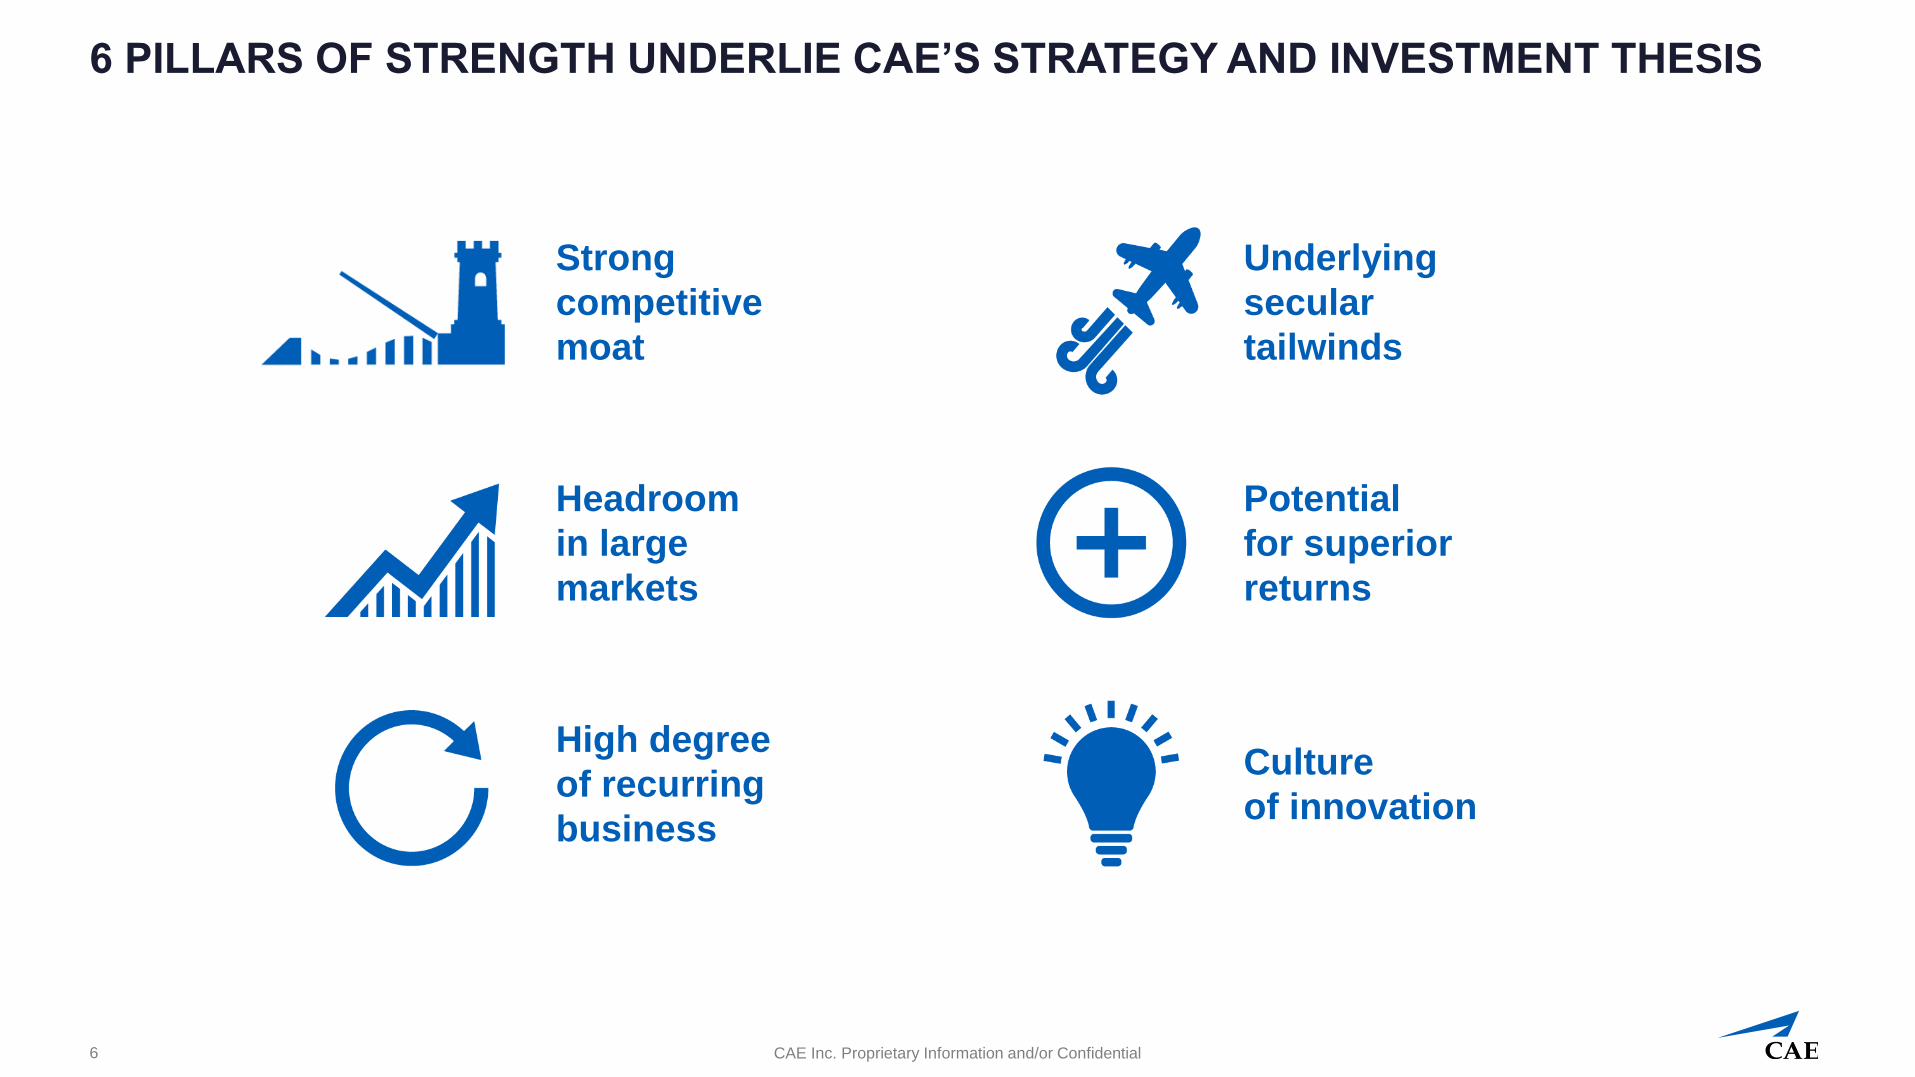
6 PILLARS OF STRENGTH UNDERLIE CAE’S STRATEGY AND INVESTMENT THESIS
6
Strong
competitive
moat
Headroom
in large
markets
High degree
of recurring
business
Underlying
secular
tailwinds
Potential
for superior
returns
Culture
of innovation
CAE Inc. Proprietary Information and/or Confidential
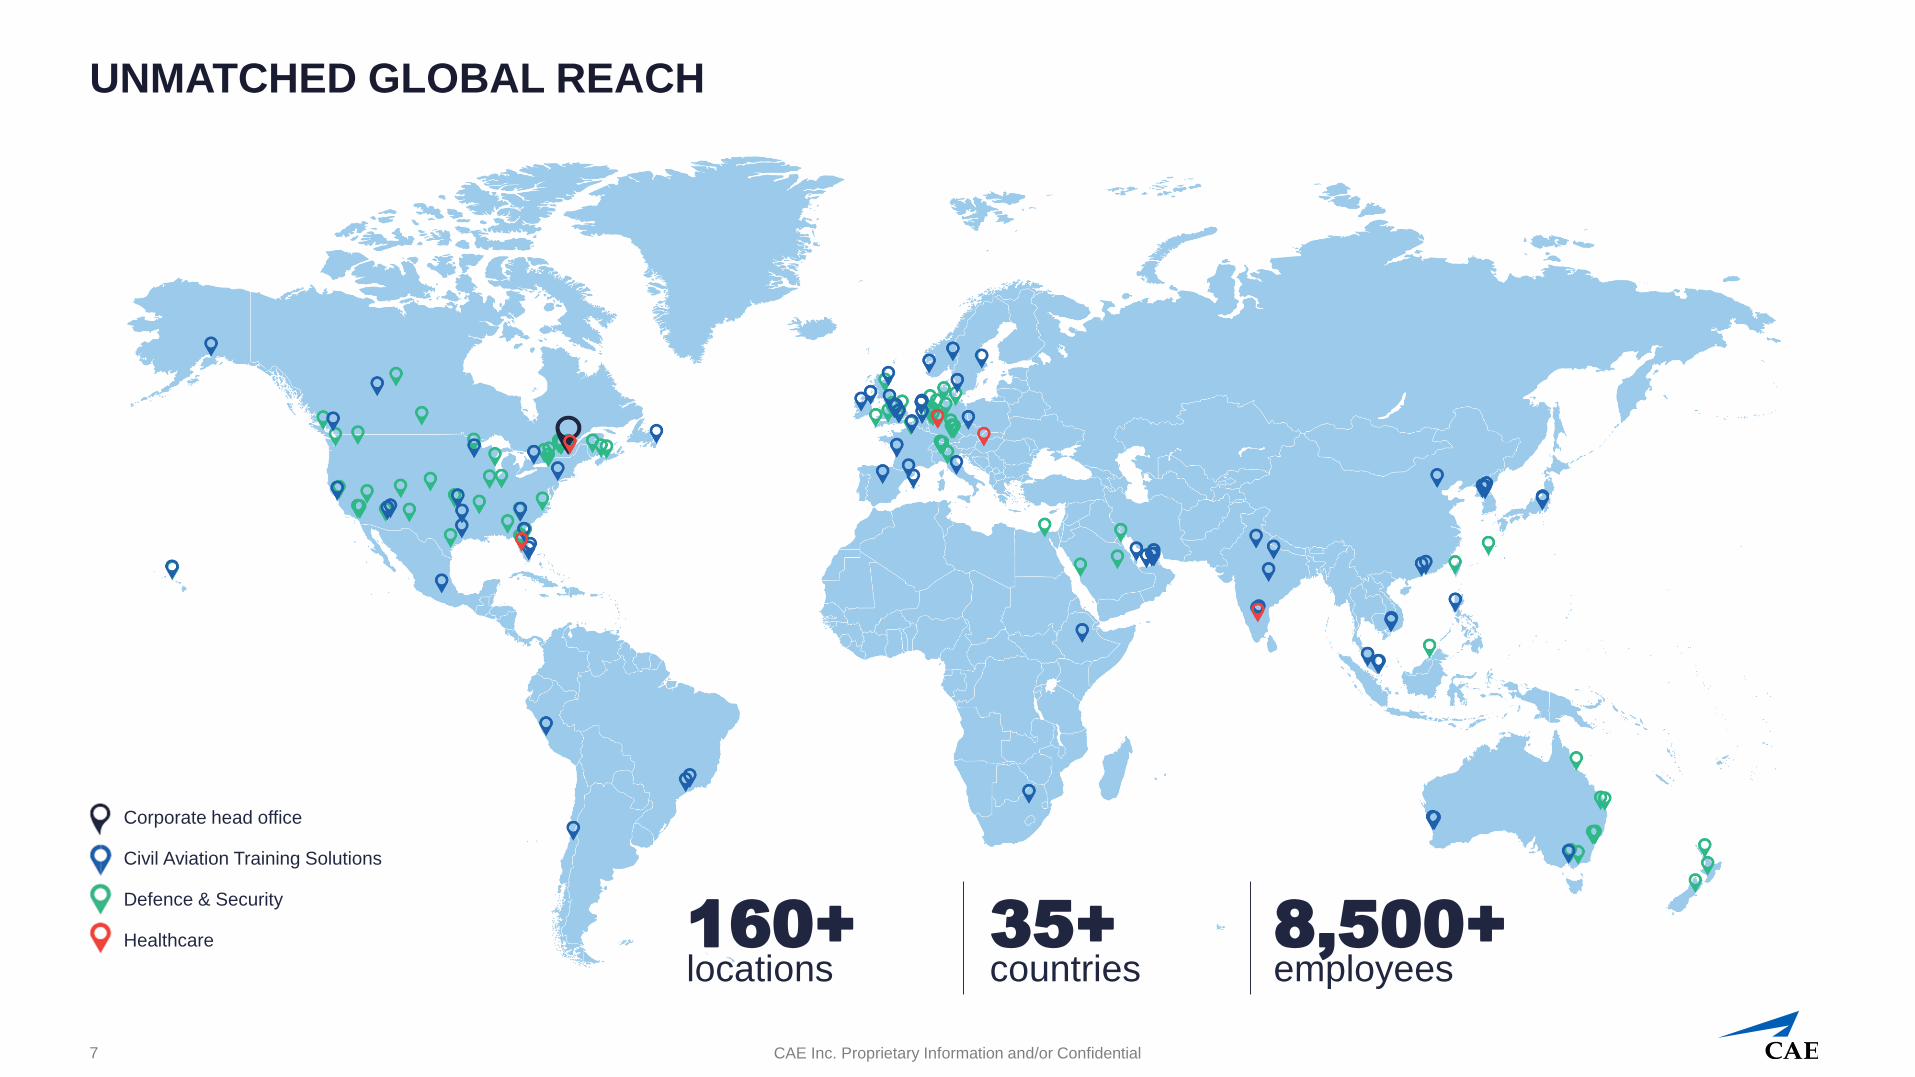
UNMATCHED GLOBAL REACH
7
locations160+
countries35+
employees8,500+
Corporate head office
Civil Aviation Training Solutions
Defence & Security
Healthcare

CAE Inc. Proprietary Information and/or Confidential
FY2017 PERFORMANCE HIGHLIGHTS
8
1. Before specific items
2. Closing share price on March 31 2016 and 2017
3. Combining dividends and share buy-backs
Note: EPS from continuing operation before specific items, backlog, return of Capital employed and free cash flow are all non-GAAP financial measures and are defined in CAE’s FY2017 Management discussion and analysis
+20%
Record
Earnings
Per Share from
continuing
operations1
$2.7B
Record
Revenue
Share Price
Appreciation2
$0.86
$1.03
FY2016 FY2017
$15.02
$20.32
FY2016 FY2017Record Backlog
$6.37B
$7.53B
FY2016 FY2017
Higher Return
on Capital
Employed
Annual Free
Cash Flow
Strong Financial
Position – Net
Debt-to-Total
Capital Ratio
10.6%11.2%
FY2016 FY2017
28.9%26.5%
FY2016 FY2017
Higher Return
to Shareholders3
$87.8M
$126.3M
FY2016 FY2017
$247.7M
$327.9M
FY2016 FY2017
+35% +18%
11.2% 26.5% +44%+32%
$2.5B$2.7B
FY2016 FY2017
Your worldwide
training partner
of choice
Civil Aviation Training Solutions
CAE Inc. Proprietary Information and/or Confidential
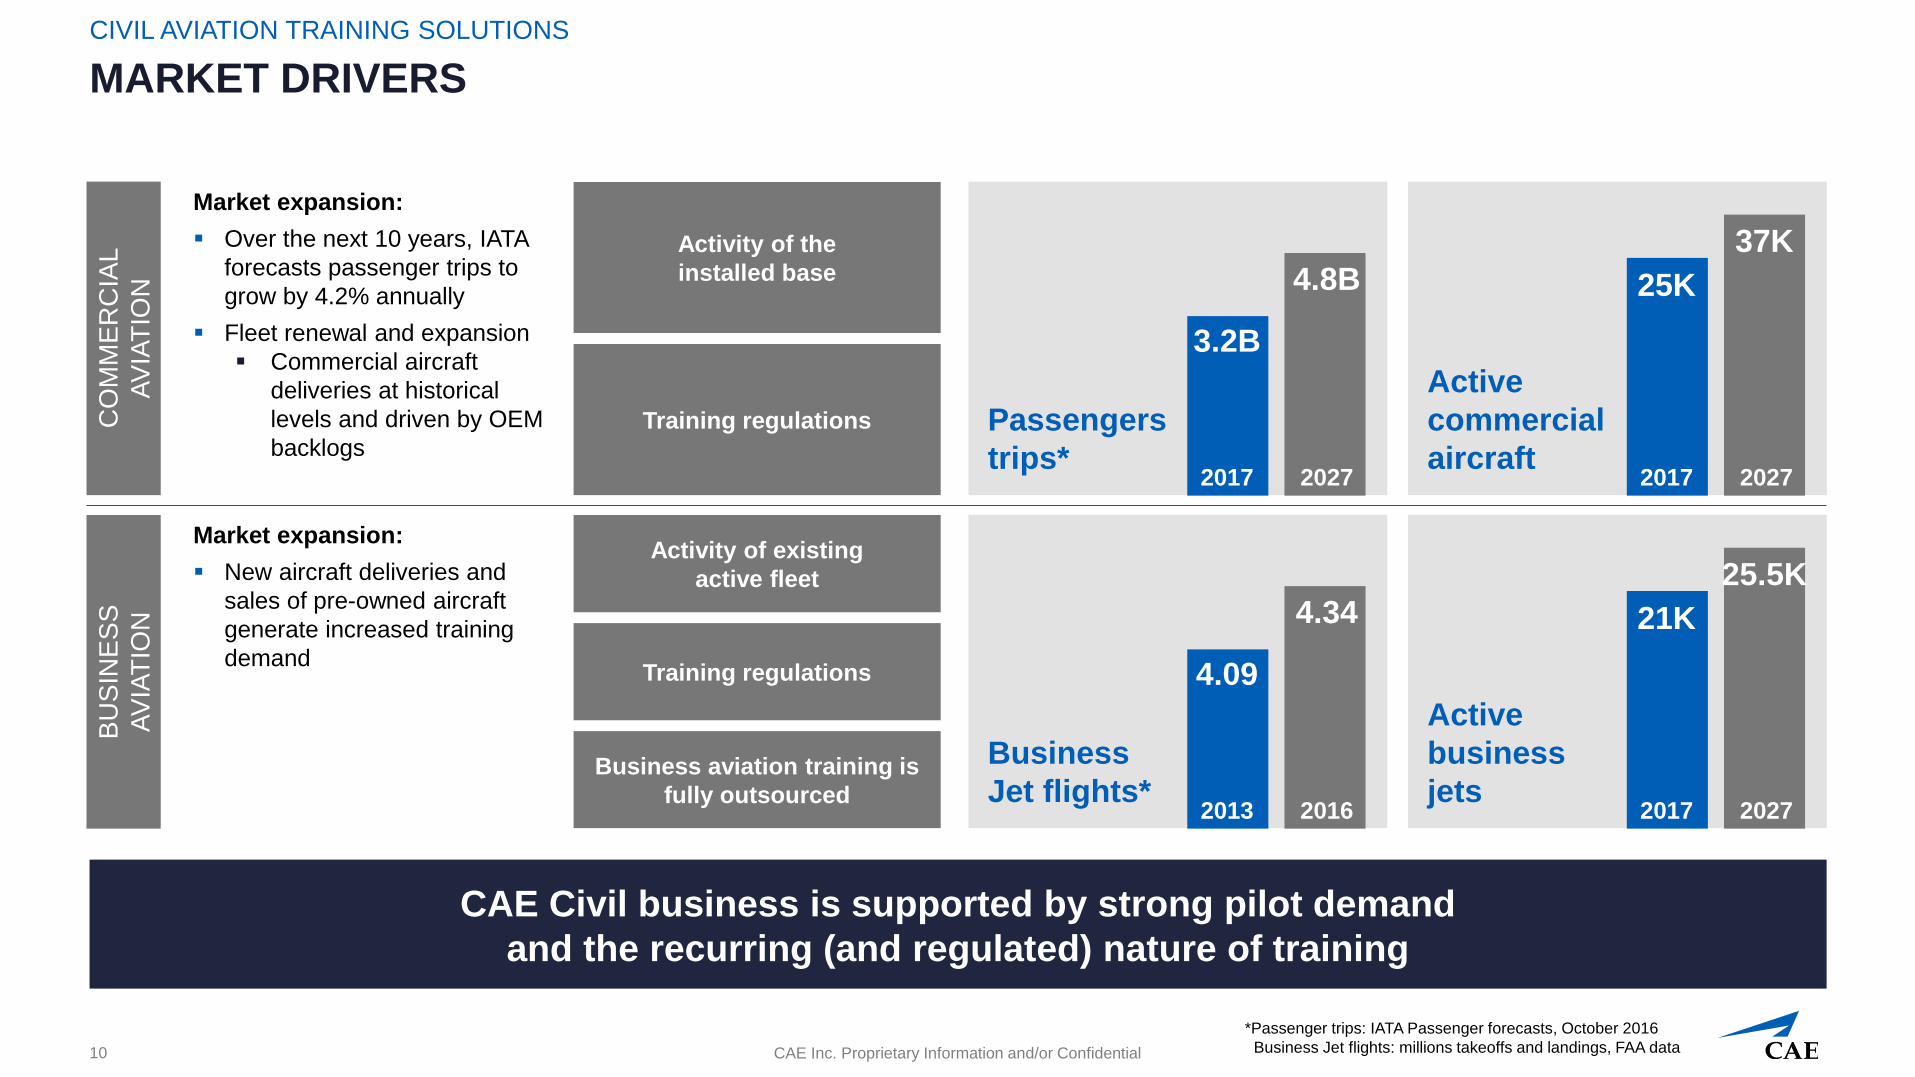
Business
Jet flights*
4.09
4.34
2013 2016
Active
business
jets
21K
25.5K
2017 2027
MARKET DRIVERS
CIVIL AVIATION TRAINING SOLUTIONS
CAE Civil business is supported by strong pilot demand
and the recurring (and regulated) nature of training
10
CO
MM
ER
CIA
L
AV
IAT
ION
*Passenger trips: IATA Passenger forecasts, October 2016
Business Jet flights: millions takeoffs and landings, FAA data
Passengers
trips*
3.2B
4.8B
2017 2027
Active
commercial
aircraft
25K
37K
2017 2027
BU
SIN
ES
S
AV
IAT
ION
Market expansion:
▪ Over the next 10 years, IATA
forecasts passenger trips to
grow by 4.2% annually
▪ Fleet renewal and expansion
▪ Commercial aircraft
deliveries at historical
levels and driven by OEM
backlogs
Activity of the
installed base
Training regulations
Market expansion:
▪ New aircraft deliveries and
sales of pre-owned aircraft
generate increased training
demandTraining regulations
Business aviation training is
fully outsourced
Activity of existing
active fleet

CAE Inc. Proprietary Information and/or Confidential
HEADROOM IN A LARGE MARKET
CIVIL AVIATION TRAINING SOLUTIONS
CAE has potential to increase share in a large market
11
Civil Training Market
$3.5B
33% CAE
CAE Inc. Proprietary Information and/or Confidential
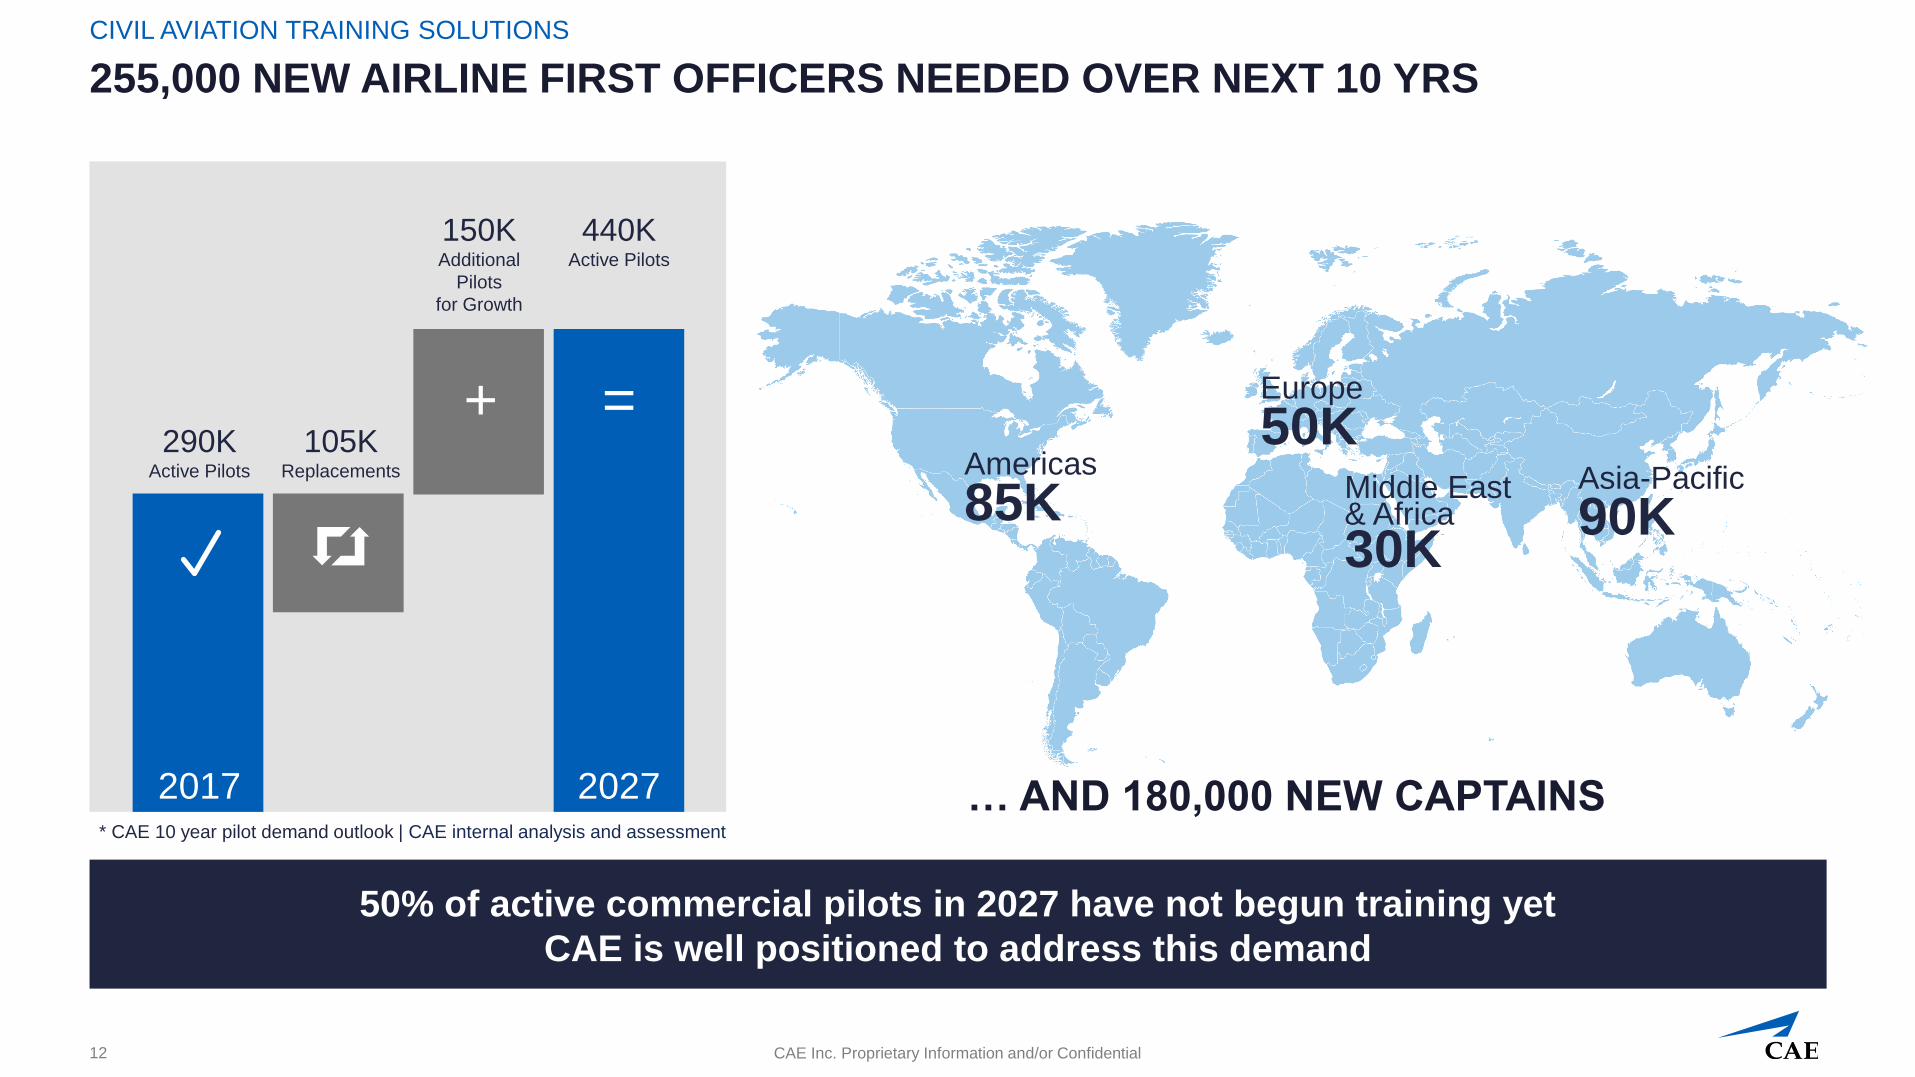
255,000 NEW AIRLINE FIRST OFFICERS NEEDED OVER NEXT 10 YRS
CIVIL AVIATION TRAINING SOLUTIONS
50% of active commercial pilots in 2027 have not begun training yet
CAE is well positioned to address this demand
12
* CAE 10 year pilot demand outlook | CAE internal analysis and assessment
… AND 180,000 NEW CAPTAINS2017 2027
290KActive Pilots
105KReplacements
150KAdditional
Pilots
for Growth
440KActive Pilots
+ =Americas
85K
Europe
50KMiddle East & Africa
30K
Asia-Pacific
90K
CAE Inc. Proprietary Information and/or Confidential
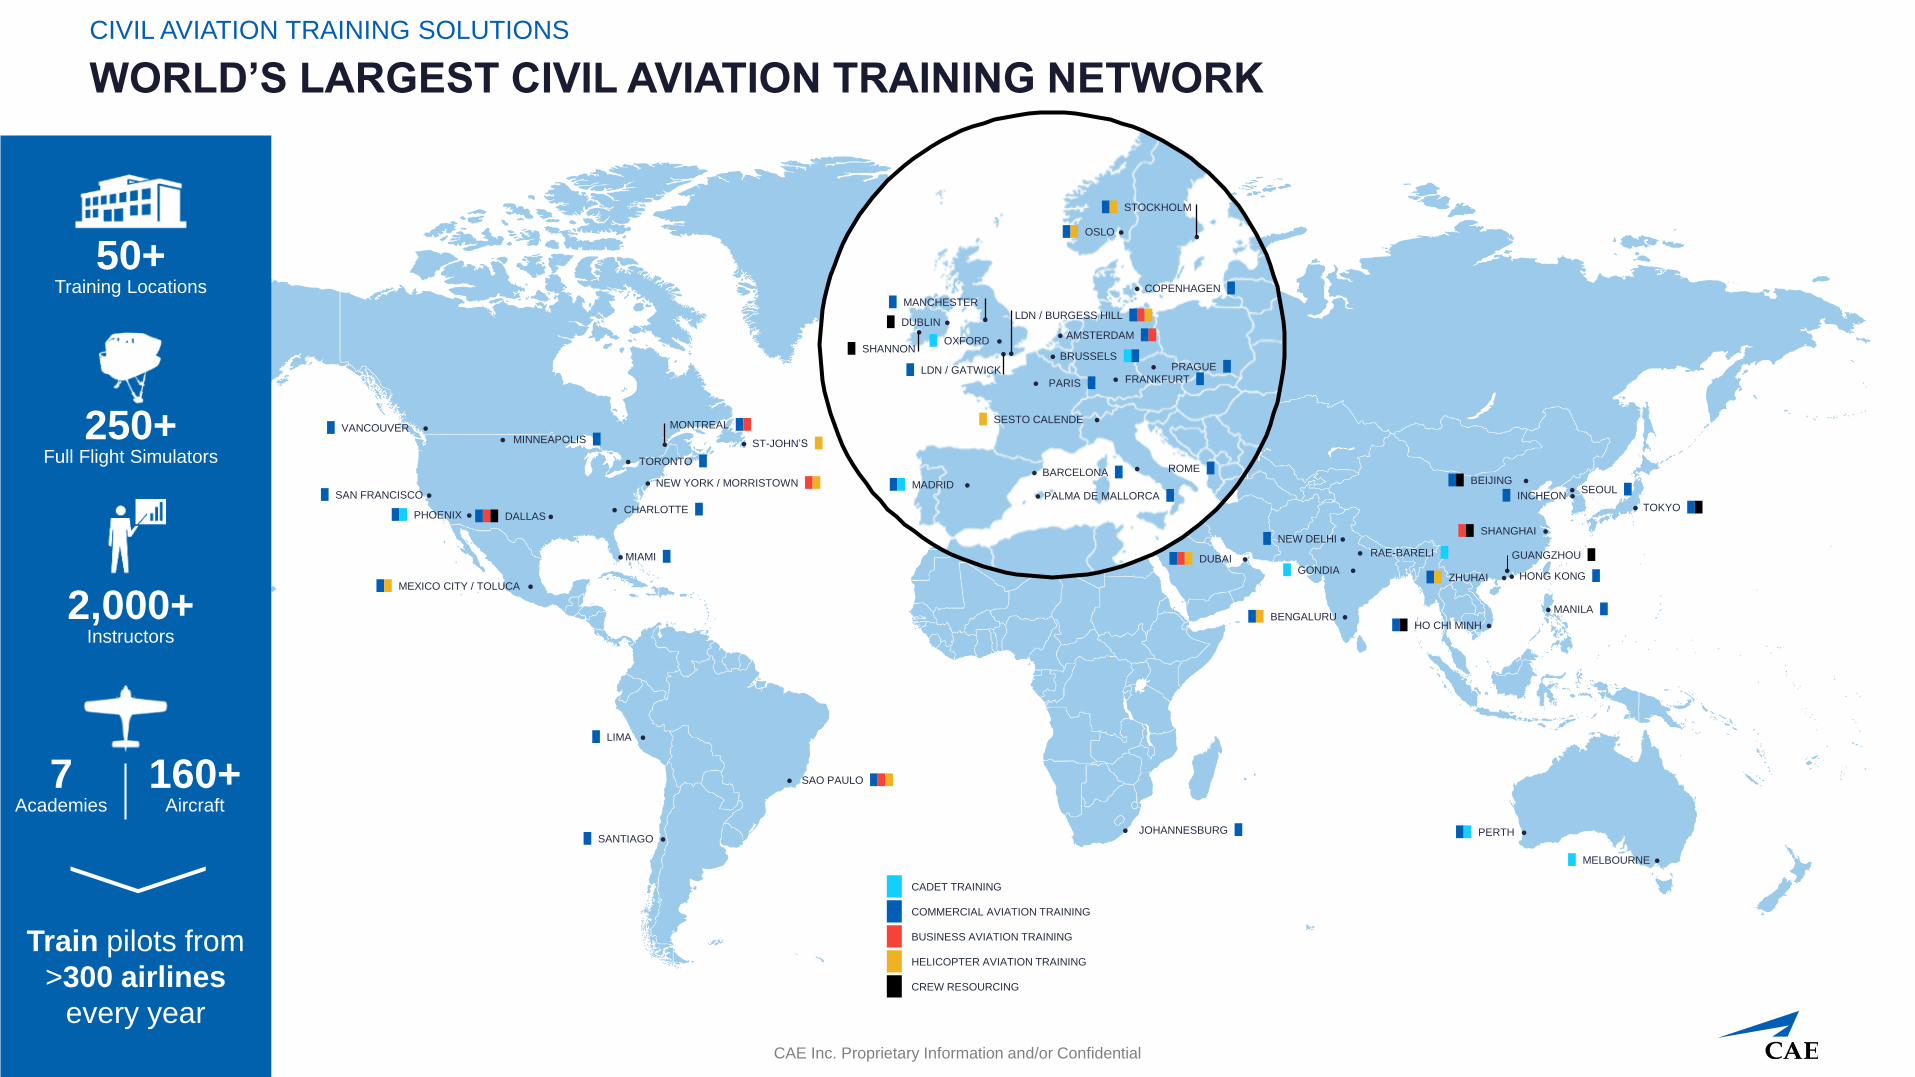
WORLD’S LARGEST CIVIL AVIATION TRAINING NETWORK
CIVIL AVIATION TRAINING SOLUTIONS
13
VANCOUVER ●
SAN FRANCISCO ●
PHOENIX ● DALLAS ●
MEXICO CITY / TOLUCA ●
LIMA ●
SANTIAGO ●
● SAO PAULO
● MIAMI
● CHARLOTTE
● NEW YORK / MORRISTOWN
● TORONTO
MONTREAL
● MINNEAPOLIS ● ST-JOHN’S●
● JOHANNESBURG
DUBAI ●
BENGALURU ●
GONDIA ●
NEW DELHI ●
● RAE-BARELI
PERTH ●
MELBOURNE ●
HO CHI MINH ●
● MANILA
ZHUHAI ●● HONG KONG
GUANGZHOU
●
SHANGHAI ●
● TOKYO
● SEOULINCHEON ●
BEIJING ●
●
MANCHESTER
DUBLIN ●
OXFORD ●SHANNON
●
LDN / GATWICK
●
SESTO CALENDE ●
MADRID ●
OSLO ●
STOCKHOLM
●
●
● COPENHAGEN
LDN / BURGESS HILL
● AMSTERDAM
● BRUSSELS● PRAGUE
● FRANKFURT● PARIS
● ROME● BARCELONA
● PALMA DE MALLORCA
CADET TRAINING
COMMERCIAL AVIATION TRAINING
BUSINESS AVIATION TRAINING
HELICOPTER AVIATION TRAINING
CREW RESOURCING
50+Training Locations
Train pilots from
>300 airlines
every year
250+Full Flight Simulators
2,000+Instructors
7Academies
160+Aircraft

CAE Inc. Proprietary Information and/or Confidential
THOUGHT LEADERSHIP AND INNOVATION
CIVIL AVIATION TRAINING SOLUTIONS
Thought leadership and innovation are at the heart of our success
14
Trusted partner of regulatory organizations and industry associations
Constantly developing training solutions for partners
Development of the Next Generation Training System
Supported by innovative data collection and analysis
techniques, we aim to improve training quality and
efficiency through the integration of untapped data-driven
insights into training

Your worldwide
training partner
of choice
Defence And Security
CAE Inc. Proprietary Information and/or Confidential
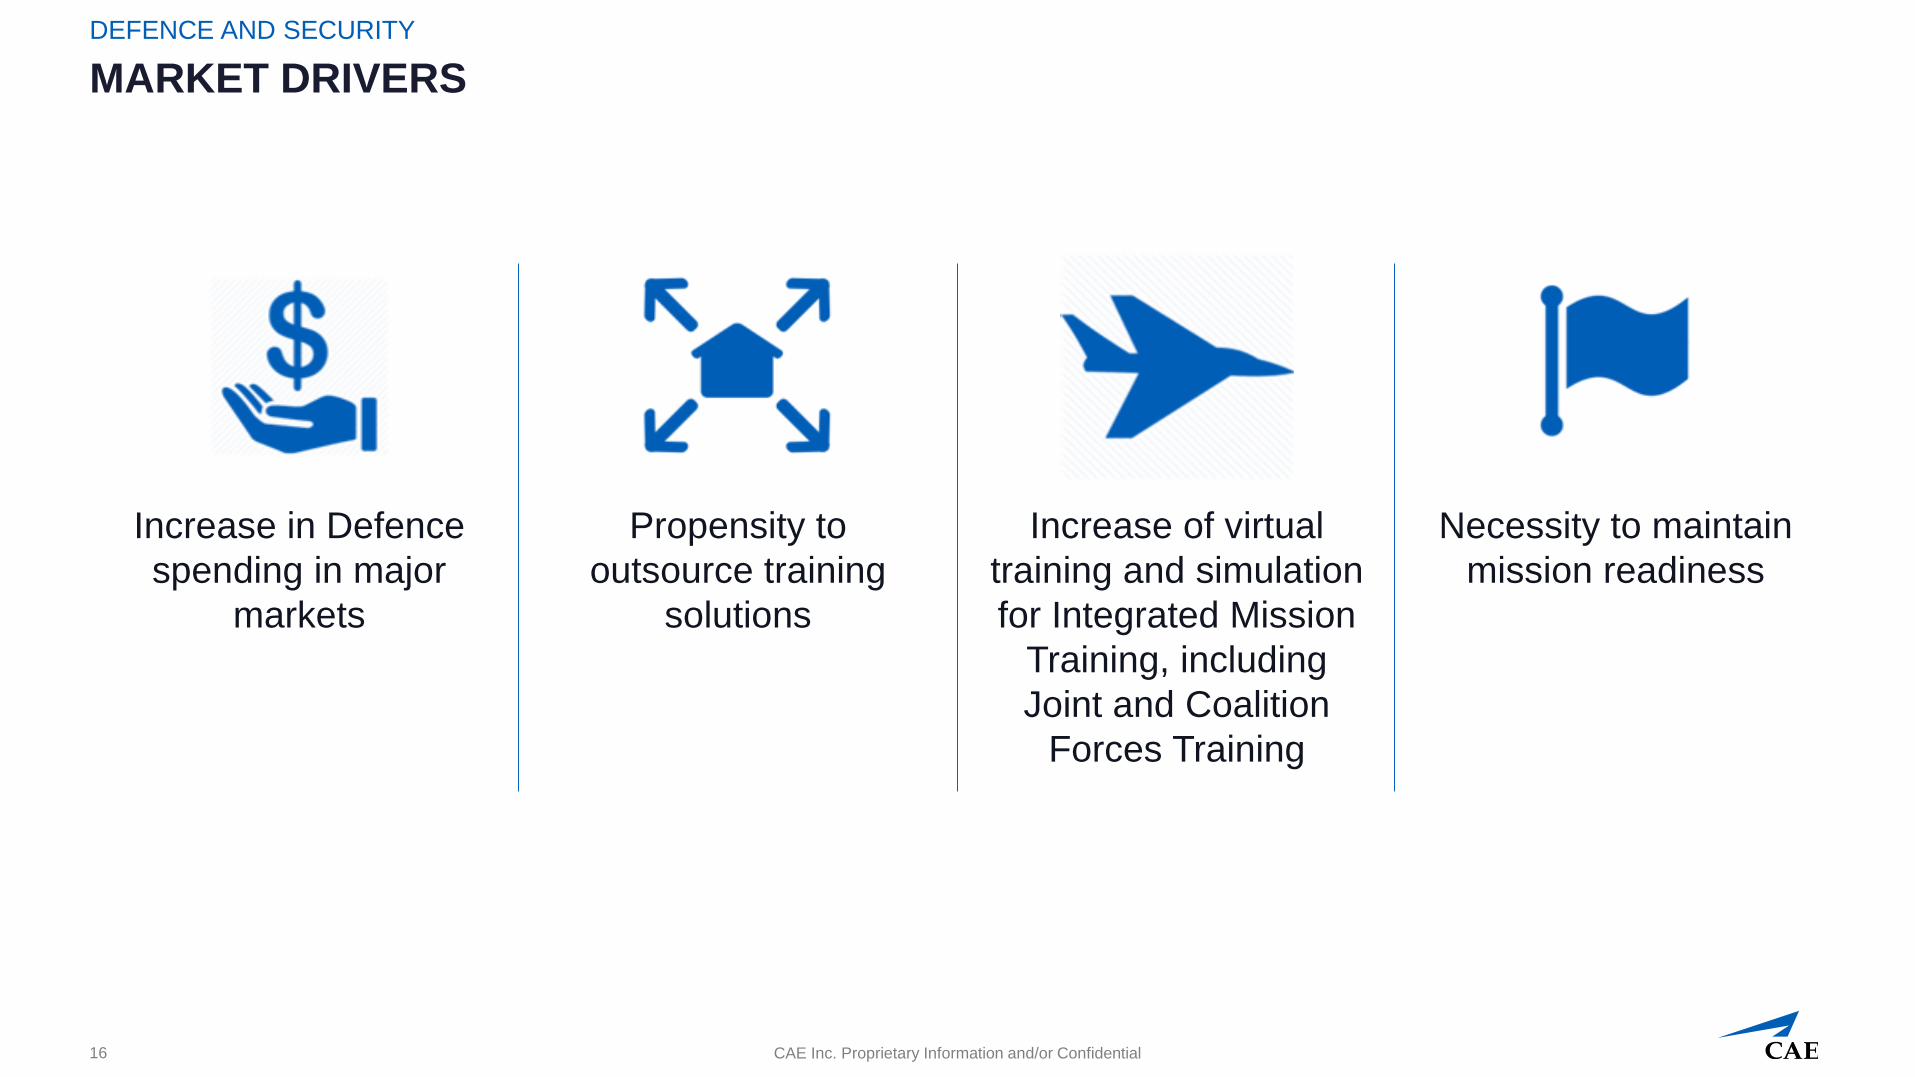
MARKET DRIVERS
DEFENCE AND SECURITY
16
Increase of virtual
training and simulation
for Integrated Mission
Training, including
Joint and Coalition
Forces Training
Necessity to maintain
mission readiness
Increase in Defence
spending in major
markets
Propensity to
outsource training
solutions
CAE Inc. Proprietary Information and/or Confidential
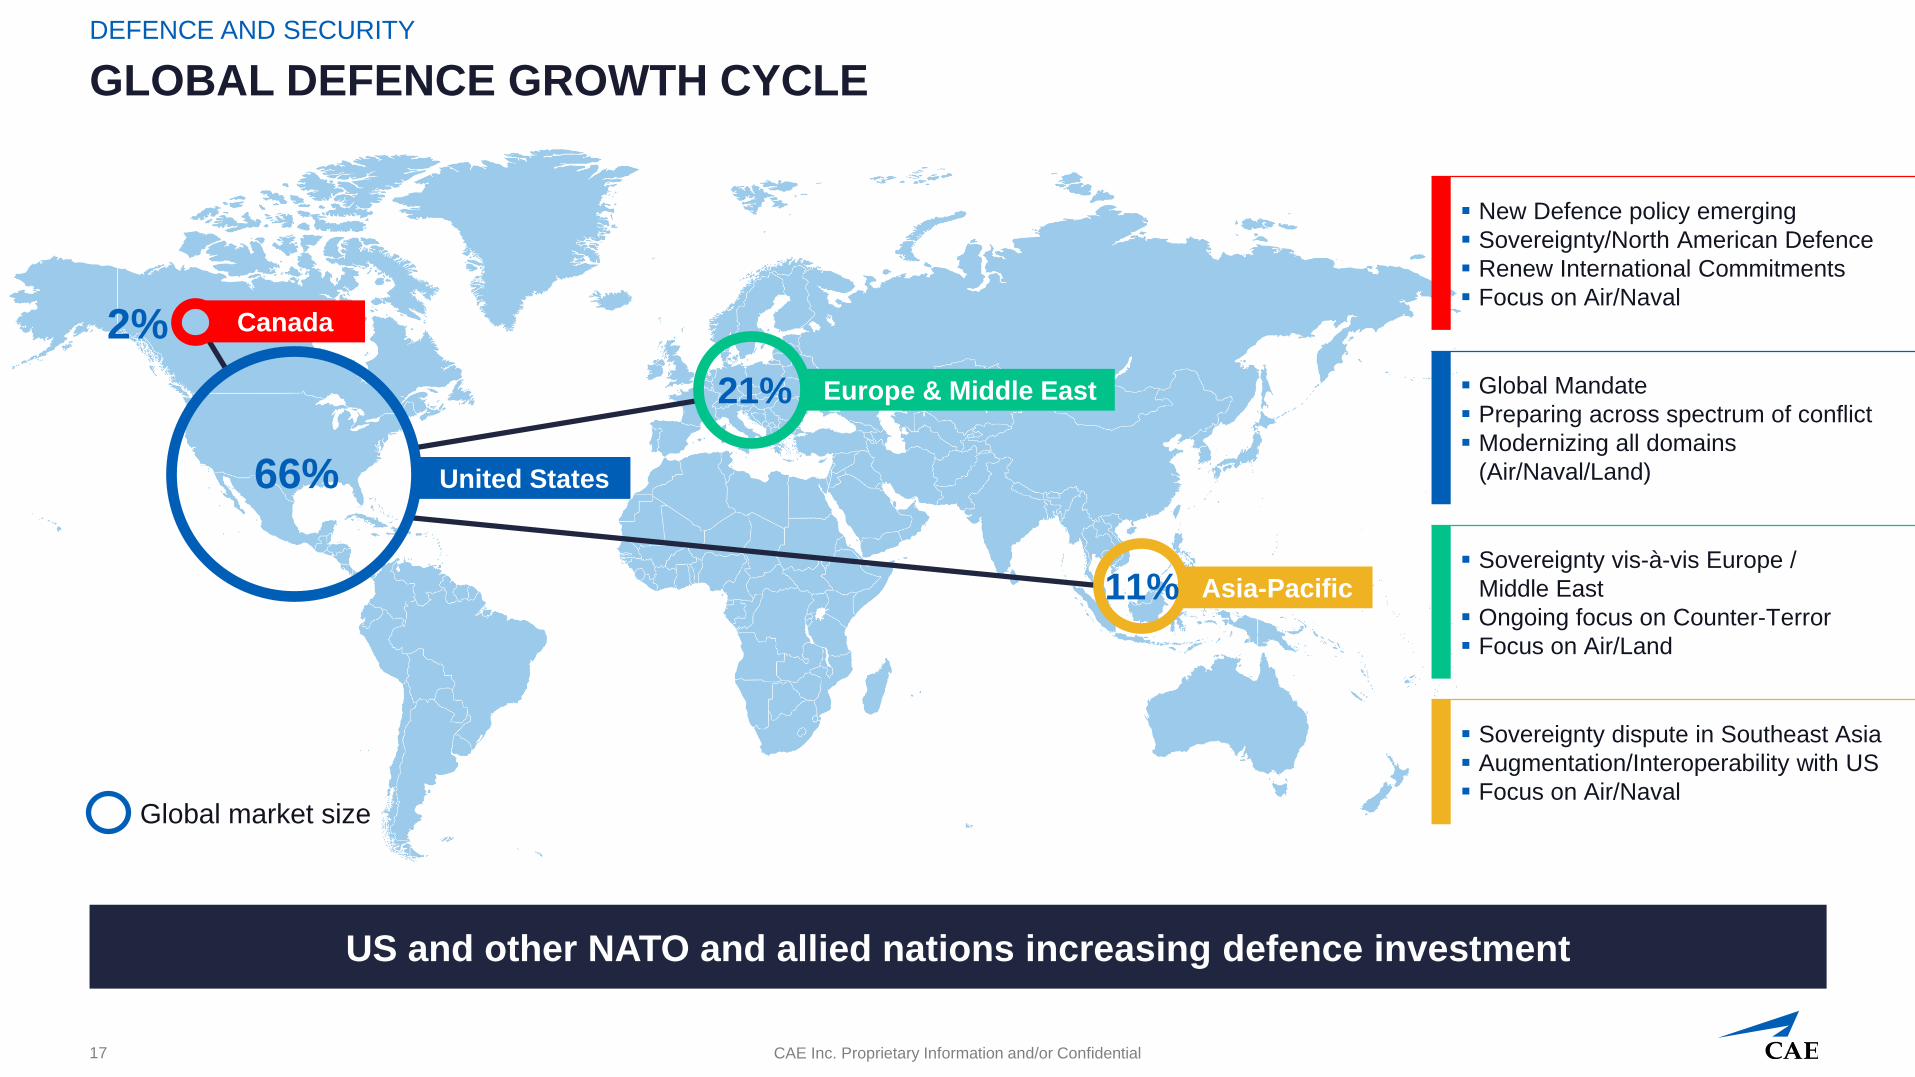
GLOBAL DEFENCE GROWTH CYCLE
DEFENCE AND SECURITY
US and other NATO and allied nations increasing defence investment
17
Global market size
2%
66%
21%
11%
Europe & Middle East
Canada
Asia-Pacific
United States
▪ New Defence policy emerging
▪ Sovereignty/North American Defence
▪ Renew International Commitments
▪ Focus on Air/Naval
▪ Global Mandate
▪ Preparing across spectrum of conflict
▪ Modernizing all domains
(Air/Naval/Land)
▪ Sovereignty vis-à-vis Europe /
Middle East
▪ Ongoing focus on Counter-Terror
▪ Focus on Air/Land
▪ Sovereignty dispute in Southeast Asia
▪ Augmentation/Interoperability with US
▪ Focus on Air/Naval

CAE Inc. Proprietary Information and/or Confidential
A TRULY GLOBAL DEFENCE FOOTPRINT IN KEY MARKETS
DEFENCE AND SECURITY
18
80+Locations
35Countries
50+Defence Agencies
70+Platforms reproduced
Tampa
Ottawa
Orlando
Sydney
Singapore
Bengaluru
Stolberg
Burgess Hill
Montreal
HOLZDORF COLD LAKE
MOOSE JAW
DOTHAN
NEW YORK
SESTO CALENDE
RAF BENSON FAßBERG
BÜCKEBURG
BRUNEI
SALE
STAVANGER
MILITARY AVIATION TRAINING
REGIONAL OFFICE
GLOBAL PRESENCE
CAE Inc. Proprietary Information and/or Confidential
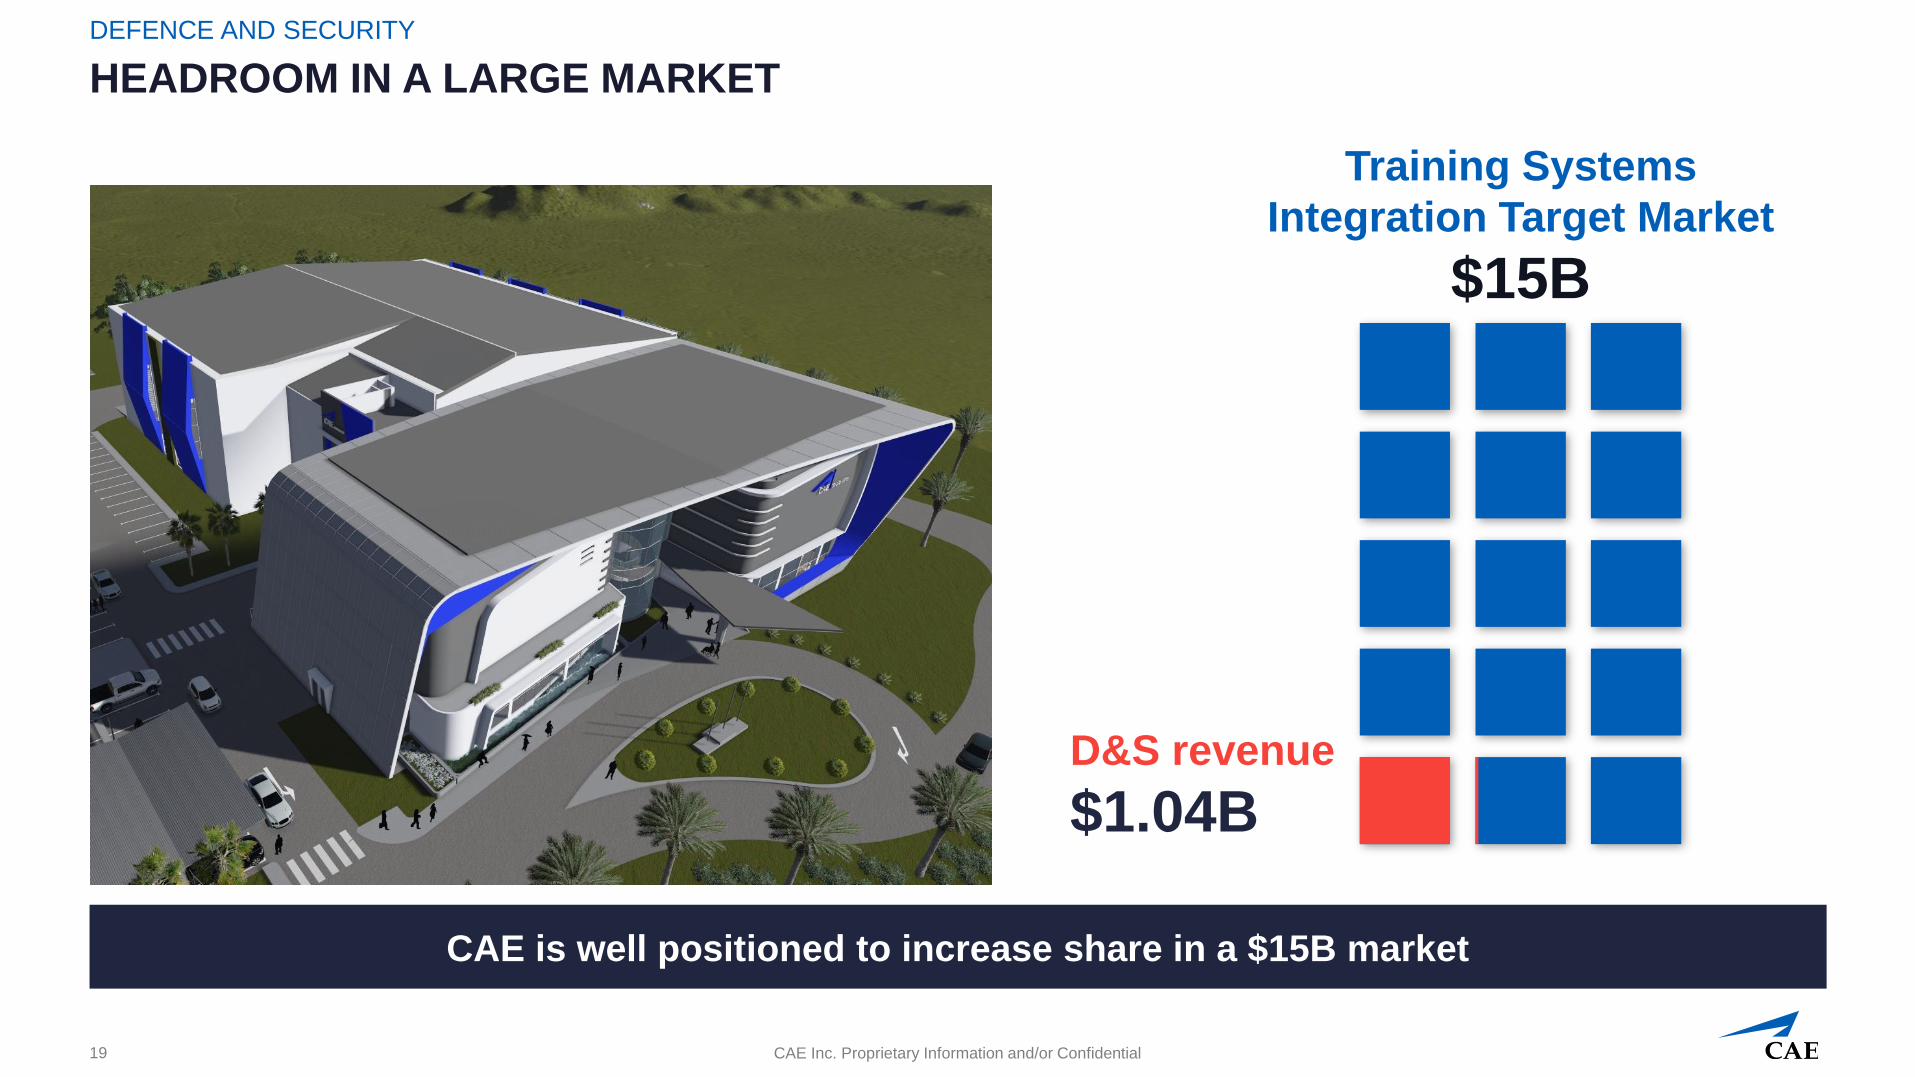
HEADROOM IN A LARGE MARKET
DEFENCE AND SECURITY
CAE is well positioned to increase share in a $15B market
19
Training Systems
Integration Target Market
$15B
D&S revenue
$1.04B

CAE Inc. Proprietary Information and/or Confidential
TRAINING SYSTEM INTEGRATION
20
• Live Operators
• Real Platforms
• Simulated Operators
• Simulated Platforms
Constructive
LiveVirtual
Live Operators
Simulated Platforms
LandPublic
SafetyNavalAir
DEFENCE AND SECURITY

CAE Inc. Proprietary Information and/or Confidential
THOUGHT LEADERSHIP AND INNOVATION
Innovative and comprehensive training solutions on leading
platforms for Defence organizations worldwide
21
U.S. Army Fixed-Wing
Flight Training Program
U.S. Navy T-44C
Aircrew Training
U.K. Medium Support
Helicopter Aircrew
Training Facility
NATO Flying Training
in Canada (NFTC)
U.S. Air Force MQ-1/
MQ-9 aircrew training
Swedish Navy's Naval
Warfare Training
System
Naval Training Centre
(NTC) for the United
Arab Emirates Navy
DEFENCE AND SECURITY

Your worldwide
training partner
of choice
Healthcare
CAE Inc. Proprietary Information and/or Confidential
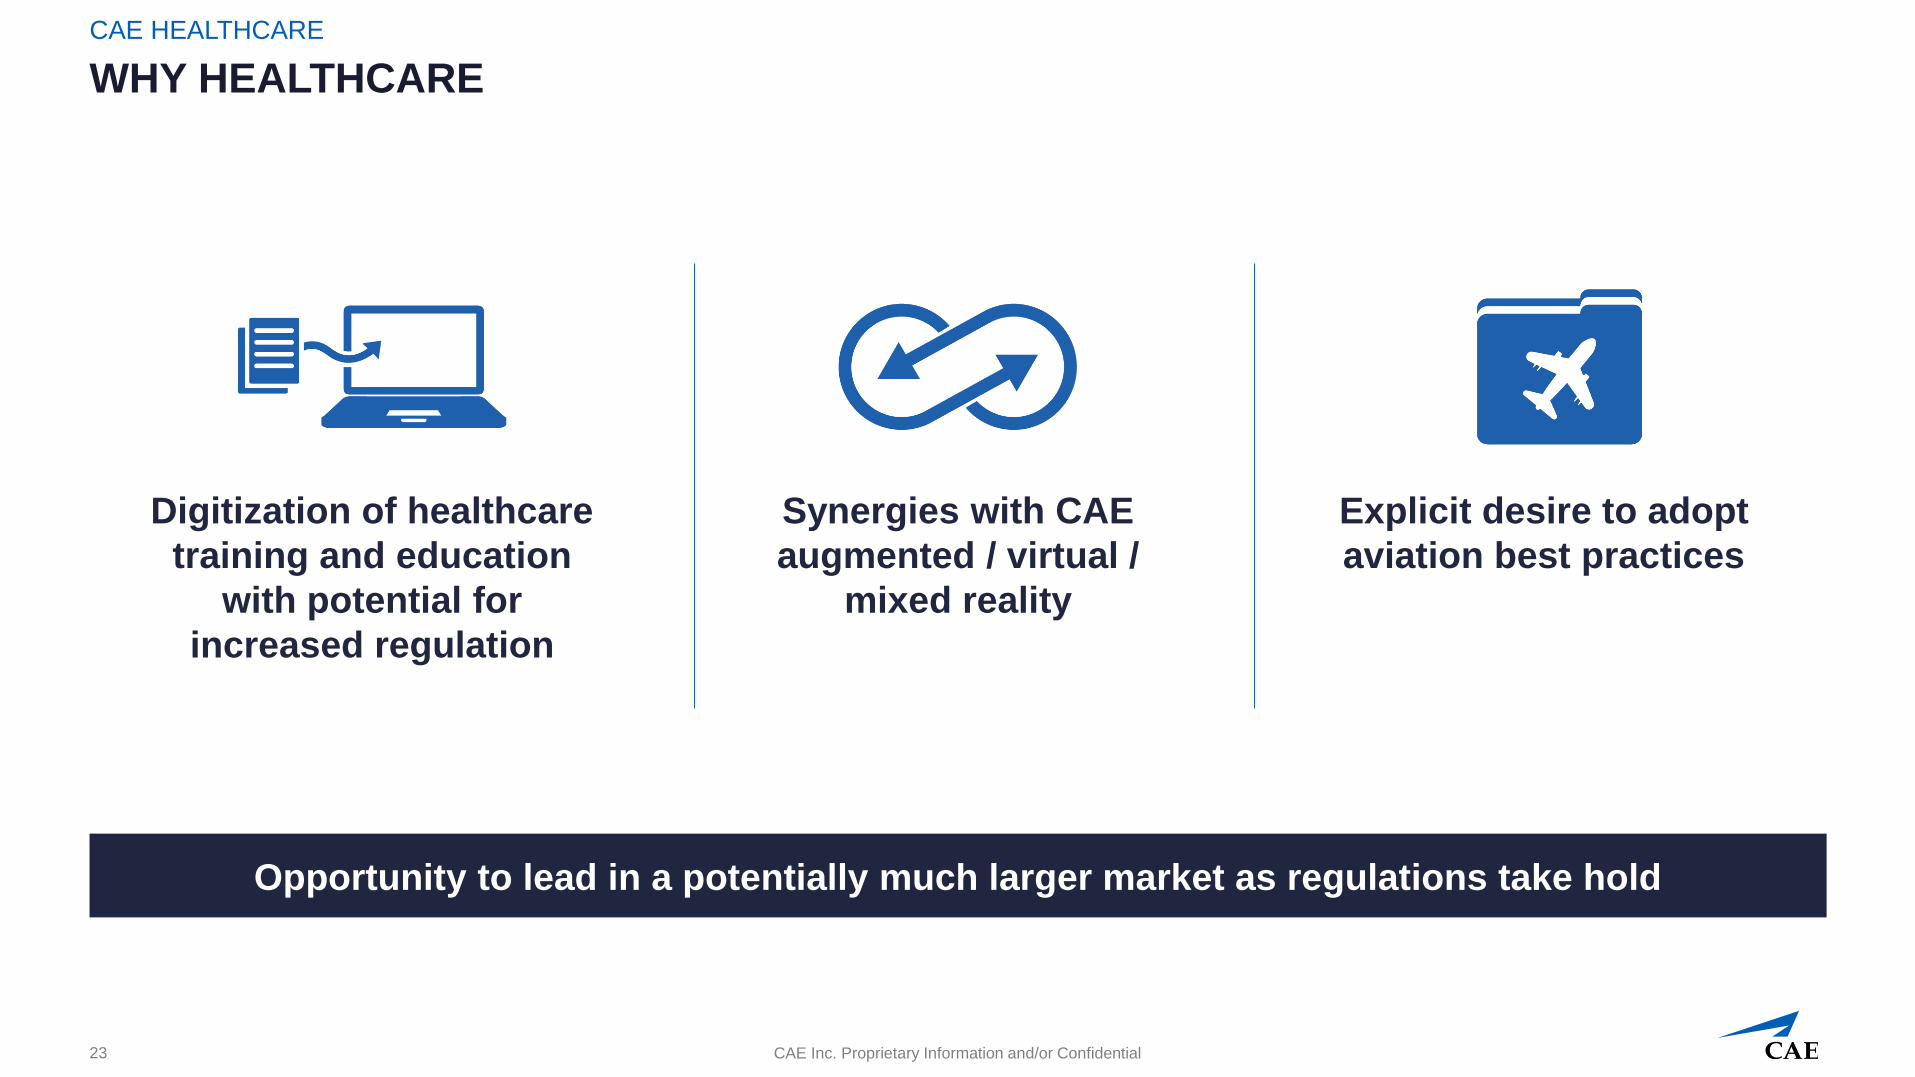
WHY HEALTHCARE
CAE HEALTHCARE
Opportunity to lead in a potentially much larger market as regulations take hold
23
Digitization of healthcare
training and education
with potential for
increased regulation
Synergies with CAE
augmented / virtual /
mixed reality
Explicit desire to adopt
aviation best practices
CAE Inc. Proprietary Information and/or Confidential
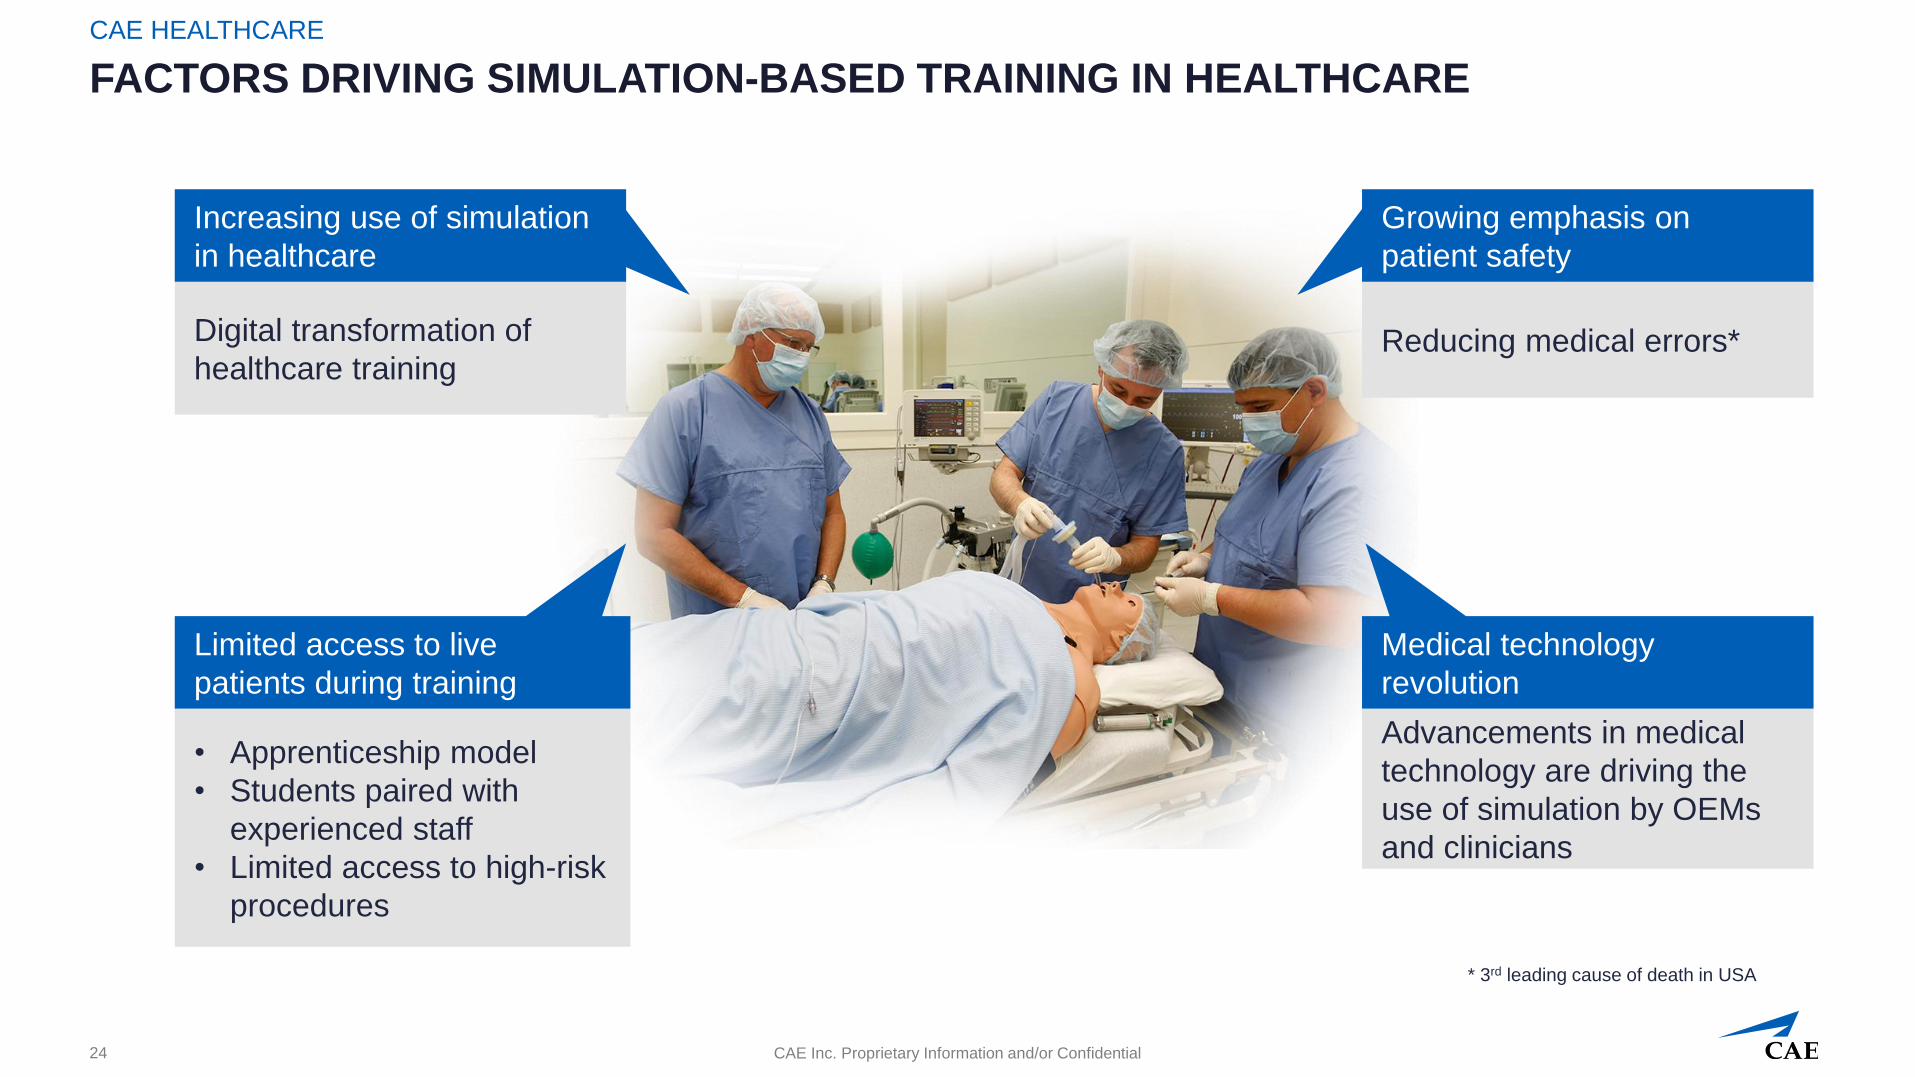
FACTORS DRIVING SIMULATION-BASED TRAINING IN HEALTHCARE
CAE HEALTHCARE
24
• Apprenticeship model
• Students paired with
experienced staff
• Limited access to high-risk
procedures
Limited access to live
patients during training
Advancements in medical
technology are driving the
use of simulation by OEMs
and clinicians
Medical technology
revolution
Digital transformation of
healthcare trainingReducing medical errors*
* 3rd leading cause of death in USA
Increasing use of simulation
in healthcare
Growing emphasis on
patient safety
CAE Inc. Proprietary Information and/or Confidential
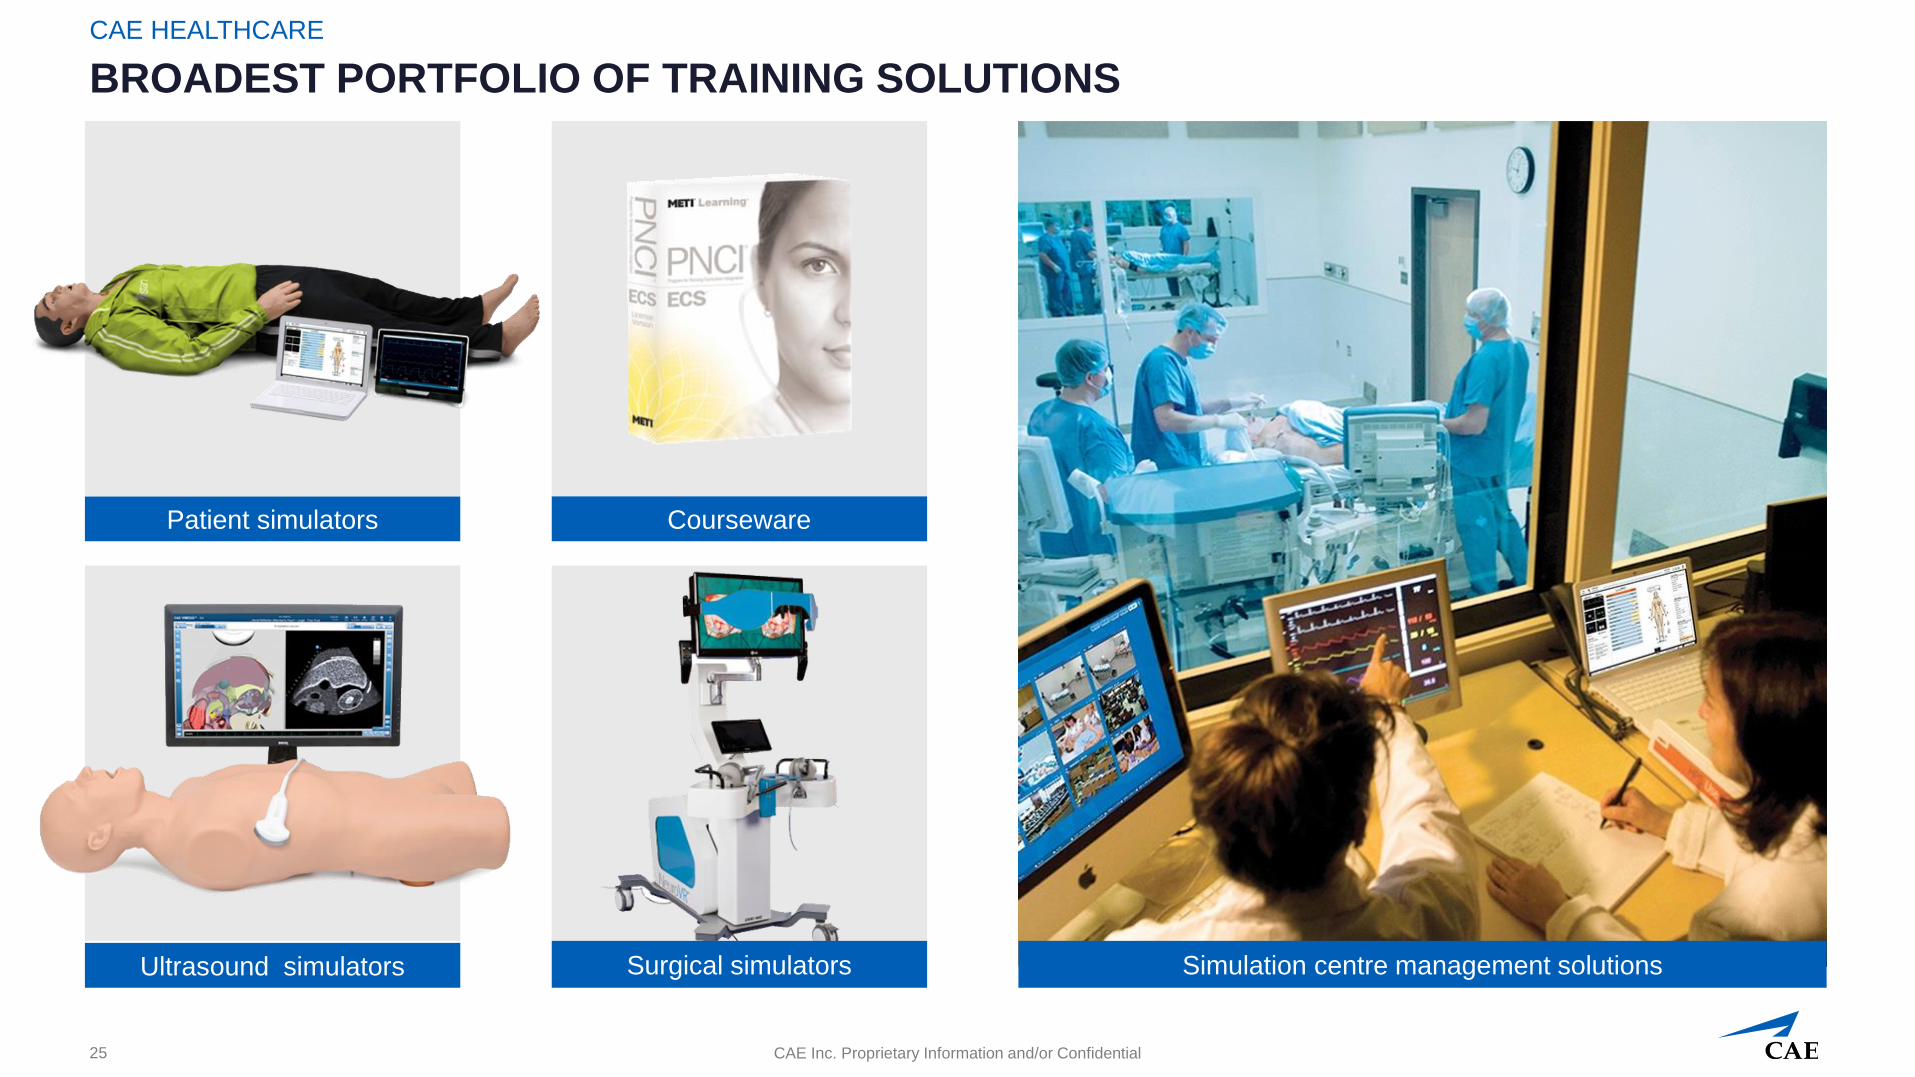
BROADEST PORTFOLIO OF TRAINING SOLUTIONS
CAE HEALTHCARE
25
Surgical simulators
Courseware
Simulation centre management solutionsUltrasound simulators
Patient simulators

CAE Inc. Proprietary Information and/or Confidential
CULTURE OF INNOVATION
26
CAE HEALTHCARE
CAE Healthcare
became the first
company to bring a
commercial Microsoft
HoloLens mixed-
reality application to
the medical
simulation market…
…by using the
Microsoft Hololens,
the CAE VimedixAR
ultrasound simulator
integrates real-time
interactive holograms
of the human
anatomy

CAE Inc. Proprietary Information and/or Confidential
THOUGHT LEADERSHIP AND INNOVATION
SCREEN-BASED SIMULATION USED FOR MAINTENANCE OF CERTIFICATION
▪ Scenario-based eLearning created in
collaboration by America Society of
Anesthesiologists (ASA) and CAE Healthcare
deployed via the ASA Education Center
▪ Allow users to explore high-stakes practice
scenarios in a realistic, immersive
environment, at their choice of location and
time
▪ Approved by American Board of
Anesthesiology (ABA) for Maintenance
of Certification Anesthesiology (MOCA)
Part IV and Part 2
CAE HEALTHCARE
27
CAE’s Müse physiology
automatically responds to
therapeutic interventions and
includes performance feedback
SimTabs Virtual Environment

Your worldwide
training partner
of choice
Financial highlights and capital priorities
CAE Inc. Proprietary Information and/or Confidential
1
2
3
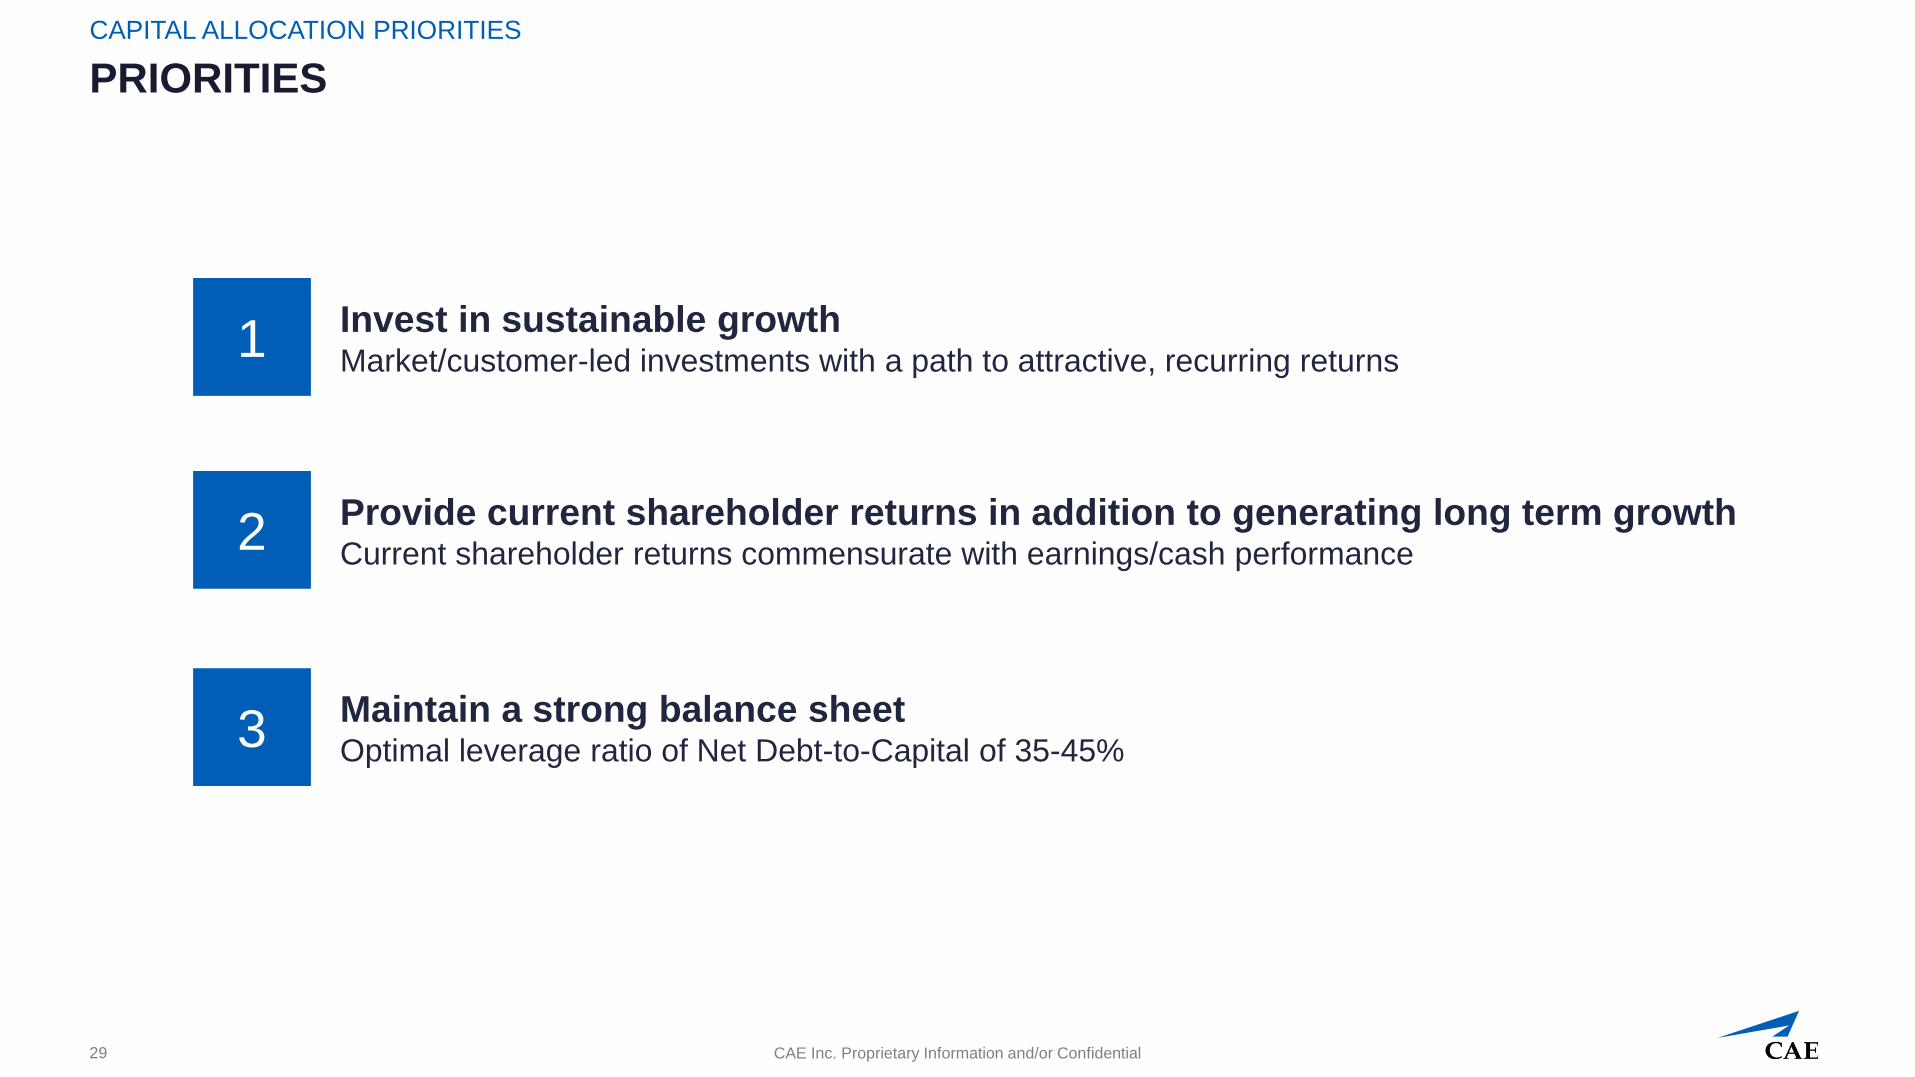
PRIORITIES
CAPITAL ALLOCATION PRIORITIES
29
Invest in sustainable growth Market/customer-led investments with a path to attractive, recurring returns
Provide current shareholder returns in addition to generating long term growthCurrent shareholder returns commensurate with earnings/cash performance
Maintain a strong balance sheet Optimal leverage ratio of Net Debt-to-Capital of 35-45%

CAE Inc. Proprietary Information and/or Confidential
0%
10%
20%
30%
40%
FY13 FY14 FY15 FY16 FY17
FY13 Deployments FY14 Deployments FY15 Deployments FY16 Deployments FY17 Deployments
INVESTMENT IN ACCRETIVE GROWTH REMAINS A PRIORITY
GIVEN ATTRACTIVE RETURN POTENTIAL
CAPITAL ALLOCATION PRIORITIES
Growth capital deployed in Civil in the last five years has grown
recurring revenue and has been highly accretive
30
~$290M capital
investment from
FY13-FY17 to
deploy 47 FFSs
within CAE’s Civil
commercial and
business aviation
training network
Incremental Pre-tax Return % on Capital Deployed in Civil Training
(FY13-FY17)
32%31%
11%
3%3%
24%25%
19%
7%
14%16%
3%
6%
2%
21%
1
CAE Inc. Proprietary Information and/or Confidential
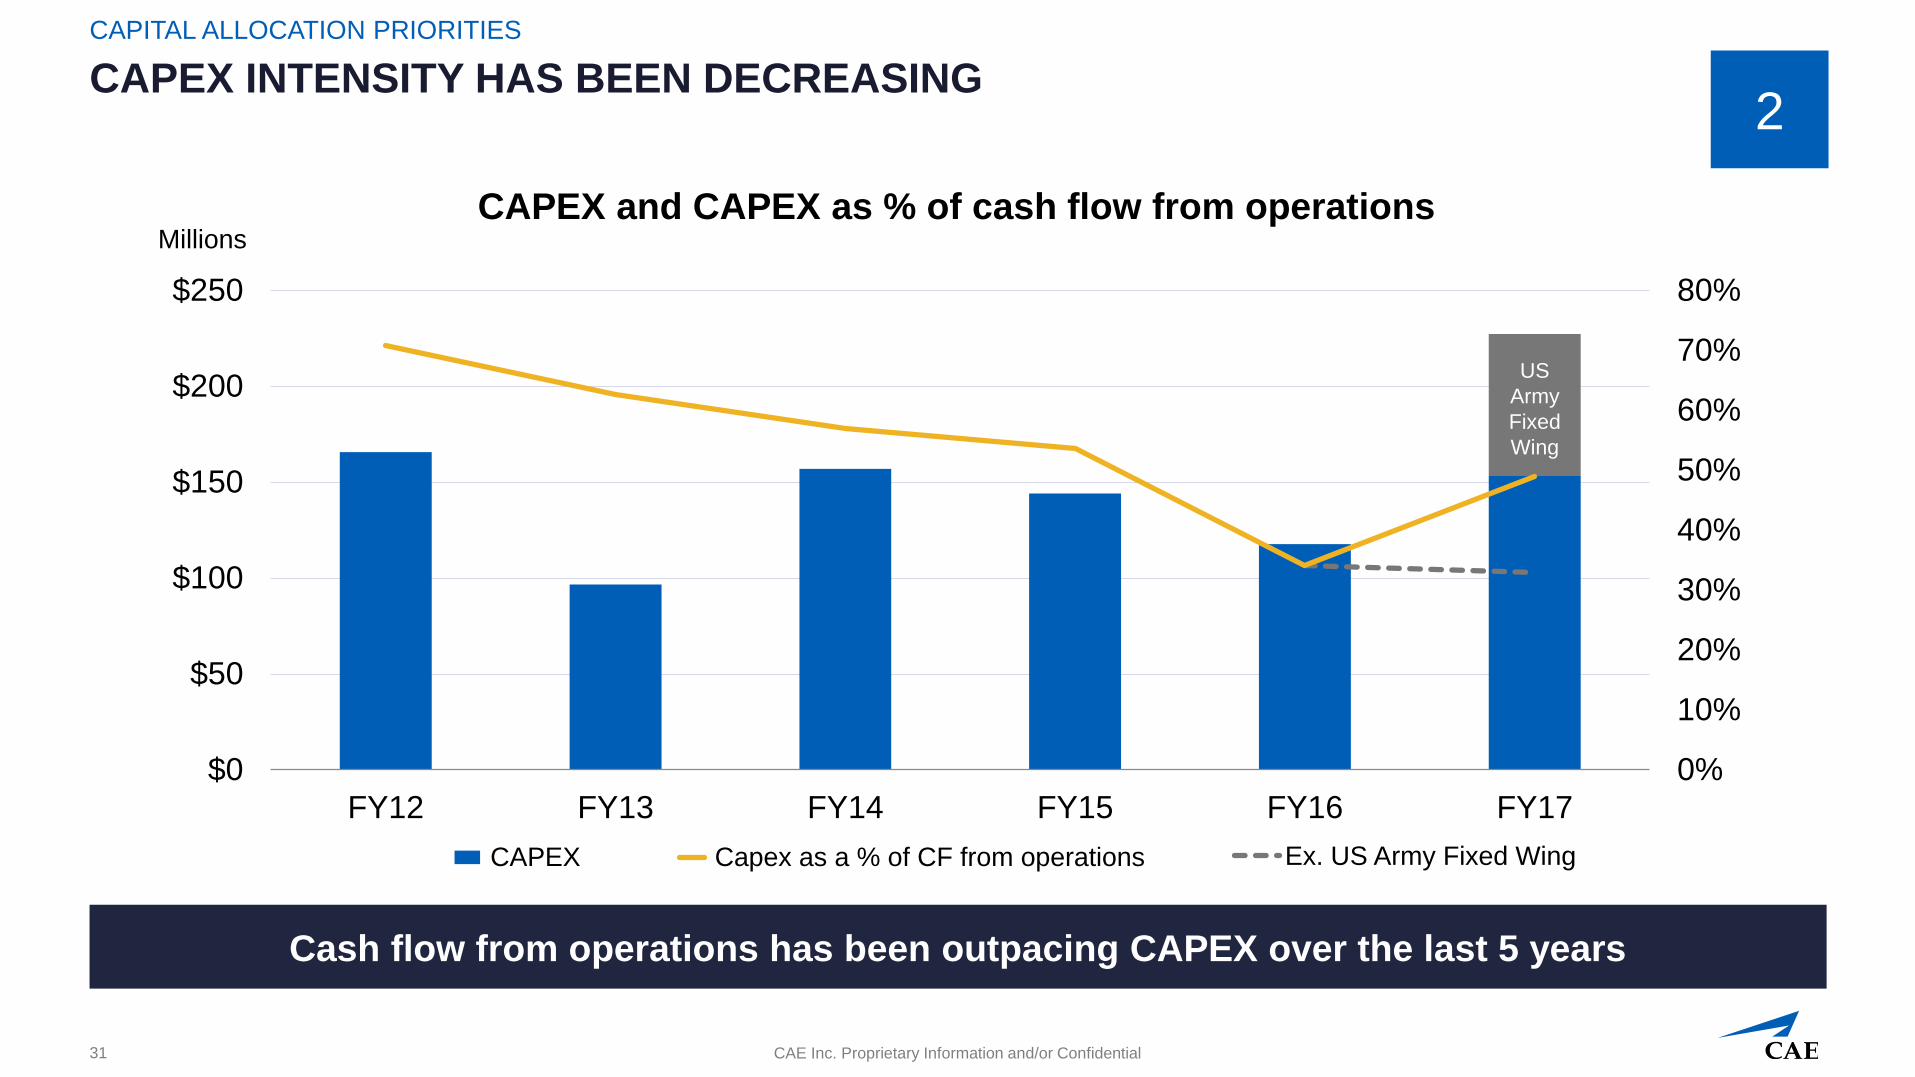
CAPEX INTENSITY HAS BEEN DECREASING
CAPITAL ALLOCATION PRIORITIES
Cash flow from operations has been outpacing CAPEX over the last 5 years
31
0%
10%
20%
30%
40%
50%
60%
70%
80%
$0
$50
$100
$150
$200
$250
FY12 FY13 FY14 FY15 FY16 FY17
CAPEX and CAPEX as % of cash flow from operations
CAPEX Capex as a % of CF from operations Ex. US Army Fixed Wing
US
Army
Fixed
Wing
Millions
2
CAE Inc. Proprietary Information and/or Confidential
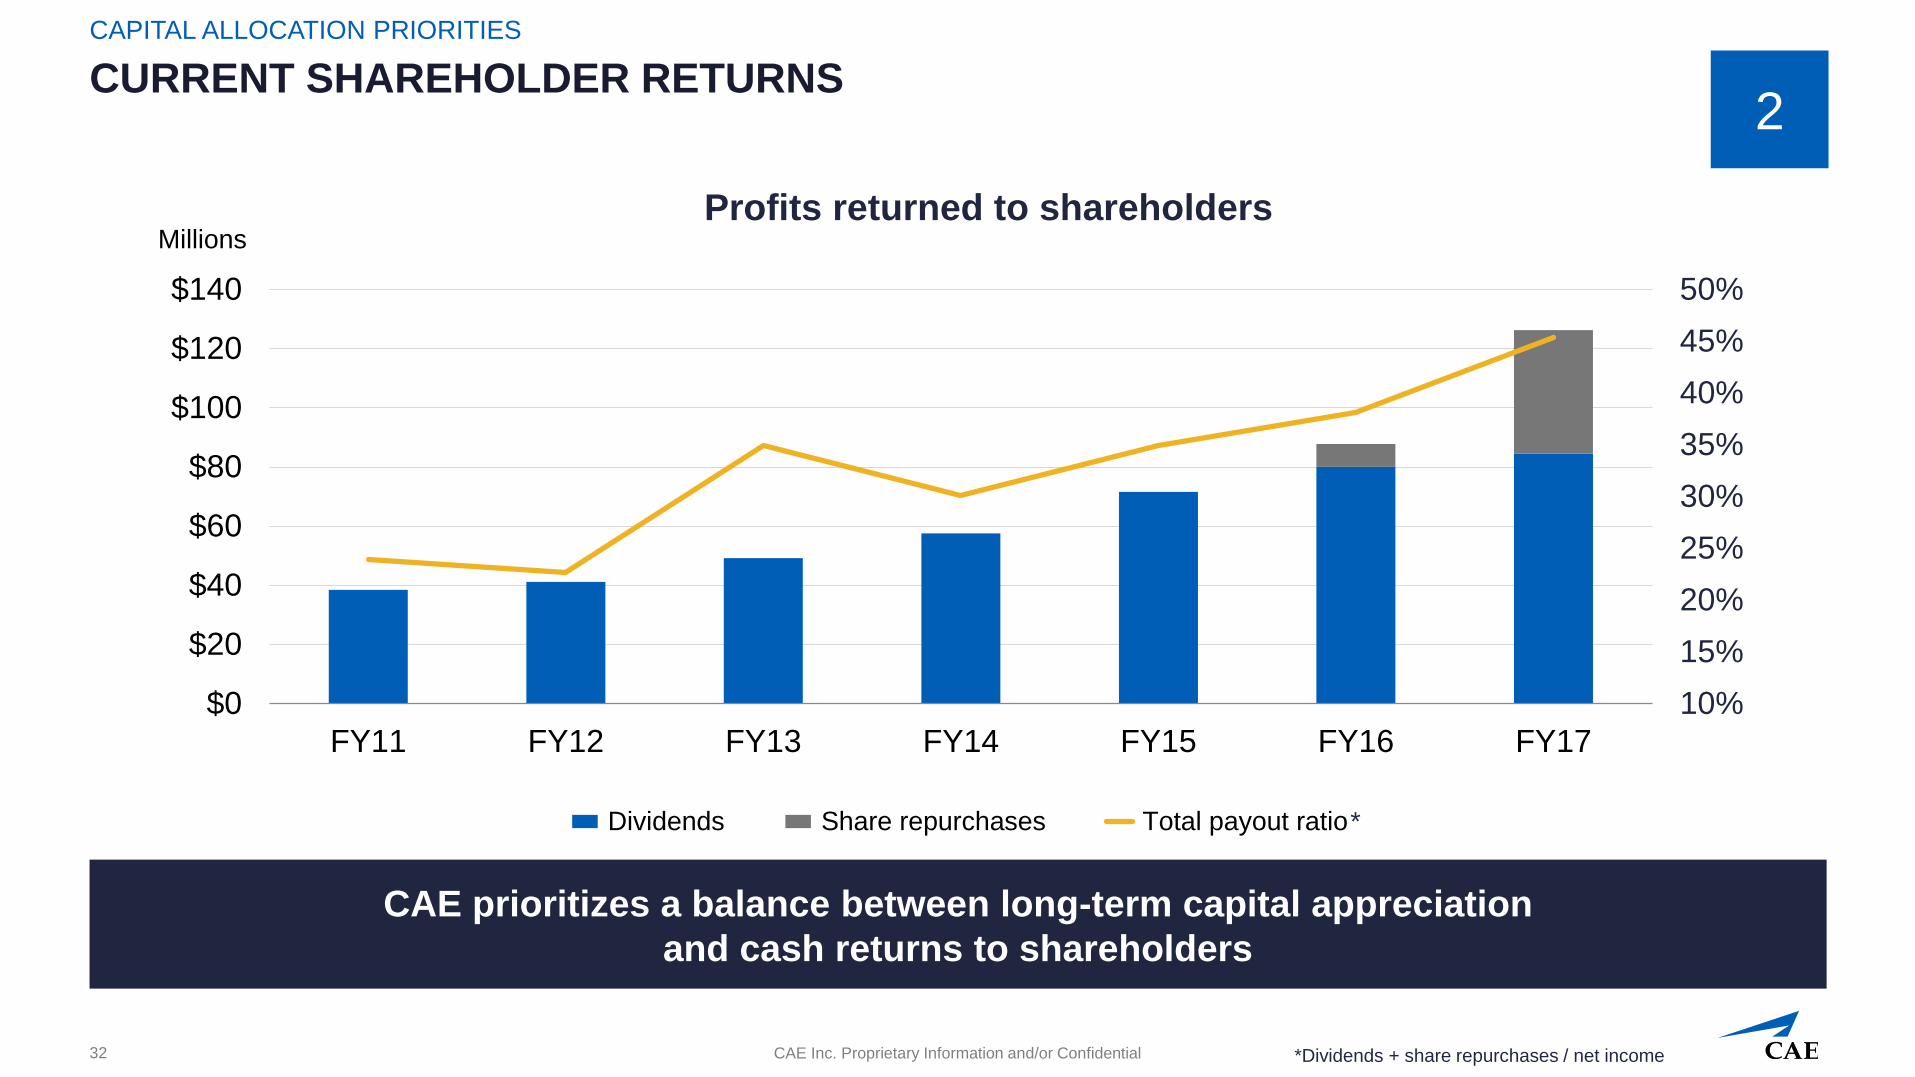
CURRENT SHAREHOLDER RETURNS
CAPITAL ALLOCATION PRIORITIES
CAE prioritizes a balance between long-term capital appreciation
and cash returns to shareholders
32
10%
15%
20%
25%
30%
35%
40%
45%
50%
$0
$20
$40
$60
$80
$100
$120
$140
FY11 FY12 FY13 FY14 FY15 FY16 FY17
Profits returned to shareholders
Dividends Share repurchases Total payout ratio
Millions
2
*
*Dividends + share repurchases / net income
CAE Inc. Proprietary Information and/or Confidential
10%
20%
30%
40%
50%
$0
$200
$400
$600
$800
$1,000
$1,200
$1,400
$1,600
$1,800
$2,000
FY11 FY12 FY13 FY14 FY15 FY16 FY17
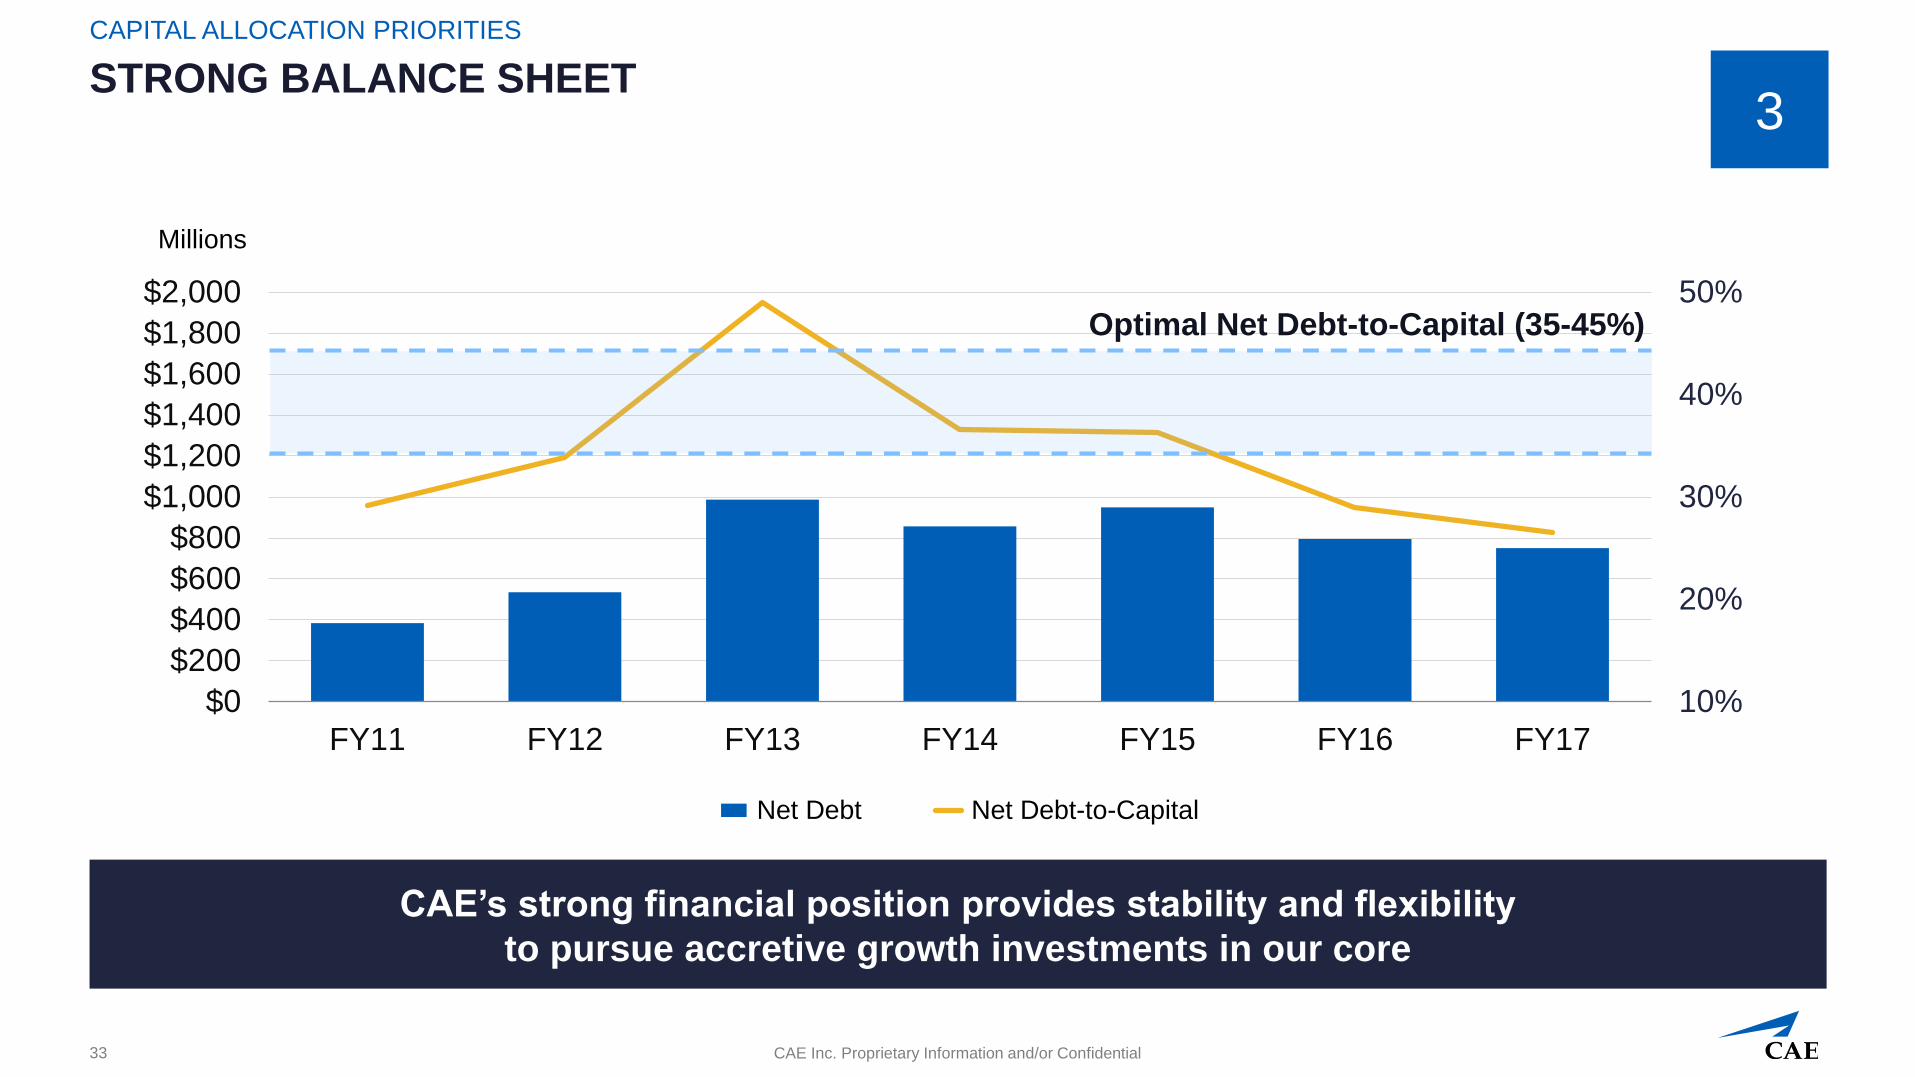
Net Debt Net Debt-to-Capital
STRONG BALANCE SHEET
CAPITAL ALLOCATION PRIORITIES
CAE’s strong financial position provides stability and flexibility
to pursue accretive growth investments in our core
33
Optimal Net Debt-to-Capital (35-45%)
Millions
3
CAE Inc. Proprietary Information and/or Confidential
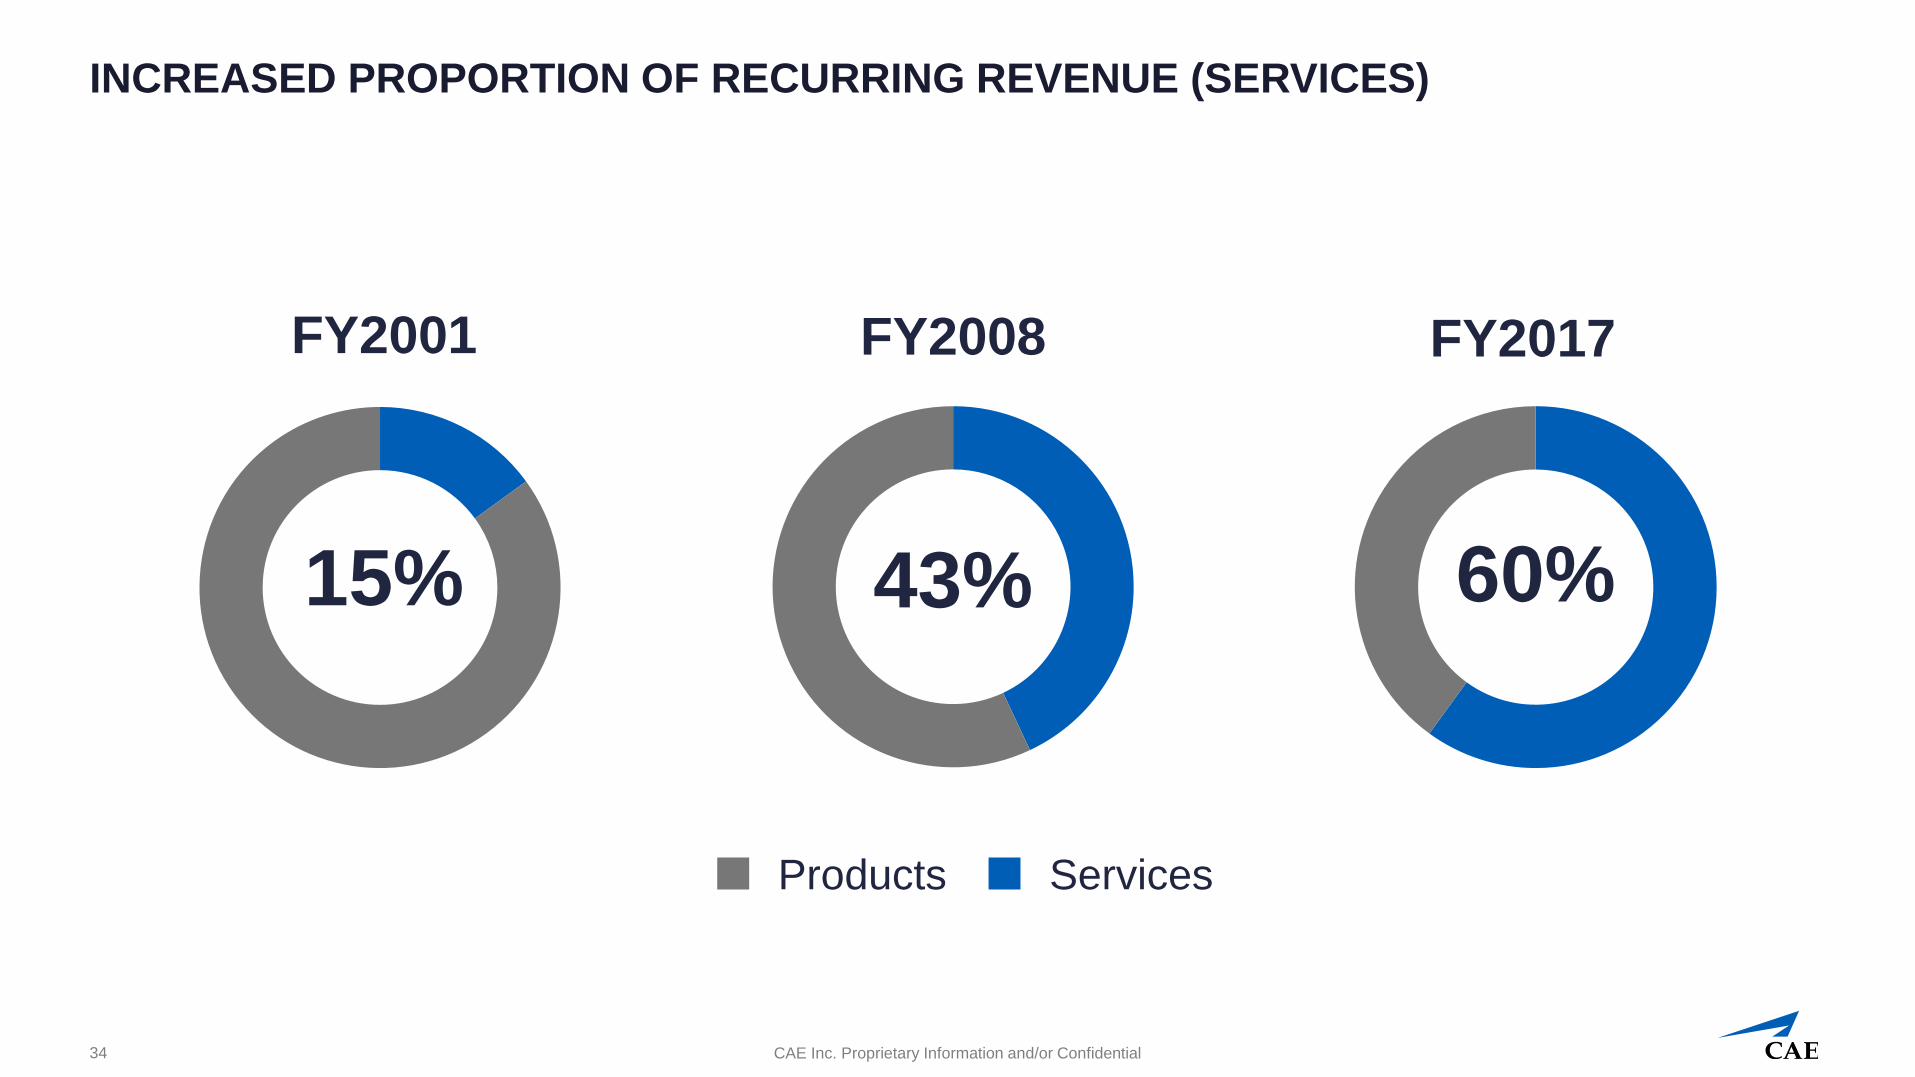
INCREASED PROPORTION OF RECURRING REVENUE (SERVICES)
34
15%
FY2001
Products Services
43%
FY2008
60%
FY2017
CAE Inc. Proprietary Information and/or Confidential
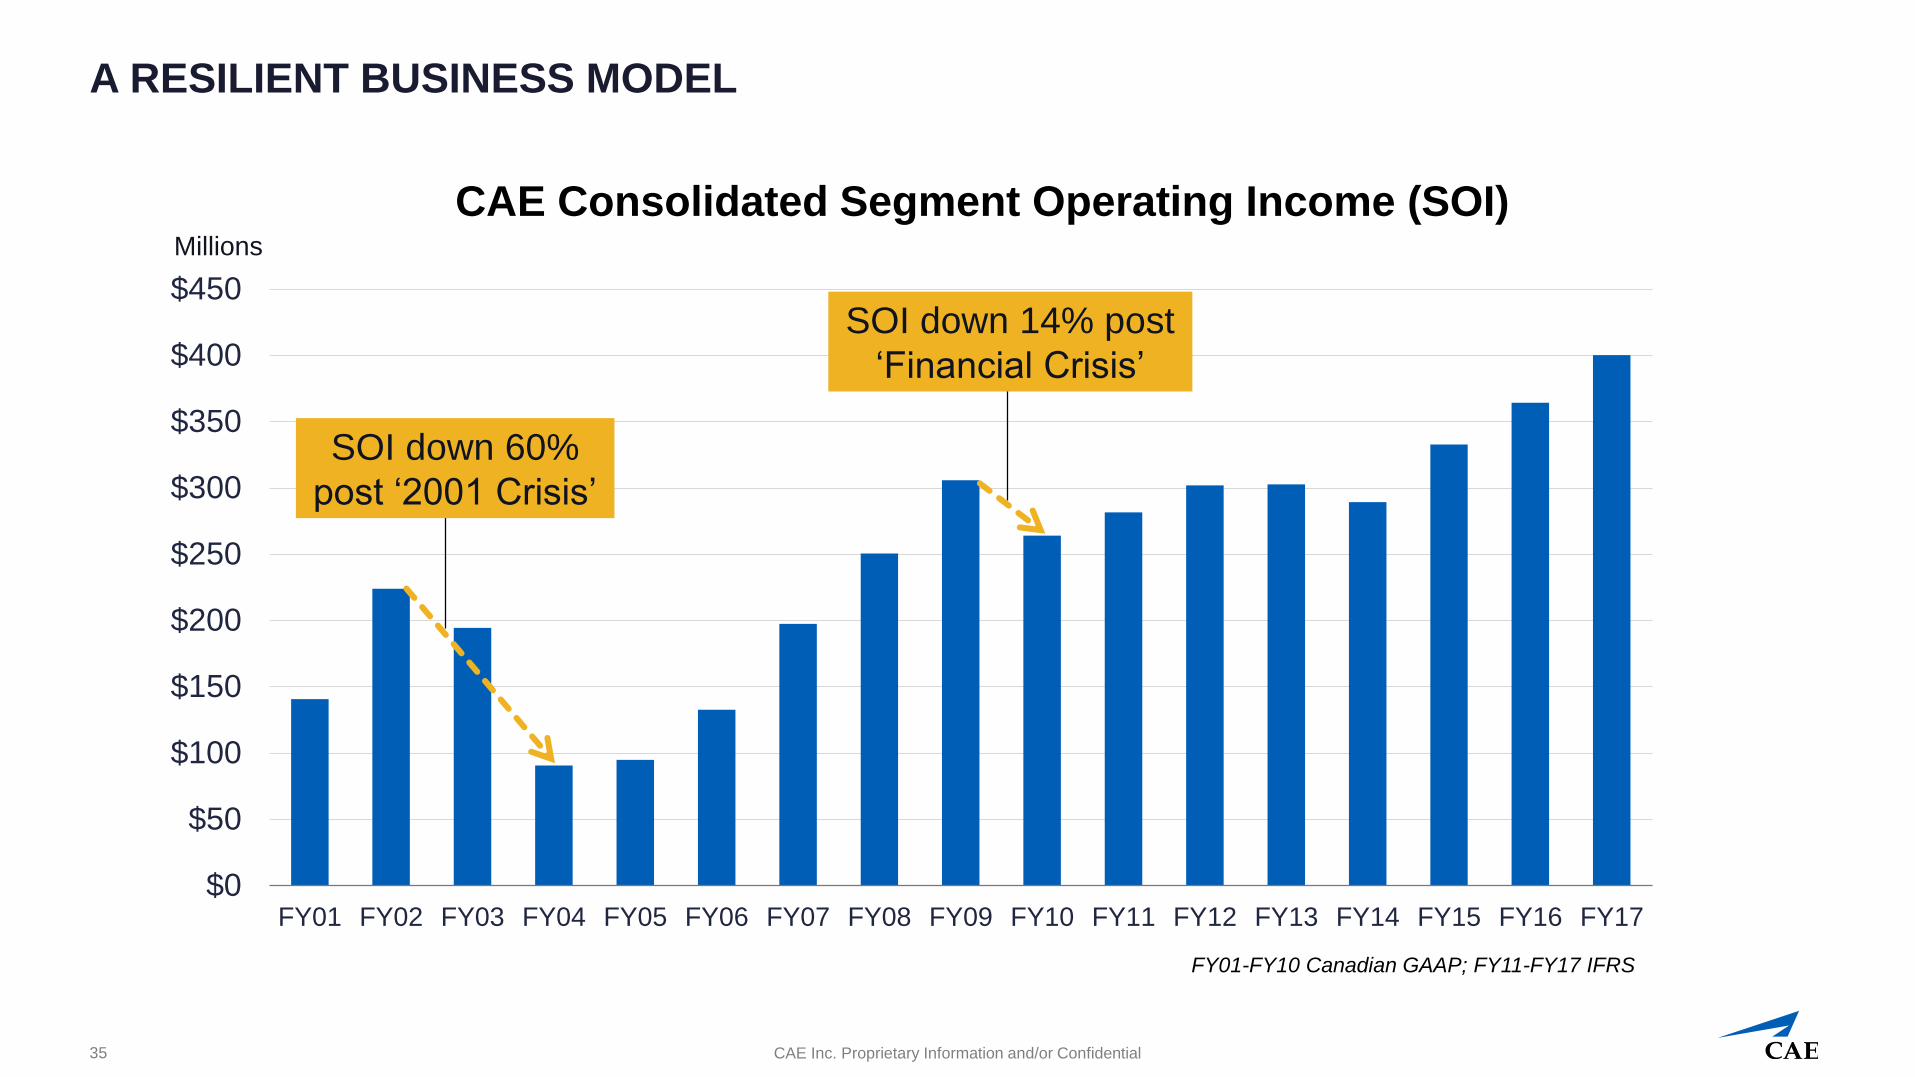
A RESILIENT BUSINESS MODEL
35
$0
$50
$100
$150
$200
$250
$300
$350
$400
$450
FY01 FY02 FY03 FY04 FY05 FY06 FY07 FY08 FY09 FY10 FY11 FY12 FY13 FY14 FY15 FY16 FY17
CAE Consolidated Segment Operating Income (SOI)Millions
FY01-FY10 Canadian GAAP; FY11-FY17 IFRS
SOI down 14% post
‘Financial Crisis’
SOI down 60%
post ‘2001 Crisis’

CAE Inc. Proprietary Information and/or Confidential
STRONG BACKLOG FOR ENHANCED VISIBILITY
36
$0.0
$1.0
$2.0
$3.0
$4.0
$5.0
$6.0
$7.0
$8.0
FY11 FY12 FY13 FY14 FY15 FY16 FY17
Civil Defence
Billion
Total Backlog
9% CAGR
16% CAGR
CAE Inc. Proprietary Information and/or Confidential
0%
2%
4%
6%
8%
10%
12%
14%
Q1 Q2 Q3 Q4 Q1 Q2 Q3 Q4 Q1 Q2 Q3 Q4 Q1 Q2 Q3 Q4 Q1 Q2 Q3 Q4
FY13 FY14 FY15 FY16 FY17
WACC ROCE
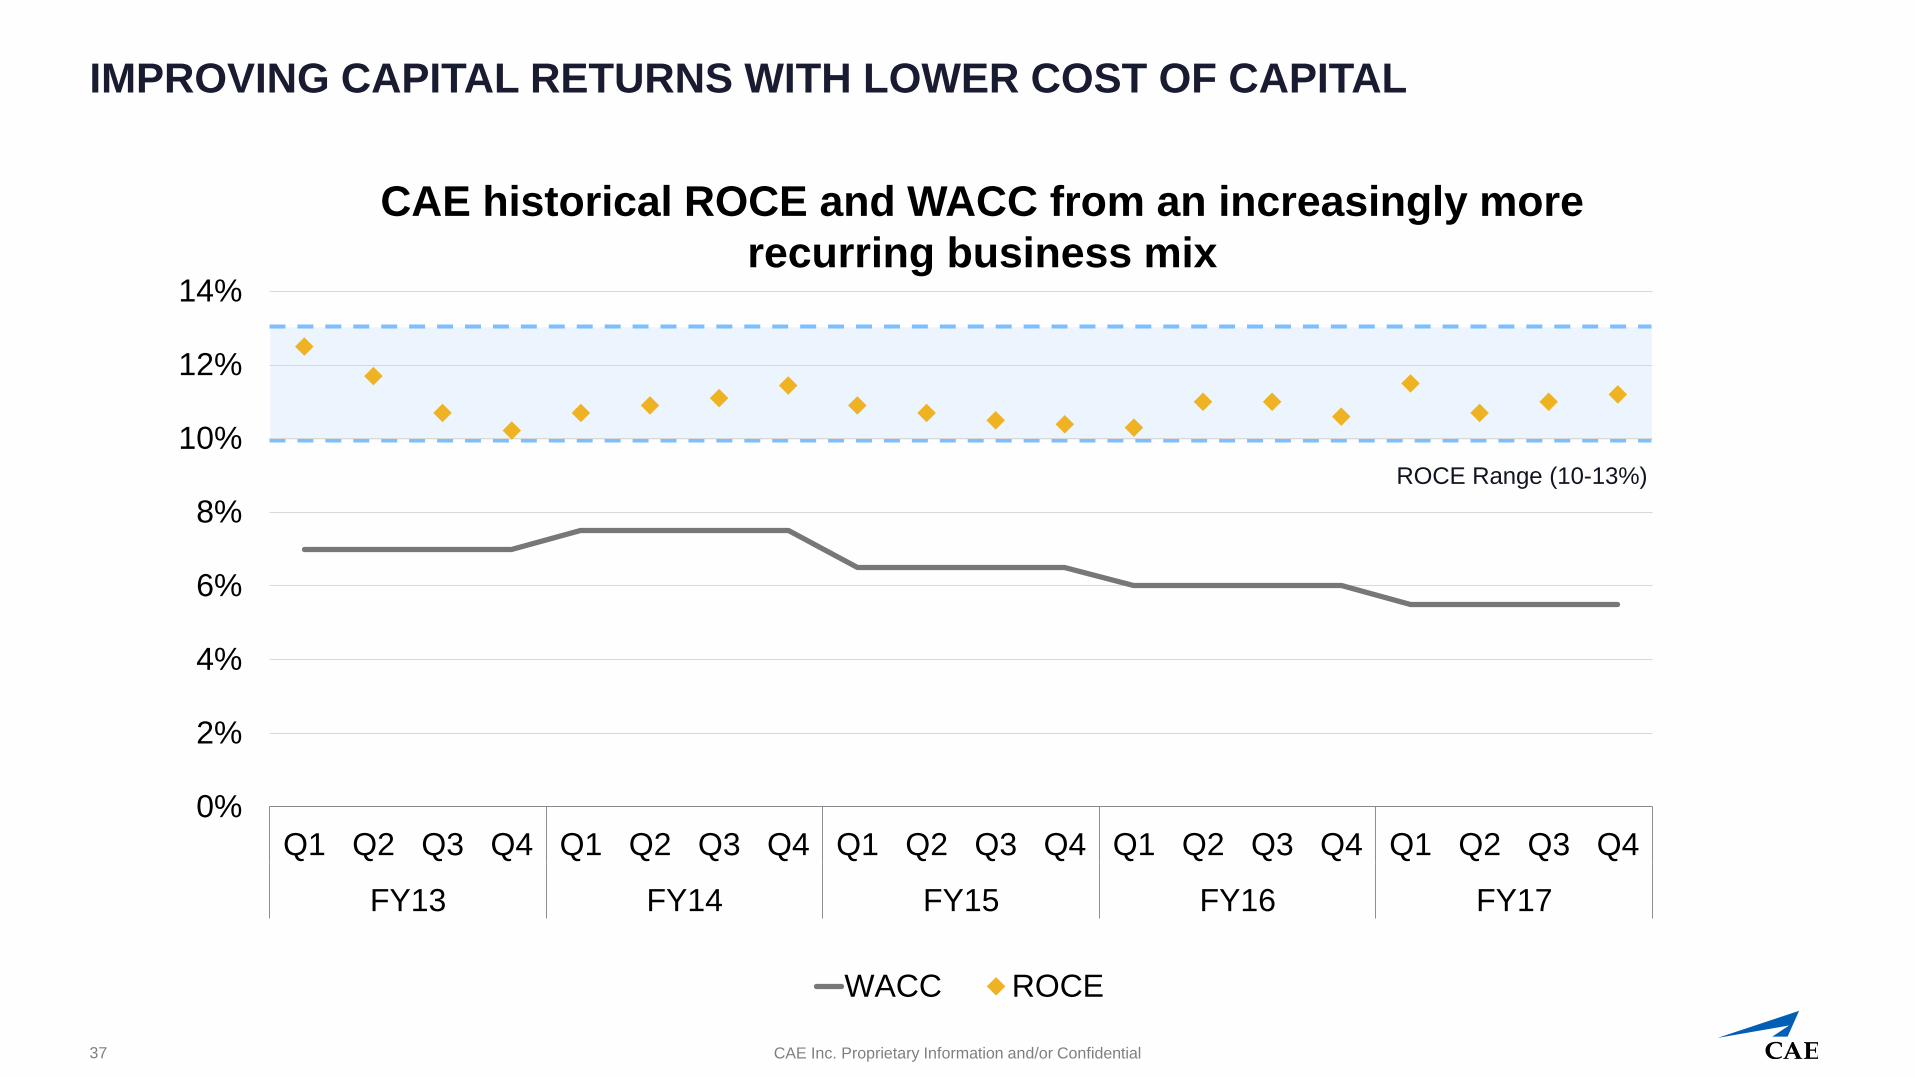
IMPROVING CAPITAL RETURNS WITH LOWER COST OF CAPITAL
37
CAE historical ROCE and WACC from an increasingly more
recurring business mix
ROCE Range (10-13%)
CAE Inc. Proprietary Information and/or Confidential
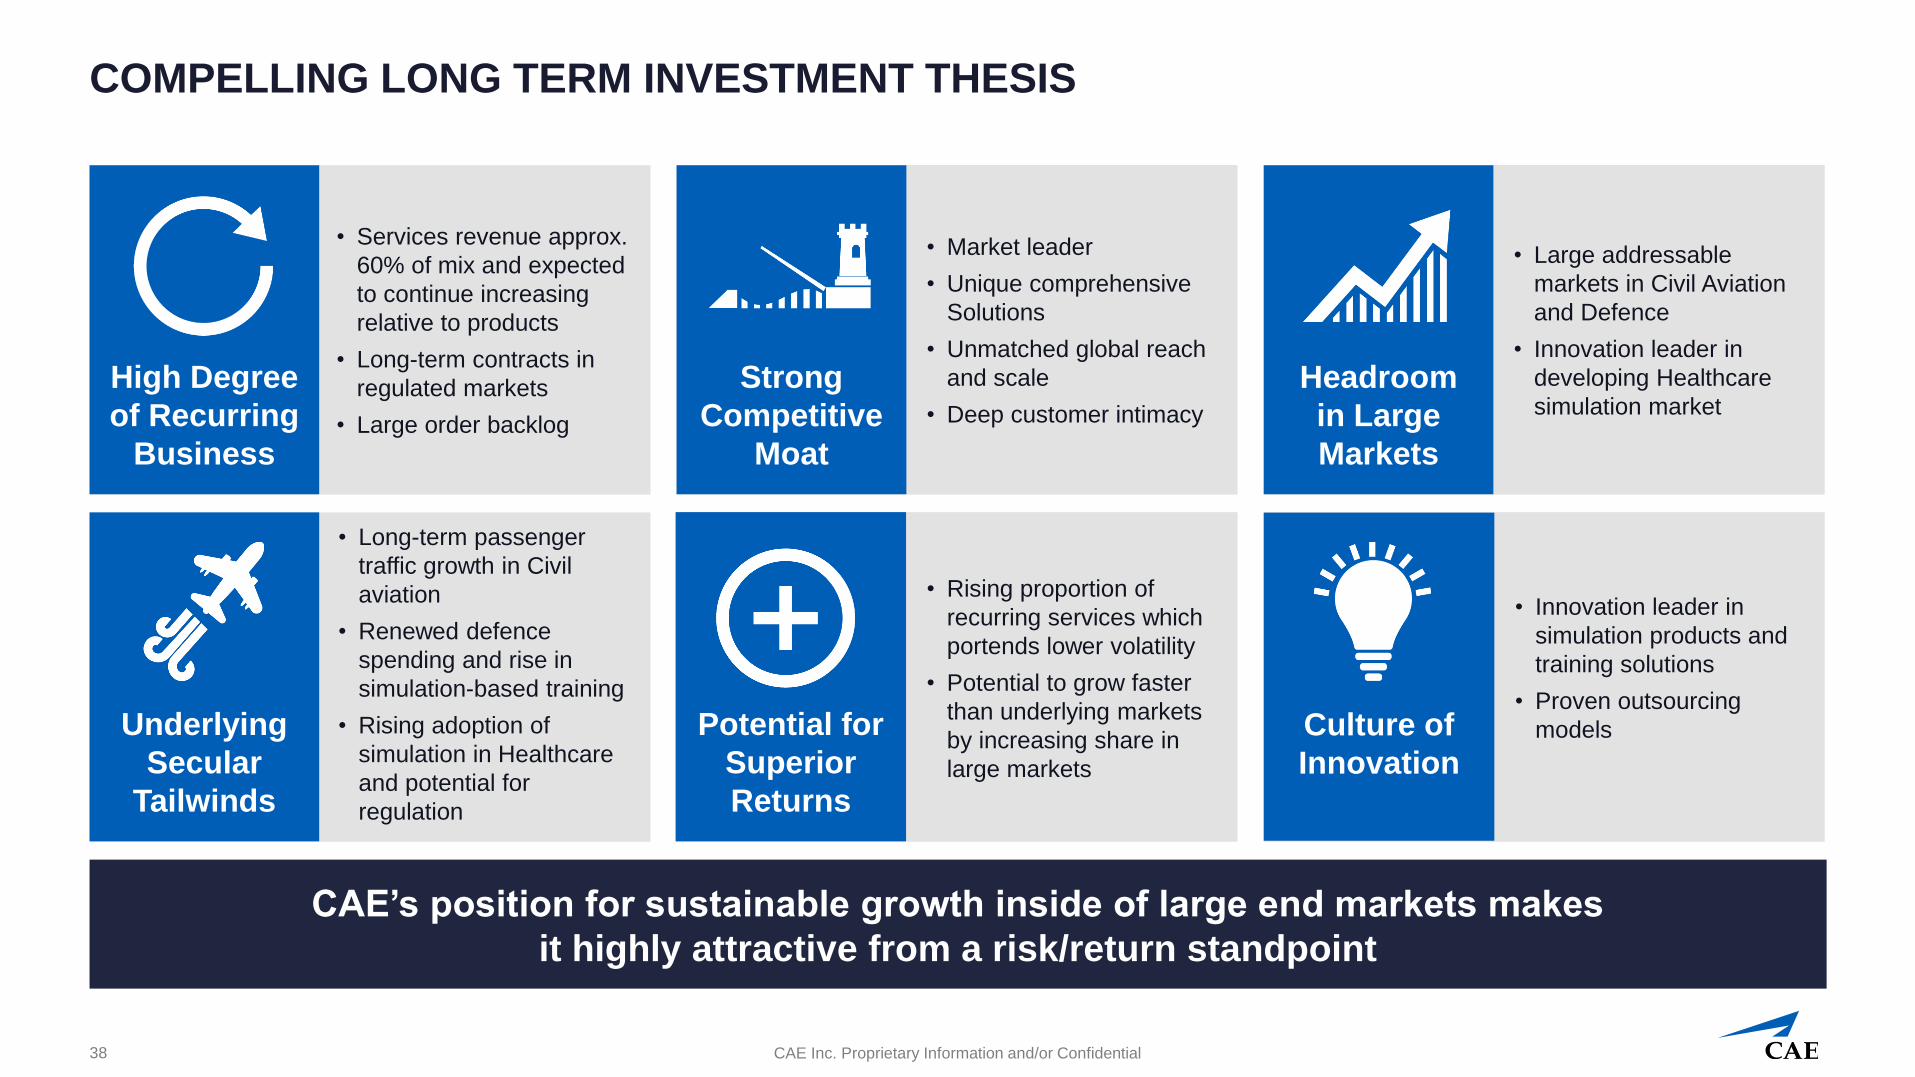
COMPELLING LONG TERM INVESTMENT THESIS
CAE’s position for sustainable growth inside of large end markets makes
it highly attractive from a risk/return standpoint
38
High Degree
of Recurring
Business
• Services revenue approx.
60% of mix and expected
to continue increasing
relative to products
• Long-term contracts in
regulated markets
• Large order backlog
• Market leader
• Unique comprehensive
Solutions
• Unmatched global reach
and scale
• Deep customer intimacy
• Large addressable
markets in Civil Aviation
and Defence
• Innovation leader in
developing Healthcare
simulation market
Underlying
Secular
Tailwinds
• Long-term passenger
traffic growth in Civil
aviation
• Renewed defence
spending and rise in
simulation-based training
• Rising adoption of
simulation in Healthcare
and potential for
regulation
Culture of
Innovation
Potential for
Superior
Returns
• Rising proportion of
recurring services which
portends lower volatility
• Potential to grow faster
than underlying markets
by increasing share in
large markets
• Innovation leader in
simulation products and
training solutions
• Proven outsourcing
models
Strong
Competitive
Moat
Headroom
in Large
Markets

CAE Inc. Proprietary Information and/or Confidential
OUTLOOK SUMMARY FY18
Continued good growth expected in FY18
39
▪ Generate low-double digit
percentage segment
operating income growth
▪ More progress to penetrate
training market with
innovative solutions
▪ Maintain leadership position
in FFS sales
▪ Mid to high single-digit
percentage growth
▪ Ramp up recently won
programs
▪ Continue to win fair share of
opportunities in a stronger
defence market
▪ Resume growth in FY18
▪ Increased sales coming from
opportunities pipeline and
launch of new products,
which it expects to put it on
course for long-term, double-
digit growth
CIVIL DEFENCE AND SECURITY HEALTHCARE

Your worldwide
training partner
of choice
Appendix
CAE Inc. Proprietary Information and/or Confidential
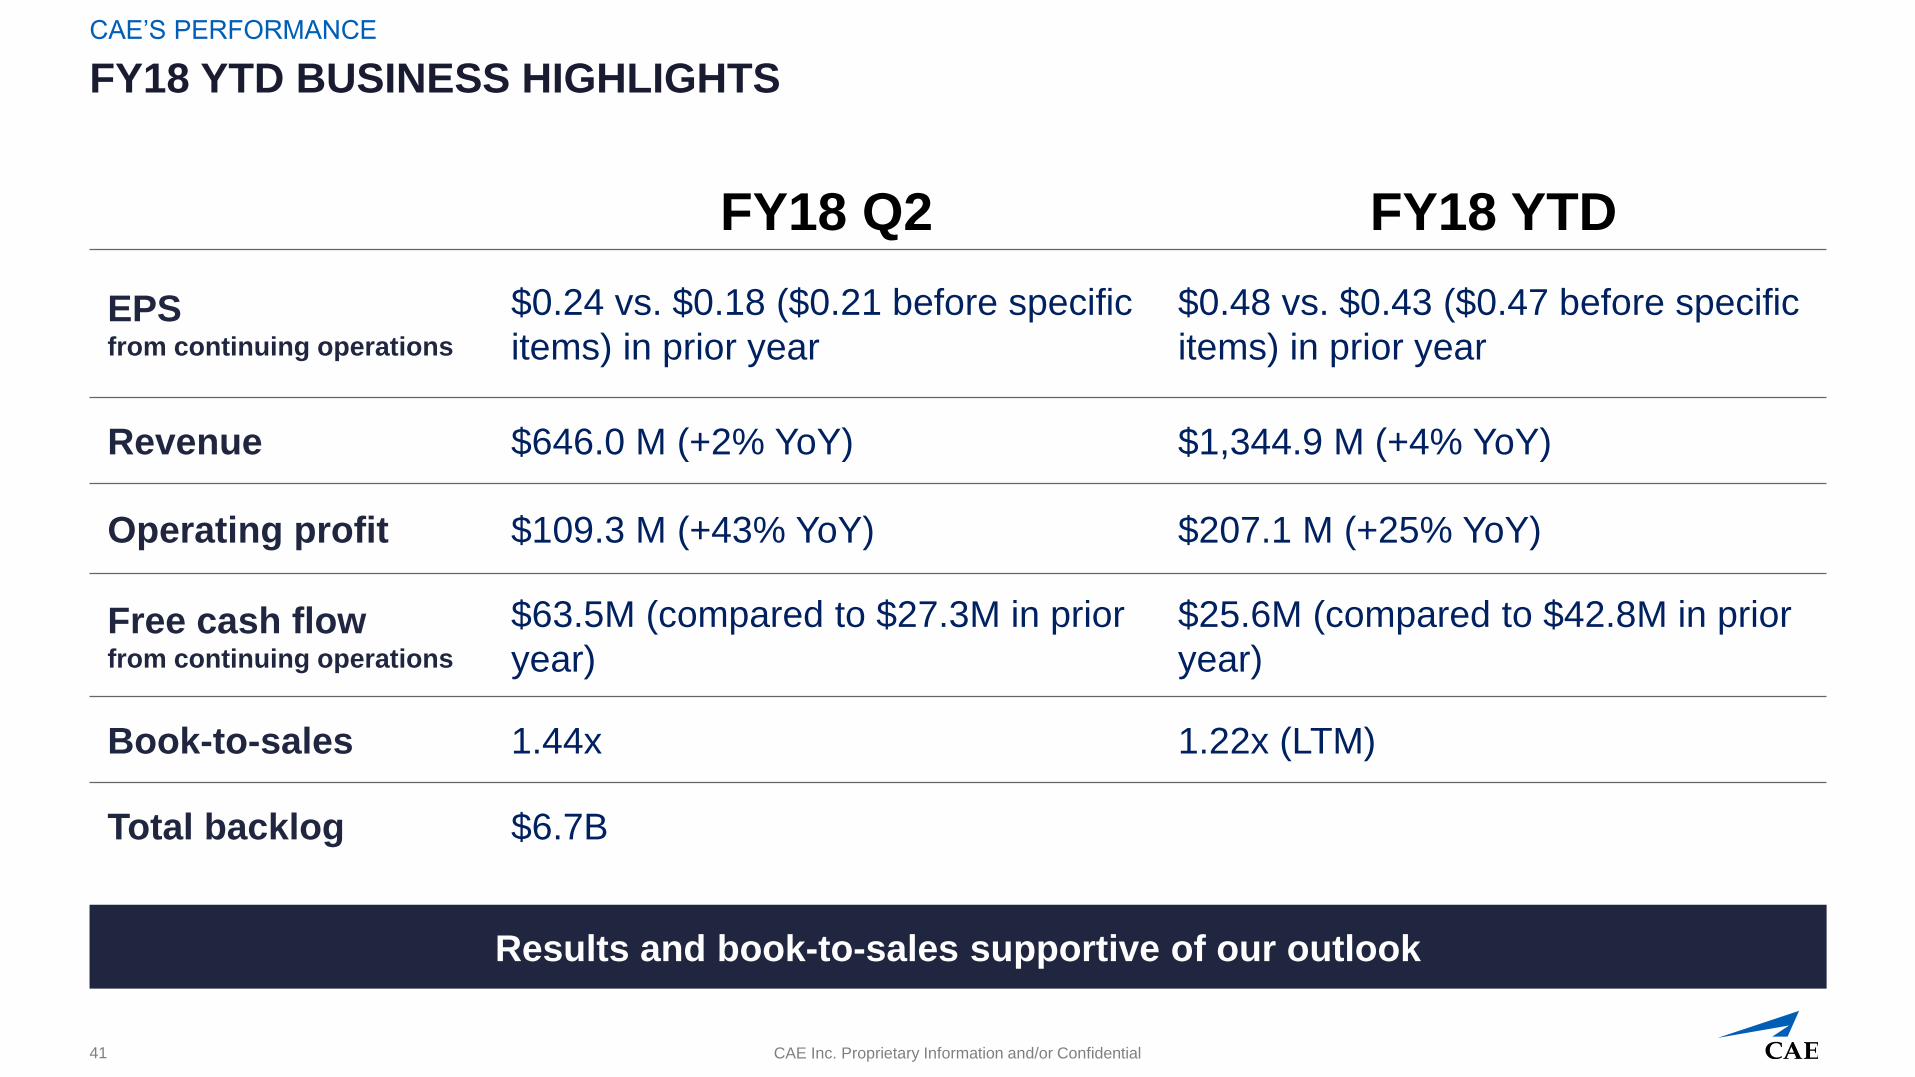
FY18 YTD BUSINESS HIGHLIGHTS
CAE’S PERFORMANCE
Results and book-to-sales supportive of our outlook
41
FY18 Q2 FY18 YTD
EPS from continuing operations
$0.24 vs. $0.18 ($0.21 before specific
items) in prior year
$0.48 vs. $0.43 ($0.47 before specific
items) in prior year
Revenue $646.0 M (+2% YoY) $1,344.9 M (+4% YoY)
Operating profit $109.3 M (+43% YoY) $207.1 M (+25% YoY)
Free cash flowfrom continuing operations
$63.5M (compared to $27.3M in prior
year)
$25.6M (compared to $42.8M in prior
year)
Book-to-sales 1.44x 1.22x (LTM)
Total backlog $6.7B

CAE Inc. Proprietary Information and/or Confidential
CONSOLIDATED FINANCIAL RESULTS
FY18 Q2
42
Summary of Consolidated Results(amounts in millions, except per share amounts)
Three months ended September 30
2017 2016
Revenue $ 646.0 $ 635.5
Gross profit 188.0 186.9
Operating profit 109.3 76.2
As % of revenue 16.9% 12.0%
Earnings from continuing operations 67.0 48.8
Net income attributable to equity holders of the Company 65.2 48.4
Basic and Diluted EPS from continuing operations attributable to equity
holders of the Company 0.24 0.18
Basic and Diluted EPS from continuing operations attributable to equity
holders of the Company – before specific items0.24 0.21

CAE Inc. Proprietary Information and/or Confidential
CONSOLIDATED FINANCIAL RESULTS
FY18 YTD
43
Summary of Consolidated Results(amounts in millions, except per share amounts)
Six months ended September 30
2017 2016
Revenue $ 1,344.9 $ 1,287.1
Gross profit 400.7 376.9
Operating profit 207.1 165.2
As % of revenue 15.4% 12.8%
Earnings from continuing operations 132.4 118.2
Net income attributable to equity holders of the Company 129.0 117.0
Basic and Diluted EPS from continuing operations attributable to equity
holders of the Company 0.48 0.43
Basic and Diluted EPS from continuing operations attributable to equity
holders of the Company – before specific items0.48 0.47

CAE Inc. Proprietary Information and/or Confidential
CASH MOVEMENTS
FY18 Q2
44
Consolidated Cash Movements(amounts in millions)
Three months ended September 30
2017 2016
Cash provided by continuing operating activities(before changes in non-cash W/C)
$ 107.2 $ 87.1
Changes in non-cash working capital (10.1) (30.6)
Maintenance capex and others assets (17.2) (8.8)
Proceeds from the disposal of property, plant and equipment 10.8 1.2
Net proceeds from (payments to) equity accounted investees (4.0) (2.7)
Dividends received from equity accounted investees - 1.4
Dividends paid (23.2) (20.3)
Free cash flow from continuing operations 63.5 27.3

CAE Inc. Proprietary Information and/or Confidential
CASH MOVEMENTS
FY18 YTD
45
Consolidated Cash Movements(amounts in millions)
Six months ended September 30
2017 2016
Cash provided by continuing operating activities(before changes in non-cash W/C)
$ 198.2 $ 193.9
Changes in non-cash working capital (120.3) (83.2)
Maintenance capex and others assets (37.1) (24.9)
Proceeds from the disposal of property, plant and equipment 15.9 2.3
Net proceeds from (payments to) equity accounted investees (4.0) (8.8)
Dividends received from equity accounted investees 17.1 2.8
Dividends paid (44.2) (39.3)
Free cash flow from continuing operations 25.6 42.8


