25
Investor Presentation Dec 2019
Investor Presentation Dec 2019
o Bank Muscat Introduction
o Operating Environment
o Bank Muscat Business – Overview
o Financial Performance
o Annexure
23‐Feb‐20 2
Contents
Note: The financial information is updated as of 31st Dec 2019, unless stated otherwise.
23‐Feb‐20 3
Bank Muscat Introduction
23‐Feb‐20 4
Bank Muscat at a glanceOverview
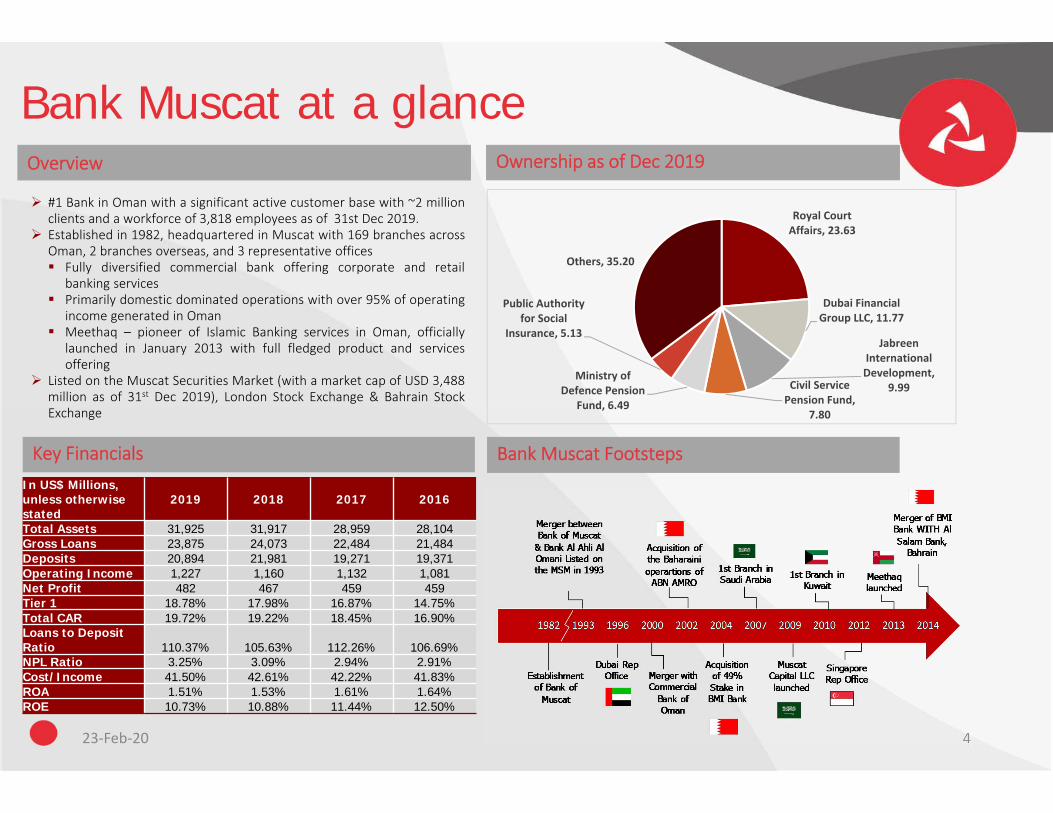
#1 Bank in Oman with a significant active customer base with ~2 millionclients and a workforce of 3,818 employees as of 31st Dec 2019.
Established in 1982, headquartered in Muscat with 169 branches acrossOman, 2 branches overseas, and 3 representative offices Fully diversified commercial bank offering corporate and retail
banking services Primarily domestic dominated operations with over 95% of operating
income generated in Oman Meethaq – pioneer of Islamic Banking services in Oman, officially
launched in January 2013 with full fledged product and servicesoffering
Listed on the Muscat Securities Market (with a market cap of USD 3,488million as of 31st Dec 2019), London Stock Exchange & Bahrain StockExchange
Ownership as of Dec 2019
Key Financials Bank Muscat Footsteps
Royal Court Affairs, 23.63
Dubai Financial Group LLC, 11.77
Jabreen International Development,
9.99Civil Service Pension Fund,
7.80
Ministry of Defence Pension
Fund, 6.49
Public Authority for Social
Insurance, 5.13
Others, 35.20
In US$ Millions, unless otherwise stated
2019 2018 2017 2016
Total Assets 31,925 31,917 28,959 28,104Gross Loans 23,875 24,073 22,484 21,484Deposits 20,894 21,981 19,271 19,371Operating Income 1,227 1,160 1,132 1,081Net Profit 482 467 459 459Tier 1 18.78% 17.98% 16.87% 14.75%Total CAR 19.72% 19.22% 18.45% 16.90%Loans to Deposit Ratio 110.37% 105.63% 112.26% 106.69%NPL Ratio 3.25% 3.09% 2.94% 2.91%Cost/Income 41.50% 42.61% 42.22% 41.83%ROA 1.51% 1.53% 1.61% 1.64%ROE 10.73% 10.88% 11.44% 12.50%
23‐Feb‐20 5
Bank Muscat – Key Highlights
Management
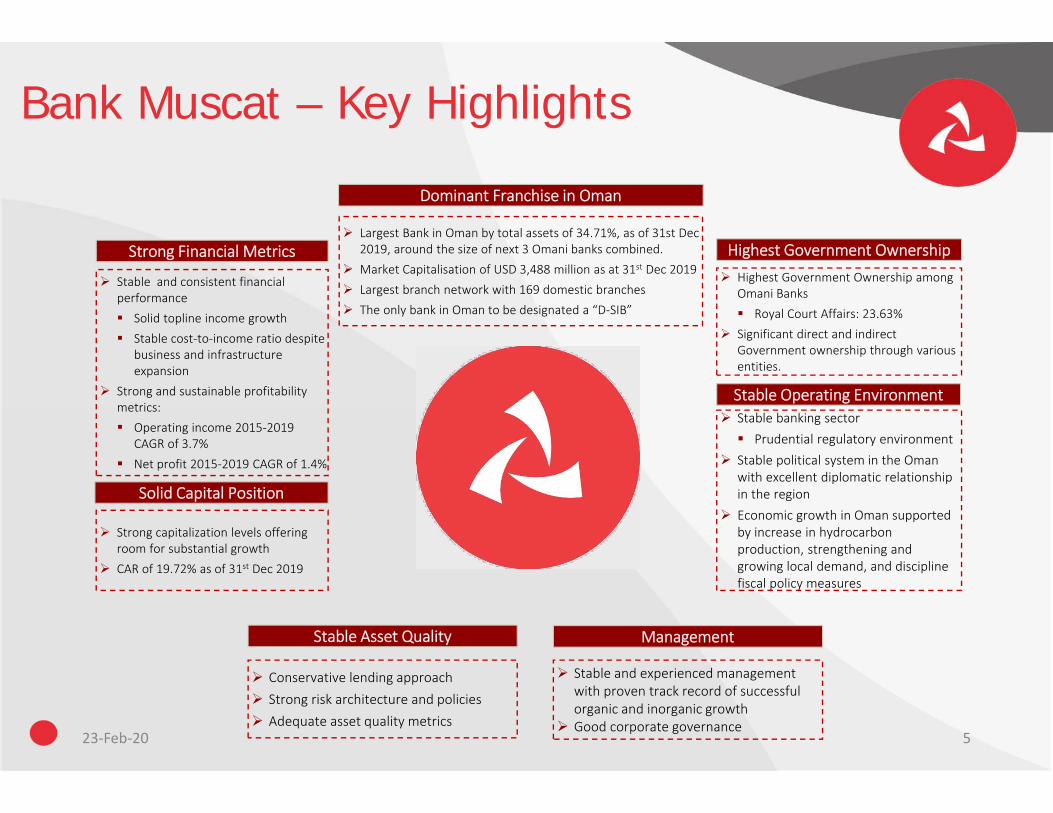
Largest Bank in Oman by total assets of 34.71%, as of 31st Dec 2019, around the size of next 3 Omani banks combined.
Market Capitalisation of USD 3,488 million as at 31st Dec 2019 Largest branch network with 169 domestic branches The only bank in Oman to be designated a “D‐SIB”
Strong Financial Metrics
Stable Operating Environment
Highest Government Ownership
Dominant Franchise in Oman
Highest Government Ownership among Omani Banks Royal Court Affairs: 23.63%
Significant direct and indirect Government ownership through various entities.
Stable and consistent financial performance Solid topline income growth Stable cost‐to‐income ratio despite
business and infrastructure expansion
Strong and sustainable profitability metrics: Operating income 2015‐2019
CAGR of 3.7% Net profit 2015‐2019 CAGR of 1.4%
Stable banking sector Prudential regulatory environment
Stable political system in the Oman with excellent diplomatic relationship in the region
Economic growth in Oman supported by increase in hydrocarbon production, strengthening and growing local demand, and discipline fiscal policy measures
Stable and experienced management with proven track record of successful organic and inorganic growth
Good corporate governance
Solid Capital Position
Strong capitalization levels offering room for substantial growth
CAR of 19.72% as of 31st Dec 2019
Stable Asset Quality
Conservative lending approach Strong risk architecture and policies Adequate asset quality metrics
23‐Feb‐20 6
Operating Environment
23‐Feb‐20 7
Sultanate of Oman - OverviewOverview
GDP Growth GDP Composition as of Sep 2019
(1) Source: National Center for Statistics (Nov ’19), Rating Reports: Moody’s and S&P as of Apr 2019
Oman
SaudiArabia
UAEQatar
Bahrain
Kuwait
Source: IMF & World Bank as of Oct 2019
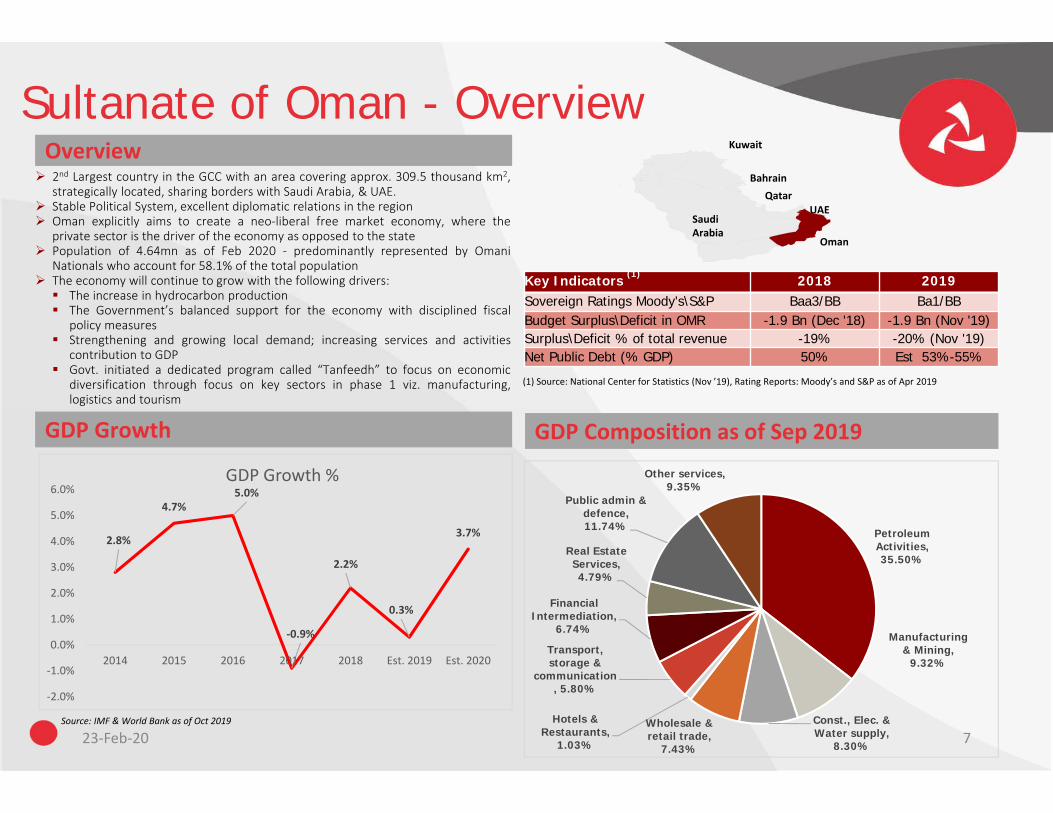
2nd Largest country in the GCC with an area covering approx. 309.5 thousand km2,strategically located, sharing borders with Saudi Arabia, & UAE.
Stable Political System, excellent diplomatic relations in the region Oman explicitly aims to create a neo‐liberal free market economy, where the
private sector is the driver of the economy as opposed to the state Population of 4.64mn as of Feb 2020 ‐ predominantly represented by Omani
Nationals who account for 58.1% of the total population The economy will continue to grow with the following drivers: The increase in hydrocarbon production The Government’s balanced support for the economy with disciplined fiscal
policy measures Strengthening and growing local demand; increasing services and activities
contribution to GDP Govt. initiated a dedicated program called “Tanfeedh” to focus on economic
diversification through focus on key sectors in phase 1 viz. manufacturing,logistics and tourism
Key Indicators (1) 2018 2019Sovereign Ratings Moody's\S&P Baa3/BB Ba1/BBBudget Surplus\Deficit in OMR -1.9 Bn (Dec '18) -1.9 Bn (Nov '19)Surplus\Deficit % of total revenue -19% -20% (Nov '19)Net Public Debt (% GDP) 50% Est 53%-55%
Petroleum Activities, 35.50%
Manufacturing & Mining,
9.32%
Const., Elec. & Water supply,
8.30%
Wholesale & retail trade,
7.43%
Hotels & Restaurants,
1.03%
Transport, storage &
communication, 5.80%
Financial Intermediation,
6.74%
Real Estate Services, 4.79%
Public admin & defence, 11.74%
Other services, 9.35%
2.8%
4.7%5.0%
‐0.9%
2.2%
0.3%
3.7%
‐2.0%
‐1.0%
0.0%
1.0%
2.0%
3.0%
4.0%
5.0%
6.0%
2014 2015 2016 2017 2018 Est. 2019 Est. 2020
GDP Growth %
23‐Feb‐20 8
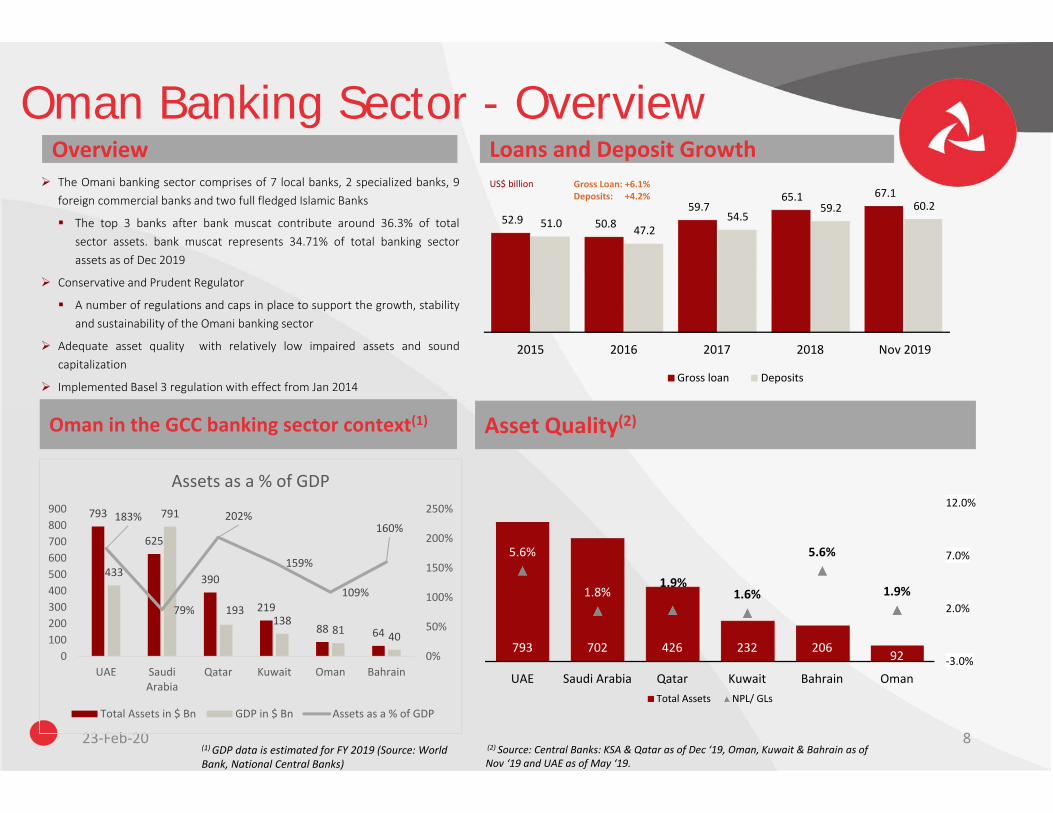
Oman Banking Sector - OverviewOverview The Omani banking sector comprises of 7 local banks, 2 specialized banks, 9
foreign commercial banks and two full fledged Islamic Banks
The top 3 banks after bank muscat contribute around 36.3% of totalsector assets. bank muscat represents 34.71% of total banking sectorassets as of Dec 2019
Conservative and Prudent Regulator
A number of regulations and caps in place to support the growth, stabilityand sustainability of the Omani banking sector
Adequate asset quality with relatively low impaired assets and soundcapitalization
Implemented Basel 3 regulation with effect from Jan 2014
Loans and Deposit Growth Gross Loan: +6.1%Deposits: +4.2%
US$ billion
Oman in the GCC banking sector context(1) Asset Quality(2)
793
625
390
219
88 64
433
791
193138
81 40
183%
79%
202%
159%
109%
160%
0%
50%
100%
150%
200%
250%
0100200300400500600700800900
UAE SaudiArabia
Qatar Kuwait Oman Bahrain
Assets as a % of GDP
Total Assets in $ Bn GDP in $ Bn Assets as a % of GDP
(2) Source: Central Banks: KSA & Qatar as of Dec ‘19, Oman, Kuwait & Bahrain as of Nov ‘19 and UAE as of May ‘19.
(1) GDP data is estimated for FY 2019 (Source: World Bank, National Central Banks)
793 702 426 232 206 92
5.6%
1.8%1.9%
1.6%
5.6%
1.9%
‐3.0%
2.0%
7.0%
12.0%
UAE Saudi Arabia Qatar Kuwait Bahrain OmanTotal Assets NPL/ GLs
52.9 50.8 59.7
65.1 67.1
51.0 47.2 54.5
59.2 60.2
2015 2016 2017 2018 Nov 2019
Gross loan Deposits
23‐Feb‐20 9
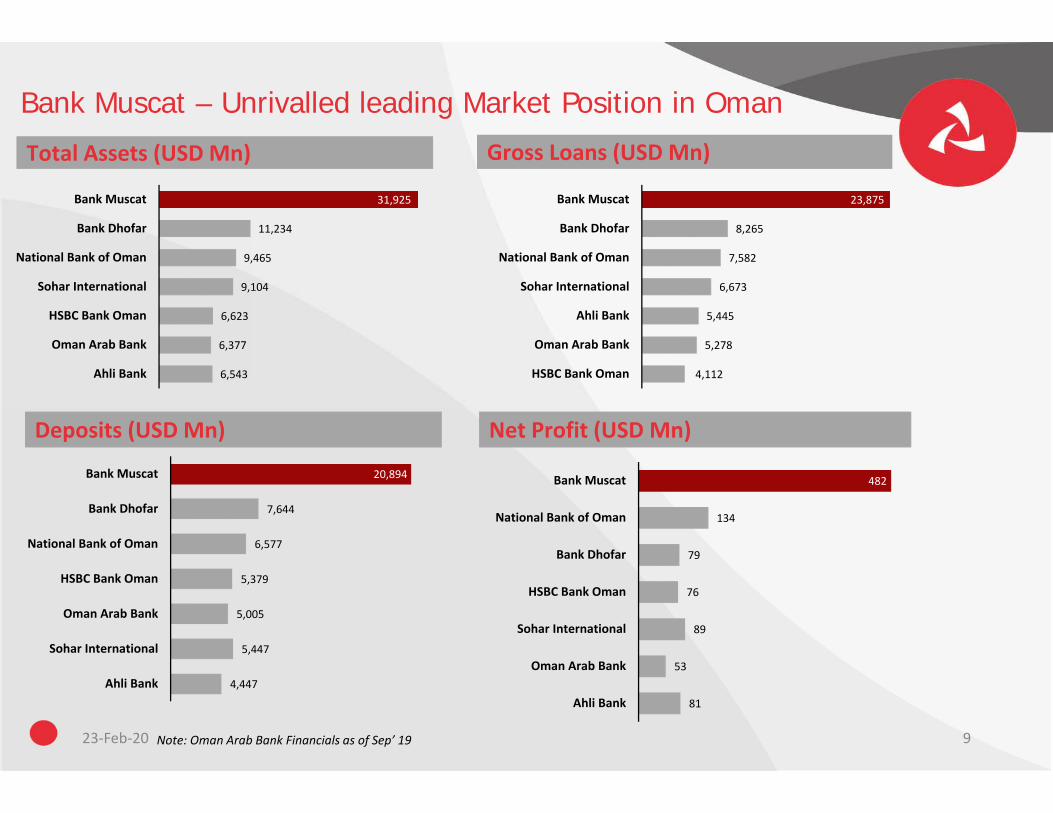
Bank Muscat – Unrivalled leading Market Position in Oman
Total Assets (USD Mn) Gross Loans (USD Mn)
Deposits (USD Mn) Net Profit (USD Mn)
Note: Oman Arab Bank Financials as of Sep’ 19
6,543
6,377
6,623
9,104
9,465
11,234
31,925
Ahli Bank
Oman Arab Bank
HSBC Bank Oman
Sohar International
National Bank of Oman
Bank Dhofar
Bank Muscat
4,112
5,278
5,445
6,673
7,582
8,265
23,875
HSBC Bank Oman
Oman Arab Bank
Ahli Bank
Sohar International
National Bank of Oman
Bank Dhofar
Bank Muscat
81
53
89
76
79
134
482
Ahli Bank
Oman Arab Bank
Sohar International
HSBC Bank Oman
Bank Dhofar
National Bank of Oman
Bank Muscat
4,447
5,447
5,005
5,379
6,577
7,644
20,894
Ahli Bank
Sohar International
Oman Arab Bank
HSBC Bank Oman
National Bank of Oman
Bank Dhofar
Bank Muscat
23‐Feb‐20 10
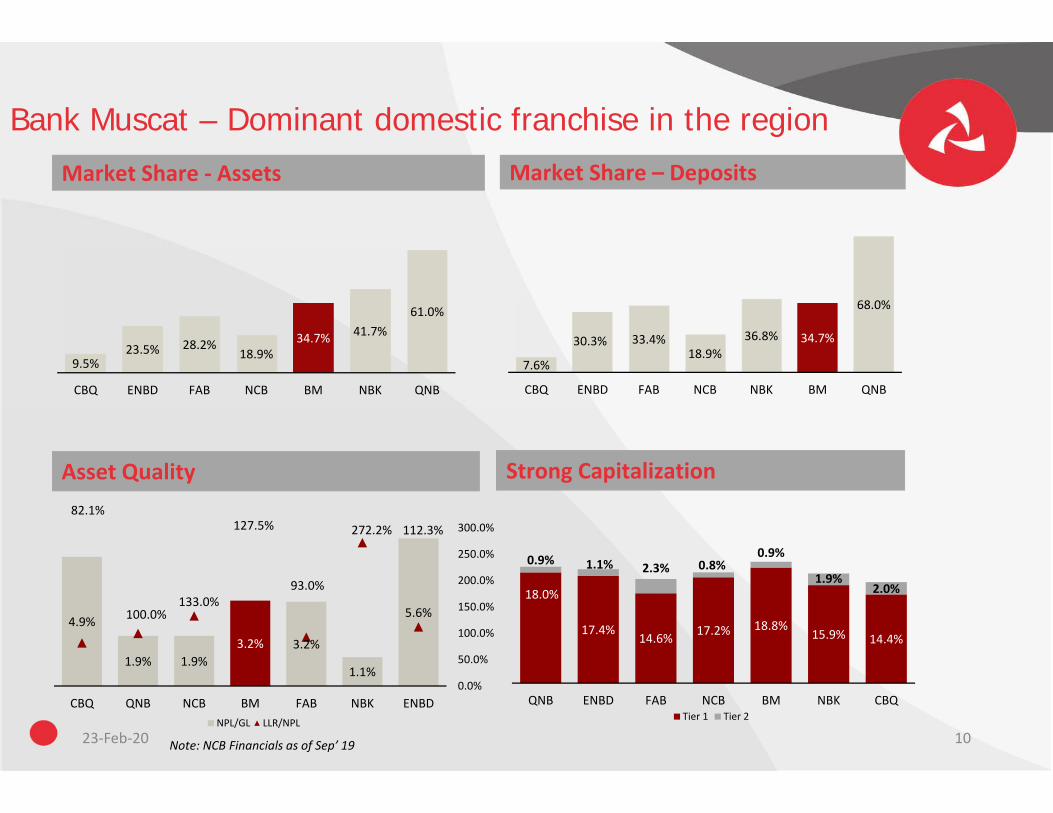
Bank Muscat – Dominant domestic franchise in the region
Market Share ‐ Assets Market Share – Deposits
Asset Quality Strong Capitalization
7.6%
30.3% 33.4%18.9%
36.8% 34.7%
68.0%
CBQ ENBD FAB NCB NBK BM QNB
4.9%
1.9% 1.9%3.2% 3.2%
1.1%
5.6%
82.1%
100.0%133.0%
127.5%
93.0%
272.2% 112.3%
0.0%
50.0%
100.0%
150.0%
200.0%
250.0%
300.0%
CBQ QNB NCB BM FAB NBK ENBDNPL/GL LLR/NPL
Note: NCB Financials as of Sep’ 19
18.0%
17.4%14.6% 17.2% 18.8%
15.9% 14.4%
0.9% 1.1% 2.3% 0.8%0.9%
1.9%2.0%
QNB ENBD FAB NCB BM NBK CBQTier 1 Tier 2
9.5%23.5% 28.2%
18.9%34.7% 41.7%
61.0%
CBQ ENBD FAB NCB BM NBK QNB
23‐Feb‐20 11
Bank Muscat Business Overview
23‐Feb‐20 12
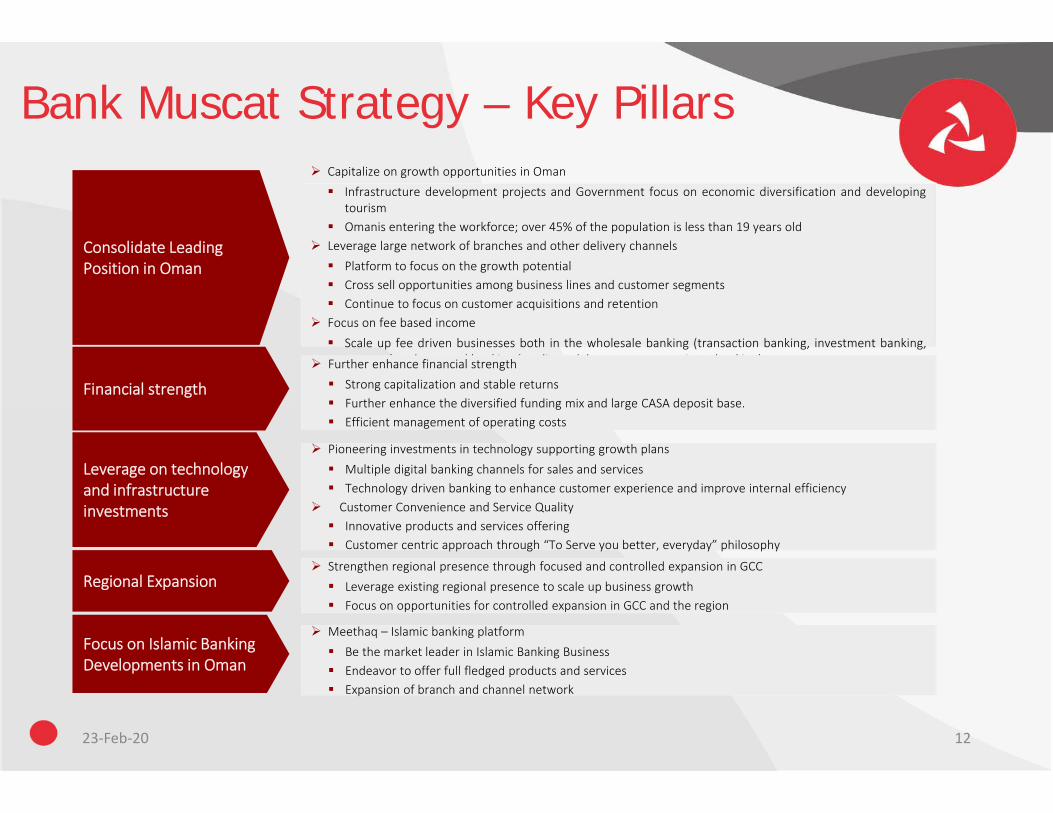
Bank Muscat Strategy – Key Pillars
Consolidate Leading Position in Oman
Capitalize on growth opportunities in Oman Infrastructure development projects and Government focus on economic diversification and developing
tourism Omanis entering the workforce; over 45% of the population is less than 19 years old
Leverage large network of branches and other delivery channels Platform to focus on the growth potential Cross sell opportunities among business lines and customer segments Continue to focus on customer acquisitions and retention
Focus on fee based income Scale up fee driven businesses both in the wholesale banking (transaction banking, investment banking,
treasury) and personal banking (credit card, bancassurance, private banking)
Leverage on technology and infrastructure investments
Pioneering investments in technology supporting growth plans Multiple digital banking channels for sales and services Technology driven banking to enhance customer experience and improve internal efficiency
Customer Convenience and Service Quality Innovative products and services offering Customer centric approach through “To Serve you better, everyday” philosophy
Regional Expansion Strengthen regional presence through focused and controlled expansion in GCC Leverage existing regional presence to scale up business growth Focus on opportunities for controlled expansion in GCC and the region
Focus on Islamic Banking Developments in Oman
Meethaq – Islamic banking platform Be the market leader in Islamic Banking Business Endeavor to offer full fledged products and services Expansion of branch and channel network
Financial strength Further enhance financial strength Strong capitalization and stable returns Further enhance the diversified funding mix and large CASA deposit base. Efficient management of operating costs
23‐Feb‐20 13
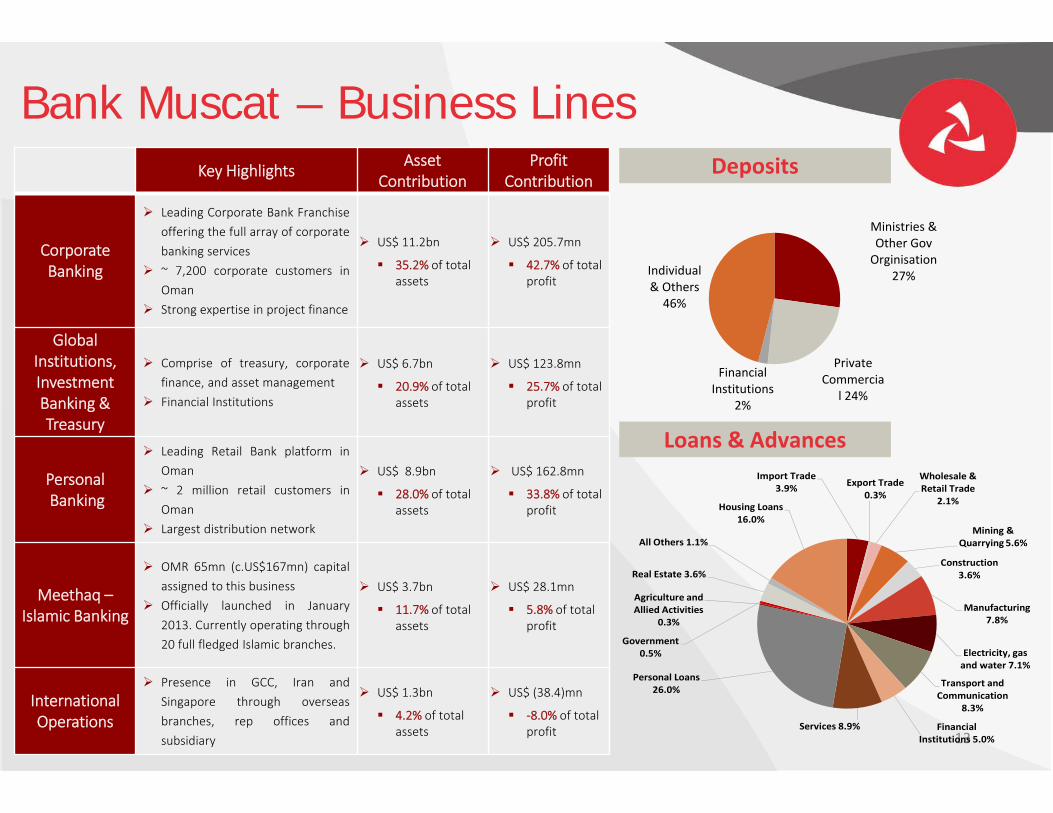
Bank Muscat – Business LinesKey Highlights Asset
ContributionProfit
Contribution
Corporate Banking
Leading Corporate Bank Franchiseoffering the full array of corporatebanking services
~ 7,200 corporate customers inOman
Strong expertise in project finance
US$ 11.2bn
35.2% of total assets
US$ 205.7mn
42.7% of total profit
GlobalInstitutions,InvestmentBanking & Treasury
Comprise of treasury, corporatefinance, and asset management
Financial Institutions
US$ 6.7bn
20.9% of total assets
US$ 123.8mn
25.7% of total profit
PersonalBanking
Leading Retail Bank platform inOman
~ 2 million retail customers inOman
Largest distribution network
US$ 8.9bn
28.0% of total assets
US$ 162.8mn
33.8% of total profit
Meethaq –Islamic Banking
OMR 65mn (c.US$167mn) capitalassigned to this business
Officially launched in January2013. Currently operating through20 full fledged Islamic branches.
US$ 3.7bn
11.7% of total assets
US$ 28.1mn
5.8% of total profit
International Operations
Presence in GCC, Iran andSingapore through overseasbranches, rep offices andsubsidiary
US$ 1.3bn
4.2% of total assets
US$ (38.4)mn
‐8.0% of total profit
Deposits
Loans & Advances
Ministries & Other Gov Orginisation
27%
Private Commercia
l 24%
Financial Institutions
2%
Individual & Others46%
Import Trade3.9% Export Trade
0.3%
Wholesale & Retail Trade
2.1%
Mining & Quarrying 5.6%
Construction3.6%
Manufacturing7.8%
Electricity, gas and water 7.1%
Transport and Communication
8.3%
Financial Institutions 5.0%
Services 8.9%
Personal Loans26.0%
Agriculture and Allied Activities
0.3%
Government0.5%
Real Estate 3.6%
All Others 1.1%
Housing Loans16.0%
23‐Feb‐20 14
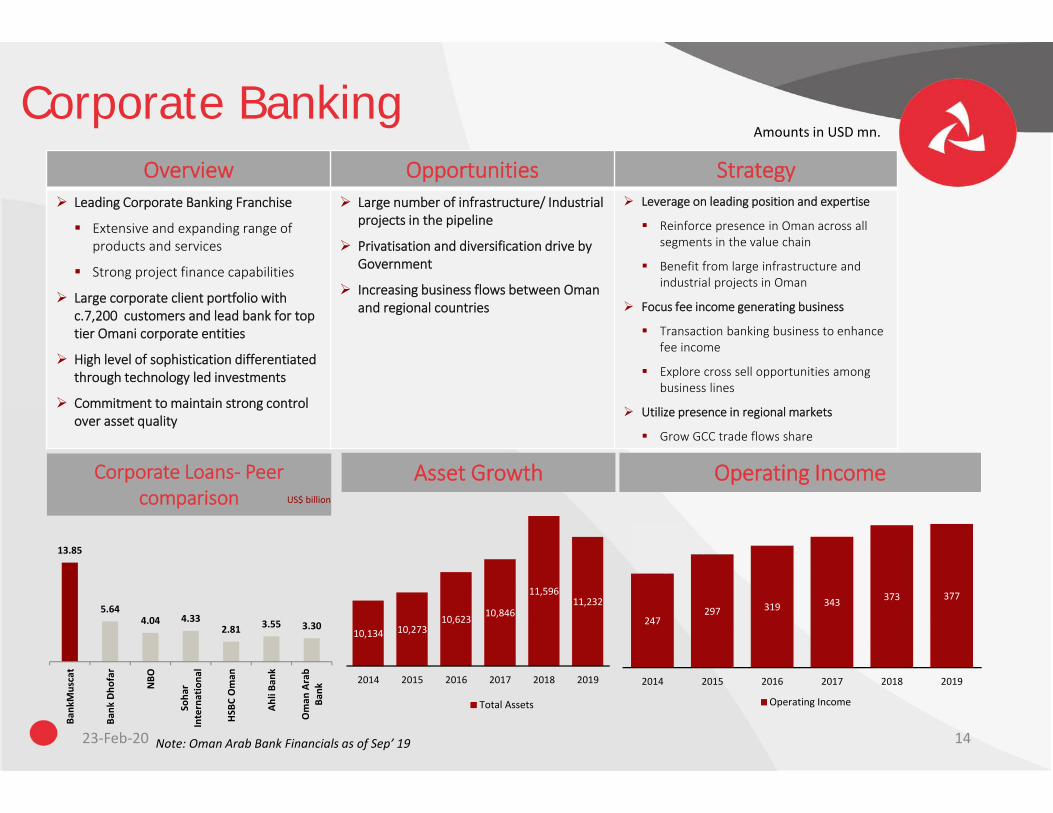
Corporate BankingAmounts in USD mn.
Overview Opportunities Strategy Leading Corporate Banking Franchise
Extensive and expanding range of products and services
Strong project finance capabilities
Large corporate client portfolio with c.7,200 customers and lead bank for top tier Omani corporate entities
High level of sophistication differentiated through technology led investments
Commitment to maintain strong control over asset quality
Large number of infrastructure/ Industrial projects in the pipeline
Privatisation and diversification drive by Government
Increasing business flows between Oman and regional countries
Leverage on leading position and expertise
Reinforce presence in Oman across all segments in the value chain
Benefit from large infrastructure and industrial projects in Oman
Focus fee income generating business
Transaction banking business to enhance fee income
Explore cross sell opportunities among business lines
Utilize presence in regional markets
Grow GCC trade flows share
Corporate Loans‐ Peer comparison
Asset Growth Operating IncomeUS$ billion
Note: Oman Arab Bank Financials as of Sep’ 19
13.85
5.644.04 4.33
2.81 3.55 3.30
Bank
Muscat
Bank
Dho
far
NBO
Soha
rInternationa
l
HSB
C Oman
Ahli Ba
nk
Oman
Arab
Bank
10,134 10,27310,623 10,846
11,59611,232
2014 2015 2016 2017 2018 2019
Total Assets
247297 319 343 373 377
2014 2015 2016 2017 2018 2019
Operating Income
23‐Feb‐20 15
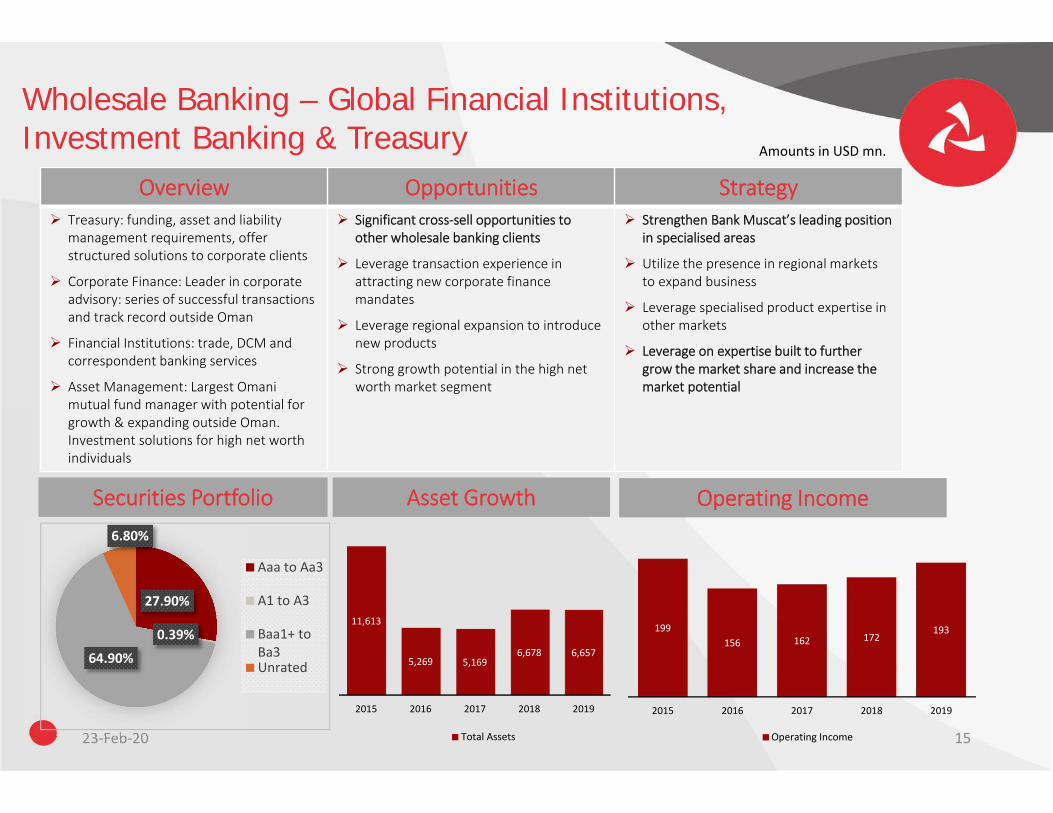
Wholesale Banking – Global Financial Institutions, Investment Banking & Treasury Amounts in USD mn.
Overview Opportunities Strategy Treasury: funding, asset and liability
management requirements, offer structured solutions to corporate clients
Corporate Finance: Leader in corporate advisory: series of successful transactions and track record outside Oman
Financial Institutions: trade, DCM and correspondent banking services
Asset Management: Largest Omani mutual fund manager with potential for growth & expanding outside Oman. Investment solutions for high net worth individuals
Significant cross‐sell opportunities to other wholesale banking clients
Leverage transaction experience in attracting new corporate finance mandates
Leverage regional expansion to introduce new products
Strong growth potential in the high net worth market segment
Strengthen Bank Muscat’s leading position in specialised areas
Utilize the presence in regional markets to expand business
Leverage specialised product expertise in other markets
Leverage on expertise built to further grow the market share and increase the market potential
Securities Portfolio Asset Growth Operating Income
27.90%
0.39%
64.90%
6.80%
Aaa to Aa3
A1 to A3
Baa1+ toBa3Unrated
11,613
5,269 5,1696,678 6,657
2015 2016 2017 2018 2019
Total Assets
199156 162 172
193
2015 2016 2017 2018 2019
Operating Income
23‐Feb‐20 16
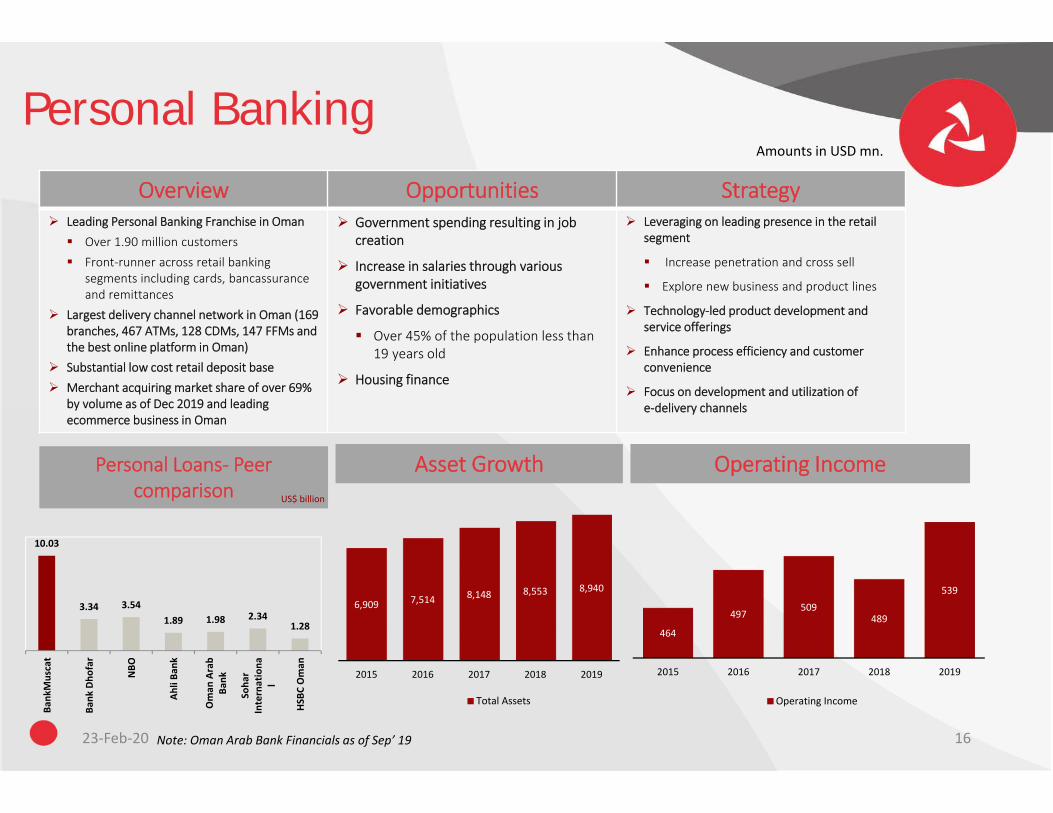
Personal BankingAmounts in USD mn.
Overview Opportunities Strategy Leading Personal Banking Franchise in Oman Over 1.90 million customers Front‐runner across retail banking
segments including cards, bancassuranceand remittances
Largest delivery channel network in Oman (169 branches, 467 ATMs, 128 CDMs, 147 FFMs and the best online platform in Oman)
Substantial low cost retail deposit base Merchant acquiring market share of over 69%
by volume as of Dec 2019 and leading ecommerce business in Oman
Government spending resulting in job creation
Increase in salaries through various government initiatives
Favorable demographics
Over 45% of the population less than 19 years old
Housing finance
Leveraging on leading presence in the retail segment
Increase penetration and cross sell
Explore new business and product lines
Technology‐led product development and service offerings
Enhance process efficiency and customer convenience
Focus on development and utilization of e‐delivery channels
Personal Loans‐ Peer comparison
Asset Growth Operating Income
Note: Oman Arab Bank Financials as of Sep’ 19
US$ billion
10.03
3.34 3.541.89 1.98 2.34
1.28
Bank
Muscat
Bank
Dho
far
NBO
Ahli Ba
nk
Oman
Arab
Bank
Soha
rInternationa
l
HSB
C Oman
6,909 7,514 8,148 8,553 8,940
2015 2016 2017 2018 2019
Total Assets
464
497509
489
539
2015 2016 2017 2018 2019
Operating Income
23‐Feb‐20 17
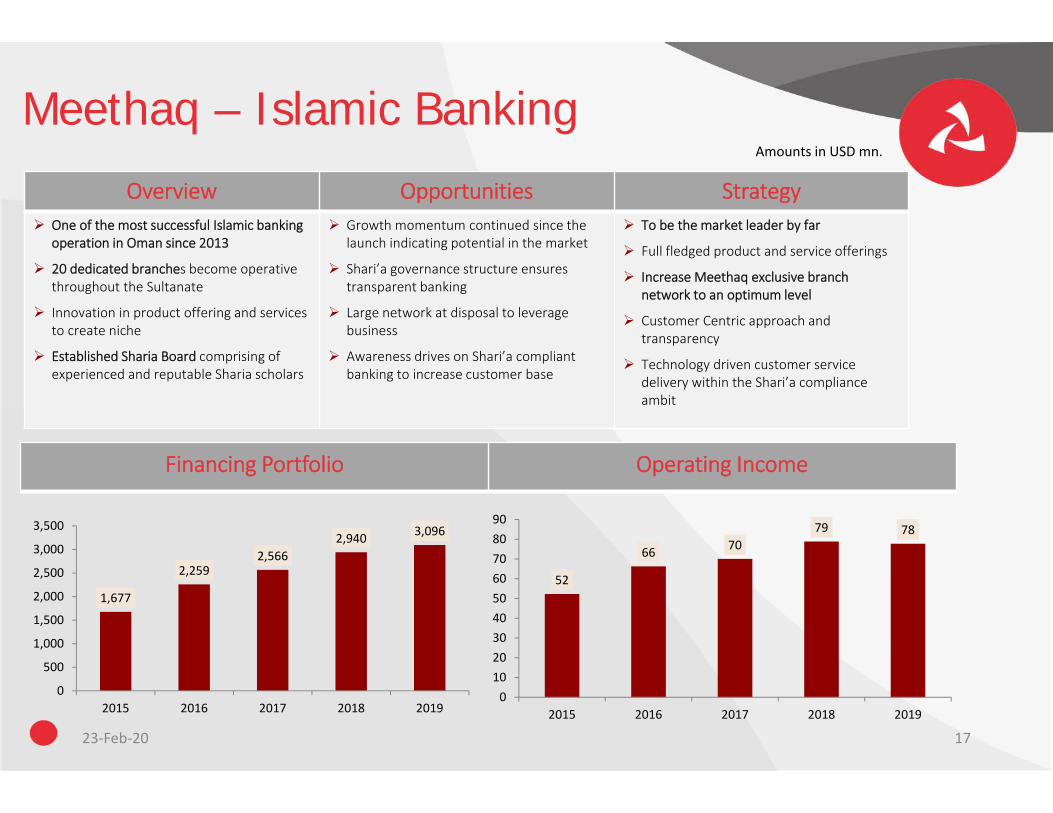
Meethaq – Islamic BankingAmounts in USD mn.
Overview Opportunities Strategy One of the most successful Islamic banking
operation in Oman since 2013
20 dedicated branches become operative throughout the Sultanate
Innovation in product offering and services to create niche
Established Sharia Board comprising of experienced and reputable Sharia scholars
Growth momentum continued since thelaunch indicating potential in the market
Shari’a governance structure ensures transparent banking
Large network at disposal to leverage business
Awareness drives on Shari’a compliant banking to increase customer base
To be the market leader by far
Full fledged product and service offerings
Increase Meethaq exclusive branch network to an optimum level
Customer Centric approach and transparency
Technology driven customer service delivery within the Shari’a compliance ambit
Financing Portfolio Operating Income
52
66 7079 78
0102030405060708090
2015 2016 2017 2018 2019
1,677
2,2592,566
2,940 3,096
0
500
1,000
1,500
2,000
2,500
3,000
3,500
2015 2016 2017 2018 2019
23‐Feb‐20 18
Financial Performance
23‐Feb‐20 19
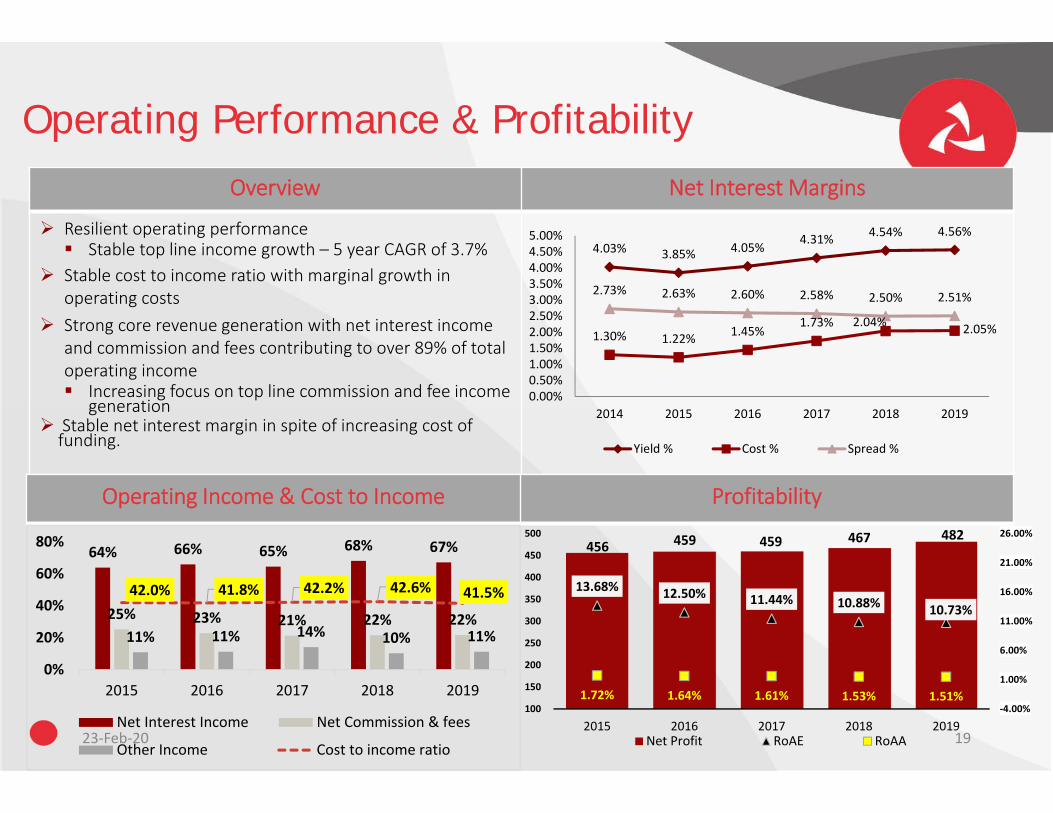
Operating Performance & ProfitabilityOverview Net Interest Margins
Resilient operating performance Stable top line income growth – 5 year CAGR of 3.7%
Stable cost to income ratio with marginal growth in operating costs
Strong core revenue generation with net interest income and commission and fees contributing to over 89% of total operating income Increasing focus on top line commission and fee income
generation Stable net interest margin in spite of increasing cost of funding.
Operating Income & Cost to Income Profitability
4.03% 3.85% 4.05% 4.31% 4.54% 4.56%
1.30% 1.22% 1.45%1.73% 2.04% 2.05%
2.73% 2.63% 2.60% 2.58% 2.50% 2.51%
0.00%0.50%1.00%1.50%2.00%2.50%3.00%3.50%4.00%4.50%5.00%
2014 2015 2016 2017 2018 2019
Yield % Cost % Spread %
456 459 459 467 482
13.68% 12.50% 11.44% 10.88% 10.73%
1.72% 1.64% 1.61% 1.53% 1.51%‐4.00%
1.00%
6.00%
11.00%
16.00%
21.00%
26.00%
100
150
200
250
300
350
400
450
500
2015 2016 2017 2018 2019Net Profit RoAE RoAA
64% 66% 65% 68% 67%
25% 23% 21% 22% 22%11% 11% 14% 10% 11%
42.0% 41.8% 42.2% 42.6% 41.5%
0%
20%
40%
60%
80%
2015 2016 2017 2018 2019
Net Interest Income Net Commission & fees
Other Income Cost to income ratio
23‐Feb‐20 20
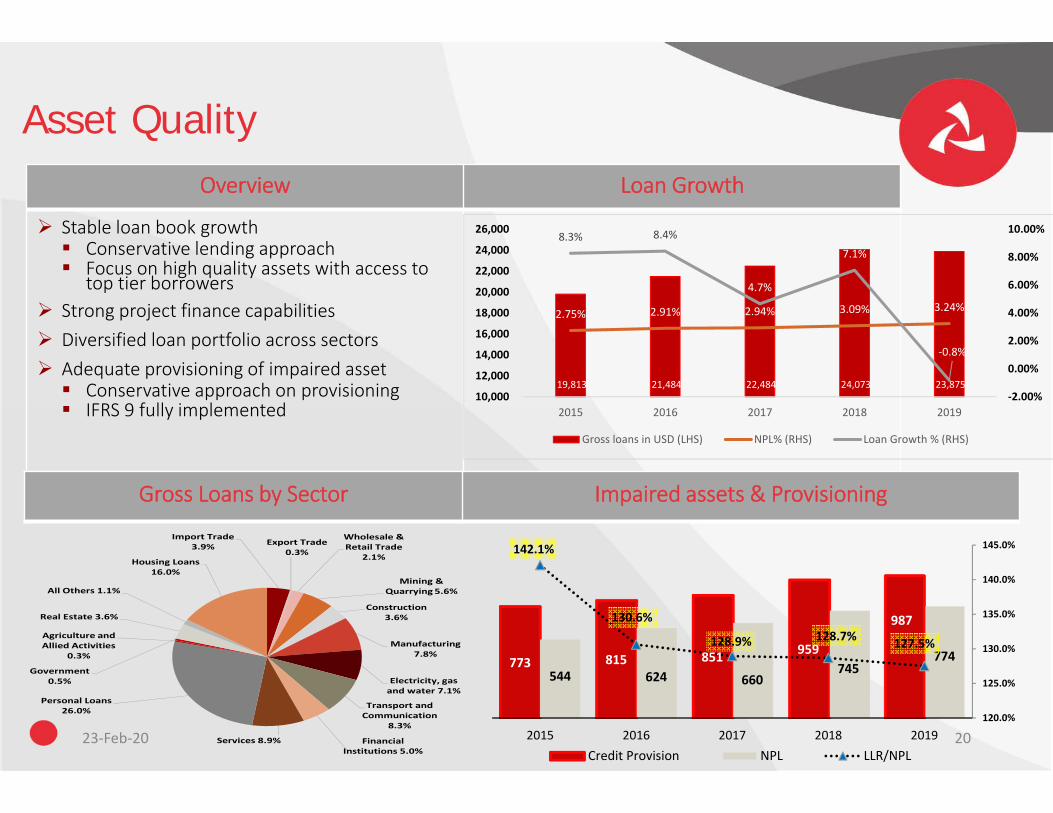
Asset QualityOverview Loan Growth
Stable loan book growth Conservative lending approach Focus on high quality assets with access to
top tier borrowers Strong project finance capabilities Diversified loan portfolio across sectors Adequate provisioning of impaired asset Conservative approach on provisioning IFRS 9 fully implemented
Gross Loans by Sector Impaired assets & Provisioning
773 815 851 959
987
544 624 660745
774
142.1%
130.6%
128.9% 128.7% 127.5%
120.0%
125.0%
130.0%
135.0%
140.0%
145.0%
2015 2016 2017 2018 2019Credit Provision NPL LLR/NPL
19,813 21,484 22,484 24,073 23,875
2.75% 2.91% 2.94% 3.09% 3.24%
8.3% 8.4%
4.7%
7.1%
‐0.8%
‐2.00%
0.00%
2.00%
4.00%
6.00%
8.00%
10.00%
10,000
12,000
14,000
16,000
18,000
20,000
22,000
24,000
26,000
2015 2016 2017 2018 2019
Gross loans in USD (LHS) NPL% (RHS) Loan Growth % (RHS)
Import Trade3.9% Export Trade
0.3%
Wholesale & Retail Trade
2.1%
Mining & Quarrying5.6%
Construction3.6%
Manufacturing7.8%
Electricity, gas and water 7.1%
Transport and Communication
8.3%
Financial Institutions 5.0%
Services 8.9%
Personal Loans26.0%
Agriculture and Allied Activities
0.3%
Government0.5%
Real Estate 3.6%
All Others 1.1%
Housing Loans16.0%
23‐Feb‐20 21
Funding & Liquidity
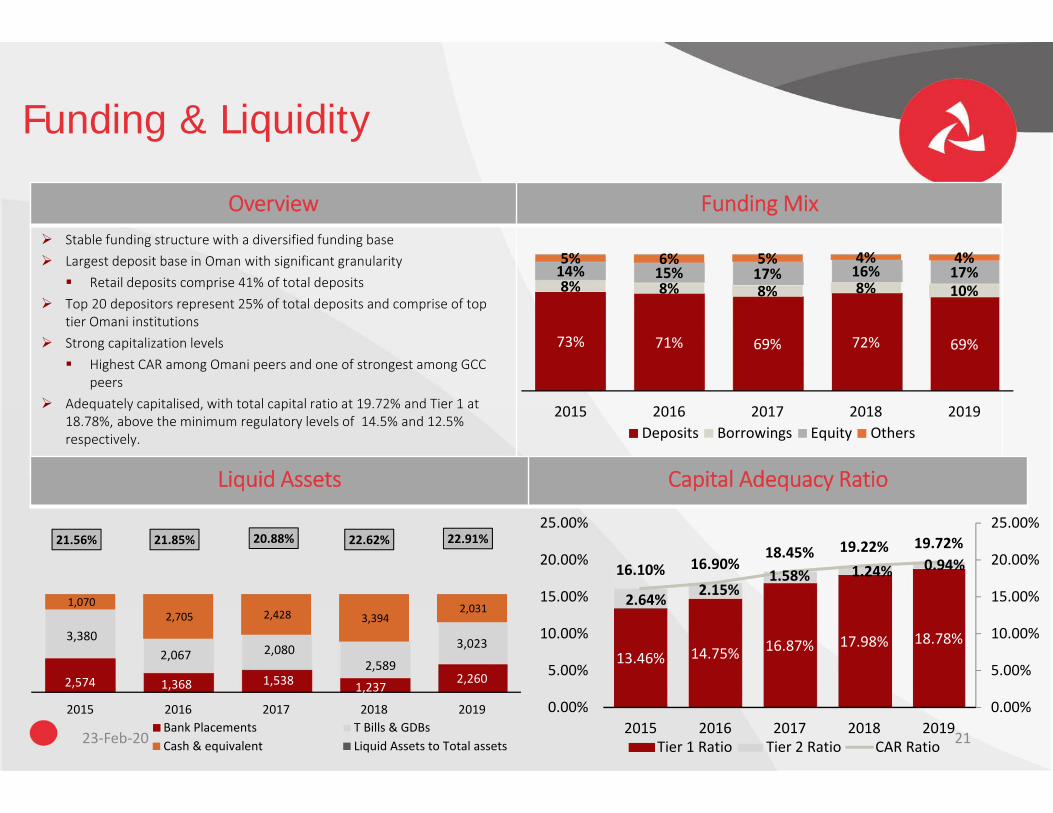
Overview Funding Mix Stable funding structure with a diversified funding base Largest deposit base in Oman with significant granularity Retail deposits comprise 41% of total deposits
Top 20 depositors represent 25% of total deposits and comprise of top tier Omani institutions
Strong capitalization levels Highest CAR among Omani peers and one of strongest among GCC
peers Adequately capitalised, with total capital ratio at 19.72% and Tier 1 at
18.78%, above the minimum regulatory levels of 14.5% and 12.5% respectively.
Liquid Assets Capital Adequacy Ratio
73% 71% 69% 72% 69%
8% 8% 8% 8% 10%14% 15% 17% 16% 17%5% 6% 5% 4% 4%
2015 2016 2017 2018 2019Deposits Borrowings Equity Others
2,574 1,368 1,538 1,2372,260
3,3802,067 2,080
2,589
3,023
1,070 2,705 2,428 3,394
2,031
21.56% 21.85% 20.88% 22.62% 22.91%
2015 2016 2017 2018 2019Bank Placements T Bills & GDBsCash & equivalent Liquid Assets to Total assets
13.46% 14.75% 16.87% 17.98% 18.78%
2.64% 2.15%1.58% 1.24% 0.94%16.10% 16.90%18.45% 19.22% 19.72%
0.00%
5.00%
10.00%
15.00%
20.00%
25.00%
0.00%
5.00%
10.00%
15.00%
20.00%
25.00%
2015 2016 2017 2018 2019Tier 1 Ratio Tier 2 Ratio CAR Ratio
23‐Feb‐20 22
Annexures
23‐Feb‐20 23
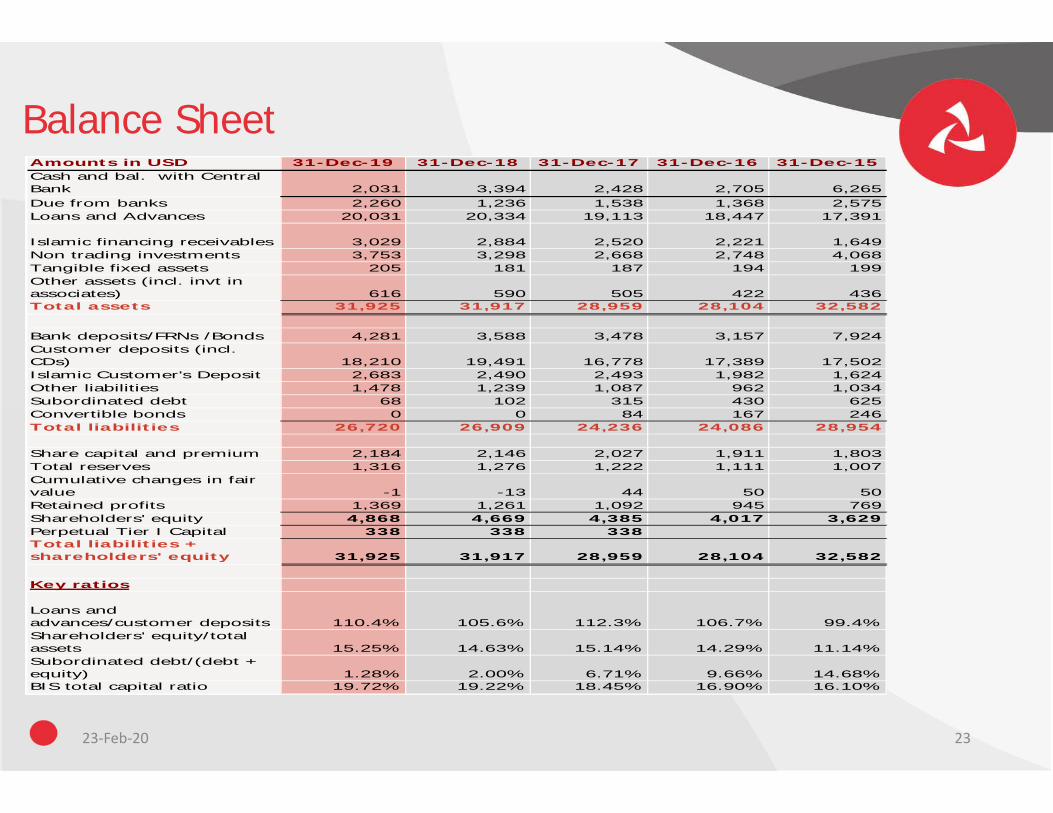
Balance SheetAmounts in USD 31-Dec-19 31-Dec-18 31-Dec-17 31-Dec-16 31-Dec-15Cash and bal. with Central Bank 2,031 3,394 2,428 2,705 6,265Due from banks 2,260 1,236 1,538 1,368 2,575Loans and Advances 20,031 20,334 19,113 18,447 17,391
Islamic financing receivables 3,029 2,884 2,520 2,221 1,649Non trading investments 3,753 3,298 2,668 2,748 4,068Tangible fixed assets 205 181 187 194 199Other assets (incl. invt in associates) 616 590 505 422 436Total assets 31,925 31,917 28,959 28,104 32,582
Bank deposits/FRNs /Bonds 4,281 3,588 3,478 3,157 7,924Customer deposits (incl. CDs) 18,210 19,491 16,778 17,389 17,502Islamic Customer's Deposit 2,683 2,490 2,493 1,982 1,624Other liabilities 1,478 1,239 1,087 962 1,034Subordinated debt 68 102 315 430 625Convertible bonds 0 0 84 167 246Total liabilities 26,720 26,909 24,236 24,086 28,954
Share capital and premium 2,184 2,146 2,027 1,911 1,803Total reserves 1,316 1,276 1,222 1,111 1,007Cumulative changes in fair value -1 -13 44 50 50Retained profits 1,369 1,261 1,092 945 769Shareholders' equity 4,868 4,669 4,385 4,017 3,629Perpetual Tier I Capital 338 338 338Total liabilities + shareholders' equity 31,925 31,917 28,959 28,104 32,582
Key ratios
Loans and advances/customer deposits 110.4% 105.6% 112.3% 106.7% 99.4%Shareholders' equity/total assets 15.25% 14.63% 15.14% 14.29% 11.14%Subordinated debt/(debt + equity) 1.28% 2.00% 6.71% 9.66% 14.68%BIS total capital ratio 19.72% 19.22% 18.45% 16.90% 16.10%
23‐Feb‐20 24
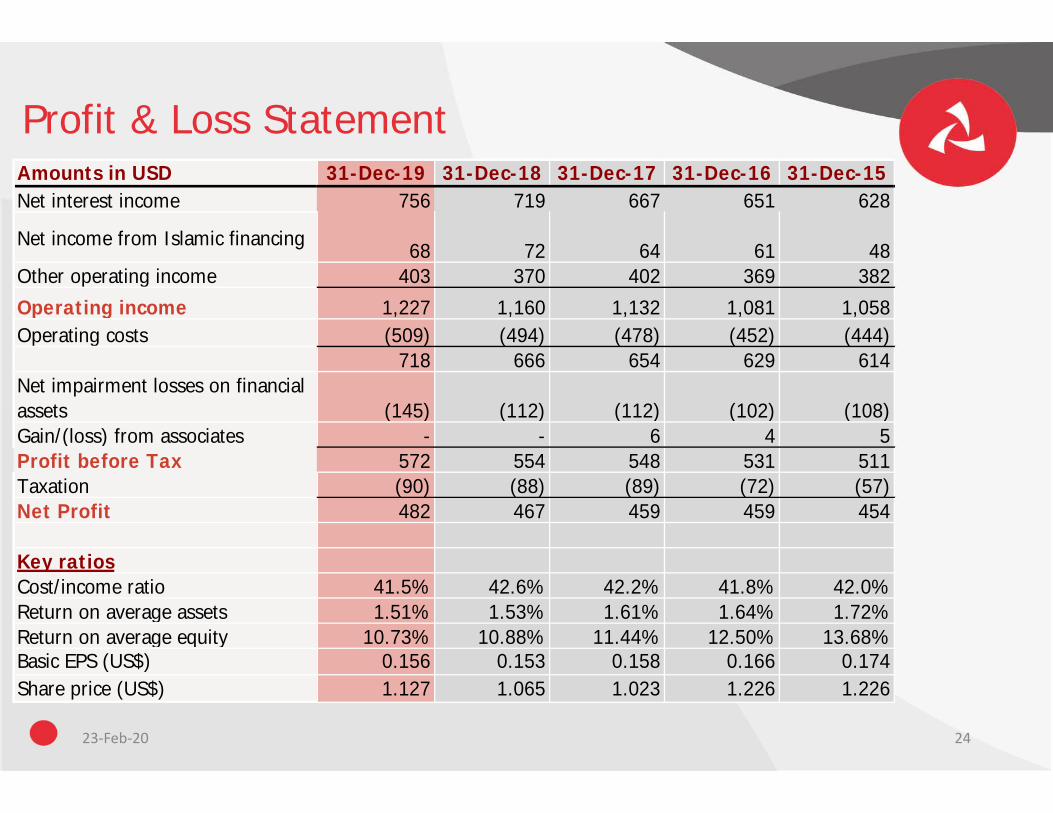
Profit & Loss StatementAmounts in USD 31-Dec-19 31-Dec-18 31-Dec-17 31-Dec-16 31-Dec-15Net interest income 756 719 667 651 628
Net income from Islamic financing 68 72 64 61 48
Other operating income 403 370 402 369 382 Operating income 1,227 1,160 1,132 1,081 1,058 Operating costs (509) (494) (478) (452) (444)
718 666 654 629 614 Net impairment losses on financial assets (145) (112) (112) (102) (108)Gain/(loss) from associates - - 6 4 5 Profit before Tax 572 554 548 531 511 Taxation (90) (88) (89) (72) (57)Net Profit 482 467 459 459 454
Key ratiosCost/income ratio 41.5% 42.6% 42.2% 41.8% 42.0%Return on average assets 1.51% 1.53% 1.61% 1.64% 1.72%Return on average equity 10.73% 10.88% 11.44% 12.50% 13.68%Basic EPS (US$) 0.156 0.153 0.158 0.166 0.174Share price (US$) 1.127 1.065 1.023 1.226 1.226