53
June 1-4, 2015 (CIMB : Paris-London) Investor Presentation | EU Roadshow
June 1-4, 2015 (CIMB : Paris-London)
Investor Presentation | EU Roadshow
This presentation includes forward-looking statements that are subject to risks and uncertainties, including those pertaining to the anticipated benefits to be realized from the proposals described herein. This presentation contains a number of forward-looking statements including, in particular, statements about future events, future financial performance, plans, strategies, expectations, prospects, competitive environment, regulation and supply and demand. PTTGC has based these forward-looking statements on its views with respect to future events and financial performance. Actual financial performance of the entities described herein could differ materially from that projected in the forward-looking statements due to the inherent uncertainty of estimates, forecasts and projections, and financial performance may be better or worse than anticipated. Given these uncertainties, readers should not put undue reliance on any forward-looking statements. Forward-looking statements represent estimates and assumptions only as of the date that they were made. The information contained in this presentation is subject to change without notice and PTTGC does not undertake any duty to update the forward-looking statements, and the estimates and assumptions associated with them, except to the extent required by applicable laws and regulations.
DISCLAIMER
2
• PTTGC’s Business Overview • Strategic Actions • Financial Performance • Market Outlook
AGENDA
3
• PTTGC’s Business Overview • Strategic Actions • Financial Performance • Market Outlook
AGENDA
4
Overview of PTTGC
5
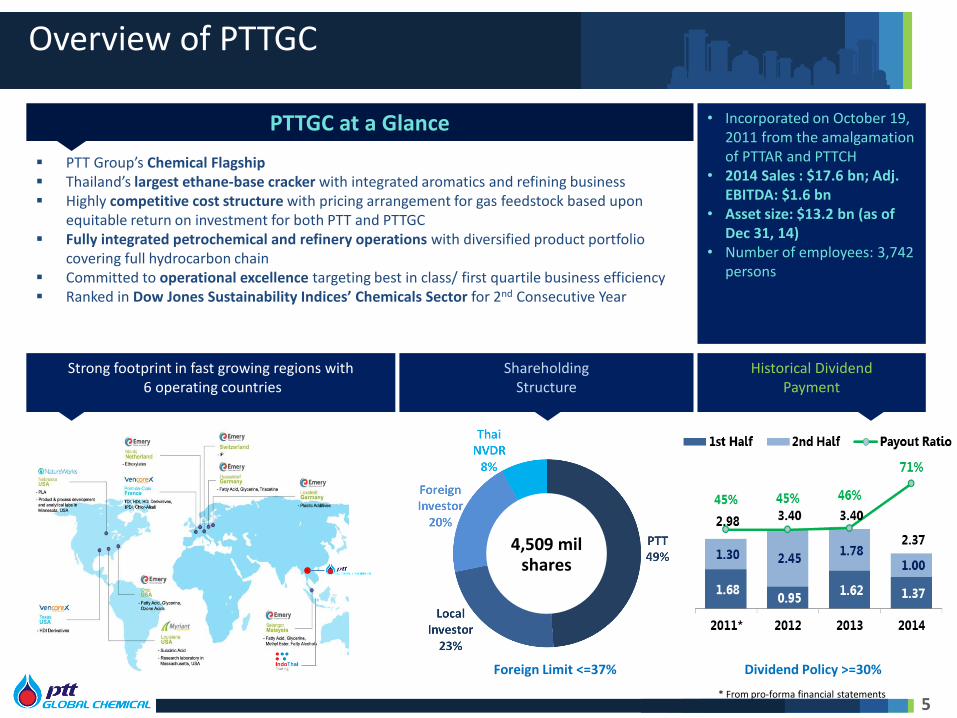
PTT Group’s Chemical Flagship Thailand’s largest ethane-base cracker with integrated aromatics and refining business Highly competitive cost structure with pricing arrangement for gas feedstock based upon
equitable return on investment for both PTT and PTTGC Fully integrated petrochemical and refinery operations with diversified product portfolio
covering full hydrocarbon chain Committed to operational excellence targeting best in class/ first quartile business efficiency Ranked in Dow Jones Sustainability Indices’ Chemicals Sector for 2nd Consecutive Year
PTTGC at a Glance
Strong footprint in fast growing regions with 6 operating countries
Shareholding Structure
Historical Dividend Payment
Dividend Policy >=30% Foreign Limit <=37%
• Incorporated on October 19, 2011 from the amalgamation of PTTAR and PTTCH
• 2014 Sales : $17.6 bn; Adj. EBITDA: $1.6 bn
• Asset size: $13.2 bn (as of Dec 31, 14)
• Number of employees: 3,742 persons
* From pro-forma financial statements
4,509 mil shares
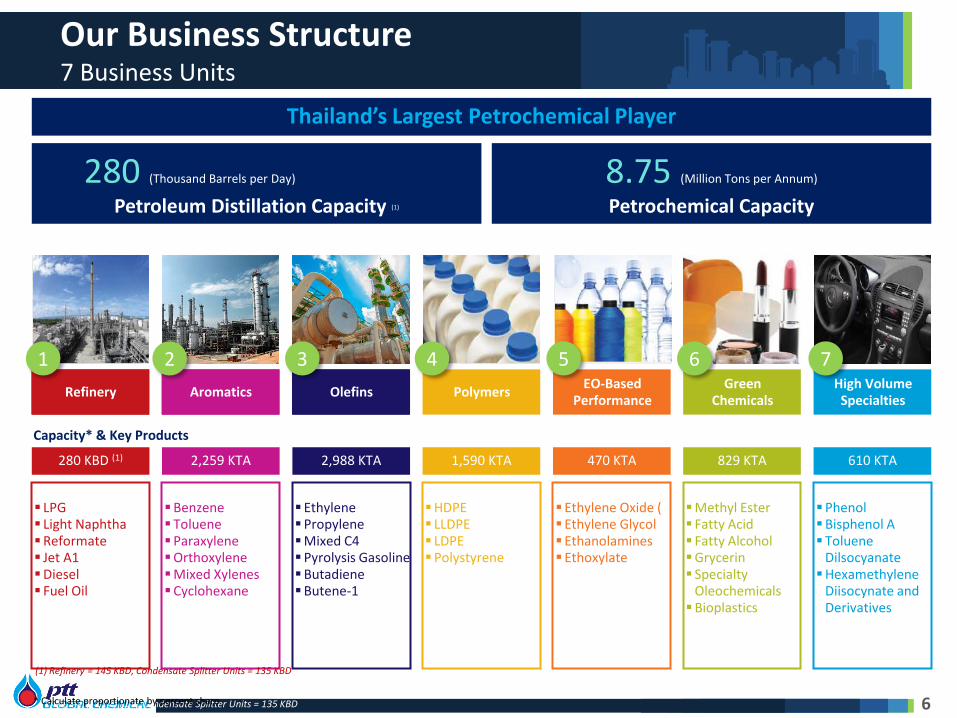
Our Business Structure 7 Business Units
6
LPG Light Naphtha Reformate Jet A1 Diesel Fuel Oil
Benzene Toluene Paraxylene Orthoxylene Mixed Xylenes Cyclohexane
Ethylene Propylene Mixed C4 Pyrolysis Gasoline Butadiene Butene-1
HDPE LLDPE LDPE Polystyrene
Ethylene Oxide ( Ethylene Glycol Ethanolamines Ethoxylate
Methyl Ester Fatty Acid Fatty Alcohol Grycerin Specialty
Oleochemicals Bioplastics
Phenol Bisphenol A Toluene
Dilsocyanate
Hexamethylene Diisocynate and Derivatives
280 KBD (1) 2,259 KTA 2,988 KTA 1,590 KTA 470 KTA 829 KTA 610 KTA
Capacity* & Key Products
Aromatics Olefins Polymers EO-Based
Performance Green
Chemicals High Volume
Specialties Refinery
Thailand’s Largest Petrochemical Player
8.75 (Million Tons per Annum)
Petrochemical Capacity
280 (Thousand Barrels per Day)
Petroleum Distillation Capacity (1)
(1) Refinery = 145 KBD, Condensate Splitter Units = 135 KBD
Aromatics Olefins Refinery
1 2 7 3 4 5 6
(1) Refinery = 145 KBD, Condensate Splitter Units = 135 KBD
* Calculate proportionate by percent share
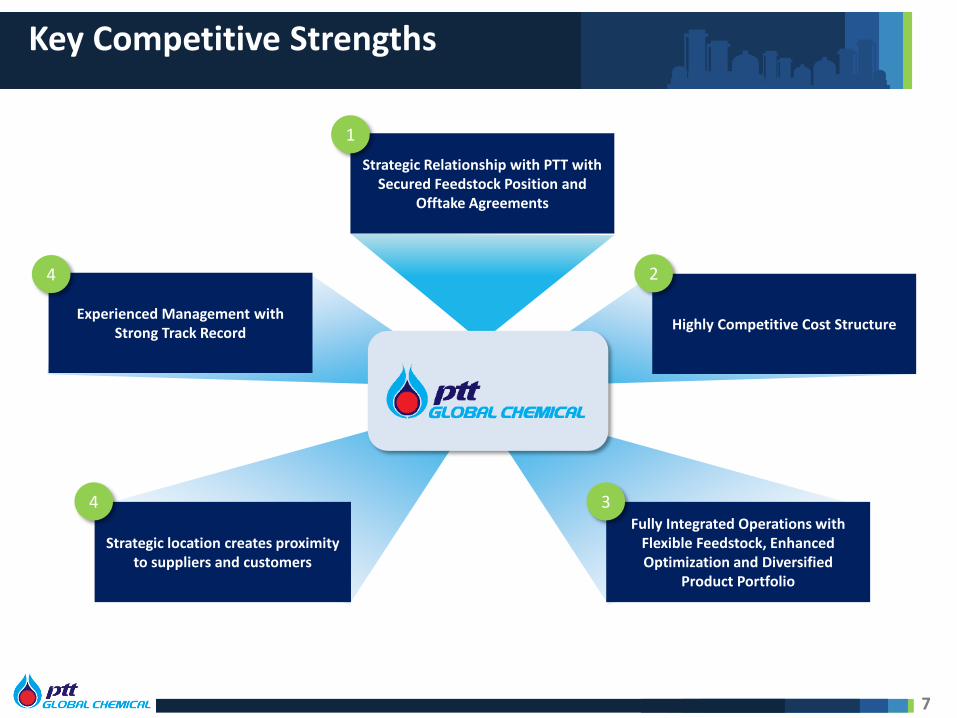
Key Competitive Strengths
7
Fully Integrated Operations with Flexible Feedstock, Enhanced Optimization and Diversified
Product Portfolio
Strategic location creates proximity to suppliers and customers
Experienced Management with Strong Track Record
Highly Competitive Cost Structure
Strategic Relationship with PTT with Secured Feedstock Position and
Offtake Agreements
1
2
3 4
4
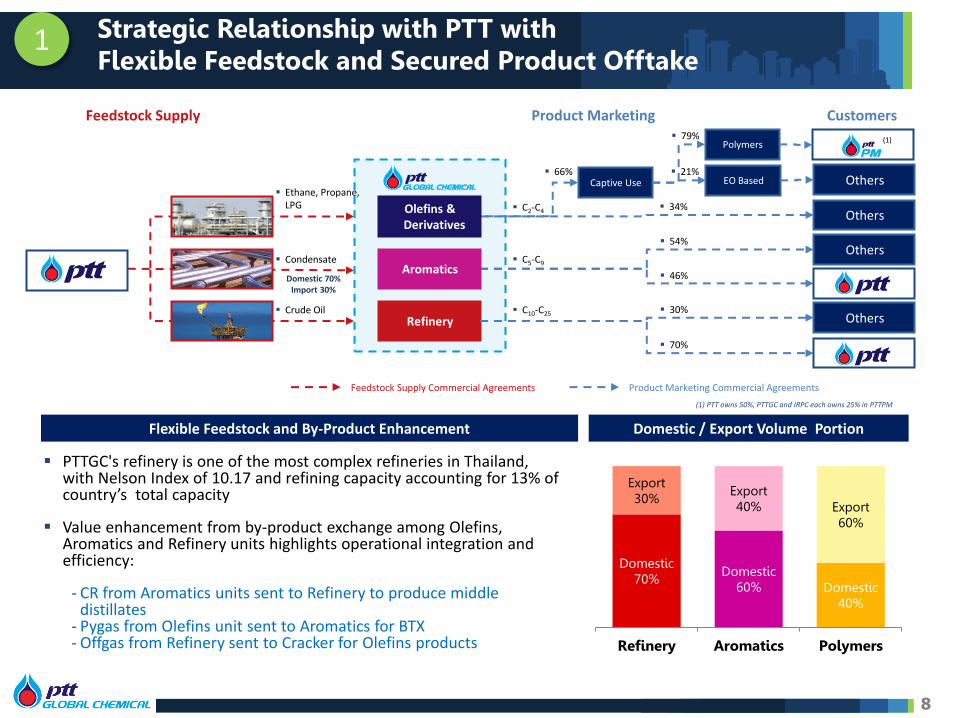
Domestic / Export Volume Portion Flexible Feedstock and By-Product Enhancement
PTTGC's refinery is one of the most complex refineries in Thailand, with Nelson Index of 10.17 and refining capacity accounting for 13% of country’s total capacity
Value enhancement from by-product exchange among Olefins, Aromatics and Refinery units highlights operational integration and efficiency:
- CR from Aromatics units sent to Refinery to produce middle distillates
- Pygas from Olefins unit sent to Aromatics for BTX - Offgas from Refinery sent to Cracker for Olefins products
Feedstock Supply Product Marketing
Refinery
Aromatics
Olefins & Derivatives
Others
Condensate
Crude Oil
Others
Ethane, Propane, LPG
C5-C9
C10-C25
C2-C4
66%
(1)
46%
54%
Feedstock Supply Commercial Agreements Product Marketing Commercial Agreements
Customers
Others
70%
30%
(1) PTT owns 50%, PTTGC and IRPC each owns 25% in PTTPM
8
Others 34%
Captive Use EO Based
Polymers 79%
21%
Strategic Relationship with PTT with Flexible Feedstock and Secured Product Offtake
1
Domestic 70% Domestic
60% Domestic 40%
Export 30% Export
40% Export 60%
Refinery Aromatics Polymers
Domestic 70% Import 30%
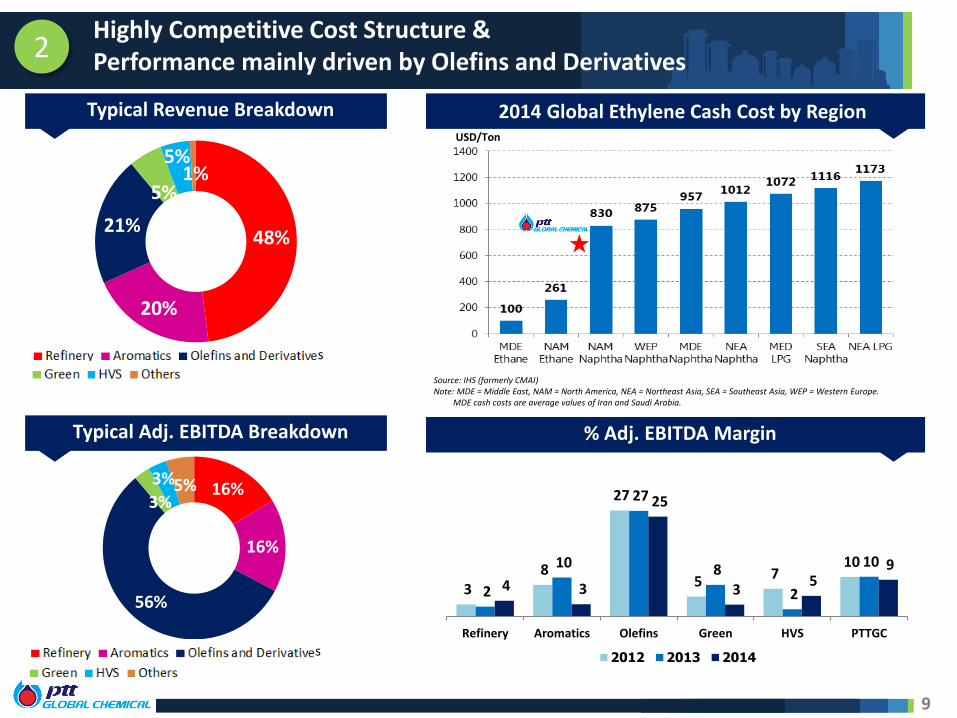
Highly Competitive Cost Structure & Performance mainly driven by Olefins and Derivatives
9
2014 Global Ethylene Cash Cost by Region USD/Ton
Source: IHS (formerly CMAI) Note: MDE = Middle East, NAM = North America, NEA = Northeast Asia, SEA = Southeast Asia, WEP = Western Europe. MDE cash costs are average values of Iran and Saudi Arabia.
48%
20%
21%
5%
5% 1%
Typical Adj. EBITDA Breakdown
16%
16%
56%
3%
3% 5%
Typical Revenue Breakdown
% Adj. EBITDA Margin
s
s
2
3 8
27
5 7 10
2
10
27
8
2
10
4 3
25
3 5
9
Refinery Aromatics Olefins Green HVS PTTGC
2012 2013 2014
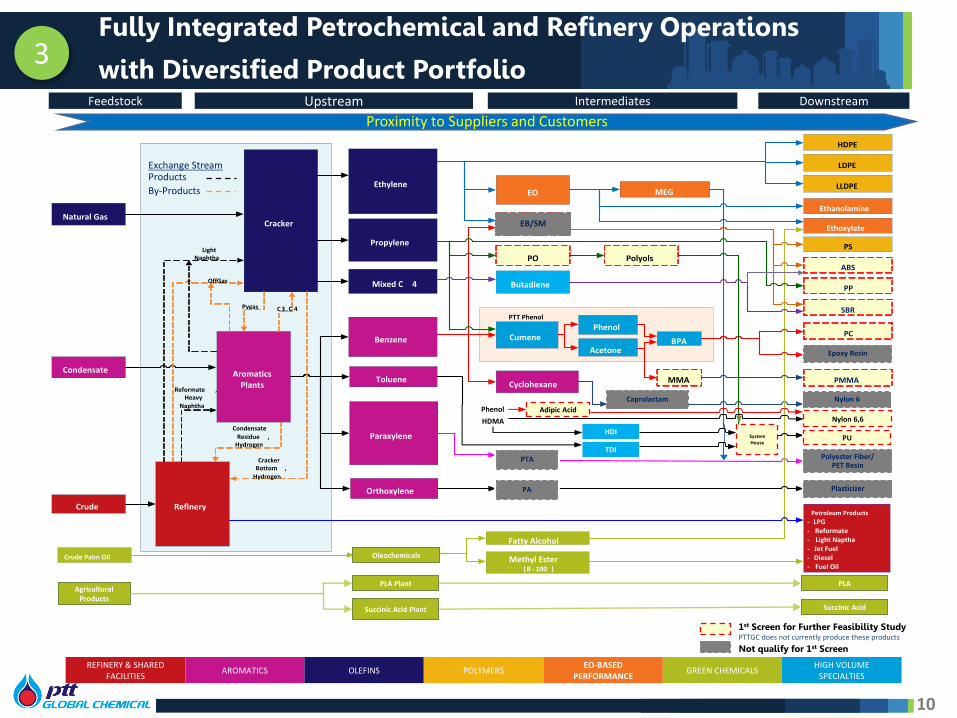
Natural Gas
Crude Palm Oil
Crude
Condensate
Cracker
Aromatics Plants
Refinery
Ethylene
HDPE
LLDPE
LDPE
MEG
Propylene
Oleochemicals
Paraxylene
Benzene
PTAPET Fiber / Resin
EO
Ethanolamine
Ethoxylate
Cyclohexane
CumenePhenol
Acetone
EB / SM
PS
BPA
Methyl Ester( B - 100 )
PC
Caprolactam Nylon 6
Fatty Alcohol
MMA PMMA
Epoxy Resins
ABS
SBR
PP
PTT Phenol
Petroleum Products
- LPG- Reformate- Light Naptha- Jet Fuel- Diesel- Fuel Oil
Reformate , Heavy
Naphtha
Pygas
Condensate Residue ,
Hydrogen
Light Naphtha
C 3 ,C 4
OffGas Mixed C 4 Butadiene
PO
PUTDI / HDI
Toluene
Polyols
Orthoxylene
Cracker Bottom ,
Hydrogen
PA Plasticizer
REFINERY & SHARED FACILITIES
AROMATICS OLEFINS POLYMERS EO-BASED
PERFORMANCE GREEN CHEMICALS
HIGH VOLUME SPECIALTIES
Feedstock Upstream Intermediates Downstream
Proximity to Suppliers and Customers
Exchange Stream Products By-Products
10
1st Screen for Further Feasibility Study PTTGC does not currently produce these products
Not qualify for 1st Screen
PLA
Succinic Acid Succinic Acid Plant
PLA Plant Agricultural
Products
PTA
PA
EB/SM
Nylon 6
HDI
TDI
Nylon 6,6
PU
Polyester Fiber/ PET Resin
Plasticizer
Nylon 6 Caprolactam
Epoxy Resin
System House
Adipic Acid Phenol
HDMA
Oleochemicals
Fully Integrated Petrochemical and Refinery Operations
with Diversified Product Portfolio 3
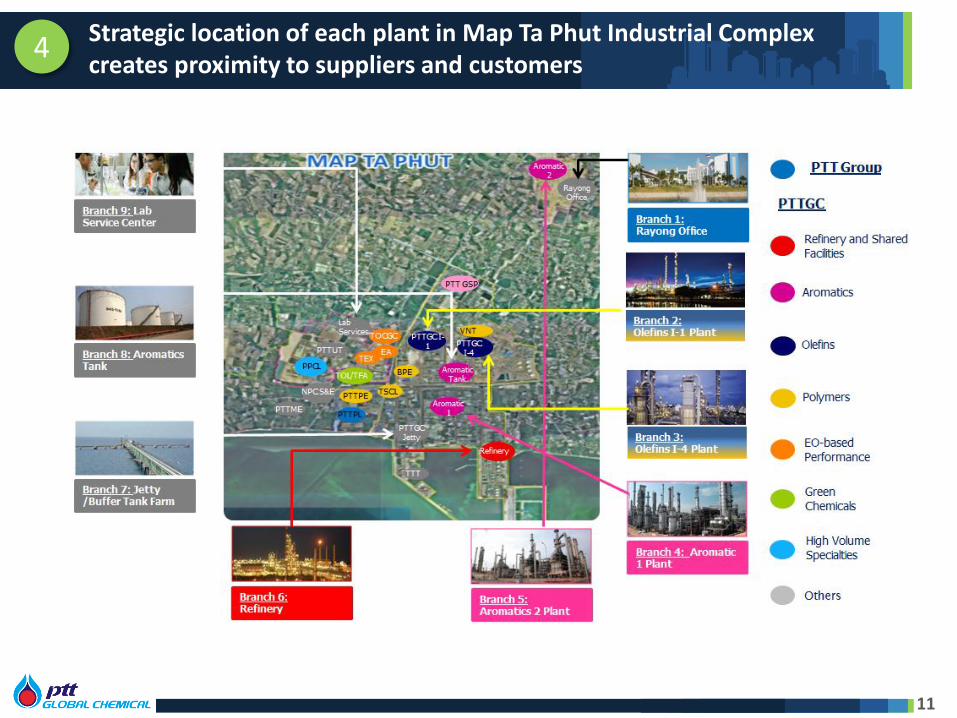
Strategic location of each plant in Map Ta Phut Industrial Complex creates proximity to suppliers and customers
11
4
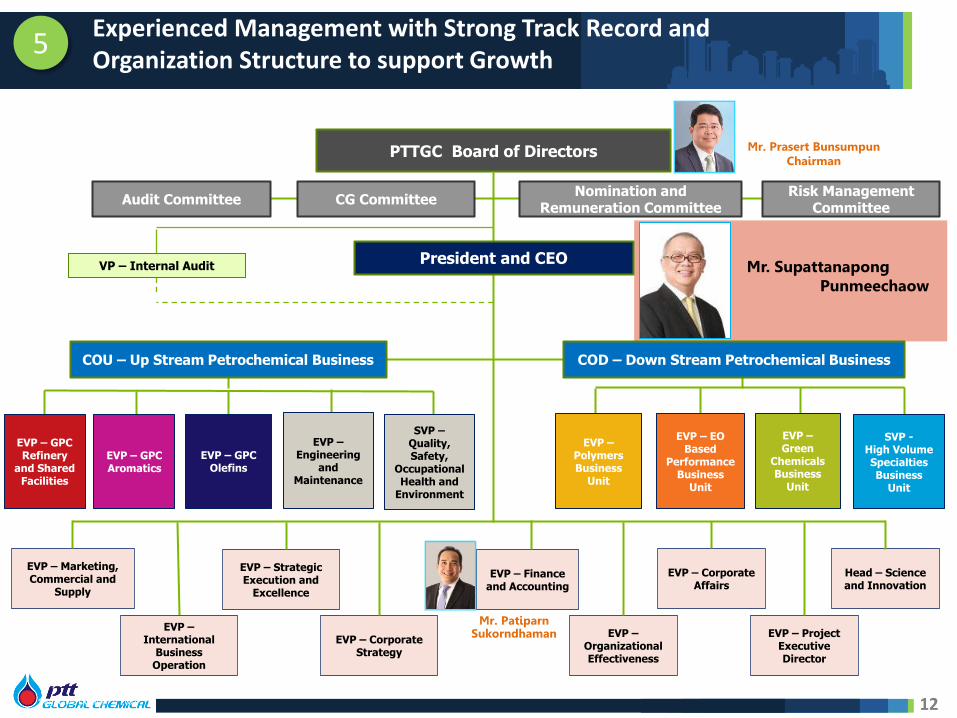
Experienced Management with Strong Track Record and Organization Structure to support Growth
12 * Effective October 1, 2014
5
PTTGC Board of Directors
VP – Internal Audit
EVP – Polymers Business
Unit
EVP – EO Based
Performance Business
Unit
EVP – Marketing, Commercial and
Supply
EVP – Finance and Accounting
EVP – Corporate Strategy
EVP – Strategic Execution and
Excellence
EVP – Corporate Affairs
EVP – Organizational Effectiveness
EVP – Project Executive Director
Head – Science and Innovation
EVP – GPC Olefins
EVP – GPC Refinery
and Shared Facilities
EVP – GPC Aromatics
EVP – Engineering
and Maintenance
SVP – Quality, Safety,
Occupational Health and
Environment
Audit Committee CG Committee Risk Management
Committee Nomination and
Remuneration Committee
President and CEO
COD – Down Stream Petrochemical Business COU – Up Stream Petrochemical Business
Mr. Supattanapong Punmeechaow
Mr. Prasert Bunsumpun Chairman
Mr. Patiparn Sukorndhaman
EVP – Green
Chemicals Business
Unit
SVP - High Volume Specialties Business
Unit
EVP – International
Business Operation
• PTTGC’s Business Overview • Strategic Actions • Financial Performance • Market Outlook
AGENDA
13
14
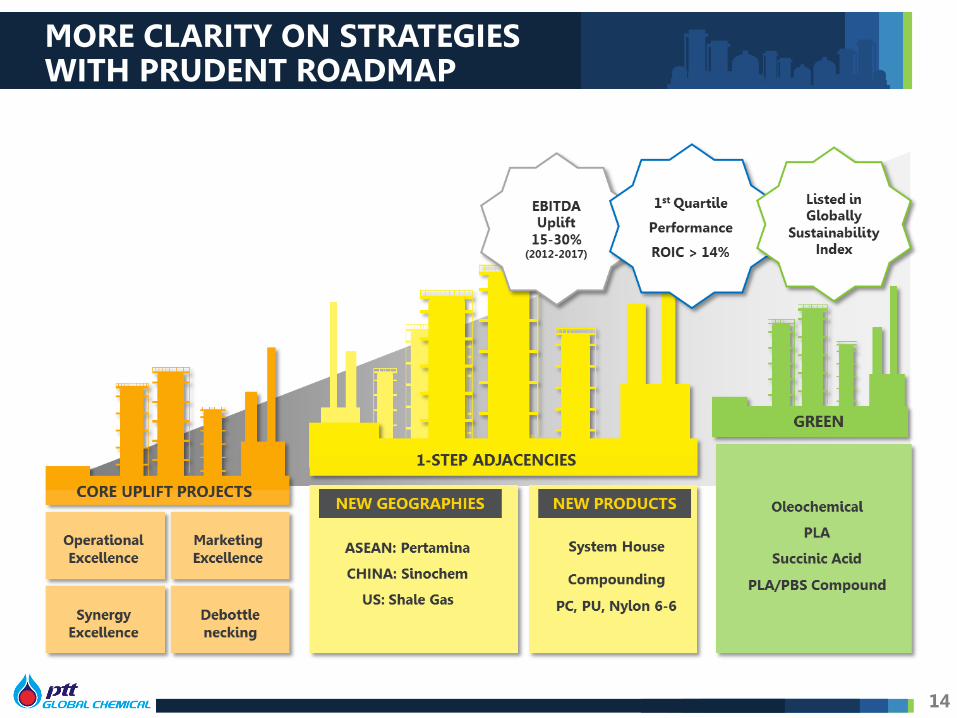
MORE CLARITY ON STRATEGIES WITH PRUDENT ROADMAP
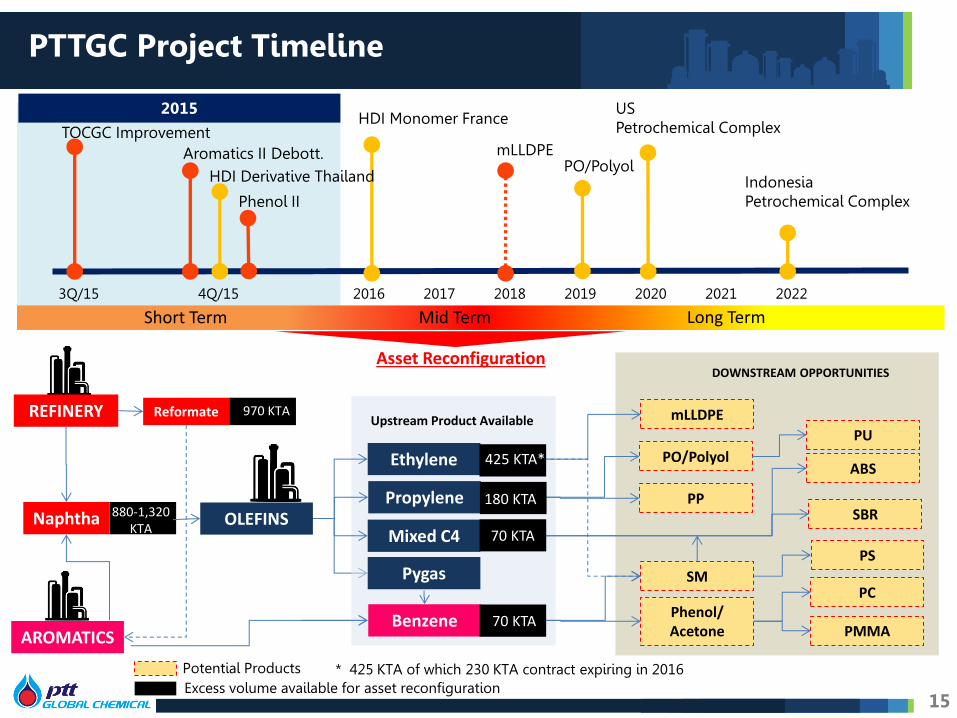
REFINERY
AROMATICS
Ethylene
Propylene
Mixed C4
Benzene
mLLDPE
Pygas SM
PS
ABS PO/Polyol
PC Phenol/ Acetone
PP SBR
PU
PMMA
880-1,320 KTA
Potential Products Excess volume available for asset reconfiguration
* 425 KTA of which 230 KTA contract expiring in 2016
425 KTA*
180 KTA
70 KTA
70 KTA
3Q/15 4Q/15 2016 2017 2018 2019 2020 2021
Phenol II
TOCGC Improvement
PO/Polyol
US Petrochemical Complex
2015
Short Term Mid Term Long Term
2022
Asset Reconfiguration
PTTGC Project Timeline
DOWNSTREAM OPPORTUNITIES
Upstream Product Available
Indonesia Petrochemical Complex
Aromatics II Debott.
HDI Monomer France
mLLDPE
HDI Derivative Thailand
OLEFINS
Reformate 970 KTA
Naphtha
15
CORE UPLIFTS
2015 COMPLETING PROJECTS
SYNERGY PROJECT PROGRESS
Off Gas Upgrading at Olefins
Delay to 2Q/15 99%
DEBOTTLENECKING & EXPANSION
CAPACITY/ CAPEX
PROGRESS
Phenol 2 Project
Target COD: 4Q/15
Phenol +250 KTA Acetone +155 KTA
97%
CAPEX 345 M$
TOCGC Plant Improvement Project
Target COD: 3Q/15
EOE +90 KTA
85%
CAPEX 94.2 M$
Aromatics 2 Debottlenecking
Project
Target COD: 4Q/15
PX +115 KTA BZ +35 KTA OX +20 KTA
76%
CAPEX 128.8 M$
*
* 19 45 68 83 86 86
156 129 86 74 14 13
35 38 149 149
149 149 21 0.3
75 108
108 108 231
211
378 414
357 356
2013A 2014A 2015 2016 2017 2018
Operational Excellence Marketing Excellence Synergy Excellence
Additional Synergy Debottleneck Total
Core Uplift Programs
2015 Target (MUSD)
1Q/15 Actual (MUSD)
FY2015 Estimate
(MUSD)
Synergy Excellence 149 11 35
Marketing Excellence 86 26 112
Operational Excellence
68 18 76
Total 303 55 223
16 *Updated as of March 2015
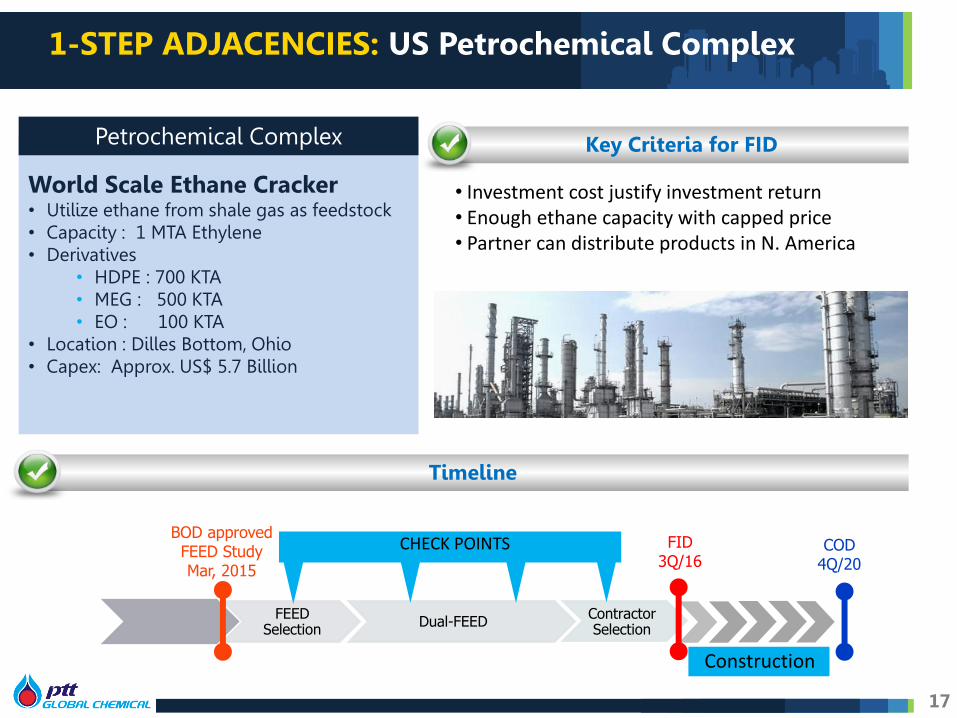
World Scale Ethane Cracker • Utilize ethane from shale gas as feedstock • Capacity : 1 MTA Ethylene • Derivatives
• HDPE : 700 KTA • MEG : 500 KTA • EO : 100 KTA
• Location : Dilles Bottom, Ohio • Capex: Approx. US$ 5.7 Billion
17
Technically Recoverable Shale Gas Resources
Petrochemical Complex Key Factors
Shale Gas Reserves
U.S. 1,161 Tcf
Canada 573 Tcf
Mexico 545 Tcf
Others 3,599 Tcf
Total 7,795 Tcf
China 1,115 Tcf
Argentina 802 Tcf
Tcf : ลา้นลา้นลูกบาทฟุต
1-STEP ADJACENCIES: US Petrochemical Complex
Key Criteria for FID
• Investment cost justify investment return • Enough ethane capacity with capped price • Partner can distribute products in
N.America
Timeline
• Investment cost justify investment return • Enough ethane capacity with capped price • Partner can distribute products in N. America
Key Criteria for FID
FEED Selection
Dual-FEED Contractor Selection
FID 3Q/16
COD 4Q/20
BOD approved FEED Study Mar, 2015
CHECK POINTS
Construction
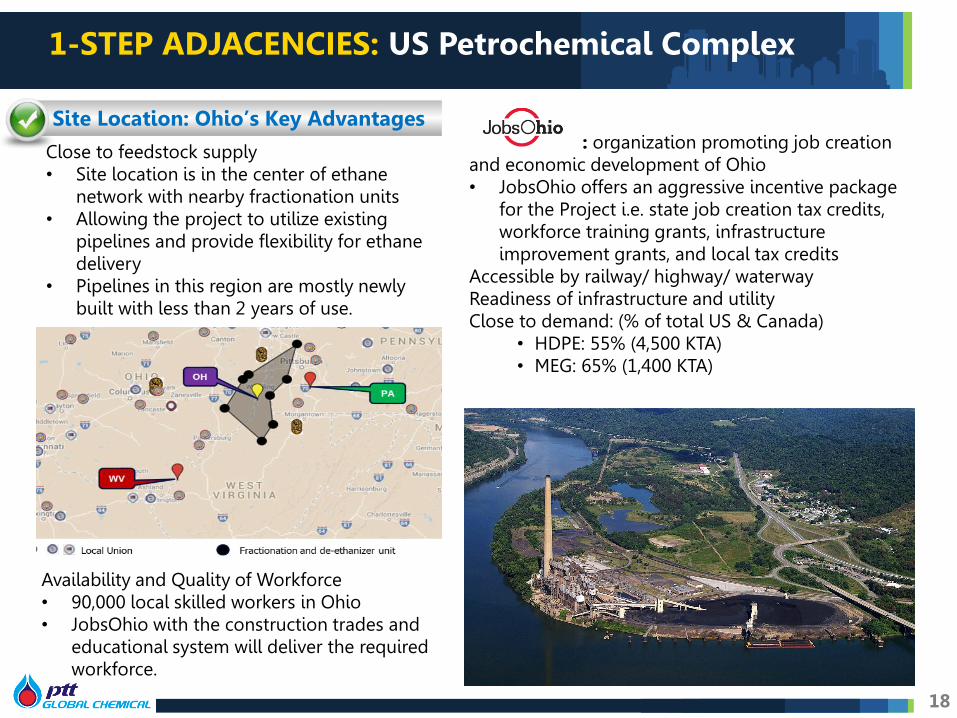
Site Location: Ohio’s Key Advantages
1-STEP ADJACENCIES: US Petrochemical Complex
Close to feedstock supply • Site location is in the center of ethane
network with nearby fractionation units • Allowing the project to utilize existing
pipelines and provide flexibility for ethane delivery
• Pipelines in this region are mostly newly built with less than 2 years of use.
Availability and Quality of Workforce • 90,000 local skilled workers in Ohio • JobsOhio with the construction trades and
educational system will deliver the required workforce.
: organization promoting job creation and economic development of Ohio • JobsOhio offers an aggressive incentive package
for the Project i.e. state job creation tax credits, workforce training grants, infrastructure improvement grants, and local tax credits
Accessible by railway/ highway/ waterway Readiness of infrastructure and utility Close to demand: (% of total US & Canada)
• HDPE: 55% (4,500 KTA) • MEG: 65% (1,400 KTA)
18
1-STEP ADJACENCIES: US Petrochemical Complex
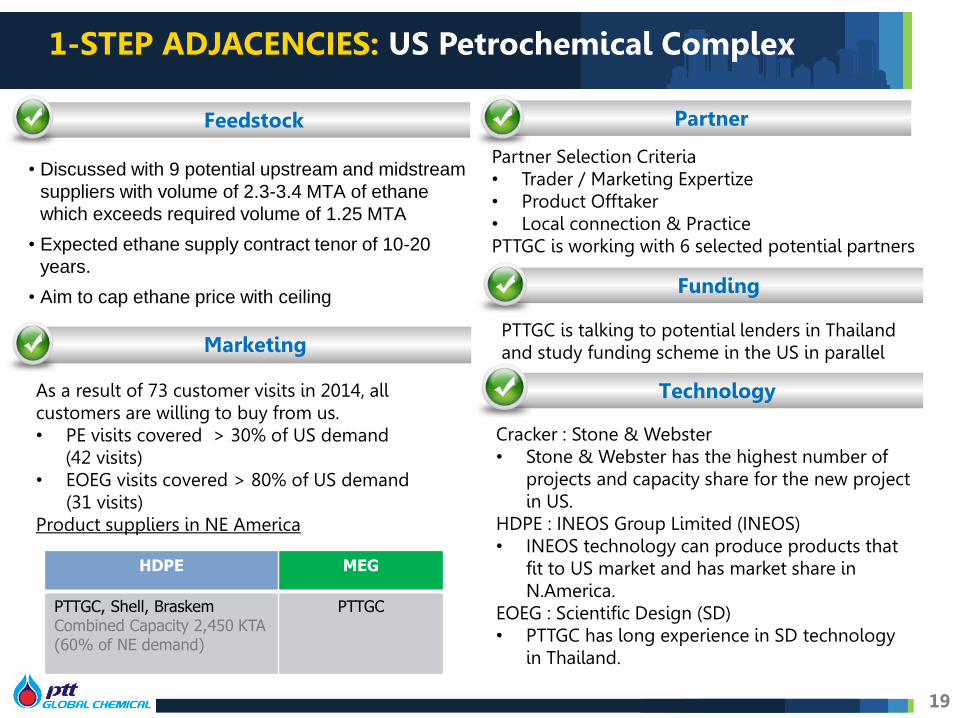
Feedstock
• Discussed with 9 potential upstream and midstream
suppliers with volume of 2.3-3.4 MTA of ethane
which exceeds required volume of 1.25 MTA
• Expected ethane supply contract tenor of 10-20
years.
• Aim to cap ethane price with ceiling
Partner
Partner Selection Criteria • Trader / Marketing Expertize • Product Offtaker • Local connection & Practice PTTGC is working with 6 selected potential partners
Funding
PTTGC is talking to potential lenders in Thailand and study funding scheme in the US in parallel
Technology
Cracker : Stone & Webster • Stone & Webster has the highest number of
projects and capacity share for the new project in US.
HDPE : INEOS Group Limited (INEOS) • INEOS technology can produce products that
fit to US market and has market share in N.America.
EOEG : Scientific Design (SD) • PTTGC has long experience in SD technology
in Thailand.
As a result of 73 customer visits in 2014, all customers are willing to buy from us. • PE visits covered > 30% of US demand
(42 visits) • EOEG visits covered > 80% of US demand
(31 visits) Product suppliers in NE America
Marketing
HDPE MEG
PTTGC, Shell, Braskem Combined Capacity 2,450 KTA (60% of NE demand)
PTTGC
19

1-STEP ADJACENCIES: Petrochemical Complex in Indonesia
Refinery Upgrading Project Petrochemical Complex Project
Potential Partner
Feedstock from Balongan Refinery
Updates PERTAMINA and partner is determining size and configuration of Refinery upgrade/expansion
• Availability of petrochemical feedstock from refinery expansion
• Configuration and product yield of the expansion • Domestic demand of refined product
HDPE
LDPE
EO/EG
PP
BD
MTBE
300 KTA
400 KTA
460 KTA
544 KTA
125 KTA
116 KTA
Pre
limin
ary
Co
nfi
gura
tio
n
Pygas 373 KTA
Naphtha based
cracker
1.5 MTA
Existing Capacity
Expanding Capacity
Feedstock Required
Naphtha : 2.25 MTA
LPG : 0.6 MTA
Refinery Capacity 125 KBD
Balongan Refinery Expansion + Petrochemical Complex • Consider collaboration to integrate Balongan Refinery with
petrochemical complex • PERTAMINA and a partner is looking to upgrade/expand its
Balongan refinery
20
2015 2016
PID by end of 2015
2022
COD
2017
FID by 2Q/17
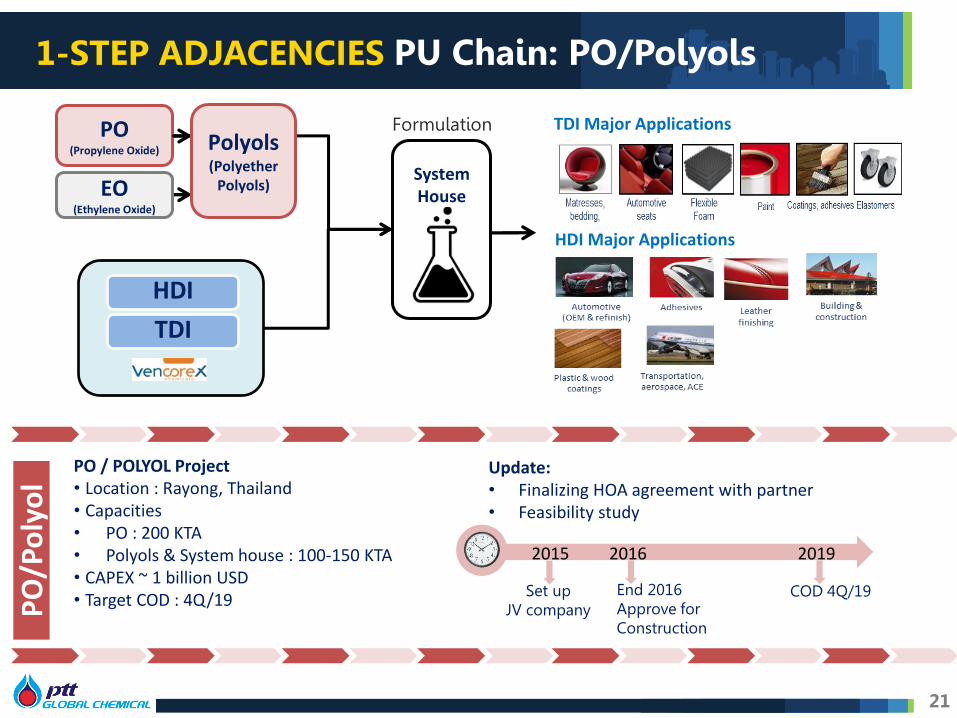
PO / POLYOL Project • Location : Rayong, Thailand • Capacities • PO : 200 KTA • Polyols & System house : 100-150 KTA • CAPEX ~ 1 billion USD • Target COD : 4Q/19
Update: • Finalizing HOA agreement with partner • Feasibility study
2015 2016
Set up JV company
2019
End 2016 Approve for Construction
COD 4Q/19
PO
/Po
lyo
l
TDI
HDI
PO (Propylene Oxide)
System House
Formulation Polyols (Polyether
Polyols)
Automotive
E&E
Construction 1-STEP ADJACENCIES PU Chain: PO/Polyols
EO (Ethylene Oxide)
TDI Major Applications
HDI Major Applications
21
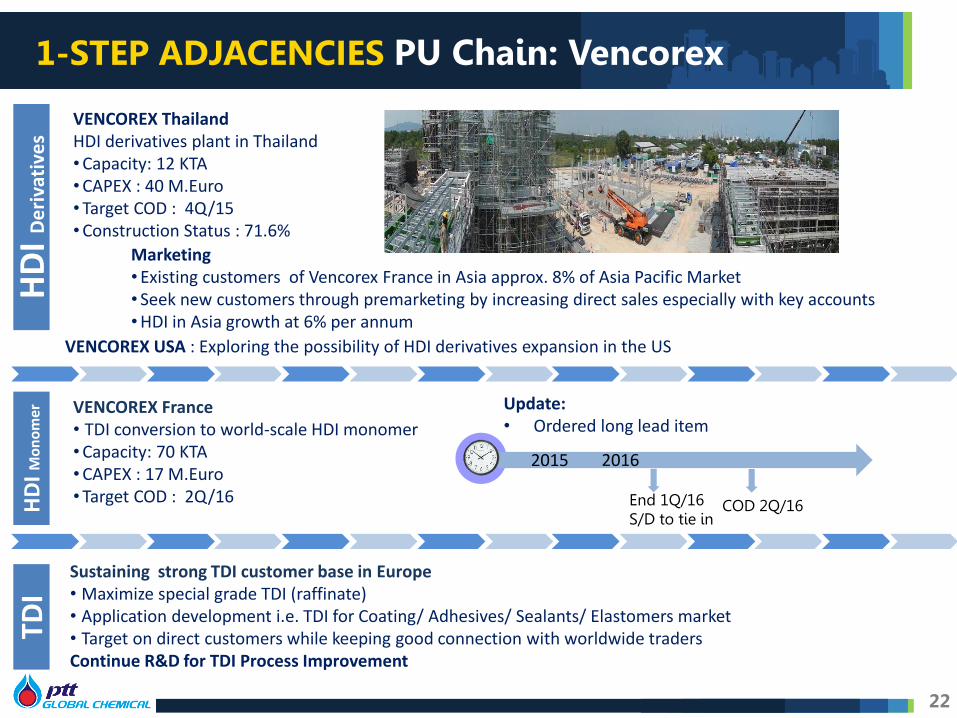
1-STEP ADJACENCIES PU Chain: Vencorex
VENCOREX Thailand HDI derivatives plant in Thailand • Capacity: 12 KTA • CAPEX : 40 M.Euro • Target COD : 4Q/15 • Construction Status : 71.6%
Marketing • Existing customers of Vencorex France in Asia approx. 8% of Asia Pacific Market • Seek new customers through premarketing by increasing direct sales especially with key accounts • HDI in Asia growth at 6% per annum
VENCOREX France • TDI conversion to world-scale HDI monomer • Capacity: 70 KTA • CAPEX : 17 M.Euro • Target COD : 2Q/16
2015 2016
COD 2Q/16 End 1Q/16 S/D to tie in
Update: • Ordered long lead item
HD
I De
riva
tive
s H
DI M
on
om
er
TDI
Sustaining strong TDI customer base in Europe • Maximize special grade TDI (raffinate) • Application development i.e. TDI for Coating/ Adhesives/ Sealants/ Elastomers market • Target on direct customers while keeping good connection with worldwide traders Continue R&D for TDI Process Improvement
VENCOREX USA : Exploring the possibility of HDI derivatives expansion in the US
22

23
GREEN: Bio-Hub
Succinic Acid Feedstock for bioplastic i.e. PBS Polylactic acid (PLA) Bio degradable plastic
Palm-Based
Sugar-Based
Bio Fuels
Oleochemical
Methyl Ester Vegetable based oil uses to blend with diesel and create bio diesel
Fatty Acid and Fatty Alcohol Basic oleochemical product uses for personal care industry Glycerin By product of methyl ester and fatty alcohol for food, medicine, and personal care products
Bio Plastic
B I O H U B
R&D Biotechnology Bio-hub Increase competitiveness to
create sustainability
3D Printing

24
Raw Sugar Cane Juice/ Palm Oil
Utilities
Waste
Waste
Biogas
Electricity/Steam
Biomass
Fertilizer
Electricity/Steam
Bioplastics/ Biochemicals
Biofuels
Biopower
Plantation B i o h u b C o n c e p t
Cogeneration
Crushing Mill
Bioplastics Biochemicals
Biofuels
Utility & Waste
Raw Sugar/ Cane Juice/ Palm Oil
Waste
Waste
Electrical/ Steam
Biomass
Fertilizer Electrical/Steam
Bioplastics/ Biochemicals
Biofuels
Biopower
Plantation B i o h u b C o n c e p t
Cogeneration
Crushing Mill
Bioplastics Biochemicals
Biofuels Biogas
Utilities
Utility & Waste system
Create Sustainability in a Long Term
• Interdependence feedstock which creates feedstock security • Saving on logistic cost from proximity to feedstock location • Saving on energy cost from turning waste into biofuel • Saving from infrastructure sharing
Integration
GREEN: Bio-Hub Concept

25
Agricultural Feedstock
Fermentation (Lactic Acid)
Monomer/Polymer (Lactide/PLA)
Polymer
(PLA) Application
• Thailand Plant : Integration with Cargill’s Lactic Acid Technology will enable
NatureWorks to invest in second fully integrated PLA Plant located in Thailand,
supporting Thai National BIO-HUB Policy
2nd PLA Plant in Thailand
HLA Backward Integration
GREEN: NatureWorks
Local Feedstock
PLA
Value Chain
• US Plant : Lactic Acid contributes 50-70% of PLA cost, moving upstream to
integrate Lactic Acid supply will increase competitive position; driving PLA
business in a sustainable model
3D Printing
• PTTGC’s Business Overview • Strategic Actions • Financial Performance • Market Outlook
AGENDA
26
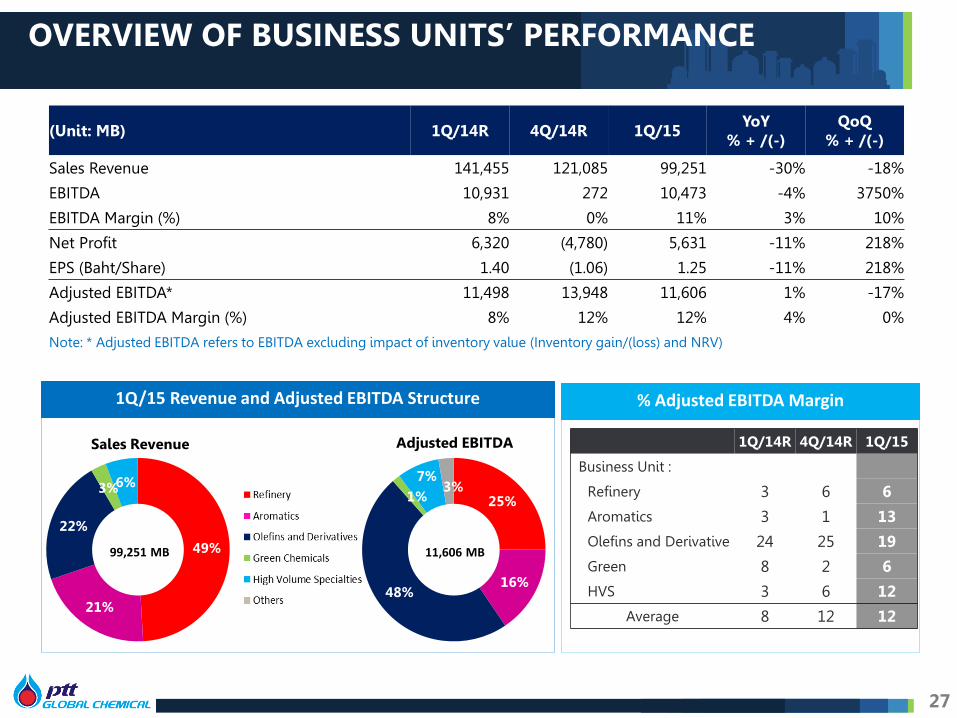
OVERVIEW OF BUSINESS UNITS’ PERFORMANCE
49%
21%
22%
3% 6%
Sales Revenue
1Q/15 Revenue and Adjusted EBITDA Structure
99,251 MB 11,606 MB
% Adjusted EBITDA Margin
(Unit: MB) 1Q/14R 4Q/14R 1Q/15 YoY
% + /(-) QoQ
% + /(-)
Sales Revenue 141,455 121,085 99,251 -30% -18%
EBITDA 10,931 272 10,473 -4% 3750%
EBITDA Margin (%) 8% 0% 11% 3% 10%
Net Profit 6,320 (4,780) 5,631 -11% 218%
EPS (Baht/Share) 1.40 (1.06) 1.25 -11% 218%
Adjusted EBITDA* 11,498 13,948 11,606 1% -17%
Adjusted EBITDA Margin (%) 8% 12% 12% 4% 0%
Note: * Adjusted EBITDA refers to EBITDA excluding impact of inventory value (Inventory gain/(loss) and NRV)
27
25%
16% 48%
1% 7%
3%
Adjusted EBITDA 1Q/14R 4Q/14R 1Q/15
Business Unit : Refinery 3 6 6
Aromatics 3 1 13
Olefins and Derivative 24 25 19
Green 8 2 6
HVS 3 6 12
Average 8 12 12
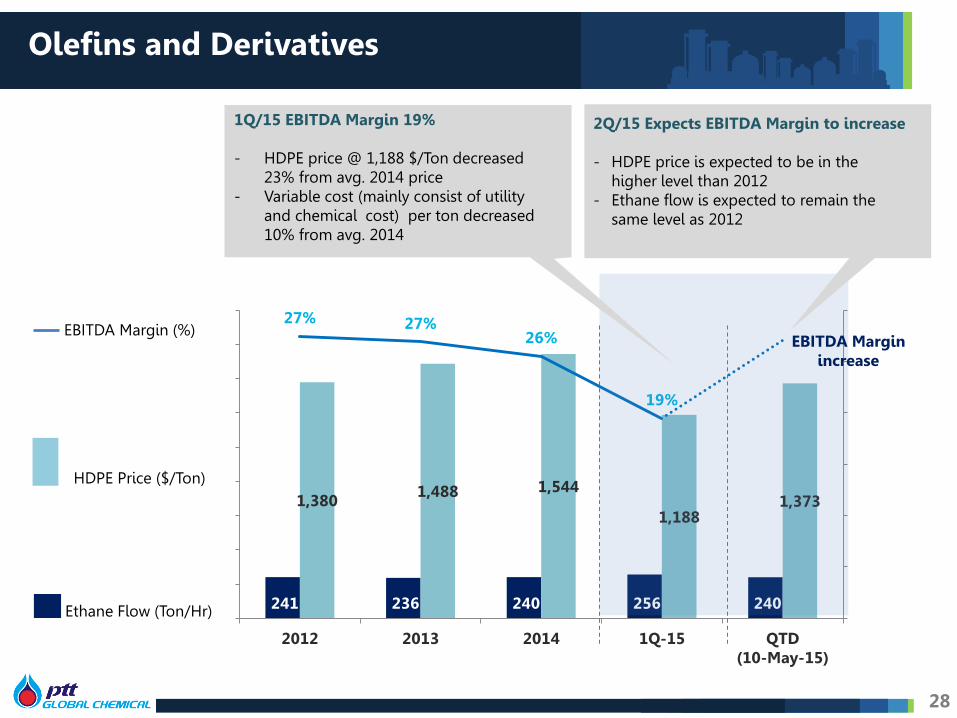
241 236 240 256 240
1,380 1,488 1,544
1,188 1,373
27% 27% 26%
19%
0%
5%
10%
15%
20%
25%
30%
-
200
400
600
800
1,000
1,200
1,400
1,600
1,800
2012 2013 2014 1Q-15 QTD(10-May-15)
Ethane Flow (Ton/Hr)
EBITDA Margin (%)
HDPE Price ($/Ton)
1Q/15 EBITDA Margin 19%
- HDPE price @ 1,188 $/Ton decreased 23% from avg. 2014 price
- Variable cost (mainly consist of utility and chemical cost) per ton decreased 10% from avg. 2014
2Q/15 Expects EBITDA Margin to increase
- HDPE price is expected to be in the higher level than 2012
- Ethane flow is expected to remain the same level as 2012
Olefins and Derivatives
EBITDA Margin increase
28
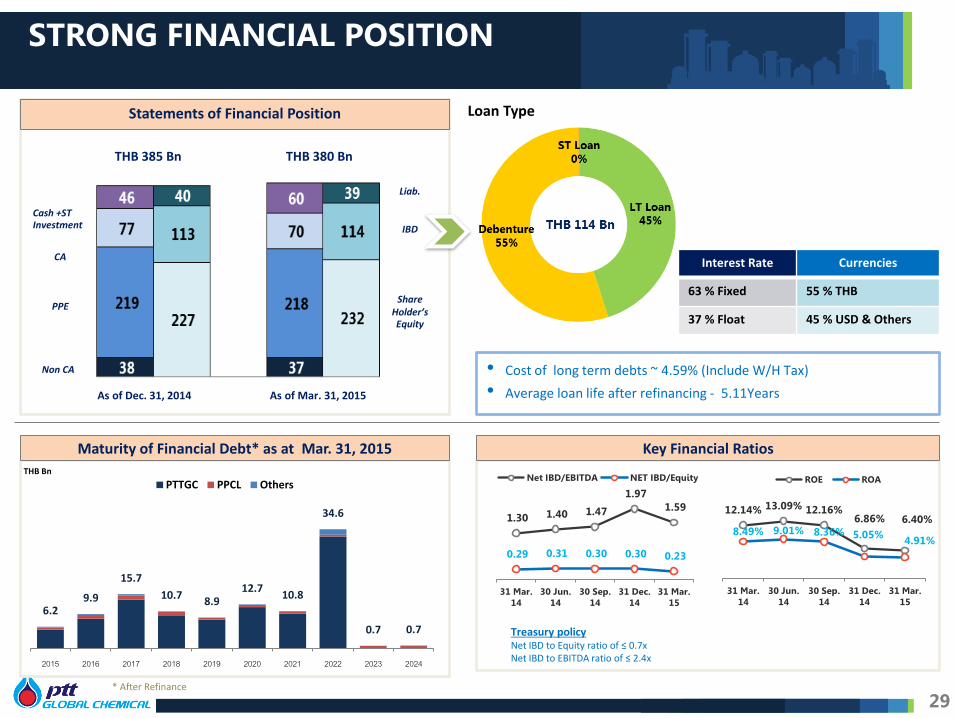
STRONG FINANCIAL POSITION
Maturity of Financial Debt* as at Mar. 31, 2015
Interest Rate Currencies
63 % Fixed 55 % THB
37 % Float 45 % USD & Others
Loan Type
• Cost of long term debts ~ 4.59% (Include W/H Tax)
• Average loan life after refinancing - 5.11Years
Treasury policy Net IBD to Equity ratio of ≤ 0.7x Net IBD to EBITDA ratio of ≤ 2.4x
THB Bn
* After Refinance
Key Financial Ratios
Statements of Financial Position
As of Dec. 31, 2014 As of Mar. 31, 2015
THB 385 Bn THB 380 Bn
Cash +ST Investment
CA
Non CA
PPE
Liab.
IBD
Share Holder’s Equity
6.2 9.9
15.7
10.7 8.9
12.7 10.8
34.6
0.7 0.7
2015 2016 2017 2018 2019 2020 2021 2022 2023 2024
PTTGC PPCL Others
1.30 1.40 1.47
1.97 1.59
0.29 0.31 0.30 0.30 0.23
31 Mar.14
30 Jun.14
30 Sep.14
31 Dec.14
31 Mar.15
Net IBD/EBITDA NET IBD/Equity
12.14% 13.09% 12.16% 6.86% 6.40%
8.49% 9.01% 8.36% 5.05% 4.91%
31 Mar.14
30 Jun.14
30 Sep.14
31 Dec.14
31 Mar.15
ROE ROA
29
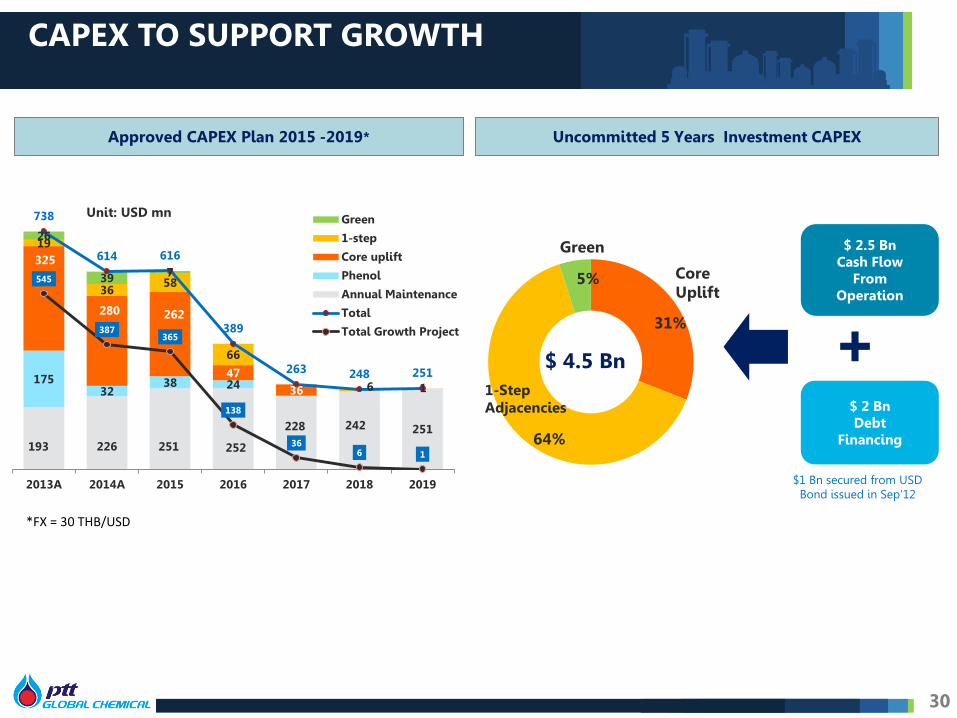
CAPEX TO SUPPORT GROWTH
193 226 251 252
228 242 251
175 32
38 24
325
280 262
47 36
19
36 58
66
6 1
26
39 7
738
614 616
389
263 248 251
545
387 365
138
36 6 1
2013A 2014A 2015 2016 2017 2018 2019
Green
1-step
Core uplift
Phenol
Annual Maintenance
Total
Total Growth Project
Approved CAPEX Plan 2015 -2019*
Unit: USD mn
Uncommitted 5 Years Investment CAPEX
$1 Bn secured from USD Bond issued in Sep’12
Green
5%
64%
1-Step Adjacencies
31%
Core Uplift
$ 4.5 Bn
$ 2.5 Bn Cash Flow
From Operation
$ 2 Bn Debt
Financing
30
*FX = 30 THB/USD

• PTTGC’s Business Overview • Strategic Actions • Financial Performance • Market Outlook
AGENDA
31

2015 Market Outlook Crude price in improve in short term with high volatility
– Crude demand/supply will be more balanced from growing demand during low oil price with slower U.S. crude output, however, record high of crude net long position
– Expect Dubai crude to increase in 2H/15 to 64 $/bbl at the end of the year.
Aromatics margins slightly improve – Paraxylene still in oversupply however, start up of new capacity maybe delayed. Chinese
regulators are more stringent after Dragon Aromatics’ incident. – Benzene demand improved from low crude oil price, however, higher naphtha crackers
operating rate may increase benzene supply from additional pygas volume.
Polyethylene strong prices from firm demand – Polyethylene market is quite balanced with more demand from emerging market
MEG margin recovers from polyester demand growth
– MEG market is more balanced from growing demand from polyester. Low inventory level of MEG in China.
CONCLUSION & MARKET OUTLOOK
32
• PTTGC’s Business Overview • Strategic Actions • Financial Performance • Market Outlook • Appendix
– 1Q/15 Financial Performance – Detail Market Outlook
AGENDA
33

Changes in Accounting Standards - PACK 5 TFRS 10 & TFRS 11 : Material effect to PTTGC
TAS 27 % of share holding De facto Control
TFRS 10
Equity Method Consolidate
PTTGC is under control of PTT and need to be consolidated
TFRS 10 : Consolidated Financial Statements
TAS 31 Joint Venture Joint Venture
TFRS 11
Proportionate Consolidated or
Equity Method
Equity Method
TFRS 11 : Joint Arrangements
To use equity method for all joint venture entities
Impact of TFRS 10
Effect to PTTGC o All business combination
between the companies under PTT’s control need to realize at cost
Previous Common Control Transaction o 2006 : BPE, PTTPE o 2011 : PTTCH + PTTAR o 2013 : GPSC
Effect to PTTGC o Joint Venture : to apply
equity method instead of previously used proportionate consolidation method
Joint Venture Entities o TEX (50%) o Emery (50%) o ESC (50%) o NatureWorks (50%)
Effect to Statement of Income o Reduction in depreciation
expense (of PPA value)
Effect to Statement of Financial Position o Reduction in total assets
(PPA & Goodwill)
o Reduction in total equity (deficit in equity)
Effect to Statement of Income o Reduction in revenue and
expense o Increment in share of profit
from investments o No effect to the Company’s
net profit
Effect to Statement of Financial Position o Reduction in total assets &
liabilities o Increment in investment in
joint ventures
Impact of TFRS 11
34

1Q/15 INCOME STATEMENT – CONSOLIDATED
***
1Q/14R** 4Q/14R** 1Q/15 YoY QoQ
MB % MB % MB % MB % MB %
Sales Revenue 141,455 100 121,085 100 99,251 100 (42,204) -30% (21,834) -18%
Feedstock Cost (117,581) (83) (95,112) (79) (75,721) (76) (41,860) -36% (19,391) -20%
Product to Feed Margin 23,874 17 25,973 21 23,530 24 (344) -1% (2,443) -9%
1 Variable Cost (7,062) (5) (7,358) (6) (6,809) (7) (253) -4% (549) -7%
2 Fixed Cost (4,075) (3) (4,039) (3) (3,514) (4) (561) -14% (525) -13%
3 Stock Gain/(Loss) & NRV (567) (0) (13,676) (11) (1,133) (1) (566) -100% 12,543 92%
4 Gain/(Loss) Commodity Hedging 184 0 1,229 1 (188) (0) (372) -202% (1,417) -115%
5 Other Income 990 1 1,421 1 926 1 (64) -6% (495) -35%
6 SG&A (2,413) (2) (3,278) (3) (2,339) (2) (74) -3% (939) -29%
EBITDA 10,931 8 272 0 10,473 11 (458) -4% 10,201 3750%
7 Depreciation & Amortization (3,857) (3) (4,040) (3) (3,979) (4) 122 3% (61) -2%
EBIT 7,074 5 (3,768) (3) 6,494 7 (580) -8% 10,262 272%
Finance Cost (1,176) (1) (1,117) (1) (1,076) (1) (100) -9% (41) -4%
8 FX Gain/(Loss) 617 0 (451) (0) 526 1 (91) -15% 977 217%
9 Shares of profit/(loss) from investments 36 0 (312) (0) 237 0 201 558% 549 176%
10 Income Tax Expense (402) (0) 923 1 (499) (1) 97 24% 1,422 154%
Net Profit 6,149 4 (4,725) (4) 5,682 6 (467) -8% 10,407 220%
Profit/(loss) attributable to:
Owners of the Company 6,320 4 (4,780) (4) 5,631 6 (689) -11% 10,411 218%
Non-controlling interests (171) (0) 55 0 51 0 222 130% (4) -7%
Adjusted EBITDA * 11,498 8 13,948 12 11,606 12 108 1% (2,342) -17%
Note: * Adjusted EBITDA refers to EBITDA excluding impact of inventory value (excludes Inventory gain/(loss) and NRV)
** Restated 1Q/2014 and 4Q/2014 Income Statements from the implementation of new accounting standards (Pack 5)
35
132.4 147.5 146.5 148.6 148.2 146.6 147.8
54.7 56.2 52.4 59.4 61.0 52.0 60.3
187.1 203.7 198.9 208.0 209.2 198.6 208.1
2013 2014 1Q/14 2Q/14 3Q/14 4Q/14 1Q/15
Crude Condenstate Residue & Others
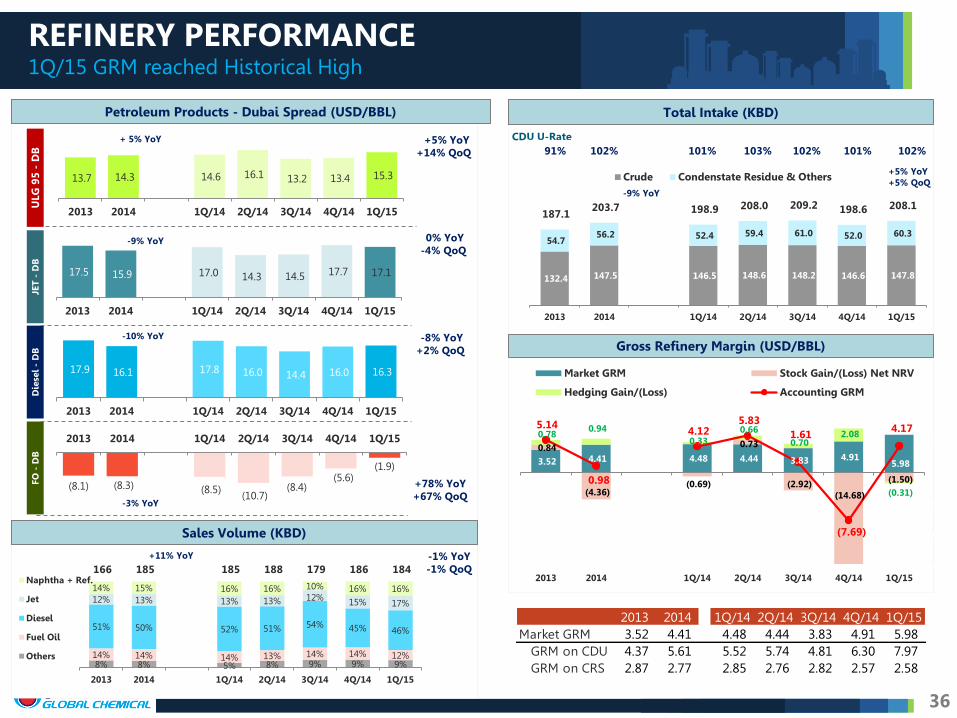
REFINERY PERFORMANCE 1Q/15 GRM reached Historical High
13.7 14.3 14.6 16.1 13.2 13.4 15.3
2013 2014 1Q/14 2Q/14 3Q/14 4Q/14 1Q/15
17.5 15.9 17.0 14.3 14.5 17.7 17.1
2013 2014 1Q/14 2Q/14 3Q/14 4Q/14 1Q/15
17.9 16.1 17.8 16.0 14.4 16.0 16.3
2013 2014 1Q/14 2Q/14 3Q/14 4Q/14 1Q/15
(8.1) (8.3) (8.5) (10.7) (8.4)
(5.6) (1.9)
2013 2014 1Q/14 2Q/14 3Q/14 4Q/14 1Q/15
8% 8% 5% 8% 9% 9% 9% 14% 14% 14% 13% 14% 14% 12%
51% 50% 52% 51% 54% 45% 46%
12% 13% 13% 13% 12% 15% 17%
14% 15% 16% 16% 10% 16% 16%
166 185 185 188 179 186 184
2013 2014 1Q/14 2Q/14 3Q/14 4Q/14 1Q/15
Naphtha + Ref.
Jet
Diesel
Fuel Oil
Others
ULG
95
- D
B
JET
- D
B
Die
sel -
DB
FO
- D
B
Petroleum Products - Dubai Spread (USD/BBL)
+5% YoY +14% QoQ
0% YoY -4% QoQ
-8% YoY +2% QoQ
+78% YoY +67% QoQ
Gross Refinery Margin (USD/BBL)
Total Intake (KBD)
Sales Volume (KBD)
CDU U-Rate
-1% YoY -1% QoQ
+ 5% YoY
-9% YoY
-10% YoY
91% 102% 101% 103% 102% 101% 102%
+11% YoY
+5% YoY +5% QoQ
-3% YoY
-9% YoY
36
2013 2014 1Q/14 2Q/14 3Q/14 4Q/14 1Q/15Market GRM 3.52 4.41 4.48 4.44 3.83 4.91 5.98 GRM on CDU 4.37 5.61 5.52 5.74 4.81 6.30 7.97 GRM on CRS 2.87 2.77 2.85 2.76 2.82 2.57 2.58
3.52 4.41 4.48 4.44 3.83 4.91 5.98
0.84
(4.36) (0.69)
0.73
(2.92) (14.68)
(1.50)
0.78 0.94
0.33 0.66
0.70 2.08
(0.31)
5.14
0.98
4.12 5.83
1.61
(7.69)
4.17
(15.00)
(10.00)
(5.00)
-
5.00
(15.00)
(10.00)
(5.00)
-
5.00
2013 2014 1Q/14 2Q/14 3Q/14 4Q/14 1Q/15
Market GRM Stock Gain/(Loss) Net NRV
Hedging Gain/(Loss) Accounting GRM
380 375 380 370 430
320 217
2013 2014 1Q/14 2Q/14 3Q/14 4Q/14 1Q/15
-1% YoY
557 400 386 334
479 401 333
2013 2014 1Q/14 2Q/14 3Q/14 4Q/14 1Q/15
-28% YoY
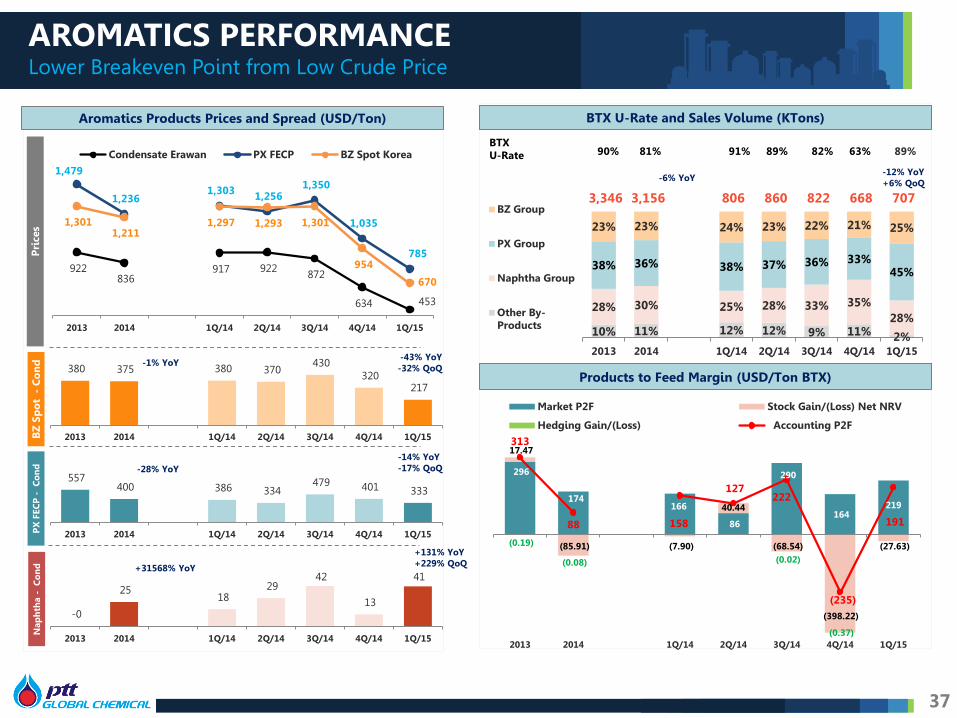
AROMATICS PERFORMANCE Lower Breakeven Point from Low Crude Price
Pri
ces
PX
FEC
P -
Co
nd
B
Z S
po
t -
Co
nd
Aromatics Products Prices and Spread (USD/Ton)
-14% YoY -17% QoQ
-43% YoY -32% QoQ
Products to Feed Margin (USD/Ton BTX)
BTX U-Rate and Sales Volume (KTons)
BTX U-Rate
-12% YoY +6% QoQ
90% 81% 91% 89% 82% 63% 89%
-6% YoY
922 836
917 922 872
634 453
1,479
1,236 1,303 1,256
1,350
1,035
785
1,301 1,211
1,297 1,293 1,301
954
670
2013 2014 1Q/14 2Q/14 3Q/14 4Q/14 1Q/15
Condensate Erawan PX FECP BZ Spot Korea
37
10% 11% 12% 12% 9% 11% 2%
28% 30% 25% 28% 33% 35% 28%
38% 36% 38% 37% 36% 33% 45%
23% 23% 24% 23% 22% 21% 25%
3,346 3,156 806 860 822 668 707
2013 2014 1Q/14 2Q/14 3Q/14 4Q/14 1Q/15
BZ Group
PX Group
Naphtha Group
Other By-Products
296
174 166
86
290
164 219
17.47
(85.91) (7.90)
40.44
(68.54)
(398.22)
(27.63) (0.19)
(0.08) (0.02)
(0.37)
313
88 158
127 222
(235)
191
(400)
(300)
(200)
(100)
-
100
200
300
(400)
(300)
(200)
(100)
-
100
200
300
2013 2014 1Q/14 2Q/14 3Q/14 4Q/14 1Q/15
Market P2F Stock Gain/(Loss) Net NRV
Hedging Gain/(Loss) Accounting P2F
Nap
hth
a -
Co
nd
CR
- C
on
d
-0
25 18
29 42
13
41
2013 2014 1Q/14 2Q/14 3Q/14 4Q/14 1Q/15
-25 -32 -38 -48 -42
-1
20
2013 2014 1Q/14 2Q/14 3Q/14 4Q/14 1Q/15
+131% YoY +229% QoQ
+151% YoY +3088% QoQ
+31568% YoY
-30% YoY
OLEFINS AND DERIVATIVES PERFORMANCE Softer HDPE price led to lower adjusted EBITDA margin
38
Pri
ces
MEG
AC
P –
0.6
5Eth
ylen
e H
DP
E -
Nap
hth
a
Olefins Derivatives Prices and Spread (USD/Ton)
-4% YoY -4% QoQ
+12% YoY -13% QoQ
Adjusted EBITDA Margin
U-Rate (%)
GAS : NAPHTHA Intake %
HDPE Price -24% YoY -18% QoQ
Sales Volume (KTons)
KTons
2013 2014 1Q/14 2Q/14 3Q/14 4Q/14 1Q/15 Olefins 90% 91% 77% 91% 94% 101% 96%
HDPE 106% 107% 93% 107% 114% 115% 109% LLDPE 103% 100% 99% 112% 84% 105% 110% LDPE 76% 105% 115% 93% 104% 106% 99%
Total PE 99% 105% 99% 106% 104% 111% 107% MEG 94% 95% 65% 99% 112% 104% 108%
2013 2014 1Q/14 2Q/14 3Q/14 4Q/14 1Q/15 Olefins 756 708 134 168 182 224 196
HDPE 834 873 202 218 210 243 219 LLDPE 397 407 98 105 85 120 108 LDPE 218 323 72 92 75 83 80
Total PE 1,449 1,603 373 415 369 446 407 MEG 372 382 71 95 110 107 102
2013 2014 1Q/14 2Q/14 3Q/14 4Q/14 1Q/15HDPE (FILM) SEA 1,488 1,544 1,554 1,569 1,604 1,448 1,188 LLDPE CFR SEA 1,487 1,543 1,560 1,578 1,601 1,431 1,181 LDPE CFR SE Asia 1,534 1,571 1,639 1,605 1,601 1,440 1,192 MEG ACP 1,202 1,113 1,182 1,093 1,143 1,035 903 Naphtha MOPJ 921 861 935 951 913 647 494
566 682 620 618 691
802 694
2013 2014 1Q/14 2Q/14 3Q/14 4Q/14 1Q/15
+21% YoY
323
206 245
152 182 246 236
2013 2014 1Q/14 2Q/14 3Q/14 4Q/14 1Q/15
-36% YoY 27% 26% 24% 25% 28%
25% 19%
2013 2014 1Q/14 2Q/14 3Q/14 4Q/14 1Q/15
38
56% 56% 60% 54% 55% 58% 56%
34% 35% 27% 35% 40% 36% 37% 10% 8% 13% 11% 4% 6% 7%
3,709 3,727 799 932 965 1,032 991
2013 2014 1Q/14 2Q/14 3Q/14 4Q/14 1Q/15
Ethane Other Gas Naphtha
1,488 1,544 1,554 1,569 1,604 1,448
1,188
1,487 1,543 1,560 1,578 1,601 1,431
1,181
1,534 1,571 1,639 1,605 1,601
1,440
1,192
1,202 1,113 1,182
1,093
1,143 1,035
903 921 861 935 951 913
647 494
2013 2014 1Q/14 2Q/14 3Q/14 4Q/14 1Q/15
HDPE (FILM) SEA LLDPE CFR SEA LDPE CFR SE AsiaMEG ACP Naphtha MOPJ
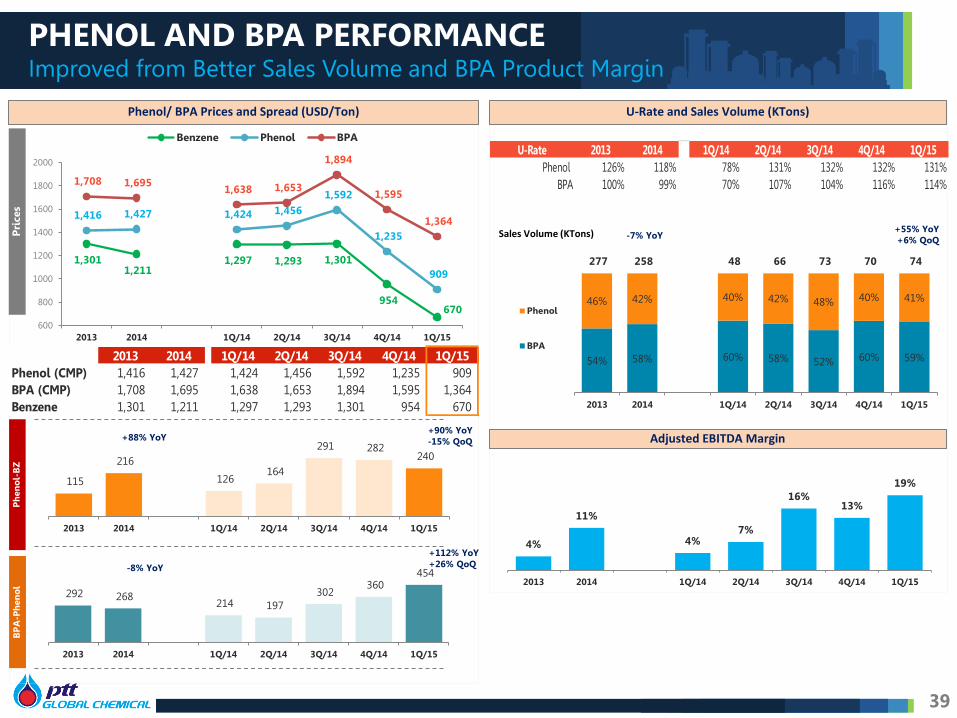
PHENOL AND BPA PERFORMANCE Improved from Better Sales Volume and BPA Product Margin
Pri
ces
BP
A-P
hen
ol
Ph
eno
l-B
Z
Phenol/ BPA Prices and Spread (USD/Ton) U-Rate and Sales Volume (KTons)
Sales Volume (KTons)
Adjusted EBITDA Margin
+55% YoY +6% QoQ
+90% YoY -15% QoQ
+112% YoY +26% QoQ
-7% YoY
1,301 1,211
1,297 1,293 1,301
954 670
1,416 1,427 1,424 1,456 1,592
1,235
909
1,708 1,695 1,638 1,653
1,894
1,595
1,364
600
800
1000
1200
1400
1600
1800
2000
2013 2014 1Q/14 2Q/14 3Q/14 4Q/14 1Q/15
Benzene Phenol BPA
2013 2014 1Q/14 2Q/14 3Q/14 4Q/14 1Q/15Phenol (CMP) 1,416 1,427 1,424 1,456 1,592 1,235 909 BPA (CMP) 1,708 1,695 1,638 1,653 1,894 1,595 1,364 Benzene 1,301 1,211 1,297 1,293 1,301 954 670
U-Rate 2013 2014 1Q/14 2Q/14 3Q/14 4Q/14 1Q/15Phenol 126% 118% 78% 131% 132% 132% 131%
BPA 100% 99% 70% 107% 104% 116% 114%
54% 58% 60% 58% 52% 60% 59%
46% 42% 40% 42% 48% 40% 41%
277 258 48 66 73 70 74
2013 2014 1Q/14 2Q/14 3Q/14 4Q/14 1Q/15
Phenol
BPA
4%
11%
4% 7%
16% 13%
19%
2013 2014 1Q/14 2Q/14 3Q/14 4Q/14 1Q/15
115
216
126 164
291 282 240
2013 2014 1Q/14 2Q/14 3Q/14 4Q/14 1Q/15
+88% YoY
292 268 214 197
302 360
454
2013 2014 1Q/14 2Q/14 3Q/14 4Q/14 1Q/15
-8% YoY
39
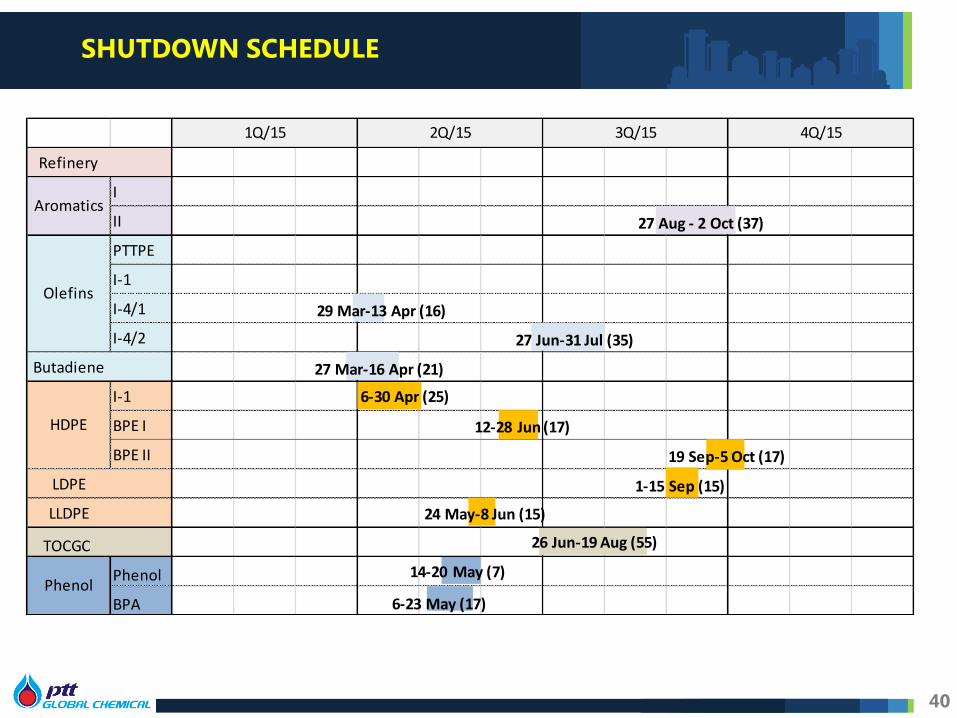
SHUTDOWN SCHEDULE
Refinery
I
II
PTTPE
I-1
I-4/1
I-4/2
Butadiene
I-1
BPE I
BPE II
LDPE
LLDPE
TOCGC
Phenol
BPA
4Q/15
Phenol
Aromatics
Olefins
HDPE
1Q/15 2Q/15 3Q/15
27 Jun-31 Jul (35)
27 Aug - 2 Oct (37)
29 Mar-13 Apr (16)
27 Mar-16 Apr (21)
6-30 Apr (25)
12-28 Jun (17)
19 Sep-5 Oct (17)
1-15 Sep (15)
24 May-8 Jun (15)
26 Jun-19 Aug (55)
6-23 May (17)
14-20 May (7)
40

• PTTGC’s Business Overview • Strategic Actions • Financial Performance • Market Outlook • Appendix
– 1Q/15 Financial Performance – Detail Market Outlook
AGENDA
41
42
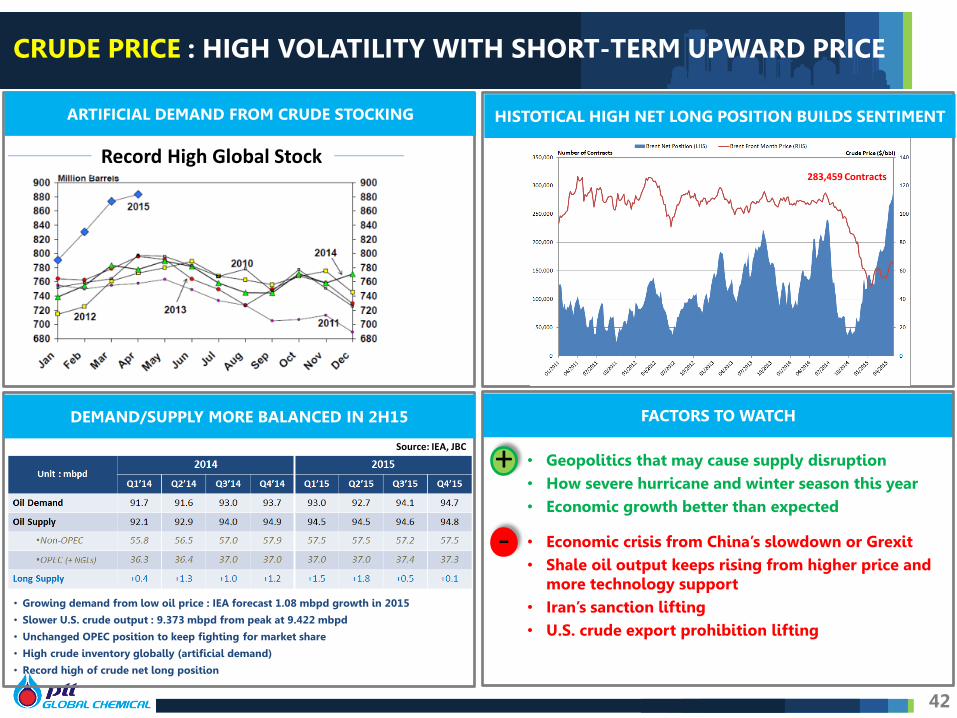
FACTORS TO WATCH DEMAND/SUPPLY MORE BALANCED IN 2H15
CRUDE PRICE : HIGH VOLATILITY WITH SHORT-TERM UPWARD PRICE
Source: IEA, JBC
• Growing demand from low oil price : IEA forecast 1.08 mbpd growth in 2015
• Slower U.S. crude output : 9.373 mbpd from peak at 9.422 mbpd
• Unchanged OPEC position to keep fighting for market share
• High crude inventory globally (artificial demand)
• Record high of crude net long position
ARTIFICIAL DEMAND FROM CRUDE STOCKING
Record High Global Stock
• Geopolitics that may cause supply disruption • How severe hurricane and winter season this year • Economic growth better than expected
• Economic crisis from China’s slowdown or Grexit • Shale oil output keeps rising from higher price and
more technology support • Iran’s sanction lifting • U.S. crude export prohibition lifting
-
+
HISTOTICAL HIGH NET LONG POSITION BUILDS SENTIMENT
283,459 Contracts

43
FACTORS TO WATCH
-
+ PRISM RAISES DUBAI PRICE (2015 AVG.) TO USD 60.8/BBL
35
40
45
50
55
60
65
70
75
Jan Feb Mar Apr May Jun Jul Aug Sep Oct Nov Dec
USD/BBL
1
2
3
75.0
69.1
64.0
Jan 15 Forecast: Dubai Avg. USD 53.0/bbl
Feb 15 Forecast: Dubai Avg. USD 55.4/bbl
May 15 Forecast: Dubai Avg. USD 60.8/bbl
Source: PRISM, May 15
1
2
3
CRUDE PRICE : HIGH VOLATILITY WITH SHORT-TERM UPWARD PRICE
• Geopolitics that may cause supply disruption • How severe hurricane and winter season this year • Economic growth better than expected
• Economic crisis from China’s slowdown or Grexit • Shale oil output keeps rising from higher price and
more technology support • Iran’s sanction lifting • U.S. crude export prohibition lifting
ARTIFICIAL DEMAND FROM CRUDE STOCKING
Record High Global Stock
HISTOTICAL HIGH NET LONG POSITION BUILDS SENTIMENT
283,459 Contracts
2012 2013 2014 2015
44
NEW CAPACITY ADDITION IN ASIA/MIDDLE EAST
• Higher oil demand and inventory build up from low prices
• Delayed start-up or technical problem of new capacity
• China’s economic growth slow down • More product export from U.S. refiners due to high
margin • High product inventory will squeeze future margim
FACTORS TO WATCH
-
+ 17.8 16.0
14.4 16.0 16.3
13.8 13.0
14.8
14.6 16.1
13.2 13.4 15.4
16.9
14.5
12.2
-8.5 -10.6
-8.4
-5.6
-1.8
-4.5 -5.6
-5.5
-12
-8
-4
0
4
8
12
16
20
1Q14 2Q14 3Q14 4Q14 1Q15 2Q15 (F) 3Q15 (F) 4Q15 (F)
USD/BBL
Diesel-Dubai
ULG95-Dubai
Fuel Oil-Dubai
• Gasoline : Peak demand in July from U.S. driving season and Ramadan
• Gasoil : Oversupply in region, must export to Europe
• Fuel Oil : Still demand in Asia for bunkers and power plants
SOFTER MARGIN IN H2 FROM NEW CAPACITY START-UP
Source: PRISM, May 15
REFINING : GRM BETTER THAN EXPECTED BUT TENDS TO BE SOFTENED
2015 Major Addition (KBD) • Yanbu (Saudi) +400 (S/U) • Ruwais (UAE) +417 (S/U) • IOC (India) +300 (Q2) • Petrobas (Brazil) +230 • CNOOC (China) +140 (S/U) • NOCL (India) +125 • PetroChina +100
2015 Major Shutdown (KBD) • BP (Australia) -102
UNIT: KBD
Source: IEA, JBC
Demand Growth
Net Capacity Addition 1,639
188
689
-294
899
1,205
650
1,080
GLOBAL GRM IMPROVES SINCE OIL PRICE FALLING
Ruwais refinery (UAE 417 kbd) has a technical problem during commissioning RFCCU
• Higher product demand
• Keep inventory due to contango price
• Lower fuel and loss

AROMATICS : IMPROVING MARGINS BUT STILL IN DOWNTURN
45
FIRE AT DRAGON AROMATICS SUPPORTS MARGIN
PX/BZ MARGINS SLIGHTLY IMPROVE FROM 1Q15
BZ STARTS OVERSUPPLY BUT ASIA PRICE GOOD
360 372 333 379 387 388 350 256 176 278 293 275
1,211
810
670
838 853 879
1,222
926 827
939 948 992
0
200
400
600
800
1,000
1,200
1,400
2014 2015 1Q15 2Q15 (F) 3Q15 (F) 4Q15 (F)
PX-MOPJ BZ-MOPJ
USD/MT
Paraxylene
Benzene
FACTORS TO WATCH
-
+ Source: PRISM, May 15
2014 2015
Demand Growth (MT)
1.34 2.08
Capacity Growth (MT)
4.67 3.79
O/R (%) 80.8 78.0
PARAXYLENE DEMAND/SUPPLY
• Market is oversupply in 2015 • Dragon Aromatics’ incident boosted
PX margin in Q2
2014 2015
Demand Growth (MT)
1.71 1.02
Capacity Growth (MT)
0.99 1.20
O/R (%) 72.5 72.4
BENZENE DEMAND/SUPPLY
• Market is oversupply in 2015 • China’s import considerably
increases after crude prices become more stable
Incident at Dragon Aromatics on April 6 (PX 1.6 mtpa; BZ 460 ktpa)
MORE CHINA’S BENZENE IMPORT IN 2015
2015
2014
• Limited reformate for aromatics feedstock in China from growing gasoline demand
• More stringent regulation in China after Dragon Aromatics’ incident
• Delayed start-up of new capacity • Higher end-product demand from low oil price
• China’s economic growth slow down • Increased benzene supply from naphtha crackers’
pygas
46
FIRE AT DRAGON AROMATICS SUPPORTS MARGIN
PX/BZ MARGINS SLIGHTLY IMPROVE FROM 1Q15
BENZENE PRICE IN ASIA STRONGER THAN OTHER REGIONS
USD/MT
Paraxylene
Benzene
• Limited reformate for aromatics feedstock in China from growing gasoline demand
• More stringent regulation in China after Dragon Aromatics’ incident
• Delayed start-up of new capacity • Higher end-product demand from low oil price
• China’s economic growth slow down • Increased benzene supply from naphtha crackers’
pygas
FACTORS TO WATCH
-
+ Source: PRISM, May 15
2014 2015
Demand Growth (MT)
1.34 2.08
Capacity Growth (MT)
4.67 3.79
O/R (%) 80.8 78.0
PARAXYLENE DEMAND/SUPPLY
• Market is oversupply in 2015 • Dragon Aromatics’ incident boosted
PX margin in Q2 Incident at Dragon Aromatics on April 6 (PX 1.6 mtpa; BZ 460 ktpa)
USD/MT
KOREA NWE
USGC
360 372 333 379 387 388 350 256 176 278 293 275
1,211
810
670
838 853 879
1,222
926 827
939 948 992
0
200
400
600
800
1,000
1,200
1,400
2014 2015 1Q15 2Q15 (F) 3Q15 (F) 4Q15 (F)
PX-MOPJ BZ-MOPJ
AROMATICS : IMPROVING MARGINS BUT STILL IN DOWNTURN

47
CRACKER OUTAGE BOOSTS CURRENT ETHYLENE PRICE
FACTORS TO WATCH
00.10.20.30.40.50.60.70.8
Jan
-15
Feb
-15
Mar
-15
Ap
r-1
5
May
-15
• More PE demand from emerging markets
• China’s economic growth slow down • Competition from polypropylene (PP) • Iran sanction lifting
POLYETHYLENE : STRONG PRICES FROM FIRM DEMAND
ASIAN ETHYLENE PRICE IS STRONGEST FROM OUTAGE
+ -
HDPE PRICE SUSTAINS ABOVE USD 1,300/MT
2014 2015
Demand Growth (MT)
2.89 5.59
Capacity Growth (MT)
2.90 4.70
O/R (%) 89.4 91.0
ETHYLENE DEMAND/SUPPLY
• Market is tight in 2015 • Unplanned shutdown more tightened
market
MT
ASIAN CRACKER CAPACITY OUTAGE
536 689
533 793 721 711
148 117
161
46 133 129
1,546
1,363
1,188
1,404 1,418 1,443
1,398
1,246
1,026
1,358 1,284 1,315
0
200
400
600
800
1,000
1,200
1,400
1,600
2014 2015 1Q15 2Q15 (F) 3Q15 (F) 4Q15 (F)
Ethylene-MOPJ HDPE-EthyleneSource: PRISM, May 15
USD/MT
Ethylene
HDPE
PLANNED
UNPLANNED Ethylene Jan USD 912/MT
Ethylene May USD 1,390/MT
USD/MT
SEA NEA
USGC
WE
48
CRACKER OUTAGE BOOSTS CURRENT ETHYLENE PRICE
FACTORS TO WATCH
00.10.20.30.40.50.60.70.8
Jan
-15
Feb
-15
Mar
-15
Ap
r-1
5
May
-15
• More PE demand from emerging markets
• China’s economic growth slow down • Competition from polypropylene (PP) • Iran sanction lifting
POLYETHYLENE : STRONG PRICES FROM FIRM DEMAND
REGIONAL PE BALANCED WITH HIGH DEMAND FROM CHINA
+ -
HDPE PRICE SUSTAINS ABOVE USD 1,300/MT
2.15
2.52
0.0
0.5
1.0
1.5
2.0
2.5
3.0
4Q14 1Q15
2014 2015
Demand Growth (MT)
3.62 4.38
Capacity Growth (MT)
1.96 4.55
O/R (%) 86.3 86.6
POLYETHYLENE DEMAND/SUPPLY IN ASIA HIGHER CHINA’S PE IMPORT IN 1Q15
HDPE
LLDPE
LDPE • Market is quite balanced in 2015 • China’s import considerably
increases after crude prices become more stable
MT
2014 2015
Demand Growth (MT)
2.89 5.59
Capacity Growth (MT)
2.90 4.70
O/R (%) 89.4 91.0
ETHYLENE DEMAND/SUPPLY
• Market is tight in 2015 • Unplanned shutdown more tightened
market
MT
ASIAN CRACKER CAPACITY OUTAGE
536 689
533 793 721 711
148 117
161
46 133 129
1,546
1,363
1,188
1,404 1,418 1,443
1,398
1,246
1,026
1,358 1,284 1,315
0
200
400
600
800
1,000
1,200
1,400
1,600
2014 2015 1Q15 2Q15 (F) 3Q15 (F) 4Q15 (F)
Ethylene-MOPJ HDPE-EthyleneSource: PRISM, May 15
USD/MT
Ethylene
HDPE
PLANNED
UNPLANNED Ethylene Jan USD 912/MT
Ethylene May USD 1,390/MT
49
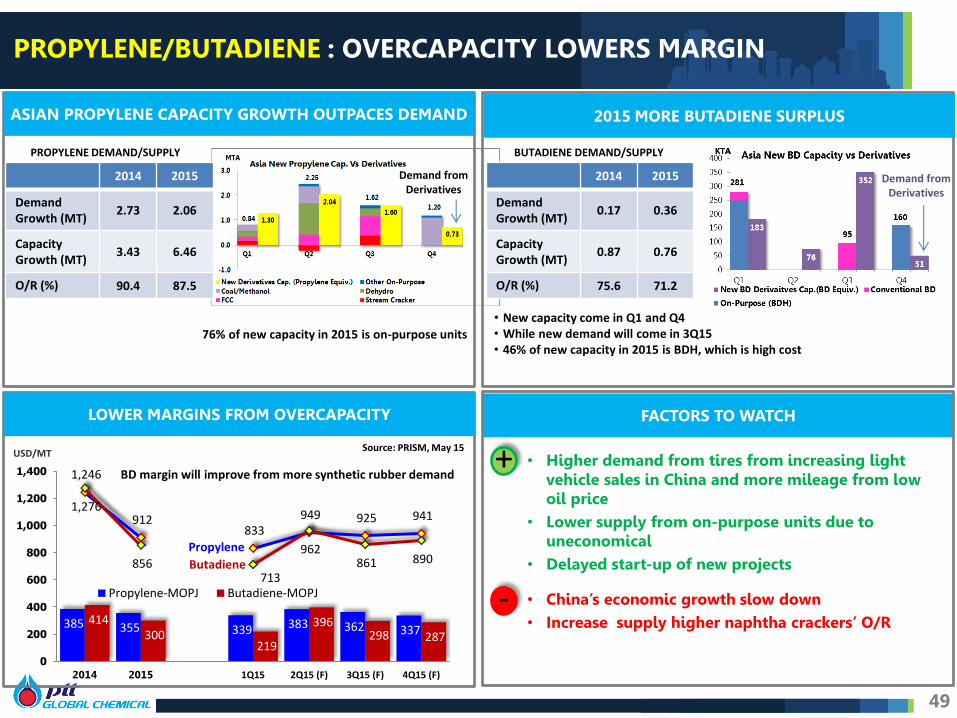
ASIAN PROPYLENE CAPACITY GROWTH OUTPACES DEMAND
LOWER MARGINS FROM OVERCAPACITY FACTORS TO WATCH
PROPYLENE/BUTADIENE : OVERCAPACITY LOWERS MARGIN
2015 MORE BUTADIENE SURPLUS
2014 2015
Demand Growth (MT)
2.73 2.06
Capacity Growth (MT)
3.43 6.46
O/R (%) 90.4 87.5
PROPYLENE DEMAND/SUPPLY
76% of new capacity in 2015 is on-purpose units
2014 2015
Demand Growth (MT)
0.17 0.36
Capacity Growth (MT)
0.87 0.76
O/R (%) 75.6 71.2
BUTADIENE DEMAND/SUPPLY
• New capacity come in Q1 and Q4 • While new demand will come in 3Q15 • 46% of new capacity in 2015 is BDH, which is high cost
385 355 339 383 362 337 414
300 219
396 298 287
1,246
912 833
949 925 941 1,276
856 713
962 861 890
0
200
400
600
800
1,000
1,200
1,400
2014 2015 1Q15 2Q15 (F) 3Q15 (F) 4Q15 (F)
Propylene-MOPJ Butadiene-MOPJ
Source: PRISM, May 15 USD/MT
• Higher demand from tires from increasing light vehicle sales in China and more mileage from low oil price
• Lower supply from on-purpose units due to uneconomical
• Delayed start-up of new projects
• China’s economic growth slow down • Increase supply higher naphtha crackers’ O/R
+
-
Propylene Butadiene
BD margin will improve from more synthetic rubber demand
Demand from Derivatives
Demand from Derivatives
50
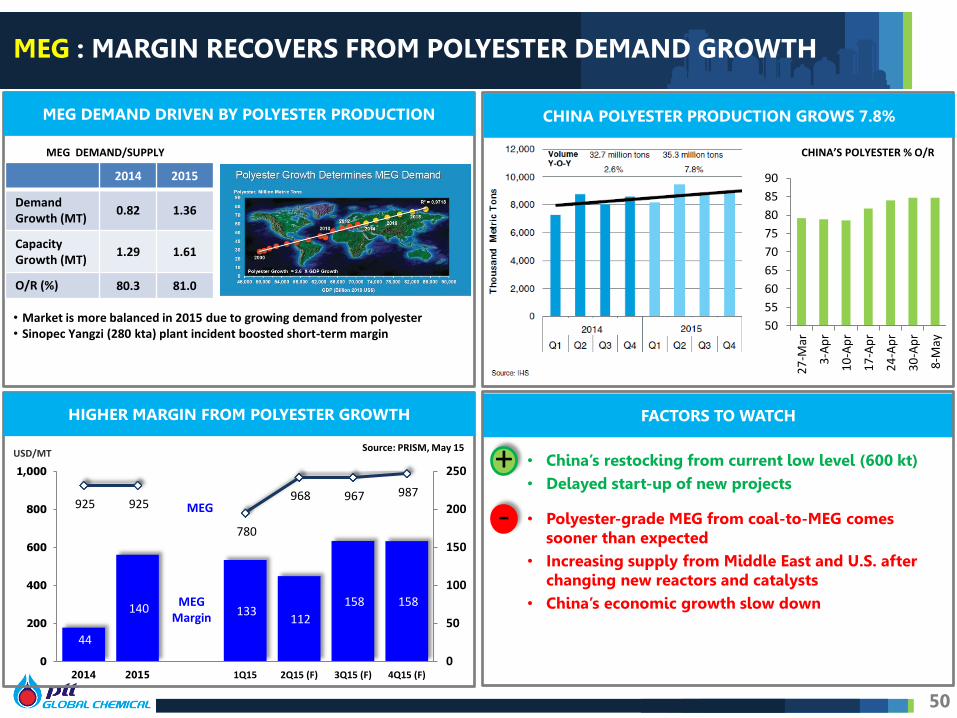
MEG DEMAND DRIVEN BY POLYESTER PRODUCTION
HIGHER MARGIN FROM POLYESTER GROWTH FACTORS TO WATCH
CHINA POLYESTER PRODUCTION GROWS 7.8%
2014 2015
Demand Growth (MT)
0.82 1.36
Capacity Growth (MT)
1.29 1.61
O/R (%) 80.3 81.0
MEG DEMAND/SUPPLY
• Market is more balanced in 2015 due to growing demand from polyester • Sinopec Yangzi (280 kta) plant incident boosted short-term margin
44
140 133 112
158 158
925 925
780
968 967 987
0
50
100
150
200
250
0
200
400
600
800
1,000
2014 2015 1Q15 2Q15 (F) 3Q15 (F) 4Q15 (F)
Source: PRISM, May 15 USD/MT
• China’s restocking from current low level (600 kt) • Delayed start-up of new projects
• Polyester-grade MEG from coal-to-MEG comes sooner than expected
• Increasing supply from Middle East and U.S. after changing new reactors and catalysts
• China’s economic growth slow down
+
-
MEG : MARGIN RECOVERS FROM POLYESTER DEMAND GROWTH
50
55
60
65
70
75
80
85
90
27
-Mar
3-A
pr
10
-Ap
r
17
-Ap
r
24
-Ap
r
30
-Ap
r
8-M
ay
CHINA’S POLYESTER % O/R
MEG
MEG Margin
402 271 327 223 244 290
172 280
393 325 205 197
1,427
989 909
996 989 1,060
1,695
1,328 1,364 1,372 1,259 1,317
0
200
400
600
800
1,000
1,200
1,400
1,600
1,800
2014 2015 1Q15 2Q15 (F) 3Q15 (F) 4Q15 (F)
Phenol Margin BPA Margin
51
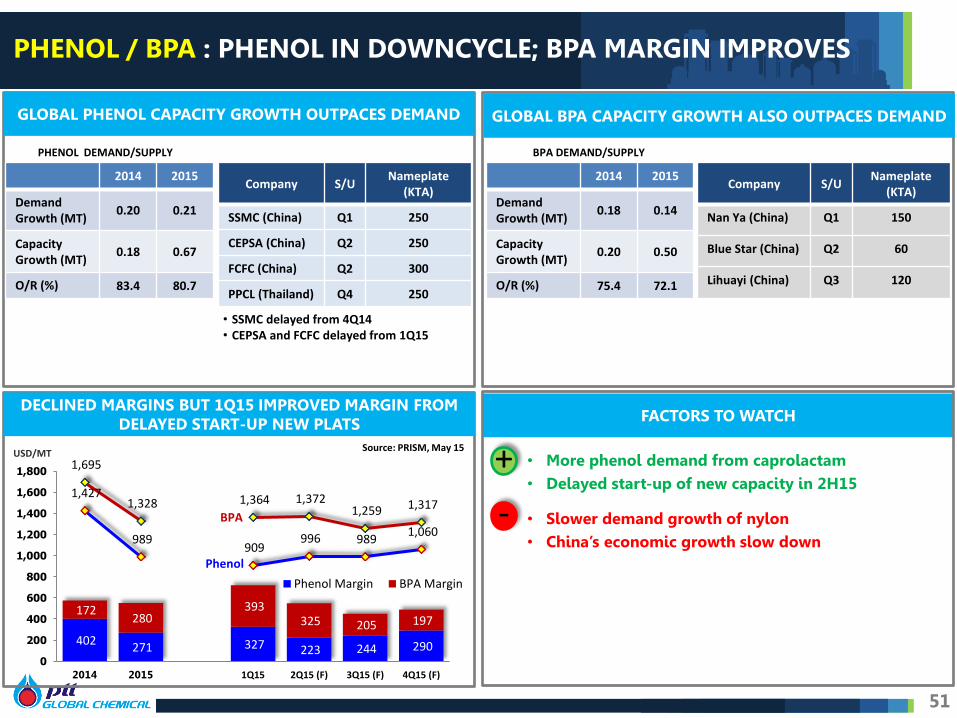
GLOBAL PHENOL CAPACITY GROWTH OUTPACES DEMAND
DECLINED MARGINS BUT 1Q15 IMPROVED MARGIN FROM DELAYED START-UP NEW PLATS FACTORS TO WATCH
GLOBAL BPA CAPACITY GROWTH ALSO OUTPACES DEMAND
PHENOL DEMAND/SUPPLY
• More phenol demand from caprolactam • Delayed start-up of new capacity in 2H15
• Slower demand growth of nylon • China’s economic growth slow down
+
-
PHENOL / BPA : PHENOL IN DOWNCYCLE; BPA MARGIN IMPROVES
BPA DEMAND/SUPPLY
Source: PRISM, May 15 USD/MT
Company S/U Nameplate
(KTA)
SSMC (China) Q1 250
CEPSA (China) Q2 250
FCFC (China) Q2 300
PPCL (Thailand) Q4 250
Company S/U Nameplate
(KTA)
Nan Ya (China) Q1 150
Blue Star (China) Q2 60
Lihuayi (China) Q3 120
2014 2015
Demand Growth (MT)
0.20 0.21
Capacity Growth (MT)
0.18 0.67
O/R (%) 83.4 80.7
2014 2015
Demand Growth (MT)
0.18 0.14
Capacity Growth (MT)
0.20 0.50
O/R (%) 75.4 72.1
BPA
Phenol
• SSMC delayed from 4Q14 • CEPSA and FCFC delayed from 1Q15

52
METHYL ESTER / FATTY ALCOHOL : MARGIN STABLE
ME DEMAND RECOVERED FROM B7 IMPLEMENT FA DEMAND IS AFFECTED BY LOW OIL PRICE
STABLE MARGINS BOTH ME AND FA FACTORS TO WATCH
0
100
200
300
400
500
600
700
Q1/14 Q2/14 Q3/14 Q4/14 Q1/15 Q2/15 Q3/15 Q4/15
CPO Supply
ME Capacity
Cooking Oil Demand
ME Demand
KTPA
1Q15: Demand slowed down due to B3 policy on Jan 22 to ease local palm oil shortage
2Q-4Q15: • B7 resumed since Apr 16 • Healthy ME demand following high biodiesel consumption
69% 68% 62%
20%
40%
60%
0
2
4
6
2014 2015 (F) 2016 (F)
% O/R
Global FA Demand vs Capacity
+SABIC 83KTA +Hotung 80KTA Demand
Capacity +Wilmar150KTA
MTPA
1Q15: Demand slowed down from sluggish Chinese economy and aggressive competition from synthetic FA producers
2Q-4Q15: • Upward trend oil price stimulate natural FA demand
0
200
400
600
800
1,000
1,200
1,400
1,600
1,800
2,000
2014 2015 Q1/15 Q2/15(F) Q3/15 (F) Q4/15 (F)
FA
CPKO CPO
ME
ME Margin
FA Margin
USD/MT ME + Higher diesel consumption from low price + Government support policy + Lower feedstock cost from increasing palm oil supply + Delayed start-up of new capacities - Lower palm oil supply from climate change FA + Lower feedstock cost from increasing palm oil supply - Aggressive synthetic FA competition from low oil price - More trade barriers in many global markets i.e. tax
wall, safeguard, anti-dumping
B3 B7 B6 B3
53
For further information & enquiries, please contact our Investor Relations Team at [email protected]
Thank You
1 Thitipong Jurapornsiridee VP - Corporate Finance & IR [email protected] +662-265-8574 2 Puvadol Vasudhara IR Manager [email protected] +662-140-8712 3 Prang Chudasring IR Analyst [email protected] +662-265-8327 4 Supika Charudhanes IR Analyst [email protected] +662-265-8533 5 Chutima Jarikasem IR Coordinator [email protected] +662-140-8713


