36
August 2010 Investor Presentation

1
August 2010
Investor Presentation

2
Contents
Company Snapshot1.
Business Analysis
Financial Performance
Industry Opportunity
Growth Plans & Strategy
Annexure
2.
3.
4.
5.
6.

3
Company Snapshot

4
Net Sales Break Up
Q1 FY‟11 – `2,335.5mn
One of the largest vertically integrated textile player in South India with presence
across the entire value chain - from “fibre to fashion”
Marquee relationships of over 15 years with about 1,000 regular domestic clients
for yarn and fabric and around 40 international apparel retailers
First spinning mill in India to obtain all three international certifications including
ISO 9001:2000, ISO 14001:2004 and SA 8000:2001
Investment of `1.05bn from consortium of private equity investors including Ares
Investments, Brandot Investments and Argonaut (for 11% combined stake)
Currently employs 9,802 full time employees
6 state-of-the-art production facilities
located in Tamilnadu
Total capacity of 212,064 spindles; 201
circular knitting machines and 1,750 sewing
machines
Manufacturing capacity of 54,000MT of yarn;
21,000MT of fabric and 63mn pieces of
readymade knitted apparel per annum
Processing facility for 23MT of fabric per day
Unique raw material procurement policy
Distinctive workforce model to lower attrition
and personnel costs
Strategic investment in windmill farms to
become self-sufficient with reduced dependence
on the State for energy needs (40 wind mills
installed with a total power capacity of 40MW)
Presence across the Textile Value Chain
Complete Textile Solutions Provider
Knitted Garments,
27.2%
Fabric, 13.3%
Yarn, 55.9%
Others, 3.6%
State-of-the-Art Manufacturing Facilities Cost-effective Operating Model

5
4,3914,974
6,064
7,477
8,340
0
1,800
3,600
5,400
7,200
9,000
FY'06 FY'07 FY'08 FY'09 FY'10
Total Operating Revenue EBITDA
Net Worth
Note: EBITDA declined during FY’09 due to significant increase in raw material prices and other direct expenses
With consistent track record of growth`M
n
`Mn

6
Yarn Sales (`mn)
2,0672,450
3,3353,654
4,088
0
900
1,800
2,700
3,600
4,500
FY'06 FY'07 FY'08 FY'09 FY'10
736810 776
902
1,139
0
240
480
720
960
1200
FY'06 FY'07 FY'08 FY'09 FY'10
Led by increasing sales across key segments
Yarn Sales (MT)
20,27422,473
32,793 32,440 32,882
0
7,000
14,000
21,000
28,000
35,000
FY'06 FY'07 FY'08 FY'09 FY'10
Yarn sales grew at a 4-year CAGR of 18.6% to reach `4,088mn in FY‟10 driven by 1.6x growth in volumes
Fabric Sales (`mn) Fabric Sales (MT)
6,1395,608
7,325
9029
10,690
0
2,000
4,000
6,000
8,000
10,000
12,000
FY'06 FY'07 FY'08 FY'09 FY'10
Fabric sales grew at a 4-year CAGR of 11.5% to reach `1,139mn in FY‟10 driven by 1.7x growth in volumes
7
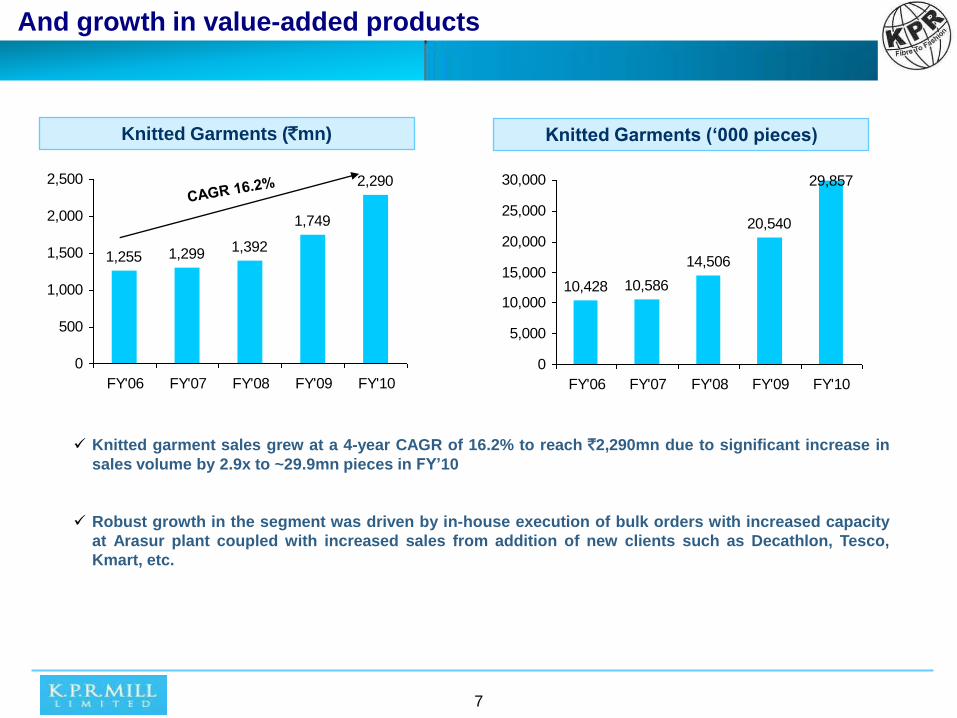
Knitted Garments (`mn)
1,255 1,299 1,392
1,749
2,290
0
500
1,000
1,500
2,000
2,500
FY'06 FY'07 FY'08 FY'09 FY'10
Knitted garment sales grew at a 4-year CAGR of 16.2% to reach `2,290mn due to significant increase in
sales volume by 2.9x to ~29.9mn pieces in FY‟10
Robust growth in the segment was driven by in-house execution of bulk orders with increased capacity
at Arasur plant coupled with increased sales from addition of new clients such as Decathlon, Tesco,
Kmart, etc.
And growth in value-added products
Knitted Garments („000 pieces)
10,428 10,586
14,506
20,540
29,857
0
5,000
10,000
15,000
20,000
25,000
30,000
FY'06 FY'07 FY'08 FY'09 FY'10

8
Backed by an experienced management team
Name Brief Profile
Mr. K. P. Ramasamy
Chairman•Over 38 years of experience in the apparel business, particularly in the production and marketing of woven
fabric, knitted apparel, cotton yarn and hosiery fabric as well as in dyeing of yarn and fabric
•Spearheads the strategic expansion plan initiatives of the company and supervises manufacturing and
human resource related functions
Mr. K.P.D Sigamani
Managing Director•Holds a Master of Science degree in Mathematics
•Over 25 years of experience in the apparel industry, with specialized experience in the production and
marketing of Knitted apparel
•Heads the apparel division and also supervises company’s export business
Mr. P. Nataraj
Managing Director•Chartered Accountant and holds a Bachelor of Science degree
•Over 2 decades of experience in the apparel industry and is also experienced in internal controls, project
implementation and tax planning
•Special invitee at the South India Mills Association and also the President of the Coimbatore chapter of the
Indian Institution of Industrial Engineering 2003 -2004
•Manages the finance function and also oversees cotton procurement and yarn marketing activities of the
spinning division
Mr. Shujaat Khan
Non-Executive Director•MBA from Harvard University
•Nominee of ‘Ares Investments' on the Board and is associated with the company since November 2006 as
non-independent director
•Over 16 years of experience in investment banking and private equity activities
•Was the Managing Director of ChrysCapital for 4 years from 2000 and worked with Merrill Lynch
International in Asia for 4 years from 1997 and with the Travelers Group in New York for 5 years from 1991
•Managing Director of Blue River Capital Advisors (India) Private Limited since 2005

9
And a strong board of directors
Name Brief Profile
Mr. K.N.V. Ramani
Non-Executive Director•Corporate lawyer and independent director of the company. Has been practicing for over 47 years in legislations like the
Companies Act, Taxation and Labour Laws
•Presently the senior partner of the law firm M/s. Ramani & Shankar, Advocates, Coimbatore
•Holds directorships in Bannari Amman Spinning Mills Ltd., Sri Kannapiran Mills Ltd., Sri. Chamundeswari Sugars Ltd., K.G.
Denim Ltd and L.G.B. Forge Ltd
Mr. M.J. Vijyaraaghavan •An independent director and is associated with the company since October 2006
Non-Executive Director •Chartered Accountant by profession and has over 4 decades of experience
•Senior partner of M.S. Jagannathan & Visvanathan, the statutory auditors of leading companies located in Coimbatore,
Bangalore and Kerala
Dr. K. Sabapathy •An independent director and the Chairman of the Investors Grievance Committee
Non-Executive Director •Holds degree of Master of Science, Master of Philosophy and Ph.D. in Physics
•A member of the Coimbatore Stock Exchange for 16 years since 1992 and was its Vice President during 2003 and 2005 and
also held the position of Director in Inter Connected Stock Exchange of India Ltd at Mumbai during 2002 -2005
Mr. A. Sekar •Joined in Sree Ramakrishna Textiles as an employee and is a non-independent director
Whole-time Director •Over 21 years experience in the apparel industry
•Has been assisting the management in setting up of various units and implementation of several projects including expansion
programme, right from the inception of the company
Mr. A.M. Palanisamy
Non-Executive Director•Chartered Accountant for 16 years with specialization of production planning, financials management and taxation
•Holds a bachelors degree in Commerce and is an F.C.A.
•Presently the Chairman of Aerospace Materials Private Limited, Pollachi, Coimbatore
•Holds Directorship in Kovai Medicals Center and Hospital Ltd, Coimbatore and Tanmic India Pvt Ltd
•Management Trustee in Vivek Vidyalaya Matric Higher Secondary School, Kinathukadavu, Orison School Coimbatore, Dharma
Chakkara Trust
•Member of Systems Society of India and Indian Carbon Society, New Delhi
Mr. G.P. Muniappan
Non-Executive Director•An independent director of the company and specialized in the areas of Forex management, banking operations, banking
regulations and supervision
•University rank holder in M.A. Economics
•Elevated to prestigious position of ‘Deputy Governor of R.B.I.' in 2001 and held positions such as Chairman of Bank of Madura,
R.B.I.'s Nominee on SEBI Board, Indian Overseas Bank, Indian Bank and a Trustee of U.T.I.

10
Business Analysis

11
49% 51%58%
51% 51% 56%
17% 17%14%
13% 14%13%
30% 27% 24%24%
29%27%
4% 5% 4% 12% 6%4%
0%
20%
40%
60%
80%
100%
FY06 FY 07 FY 08 FY 09 FY'10 Q1 FY'11
Yarns Fabrics Knitted Garments Export Others
Product Mix
Well-defined vertically integrated operations
Largest revenue contributing
segment with over 50% share of
the revenues. Both carded and
combed yarn are produced
In-house consumption: 25%-
30% of total production.
Remaining is sold in domestic
markets
Contributed 13% of the revenues
during Q1 FY‟11.
In-house consumption: 25%-30%
of total production. Remaining is
sold in domestic markets
Contributed 27% of the revenues
during Q1 FY‟11
100% production exported to the
US and European countries.
Outsources small orders to local
manufacturers and executes bulk
orders in-house to achieve
efficiency
Yarn Fabric Knitted Garments

12
With strong & diversified client base
Over 15 years of relationship with a diversified customer base of over 1,000 regular
domestic clients
Strong relationships with over 40 international apparel retailers
Some Key International Customers
Ernsting‟s
Family
13
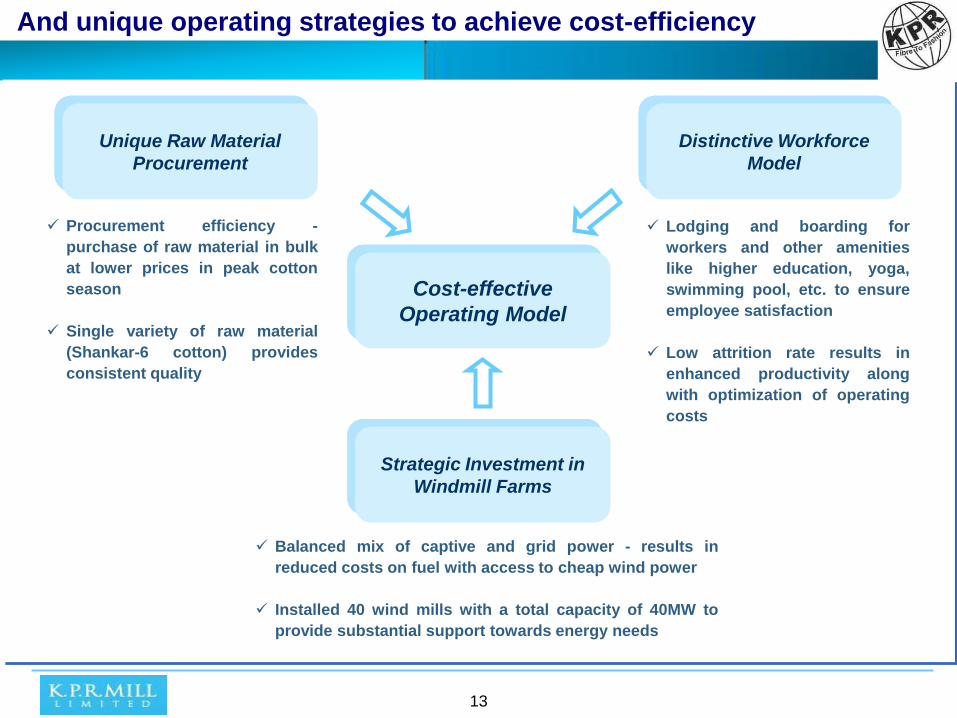
And unique operating strategies to achieve cost-efficiency
Cost-effective
operating model
Procurement efficiency -
purchase of raw material in bulk
at lower prices in peak cotton
season
Single variety of raw material
(Shankar-6 cotton) provides
consistent quality
Lodging and boarding for
workers and other amenities
like higher education, yoga,
swimming pool, etc. to ensure
employee satisfaction
Low attrition rate results in
enhanced productivity along
with optimization of operating
costs
Balanced mix of captive and grid power - results in
reduced costs on fuel with access to cheap wind power
Installed 40 wind mills with a total capacity of 40MW to
provide substantial support towards energy needs
Unique Raw Material
Procurement
Distinctive Workforce
Model
Strategic Investment in
Windmill Farms
Cost-effective
Operating Model

14
Strategically located manufacturing facilities
Location of Facilities Nature of Work Capacity
Sathyamangalam Spinning 30,240 spindles
Karumathampatti Spinning 30,240 spindles
Neelambur Spinning & Knitting 50,784 spindles
Arasur Spinning, Knitting &
Garmenting
1,00,800 spindles
Garmenting :85,000 pieces per day
(single shift)
Storage : 450 tons
Tirupur Garmenting 12mn pieces capacity outsource
SIPCOT, Perundurai Fabric Processing 23 tons/day
Tirunelveli, Tenkasi & Coimbatore Wind Mills (40 nos.) 40MW
Facilities located within a 50km radius from Tirupur, regarded as one of the Asia’s largest apparel
manufacturing clusters
Proximity to buyers helps to reduce the material handling costs and facilitates immediate feedback
regarding the quality of the product
Utilize the key technical personnel across all plant sites and allows taking advantage of Coimbatore
climate, conducive for spinning operations

15
Enforcing stringent quality control measures
Accreditations:
ISO 9001: 2000 – certification for quality management system
ISO 14001: 2004 – certification for environmental management systems
SA 8000: 2001 – certification for social accountability management system
Certified by International Association for Research and Testing in the field of Textile Ecology with respect to
apparel manufacturing operations
Certified as a Trading House by the Indian Ministry of Commerce and Trade
Global Organic Textile Standard (GOTS) - for organic cotton products
OEKO-TEX for responsible and ethical endeavors
Ethical Trade Initiative (ETI) for sound working condition of workers
WRAP – Worldwide Responsible Apparel Production
TUV- SIMA- A Five Star category indicating ‘Excellence in Code of Discipline’ for providing women employment
Installation of high-tech quality control equipment such as Uster Tester-4, Uster HVI Spectrum, Uster AFIS Pro,
Zweigle Hariness Tester-G566 and Uster Classimat Quantum
Latest technology equipment Jossi Vision Shield for contamination free yarn
Installed Schlafhorst Autoconer that ensures sophistication and homogenous quality in yarn and better productivity
Mandatory usage of hand gloves, hair net, mask, aprons, etc. for the twin benefits of safety and quality
Inspection at every stage to ensure stringent quality conformance
Quality Control Initiatives:

16
Financial Performance
17
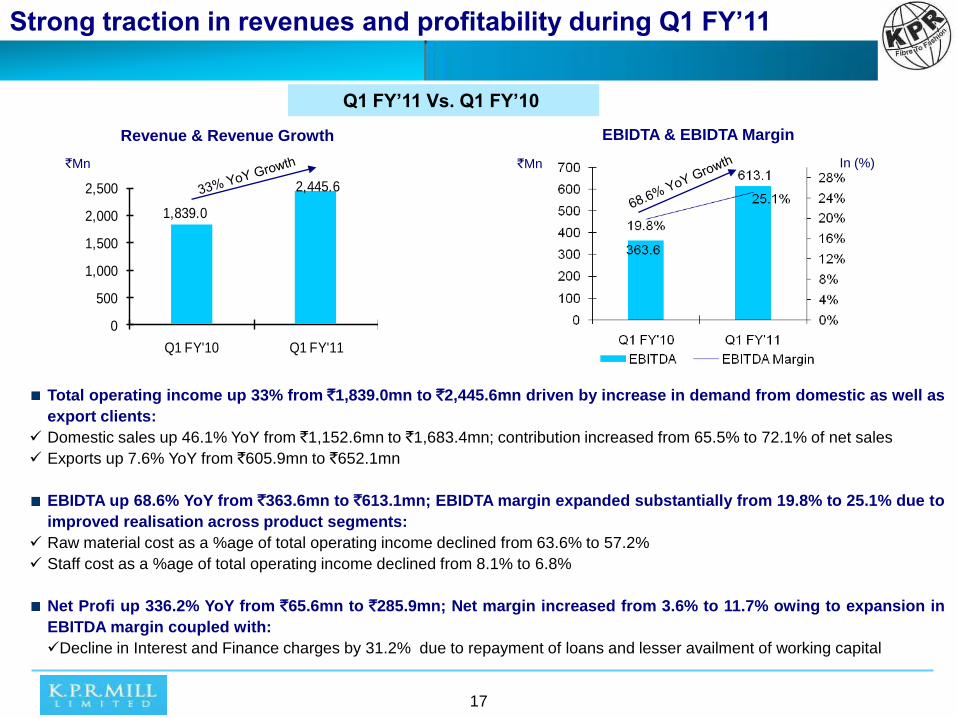
Q1 FY‟11 Vs. Q1 FY‟10
Total operating income up 33% from `1,839.0mn to `2,445.6mn driven by increase in demand from domestic as well as
export clients:
Domestic sales up 46.1% YoY from `1,152.6mn to `1,683.4mn; contribution increased from 65.5% to 72.1% of net sales
Exports up 7.6% YoY from `605.9mn to `652.1mn
EBIDTA up 68.6% YoY from `363.6mn to `613.1mn; EBIDTA margin expanded substantially from 19.8% to 25.1% due to
improved realisation across product segments:
Raw material cost as a %age of total operating income declined from 63.6% to 57.2%
Staff cost as a %age of total operating income declined from 8.1% to 6.8%
Net Profi up 336.2% YoY from `65.6mn to `285.9mn; Net margin increased from 3.6% to 11.7% owing to expansion in
EBITDA margin coupled with:
Decline in Interest and Finance charges by 31.2% due to repayment of loans and lesser availment of working capital
`Mn
1,839.0
2,445.6
0
500
1,000
1,500
2,000
2,500
Q1 FY'10 Q1 FY'11
Strong traction in revenues and profitability during Q1 FY‟11
Revenue & Revenue Growth EBIDTA & EBIDTA Margin
`Mn In (%)

18
With robust growth witnessed across all key segments
Knitted Garment Exports
Net Sales from Knitted Garment exports up 5.4% from
`603.5mn to `635.9mn: Sales volume increased by 16.3%
from 8,131(‘000 pieces) to 9,457(‘000 pieces)
Fabric
230.7
310.8
Q1 FY'10 Q1 FY'11
Net Sales from Fabrics up 34.7% from `230.7mn to
`310.8mn: Sales volume decreased by 7.2% from
2,520MT to 2,339MT
Yarn
805.6
1,304.3
Q1 FY'10 Q1 FY'11
Net Sales from Yarn up 61.9% YoY from `805.6mn to
`1,304.3mn: Sales volume increased by 25.3% from
6,890MT to 8,630MT
Others
118.6
84.4
Q1 FY'10 Q1 FY'11
Contribution from others (including dyed fabrics, waste and
others) down by 28.8% from `118.6mn to `84.4mn
603.5
635.9
Q1 FY'10 Q1 FY'11

19
Industry Opportunity

20
Huge growth potential in the industry
67
115
0
30
60
90
120
150
2009 2012E
Source: Technopak, Ministry of Textiles estimates
Size of Indian Textile Industry ($ bn)
Indian textiles industry is currently pegged at $67bn in size and is likely to grow by 1.7x to reach $115bn
by 2012
Growth to be largely driven by export contribution expected to constitute 44% of the total market size in
2012E from current ~33%; exports to grow at a 3 year CAGR of ~31% to reach $50bn in size by 2012
Domestic consumption also likely to remain robust, witnessing 3-year CAGR of 13% to reach $65bn in
size by 2012
Contribution of the export market to the total industry size is estimated to increase from 33% at present
to 44% by 2012
67%56%
33%44%
0%
20%
40%
60%
80%
100%
2009 2012E
Domestic Export
Exports Vs Domestic

21
Backed by key growth drivers
Abundant
Raw Material
Availability
Growing Domestic
Demand
Low Cost Skilled
Labour
2nd largest producer
of cotton in the world
Accounts for 12% of
the world's production
of textile fibre and yarn
Domestic textile
market is growing at
a very good pace
driven by favorable
demographics
Abundant availability
of manpower with skill
sets across the value
chain
Cost advantage over
comparative countries
with low labour cost
Backed by Government Initiatives

22
And strong support extended by the Government
Technology Upgradation Fund Scheme (TUFS): Allocation of `31.4bn for the current fiscal for TUFS scheme. Though,
TUFS has been temporarily withdrawn – it would provide KPR with competitive edge as it has already received loan
under TUFS for its ongoing expansion whereas other players might have to put their capex plans on hold
Government intervention has persuaded the spinners to reduce yarn prices by `6 - `9 per kg which would benefit
weavers and apparel producers
Exemption of readymade garments from 4% Special Additional Duty (SAD)
Continued interest subvention of 2% for one more year for exports covering textiles
One-time grant of `2bn to Tamil Nadu towards the cost of installation of a zero liquid discharge system at Tirupur
Current limit of `1,00, 000 per annum for duty free import of samples has been enhanced to `3,00,000 per annum
SMEs in textile sector have been given full CENVAT credit on capital goods in one installment in the year of receipt of
such goods and the facility of payment of excise duty in quarterly basis
Government policies have been largely supportive of growth of the textile industry, given its
potential for export and employment generation:

23
With increasing global competitiveness
Indian Textile Industry will have a competitive advantage vis-à-vis China in global market due to:
Increasing labor costs in China on account of Minimum Wages Act
Appreciation of Chinese currency
Higher power cost

24
Growth Plans & Strategy

25
Increased focus on high margin garment export segment
Current Revenue Mix (Q1 FY‟11)
Export contribution expected to increase to 40% of the revenues by FY‟12 from 29% at
present (Q1 FY‟11)
Plans to double contribution from US and other markets to 20% in next 4-5 years from
~10% in Q1 FY‟11
Projected Revenue Mix (FY‟12)

26
Along with expansion in 100% compact spinning capacity
Planned expenditure of `4.38bn for capacity expansion in 100% compact spinning facility
100% Compact Spinning Facility:
Incremental capacity addition: 1,03,680 spindles
Capital Expenditure: `3.1bn Expansion to be partly financed through balance IPO proceeds and partly through debt
for which financial closure has been achieved
Expansion is expected to be completed by end of April 2011 in phased manner and plant to be fully operational from
May 2011
Capacity addition to take place adjacent to the existing plant of Karumathampatti in order to achieve cost and
location benefits

27
And modernization of existing facility for productivity enhancement
Modernization of Sathyamangalam spinning unit to increase productivity and enhance quality of output :
Modernize the existing 30,240 spindleage at the spinning unit at Sathyamangalam by replacing the existing ring
frames by new ring frames
Expand existing spindleage capacity by adding 17,952 spindles of recently launched LR9/AX 1,632 spindles with
cutting edge technologies. This would result in considerable reduction in per spindle cost
Total Project Outlay: `300mn. Financial closure has been achieved

28
Attaining self-sufficiency for power requirement
60%
75%
90% 90% 90%
0%
20%
40%
60%
80%
100%
Q1 FY'10 Q2 FY'10 Q3 FY'10 Q4 FY'10 Q1 FY'11
Quarterly Capacity Utilization
One of the largest in-house power generation capacity (installed 40MW windmills), sufficient to meet about
75% of the power requirement through captive consumption
Further plans to add wind power generation plant to support expansion in 100% compact spinning:
Incremental capacity addition: 24MW windmills
Capital Expenditure: `1.28bn
Turnkey project expected to be completed by end of November 2010 in a phased manner
40
64
0
15
30
45
60
75
FY'10 FY'11
Expansion in Capacity

29
Thank You Annexure

30
Shareholding pattern as of 30th June 2010
No. of shares outstanding: 37.68mn
Promoters,
74.48%
Body Corporate, 4.69%
FIIs, 0.35%
Foreign Venture Capital
Investors, 9.29%
Others, 9.70%
MFs/Banks, 1.49%

31
Income Statement & Key Ratios - Quarterly
Particulars (`mn) Q1 FY'11 Q1 FY'10 % Chg YoY Q4 FY'10 % Chg QoQ
Net sales 2,335.5 1,758.5 32.8% 2,439.5 -4.3%
Other Operating Income 110.1 80.6 36.7% 235.4 -53.2%
Total Operating Income 2,445.6 1,839.0 33.0% 2,674.9 -8.6%
Total Expenditure 1,832.4 1,475.5 24.2% 2,186.6 -16.2%
(Increase) / Decrease In Stock In Trade & WIP (67.1) (65.5) NA (17.4) NA
Consumption of Raw Materials 1,466.2 1,234.7 18.7% 1,584.3 -7.5%
Employees Cost 165.4 149.4 10.7% 154.9 6.7%
Other Expenditure 268.0 156.8 70.9% 464.8 -42.3%
EBIDTA 613.1 363.6 68.6% 488.3 25.6%
Depreciation 177.4 174.4 1.7% 175.1 1.3%
EBIT 435.8 189.2 130.4% 313.2 39.1%
Interest & Finance charges 58.6 85.3 -31.2% 54.4 7.9%
Other Income 4.3 4.4 -0.6% 5.4 -20.3%
PBT 381.5 108.2 252.4% 264.3 44.4%
Tax Expense 95.6 42.7 124.0% 102.2 -6.4%
PAT 285.9 65.6 336.0% 162.1 76.3%
Basic & Diluted EPS (Rs.) 7.6 1.7 336.2% 4.3 76.5%
Key Ratios Q1 FY'11 Q1 FY'10 Q4 FY'10
EBIDTA Margin 25.1% 19.8% 18.3%
Net Margin 11.7% 3.6% 6.1%
Total Expenditure/ Total Operating Income 74.9% 80.2% 81.7%
Raw Material Cost/ Total Operating Income 57.2% 63.6% 58.6%
Staff Cost/ Total Operating Income 6.8% 8.1% 5.8%
Other Expenditure/ Total Operating Income 11.0% 8.5% 17.4%
32
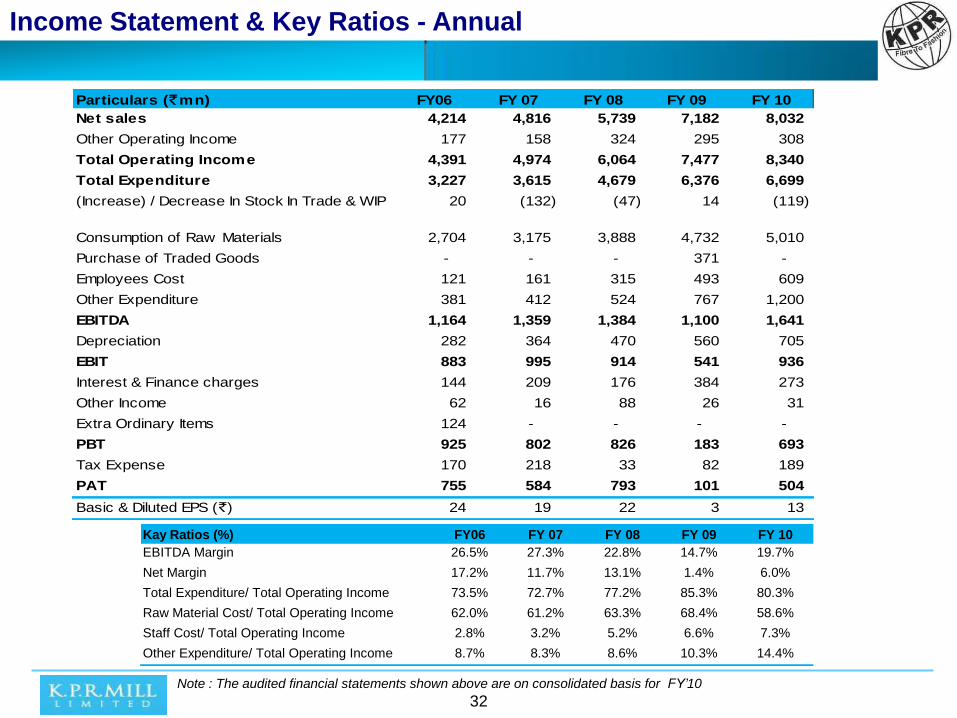
Income Statement & Key Ratios - Annual
Kay Ratios (%) FY06 FY 07 FY 08 FY 09 FY 10
EBITDA Margin 26.5% 27.3% 22.8% 14.7% 19.7%
Net Margin 17.2% 11.7% 13.1% 1.4% 6.0%
Total Expenditure/ Total Operating Income 73.5% 72.7% 77.2% 85.3% 80.3%
Raw Material Cost/ Total Operating Income 62.0% 61.2% 63.3% 68.4% 58.6%
Staff Cost/ Total Operating Income 2.8% 3.2% 5.2% 6.6% 7.3%
Other Expenditure/ Total Operating Income 8.7% 8.3% 8.6% 10.3% 14.4%
Note : The audited financial statements shown above are on consolidated basis for FY’10
Particulars (`mn) FY06 FY 07 FY 08 FY 09 FY 10
Net sales 4,214 4,816 5,739 7,182 8,032
Other Operating Income 177 158 324 295 308
Total Operating Income 4,391 4,974 6,064 7,477 8,340
Total Expenditure 3,227 3,615 4,679 6,376 6,699
(Increase) / Decrease In Stock In Trade & WIP 20 (132) (47) 14 (119)
Consumption of Raw Materials 2,704 3,175 3,888 4,732 5,010
Purchase of Traded Goods - - - 371 -
Employees Cost 121 161 315 493 609
Other Expenditure 381 412 524 767 1,200
EBITDA 1,164 1,359 1,384 1,100 1,641
Depreciation 282 364 470 560 705
EBIT 883 995 914 541 936
Interest & Finance charges 144 209 176 384 273
Other Income 62 16 88 26 31
Extra Ordinary Items 124 - - - -
PBT 925 802 826 183 693
Tax Expense 170 218 33 82 189
PAT 755 584 793 101 504
Basic & Diluted EPS (`) 24 19 22 3 13

33
Balance Sheet
Particulars ( `mn) FY06 FY 07 FY 08 FY 09 FY 10
Sources of Funds:
Shareholders' Funds
Share Capital 150.1 317.7 376.8 376.8 376.8
Reserves and Surplus 2,095.7 3,009.0 4,710.6 4,722.4 4,985.0
2,245.8 3,326.7 5,087.4 5,099.2 5,361.8
Loan Funds
Secures Loans 2,895.2 3,938.1 6,032.3 5,098.9 4,392.0
Unsecured Loans 216.5 225.4 212.1 190.0 158.2
3,111.7 4,163.5 6,244.4 5,288.9 4,550.2
Deferred Tax Liablity 190.2 316.8 336.9 395.7 534.0
Total 5,547.7 7,807.0 11,668.7 10,783.8 10,446.0
Application of Funds :
Fixed Assets 5,065.4 6,683.4 8,468.8 8,208.8 7,945.0
Investments 2.5 2.5 50.0 - -Current Assets, Loans & Advances
Inventories 832.9 1,219.1 1,679.4 2,070.4 1,360.5
Sundry Debtors 414.5 598.6 941.8 1,164.5 1,160.7
Cash and Bank Balances 152.2 272.5 594.1 462.3 522.0
Other Current Assets 96.2 133.4 181.8 229.4 149.2
Loan and Advances 248.0 383.5 562.0 530.7 667.7
1,743.8 2,607.0 3,959.1 4,457.3 3,860.1
Less: Current Liabilities & Provision
Current Liablities 1,179.5 1,365.0 581.0 1,791.5 1,117.4
Provision 84.8 120.9 228.2 90.8 241.7
1,264.3 1,485.9 809.2 1,882.3 1,359.1
Net Current Assets 479.4 1,121.1 3,149.9 2,574.9 2,501.0
Miscellaneous Expenditure 0.4 - - - -
Total 5,547.7 7,807.0 11,668.7 10,783.8 10,446.0

34
K.P.R. Mill Limited
KPR Mill Limited is a vertically integrated apparel company with major interest in manufacturing and marketing readymade knitted apparel, knitted fabric
and cotton yarn; with production facilities located at Coimbatore, Sathyamangalam, Perundurai and Tirupur in Tamilnadu, in India. The Company has a
total capacity of 212,064 spindles; 201 circular knitting machines; garmenting facility to produce 63.0 Million pieces per annum of readymade knitted
apparel; 54,000 MT of yarn making ability and production of 21,000 MT of fabrics per annum; processing facility to handle 23MT of fabric per day; 40
windmills with total power generation capacity of 40MW. With international accreditations for quality control, environmental standards and social
accountability, the Company has a diversified customer base of international apparel retailers including Tesco, Decathlon, Marks & Spencer, Coles, Wal
Mart, Primark, Ernstings’ Family, GAP, H & M, C & A and Carrefour. For further information please visit www.kprmilllimited.com
Four-S Services Pvt. Ltd.
Four-S Services provides customized business and financial research to organizations across the globe. The company also provides Investor Relations
consulting to corporates based on in-depth sectoral and company research. The company has an impressive client profile and a team of experienced
analysts covering the key sectors including Finance & Banking, IT & Telecom, Retail, Media & Entertainment, Pharmaceuticals, Infrastructure and
Manufacturing amongst others. For further information on the company please visit www.four-s.com
Forward Looking Statements
Certain statements in this document with words or phrases such as “will”, “should”, etc., and similar expressions or variation of these expressions or those
concerning our future prospects are forward looking statements. Actual results may differ materially from those suggested by the forward looking
statements due to a number of risks or uncertainties associated with the expectations. These risks and uncertainties include, but are not limited to, our
ability to successfully implement our strategy and changes in government policies. The company may, from time to time, make additional written and oral
forward looking statements, including statements contained in the company’s filings with the stock exchanges and our reports to shareholders. The
company does not undertake to update any forward-looking statements that may be made from time to time by or on behalf of the company.
About Us
35
Contacts
For any Investor Relations queries please contact:
J.S.Kumar
Vice President (Finance)
K.P.R.Mill Limited
Email: [email protected]
Tel. No. +91-421-2487051
Seema Shukla
Four-S Services Pvt. Ltd.
Email: [email protected]
Tel. No. +91-124-4251443
Four-S Services Locations
Gurgaon: 214, Udyog Vihar Phase I, Gurgaon – 122016. Tel: +91-124-4251443
Mumbai: 503, Twin Complex Phase 1, Opp. Marol Fire Station, Marol Naka, Andheri East, Mumbai 400 059, Tel: 022 - 42153659

36
Concept, Research and Design by
www.four-s.com
Thank You
Four-S Services Locations
Gurgaon: 214, Udyog Vihar Phase I, Gurgaon – 122016. Tel: +91-124-4251443
Mumbai: 503, Twin Complex Phase 1, Opp. Marol Fire Station, Marol Naka, Andheri East, Mumbai 400 059, Tel: 022 - 42153659


