28
Investor Presentation Fourth Quarter 2020 Dennis G. Shaffer ‐ President & Chief Executive Officer Richard J. Dutton ‐ Senior Vice President, Chief Operating Officer NASDAQ: CIVB 1
Investor PresentationFourth Quarter 2020
Dennis G. Shaffer ‐ President & Chief Executive OfficerRichard J. Dutton ‐ Senior Vice President, Chief Operating Officer
NASDAQ: CIVB
1

2
Forward‐Looking Statements. This presentation may contain forward‐looking statements within the meaning ofsuch term in federal securities law. Forward‐looking statements express management’s current expectations,forecasts of future events or long‐term goals, and may be based upon beliefs, expectations and assumptions of theCompany’s management are generally identifiable by the use of words such as “believe,” “expect,” “anticipate,”“plan,” “intend,” “estimate,” “may,” “will,” “would,” “could,” “should” or other similar expressions. All statements inthis material speak only as of the date they are made, and we undertake no obligation to update any statement. Anumber of factor, many of which are beyond the ability of the Company to control or predict, could cause the actualresults to differ materially from those in its forward‐looking statements. Additional information regarding such riskscan be found in public documents on file with the SEC, including those risks identified in “Item 1A. Risk Factors” ofPart I of the Company’s Annual Report on Form 10‐K for the fiscal year ended December 31, 2019, and anyadditional risks identified in the Company’s subsequent Form 10‐Qs. These risks and uncertainties should beconsidered in evaluating forward‐looking statements and undue reliance should not be placed on such statements.
Use of Non‐GAAP Financial Measures. This presentation contains certain financial information determined bymethods other than in accordance with accounting principals generally accepted in the United States (“GAAP”).These non‐GAAP financial measures include “Tangible Book Value per Share” , “Tangible Common Equity to TangibleAssets” and “Efficiency Ratio”. The Company believes that these non‐GAAP financial measures provide bothmanagement and investors a more complete understanding of the Company’s profitability. These non‐GAAPfinancial measures are supplemental and are not a substitute for any analysis based on GAAP Measures. Not allcompanies use the same calculation of these measures; therefore this presentation may not be comparable to othersimilarly titled measures as presented by other companies. Reconciliations of these non‐GAAP measures areprovided in the Appendix section of this presentation.
3
Contact Information
Civista Bancshares, Inc.’s common shares are traded on the NASDAQ Capital Market under the symbol “CIVB.”
Additional information can be found at: www.civb.com
Dennis G Shaffer President & Chief Executive Officer
[email protected] Telephone: 888.645.4121
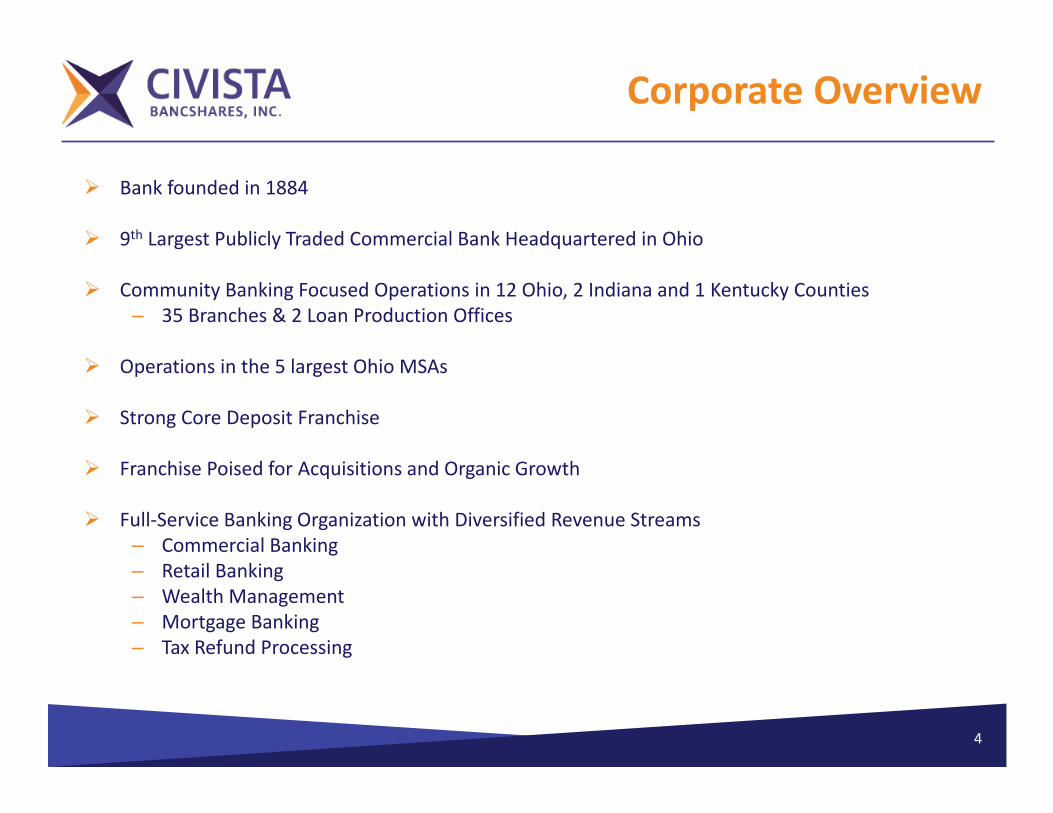
Corporate Overview
Bank founded in 1884
9th Largest Publicly Traded Commercial Bank Headquartered in Ohio
Community Banking Focused Operations in 12 Ohio, 2 Indiana and 1 Kentucky Counties– 35 Branches & 2 Loan Production Offices
Operations in the 5 largest Ohio MSAs
Strong Core Deposit Franchise
Franchise Poised for Acquisitions and Organic Growth
Full‐Service Banking Organization with Diversified Revenue Streams– Commercial Banking– Retail Banking– Wealth Management– Mortgage Banking– Tax Refund Processing
4

5
Investment Highlights
Community bank franchise in growth markets with an established operating model
– Gather attractive low‐cost deposits (33 bps total cost of deposits)
– Generate loans in select growing markets (operations in the 5 largest MSAs in Ohio)
Strong capital position
Disciplined underwriting verified with strong credit quality metrics
– Nonaccrual and 90 days Past Due (excluding PCI1) to Gross Loans of 0.34% as of 12/31/2020
Experienced management team with a deep bench
Noninterest income enhanced by multiple revenue streams
Continued strong returns in 2020
Use of LPOs to extend our reach (Westlake, OH and Fort Mitchell, KY)
Member Russell 2000 index
Source: Company Management and SNL Financial.1PCI – purchased credit impaired loans.

6
Branch Footprint
Headquartered in Sandusky, Ohio 35 branches & 2 LPOs (Ohio,
Indiana and Kentucky) 474 Employees

7
Markets
Source: S&P Global Market Intelligence, FDIC. Deposit market share information as of June 30, 2020.
Sandusky/Norwalk/Port Clinton, Ohio
9 Locations
$425 million in loans
$872 million in deposits
#1 deposit market share in Sandusky, Ohio with ~51% market share
Cleveland/Akron, Ohio
3 Locations
$625 million in loans
$121 million in deposits
North Central, Ohio
7 Locations
$70 million in loans
$209 million in deposits
~34% deposit market share in our markets
Columbus & West Central, Ohio
6 Locations
$407 million in loans
$297 million in deposits
23% deposit market share in the rural markets
Greater Dayton, Ohio
3 Locations
$145 million in loans
$106 million in deposits
Southeastern Indiana/Cincinnati, Ohio
9 Locations
$386 million in loans
$584 million in deposits
~43% deposit market share in our markets

8
Experienced Management Team
Dennis G. Shaffer
SVP & Chief Operating Officer
35 years of banking experience
Joined in 2007
Richard J. Dutton
SVP & Chief Lending Officer
32 years of banking experience
Joined in 2016
Charles A. Parcher
SVP & General Counsel
17 years of banking experience
Joined in 2018
Lance A. Morrison
SVP & Controller
32 years of banking experience
Joined in 1988
Todd A. Michel
SVP & Chief Risk Officer
25 years of banking experience
Joined in 2013
John A. Betts
SVP & Chief Credit Officer
35 years of banking experience
Joined in 2010
Paul J. Stark
Donna M. Jaskolski
SVP & Customer Experience Officer
18 years of banking experience
Joined in 2017
CEO & President
President, Civista Bank
35 years of banking experience
Joined in 2009

9
Financial Highlights
Source: Company Management and SNL Financial.1. December 31, 2020 includes $217.3 million of PPP loans . 2. Non‐GAAP reconciliation on page 25.
Financial Highlights($s in thousands, except per share data)
December 31, December 31, 2020 2019 % Change
Balance Sheet
Assets $2,762,918 $2,309,557 19.63%
Gross Loans (excluding HFS) 1 2,057,502 1,708,970 20.39%
Deposits 2,189,398 1,678,764 30.42%
December 31, December 31, 2020 2019 % Change
Performance Analysis
Net Income Available to Common $32,192 $33,231 (3.13%)
ROAA 1.17% 1.51% (22.52%)
ROAE 9.57% 10.64% (10.06%)
Market Data
Market Capitalization ($mm) $278,693 $400,493
Price / Tangible Book Value 2 104.2% 162.5%
Price/LTM diluted EPS 8.8x 11.9x

10
Increasing Shareholder Value
Source: Company management and SNL Financial. 1 Non‐GAAP reconciliation on page 25 2 Page 27 shows 2018 ratios adjusted for merger related expenses
Tangible Book Value per Share1
Diluted EPS2
$1.17
$1.57
$1.28 $1.02
$2.01 $2.00
2015 2016 2017 2018 2019 2020
$1.85
$9.43 $10.84
$13.68 $13.14
$14.77
$16.82
2015 2016 2017 2018 2019 2020
11
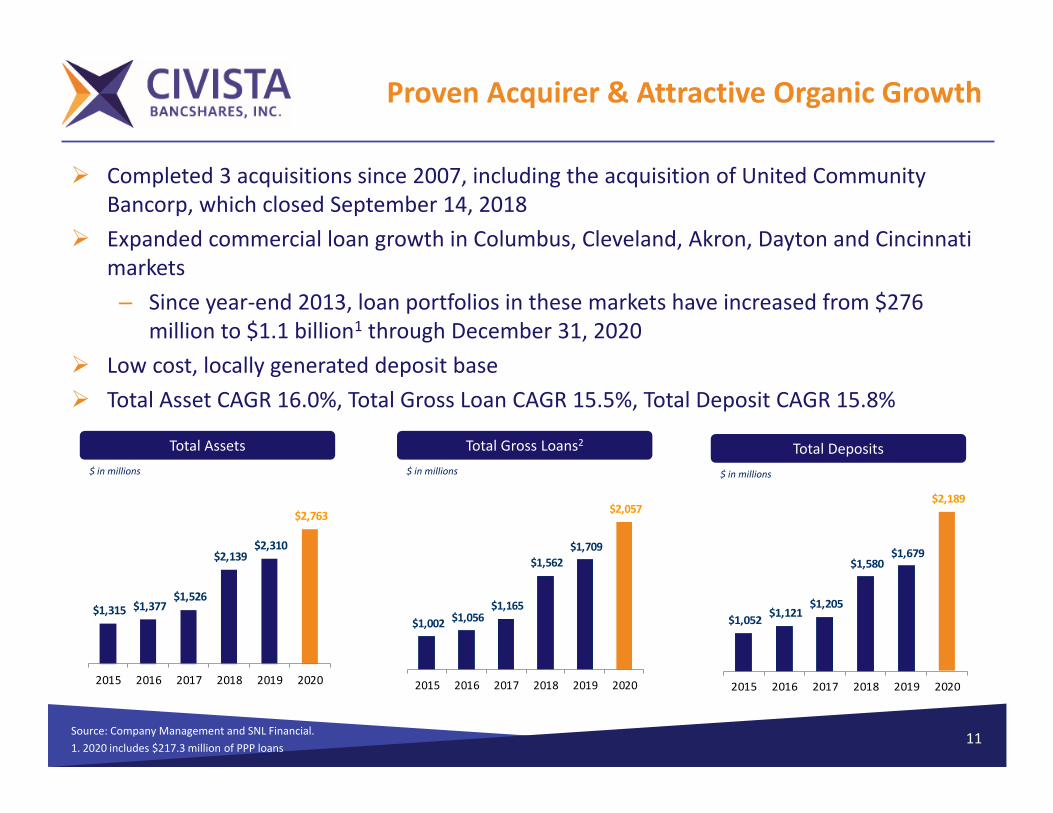
Proven Acquirer & Attractive Organic Growth
Source: Company Management and SNL Financial.1. 2020 includes $217.3 million of PPP loans
Completed 3 acquisitions since 2007, including the acquisition of United Community Bancorp, which closed September 14, 2018
Expanded commercial loan growth in Columbus, Cleveland, Akron, Dayton and Cincinnati markets– Since year‐end 2013, loan portfolios in these markets have increased from $276
million to $1.1 billion1 through December 31, 2020 Low cost, locally generated deposit base Total Asset CAGR 16.0%, Total Gross Loan CAGR 15.5%, Total Deposit CAGR 15.8%
Total Assets$ in millions
Total Gross Loans2
$ in millions
Total Deposits$ in millions
$1,315 $1,377 $1,526
$2,139 $2,310
$2,763
2015 2016 2017 2018 2019 2020
$1,002 $1,056 $1,165
$1,562 $1,709
$2,057
2015 2016 2017 2018 2019 2020
$1,052 $1,121 $1,205
$1,580 $1,679
$2,189
2015 2016 2017 2018 2019 2020
121 excluding $217.3 million of PPP loans
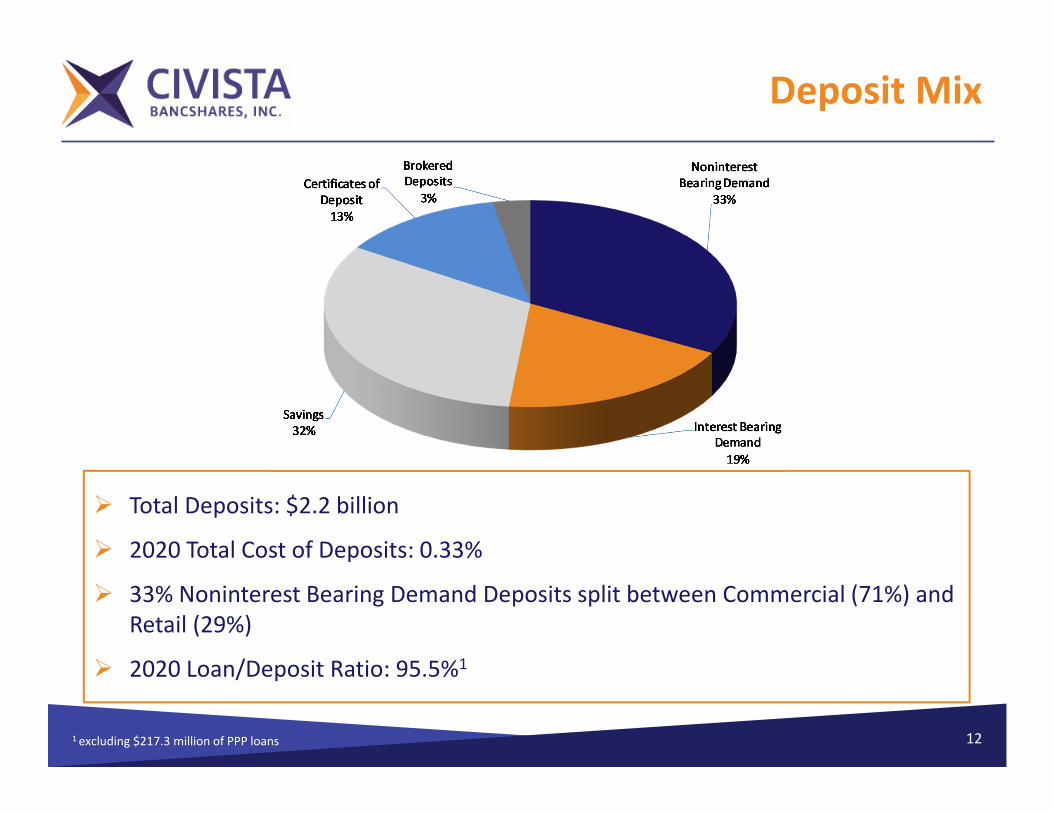
Deposit Mix
Total Deposits: $2.2 billion
2020 Total Cost of Deposits: 0.33%
33% Noninterest Bearing Demand Deposits split between Commercial (71%) and Retail (29%)
2020 Loan/Deposit Ratio: 95.5%1

131. Hotel, Restaurant, Entertainment, Retail, Industrial and Office Percentages net of PPP loans of $217.3 million
Loan Mix
Total Gross Loans: $2.1 billion
2020 Average Loan Yield: 4.49%
Diversified CRE Portfolio1
– No Big Box Retail or Energy Exposure
– Hotel (7%), Restaurant (2%), Entertainment (3%), Retail (19%), Industrial (9%), Office (5%)
CRE to RBC ratio: 318.7%
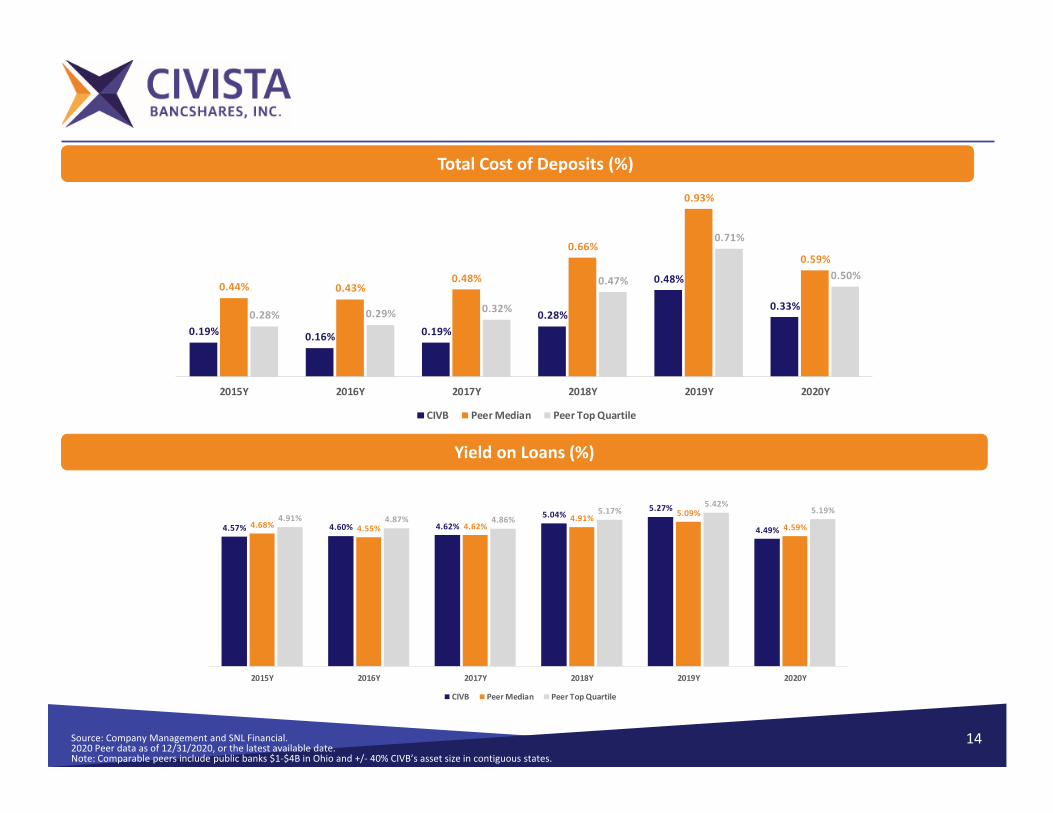
14Source: Company Management and SNL Financial.2020 Peer data as of 12/31/2020, or the latest available date.Note: Comparable peers include public banks $1‐$4B in Ohio and +/‐ 40% CIVB’s asset size in contiguous states.
Total Cost of Deposits (%)
Yield on Loans (%)
0.19% 0.16% 0.19%0.28%
0.48%
0.33%
0.44% 0.43%0.48%
0.66%
0.93%
0.59%
0.28% 0.29% 0.32%
0.47%
0.71%
0.50%
2015Y 2016Y 2017Y 2018Y 2019Y 2020Y
CIVB Peer Median Peer Top Quartile
4.57% 4.60% 4.62%5.04%
5.27%
4.49%4.68% 4.55% 4.62%4.91% 5.09%
4.59%4.91% 4.87% 4.86%
5.17%5.42%
5.19%
2015Y 2016Y 2017Y 2018Y 2019Y 2020Y
CIVB Peer Median Peer Top Quartile
15
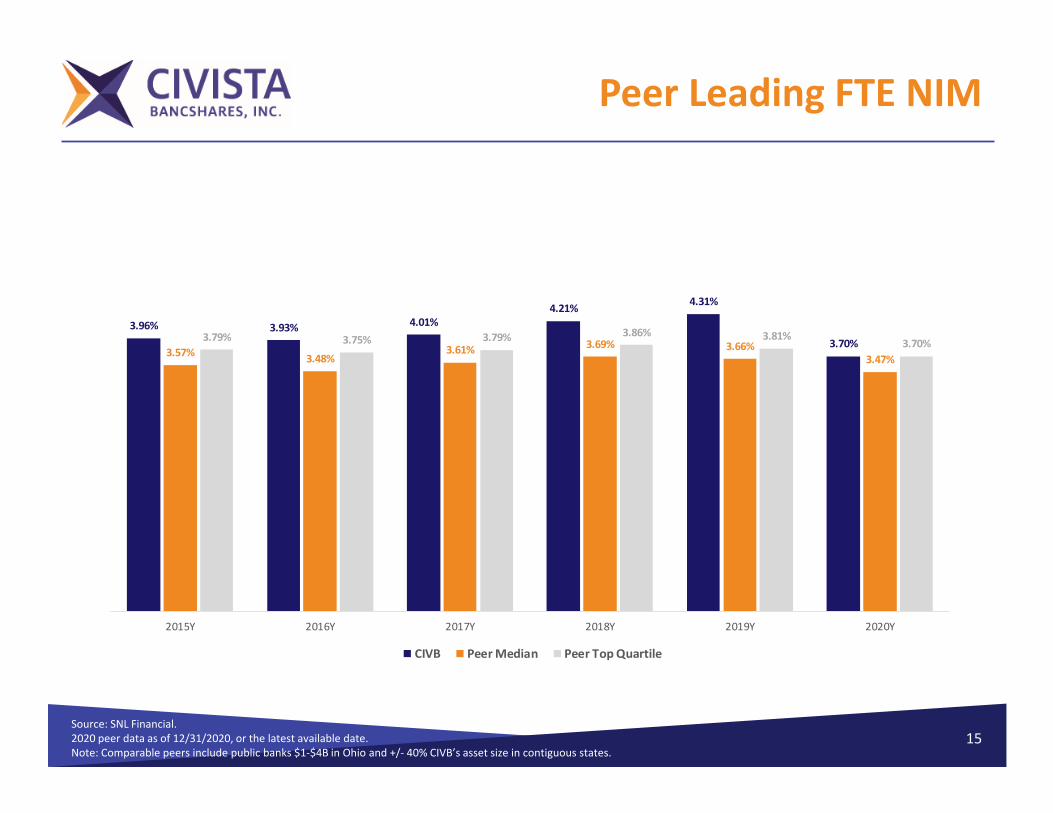
Peer Leading FTE NIM
Source: SNL Financial. 2020 peer data as of 12/31/2020, or the latest available date.Note: Comparable peers include public banks $1‐$4B in Ohio and +/‐ 40% CIVB’s asset size in contiguous states.
3.96% 3.93% 4.01%4.21% 4.31%
3.70%3.57% 3.48%
3.61% 3.69% 3.66%3.47%
3.79% 3.75% 3.79% 3.86% 3.81%3.70%
2015Y 2016Y 2017Y 2018Y 2019Y 2020Y
CIVB Peer Median Peer Top Quartile

16
Operating Efficiencies
Source: Company Management. 1Page 26 shows 2018 ratios adjusted for merger related expenses
Fee income platform– Service charges on deposit accounts were $5.3 million YTD 2020
and $6.4 million YTD 2019 Mortgage Banking
– Gain on sale of loans, primarily mortgage loans, was $8.6 million YTD 2020 and $2.7 million YTD 2019
Swap fee income– Swap fee income was $1.5 million YTD 2020 and $516
thousand YTD 2019 Tax Refund Processing Platform
– $2.4 million YTD 2020 and $2.8 million YTD 2019
Continued disciplined approach to controlling noninterest expense
Near‐term focus on review of branch network
Identified efficiencies invested to enhance digital offerings
Efficiency Ratio1Noninterest Income by Category
$ in millions
68.1% 64.7% 67.0%
78.2%
61.4% 59.1%
2015 2016 2017 2018 2019 2020
62.9%
$‐
$5,000
$10,000
$15,000
$20,000
2017 2018 2019 2020
Net gain on sale of loans
Swap fees
Tax refund processing fees
Other
Wealth management fees
ATM/Interchange fees
Service charges
17
Leveraging Technology
Enhance utilization of technology to leverage efficiency and improve internal and external customer experience– Curbside banking– Workflow and electronic storage – E‐Sign– Digital Transformation – anticipated rollout Q2 2021
• Retail• Commercial Improved in‐branch and online account opening and online access
Enhanced fraud monitoring and data protection
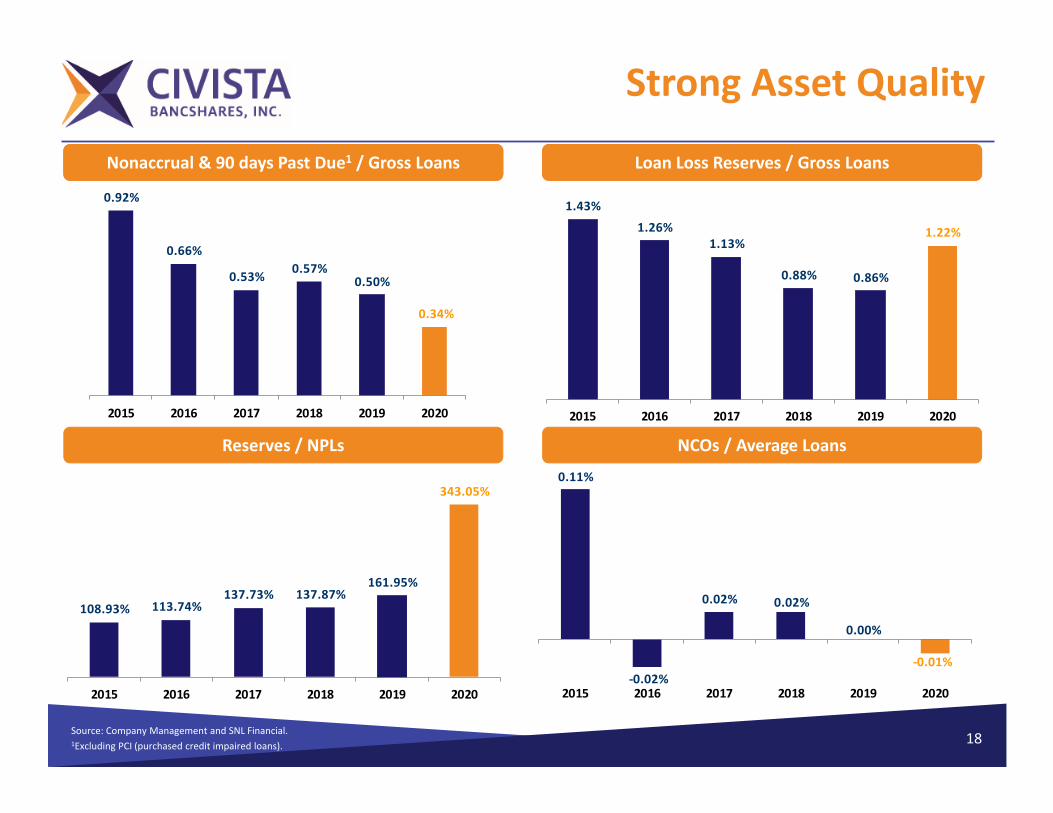
18Source: Company Management and SNL Financial.1Excluding PCI (purchased credit impaired loans).
Strong Asset Quality
Reserves / NPLs NCOs / Average Loans
Loan Loss Reserves / Gross LoansNPAs & 90+PD / Assets Loan Loss Reserves / Gross LoansNonaccrual & 90 days Past Due1 / Gross Loans
0.11%
‐0.02%
0.02% 0.02%
0.00%
‐0.01%
2015 2016 2017 2018 2019 2020
108.93% 113.74%137.73% 137.87%
161.95%
343.05%
2015 2016 2017 2018 2019 2020
1.43%
1.26%1.13%
0.88% 0.86%
1.22%
2015 2016 2017 2018 2019 2020
0.92%
0.66%
0.53% 0.57%0.50%
0.34%
2015 2016 2017 2018 2019 2020

Profitability & Returns Analysis
Source: Company Management and SNL Financial.1 Page 27 shows 2018 ratios adjusted for merger related expenses 19
Diluted Earnings per Share1 ROAE1
ROAA1Net Income Available to Common Shareholders1
$11,168
$15,716 $14,628 $13,180
$33,231
2015 2016 2017 2018 2019 2020
$32,192
$24,650
0.95%
1.19%1.04%
0.81%
1.51%
1.17%
2015 2016 2017 2018 2019 2020
1.47%
$1.17
$1.57
$1.28 $1.02
$2.01 $2.00
2015 2016 2017 2018 2019 2020
$1.85 10.59%
12.90%
9.19%
6.50%
10.64%9.57%
2015 2016 2017 2018 2019 2020
11.78%

20
Strong Capital Position
1 TCE Non‐GAAP reconciliation on page 252 Page 27 shows 2018 ratios adjusted for merger related expenses
Successfully raised $32.8 million of capital (issued 1,610,000 shares) in February 2017
Additional $104.7 million of capital (issued 4,277,430 shares) related to UCB merger in September 2018
Successfully redeemed outstanding preferred shares effective December 20, 2019
Authorized $13.5 million stock repurchase plan on April 21, 2020. At December 31, 2020, $11.5 million remains.
Beginning in Q3 2019, through Q4 2020, 1,015,147 shares have been repurchased for approximately $17.3 million at a weighted average price of $17.01
Increased the quarterly common dividend to $0.12 in first quarter 2020.
($s in thousands, except per share data)
2015 2016 2017 2018 2019 2020Total Equity $125,173 $137,616 $184,461 $298,898 $330,126 $350,108TCE / TA 1 5.71% 6.70% 9.31% 9.98% 11.08% 9.98%ROAE 2 10.59% 12.90% 9.19% 11.78% 10.64% 9.57%
For the Years Ended December 31,

21Source: Company Management and SNL Financial.
Operating Results
($s in thousands, except per share data)
2015 2016 2017 2018 2019 2020
Net Interest Income $47,392 $50,259 $54,502 $66,107 $85,100 $89,727
Provision for Loan Losses 1,200 (1,300) 0 780 1,035 10,112
Noninterest Income 14,278 16,132 16,334 18,131 22,443 28,183
Noninterest Expense 42,944 43,855 48,604 66,679 66,947 70,666
Net Income/(Loss) 12,745 17,217 15,872 14,139 33,878 32,192
Net Income Available to Common Shareholders $11,168 $15,716 $14,628 $13,180 $33,231 $32,192
Diluted Earnings/(Loss) per Common Share $1.17 $1.57 $1.28 $1.02 $2.01 $2.00
Return on Average Assets (ROAA) 0.95% 1.19% 1.04% 0.81% 1.51% 1.17%
Return on Average Equity (ROAE) 10.59% 12.90% 9.19% 6.50% 10.64% 9.57%
For the Years Ended December 31,
22
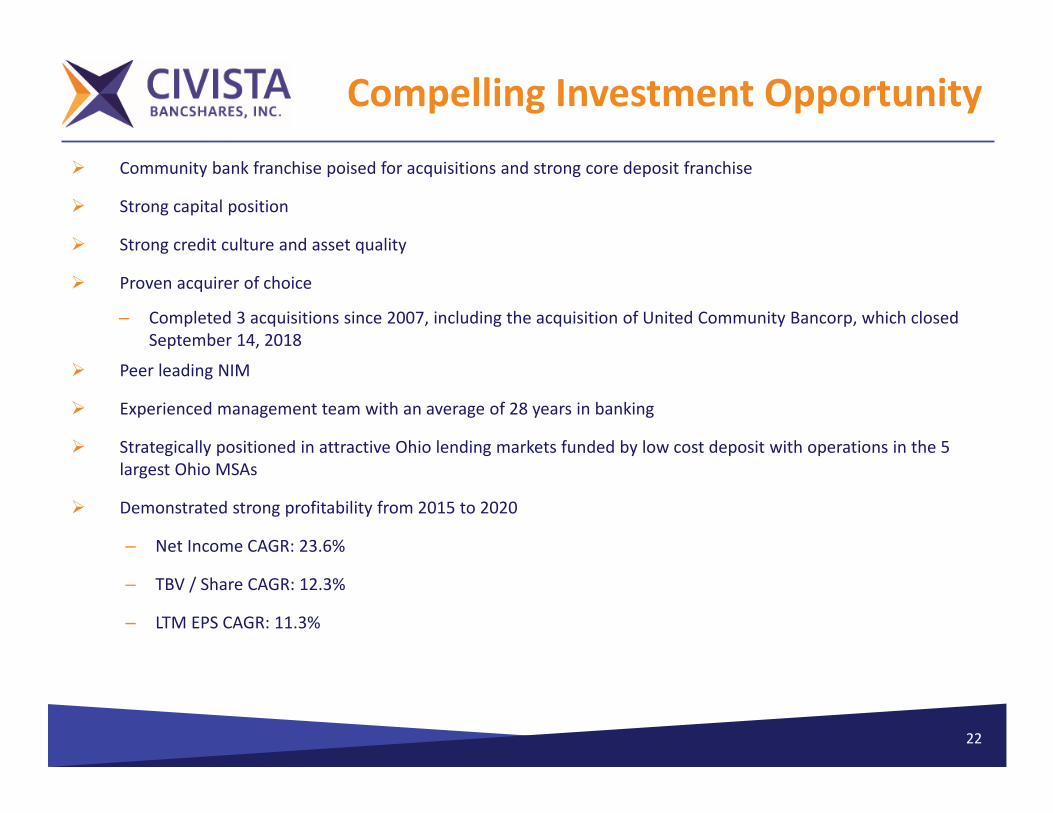
Compelling Investment Opportunity
Community bank franchise poised for acquisitions and strong core deposit franchise
Strong capital position
Strong credit culture and asset quality
Proven acquirer of choice
– Completed 3 acquisitions since 2007, including the acquisition of United Community Bancorp, which closed September 14, 2018
Peer leading NIM
Experienced management team with an average of 28 years in banking
Strategically positioned in attractive Ohio lending markets funded by low cost deposit with operations in the 5 largest Ohio MSAs
Demonstrated strong profitability from 2015 to 2020
– Net Income CAGR: 23.6%
– TBV / Share CAGR: 12.3%
– LTM EPS CAGR: 11.3%

SBA Paycheck Protection Program
Originated $259.1 million in PPP Round 1– Provided assistance to more than 2,300 businesses and their over 36,000
employees– Over 2,300 loans, average loan size ~$110K– Over 50% of PPP loans fall within Restaurants, Healthcare, Manufacturing and
Construction– As of 12/31/2020 $41.8 million PPP loans have been forgiven or paid off. We
have recognized $4.7 million in fees with $5.2 million remaining to be earned
Currently participating in PPP Round 2– At 2/8/2021 received 1,044 applications
• Funded 596 loans for $71.4 million
23

241 PPP loans for December 31, 2020 totaled $217,295,472
COVID 19 Deferrals
During 2020, Civista modified a total of 813 loans totaling $431.1 million, primarily consisting of the deferral of principal and/or interest payments, under the provisions of the CARES Act. As of December 31, 2020, loans that remain on a CARES Act modification total $73.8 million.
$s in thousands
Loan Category Balance Count% of Loans Outstanding
Auto Repair and Maintenance 322$ 1 0.02%Entertainment and Recreation 3,344 3 0.18%Hotels 43,628 20 2.37%Nonresidential Buildings and Dwellings 11,007 8 0.60%Professional and Management 45 2 0.00%Other Services 667 2 0.04%Transportation and Warehousing 175 2 0.01%Residential Buildings and Dwellings 5,133 2 0.28%Restaurants 5,091 7 0.28%Retail 118 2 0.01%Social Assistance Services 4,254 6 0.23%
Total 73,784$ 55 4.01%
Total Loans Outstanding excluding PPP1 1,840,207$
25
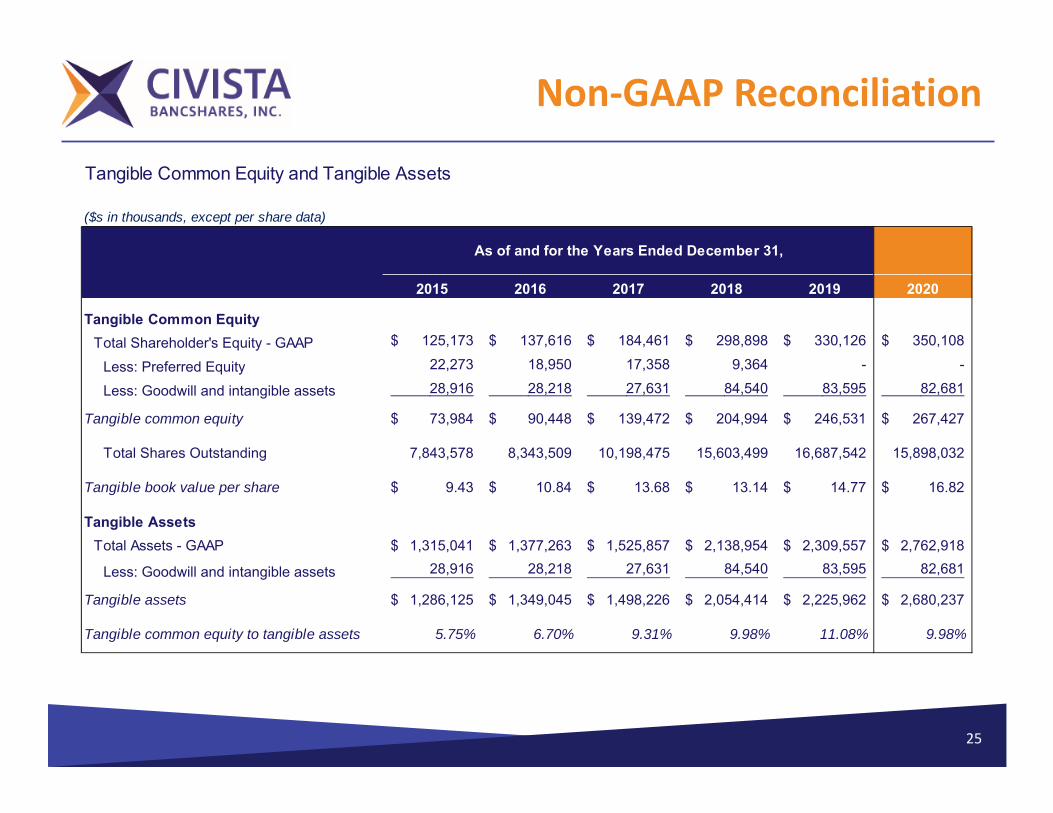
Non‐GAAP Reconciliation
Tangible Common Equity and Tangible Assets
($s in thousands, except per share data)
2015 2016 2017 2018 2019 2020
Tangible Common EquityTotal Shareholder's Equity - GAAP 125,173$ 137,616$ 184,461$ 298,898$ 330,126$ 350,108$
Less: Preferred Equity 22,273 18,950 17,358 9,364 - -
Less: Goodwill and intangible assets 28,916 28,218 27,631 84,540 83,595 82,681
Tangible common equity 73,984$ 90,448$ 139,472$ 204,994$ 246,531$ 267,427$
Total Shares Outstanding 7,843,578 8,343,509 10,198,475 15,603,499 16,687,542 15,898,032
Tangible book value per share 9.43$ 10.84$ 13.68$ 13.14$ 14.77$ 16.82$
Tangible AssetsTotal Assets - GAAP 1,315,041$ 1,377,263$ 1,525,857$ 2,138,954$ 2,309,557$ 2,762,918$
Less: Goodwill and intangible assets 28,916 28,218 27,631 84,540 83,595 82,681
Tangible assets 1,286,125$ 1,349,045$ 1,498,226$ 2,054,414$ 2,225,962$ 2,680,237$
Tangible common equity to tangible assets 5.75% 6.70% 9.31% 9.98% 11.08% 9.98%
As of and for the Years Ended December 31,
26
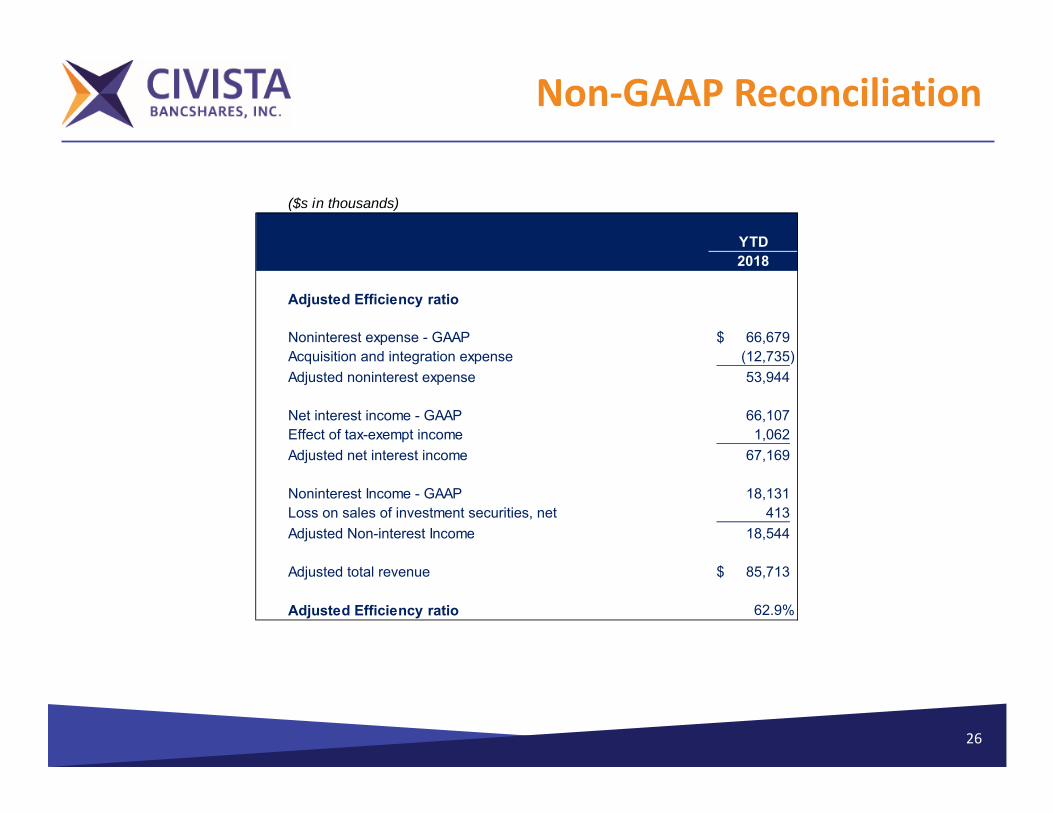
Non‐GAAP Reconciliation
($s in thousands)
YTD2018
Adjusted Efficiency ratio
Noninterest expense - GAAP 66,679$ Acquisition and integration expense (12,735) Adjusted noninterest expense 53,944
Net interest income - GAAP 66,107 Effect of tax-exempt income 1,062 Adjusted net interest income 67,169
Noninterest Income - GAAP 18,131 Loss on sales of investment securities, net 413 Adjusted Non-interest Income 18,544
Adjusted total revenue 85,713$
Adjusted Efficiency ratio 62.9%

27
Non‐GAAP Reconciliation($s in thousands, except per share data)
Actual 2018
Merger and one-time Adjusted
GAAP items 2018
Net Interest Income $66,107 $0 $66,107
Provision for Loan Losses 780 0 780
Noninterest Income 18,131 413 18,544
Noninterest Expense 66,679 (12,735) 53,944
Net Income/(Loss) 14,139 11,470 25,609
Net Income Available to Common Shareholders $13,180 $11,470 $24,650
Diluted Earnings/(Loss) per Common Share $1.02 $0.83 $1.85
Return on Average Assets (ROAA) 0.81% 0.66% 1.47%
Return on Average Equity (ROAE) 6.50% 5.28% 11.78%

Thank You
28


