42
Metall Zug Group, August 21, 2017 Investor Presentation HY 1/17

Metall Zug Group, August 21, 2017
Investor Presentation HY 1/17

Metall Zug Group
1. Metall Zug Group - overview HY 1/17
2. Business Units
Household Appliances
Infection Control
Wire Processing
3. Group financial report HY 1/17
4. Investments in sustainable future growth
5. Information for investors
2
Content
Metall Zug Group
Overview HY 1/17

Metall Zug Group
Organic sales growth in local currencies of +0.3%, group gross sales of CHF
445.4 million
Operating income (EBIT) decreased to CHF 28.2 million (-10.8%), resulting in an
EBIT margin of 6.3% (previous year: 7.2%), based on gross sales
Main topics:
– Household Appliances: initiation of strategic replacement of production facilities (e.g.
preparation work for new pressing plant at V-ZUG in Zug)
– Infection Control: improvement in segment Medical following the relocation of production
to Slovenia; restructuring benefits are not (fully) reflected in the results on BU level;
STERIFAST acquisition
– Wire Processing: fostering of management structures; full ownership of DiIT AG
– Digitization initiatives
Gratifying financial result of CHF 14.4 million based on performance of securities
(previous year: CHF 0.6 million)
Net income of CHF 33.8 million (previous year: CHF 23.9 million), up 41.4%
4
Highlights HY 1/17

Metall Zug GroupNet sales to third parties in HY 1/17
5
(HY 1/16 values in brackets)

Business Units

Household AppliancesHY 1/17: Net sales MCHF 269.4; EBIT MCHF 26.5
Anton Schmaus, Germany’s “Rising Star of 2015”, Restaurant Storstad in Regensburg, Germany

Household Appliances
8
Net sales by product segment and region HY 1/17
(HY 1/16 values in brackets)

Household Appliances
3.7% decline in organic gross sales (acquisition effect: 0.0%; FX: 0.0%)
Decrease in EBIT and EBIT margin on the back of lower sales and various
investments, e.g. preparation work for the new production plant, new ERP (SAP
S/4HANA) and field service management system (mLogistics)
Continued consolidation of the leading market position in Switzerland
9
Key figures and highlights
CHF million HY 1/17 HY 1/16 ∆ 2016
Net sales to third parties 269.4 279.3 -3.5% 584.6
Operating income (EBIT) 26.5 32.9 -19.4% 76.8
EBIT margin in % 9.8 11.8 -200bp 13.1

Household Appliances International markets
Strong development in markets with own built-up structures, e.g. Australia,
Benelux, China, Germany and Hong Kong
Recovery in the Russian market
OEM business in the U.S. with lower sales and orders
Weaker sales in some politically unstable distributor markets (e.g. Turkey)
10
CHF million HY
1/17
HY
1/16
FY
2016
FY
2015
FY
2014
FY
2013
Net sales to third parties 11.7 17.0 46.7 36.0 35.1 24.6
in % of total BU net sales 4.3% 6.1% 8.0% 6.3% 6.1% 4.4%

Household Appliances V-ZUG Kühltechnik (production of refrigerators)
11
2013• Founding of V-ZUG
Kühltechnik (takeover
from AFG)
• In Arbon (limited lease
agreement)
• 105 FTEs
• Production of about
50K units
• High call rate
• Outdated machinery
• Loss-making
Today• Restructured company
• Investments of high
single-digit CHF million
• In Arbon (limited lease
agreement)
• 136 FTEs
• Production of about
65K units
• Low call rate
• Partly new machinery
• Profitable
Future• New plant
• Investments of mid
double-digit CHF million
• In eastern Switzerland
• Production capacity of
>80K units
• New machinery
• Optimized production
layout
• Profitable

Household Appliances
12
Strategic priorities
Strengthen the market leadership of V-ZUG in Switzerland and its premium brand
worldwide as a leader in innovation, technology and quality with Swiss-made
products
Expand and strengthen the international business in the premium segment in
selected countries
Develop the own refrigerator business in the premium segment
Prepare products, processes, structures and business models for the Internet of
Everything
Improve efficiency continuously
After the commissioning of the new “Mistral” building in Zug, preparation work for the new
production building “Zephyr” has started
Global sourcing

Infection Control HY 1/17: Net sales MCHF 85.6; EBIT MCHF –10.1
Anna Macko, sterile processing technician in the decontamination area, Florida Hospital in Orlando (U.S.)

Infection Control
14
Net sales by segment and region HY 1/17
(HY 1/16 values in brackets)

Infection Control
* incl. profit of MCHF 5.1 from the sale of the property in Ballwil in HY 2/16
Organic gross sales growth of +5.6% (acquisition effect: +0.3%; FX: -0.8%)
Medical segment with strong order intake in recent months and improvement with
respect to profitability
Life Science segment with higher sales compared to last year’s low level, but
below expectations
Growth in the Service business
Implementation of SAP in the Grosuplje and Mühldorf plants and lower-than-
expected Life Science sales had a negative impact on EBIT
Acquisition of STERIFAST to enter fast growing low-temperature sterilization
market 15
Key figures and highlights
CHF million HY 1/17 HY 1/16 ∆ 2016
Net sales to third parties 85.6 81.3 5.3% 201.4
Operating income (EBIT) -10.1 -13.0 22.5% -6.3*
EBIT margin in % -11.8 -16.0 420bp -3.1

Acquisition of STERIFAST
Infection Control
16
About STERIFAST
Founded in 1998, three permanent employees
A Portuguese company, specializing in low-temperature
sterilization for thermo-sensitive medical devices
Business case
With the increase in minimally invasive surgical
procedures, there is a growing need for complex surgical
instrumentation. Many of these instruments are sensitive to
heat and moisture, requiring low-temperature alternatives
and chemicals (recurring business)
Belimed’s benefit
Stronger low-temperature offering, which will strengthen
Belimed’s position as a full-solution provider and as one of
the global leaders in infection control

Infection Control
17
Restructuring
So far, concentrated restructuring efforts on the two largest segments Medical
and Service
Concluded relocation of production to Grosuplje, Slovenia (Medical)
Rollout of SAP in Grosuplje (Medical) and at the production site in Mühldorf (Life
Science) to increase efficiency and transparency
Additional cost saving measures needed in segment Service
After the relocation of the medical standard sterilizer and washer assembly from
Sulgen resp. Mühldorf to Grosuplje, Belimed is ready to optimize processes and
structures in the Life Science segment

Infection Control
18
Strategic priorities
Consolidate and complete restructuring of Medical and Service segments in order
to benefit from reduced complexity of the business structure and processes, as
well as reducing costs
Optimize processes and structures and explore full potential of the Life Science
segment
Increase market share in the U.S. and APAC
Strengthen R&D, accelerate product and technology innovations also related to
digitization and STERIFAST (low-temperature sterilization)
Initiate / prepare for acquisitions and cooperation to strengthen Belimed’s market
position
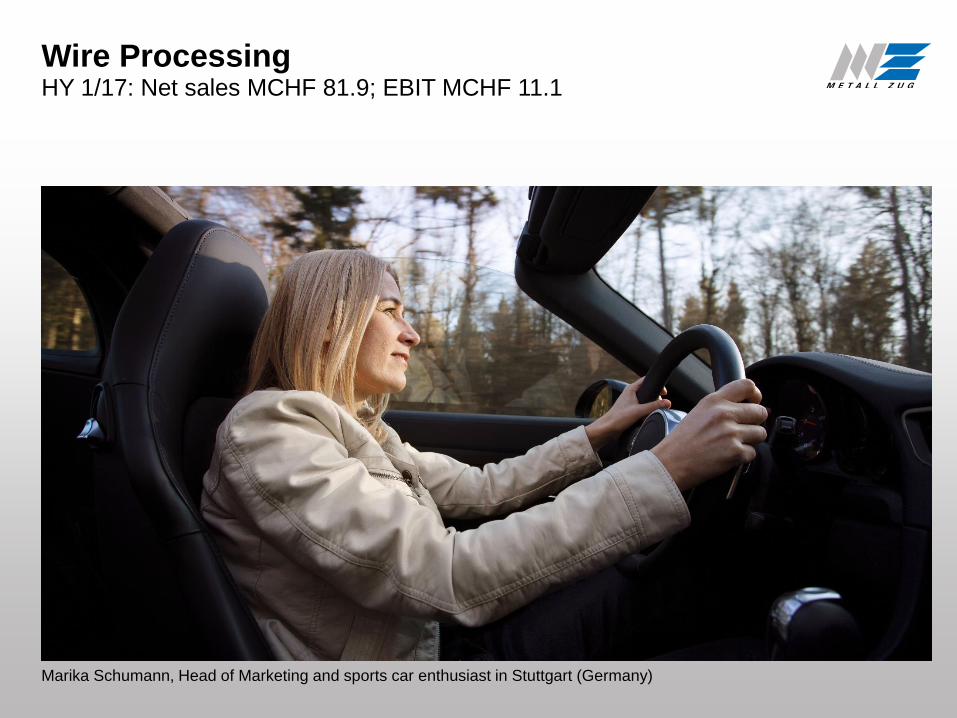
Wire ProcessingHY 1/17: Net sales MCHF 81.9; EBIT MCHF 11.1
Marika Schumann, Head of Marketing and sports car enthusiast in Stuttgart (Germany)

Wire Processing
20
Net sales by segment and region HY 1/17
(HY 1/16 values in brackets)

Wire Processing
Organic gross sales growth of +9.4% (acquisition: +4.4%; FX: -0.3%)
Growth in China, DACH region (Germany, Austria, Switzerland) and NAFTA
Positive development in the Cut & Strip/Semi-Automatic, Test Automation and
Process Automation segments; Cut, Strip & Terminate segment below
expectations
EBIT negatively impacted by investments in management structures at recently
acquired companies as well as at BU level
Acquisition of DiIT AG
21
Key figures and highlights
CHF million HY 1/17 HY 1/16 ∆ 2016
Net sales to third parties 81.9 71.7 14.2% 153.5
Operating income (EBIT) 11.1 11.9 -6.9% 22.8
EBIT margin in % 13.5 16.6 -310bp 14.9

Wire Processing
Schleuniger increased its stake in DiIT AG from 35% to 100%. DiIT has been fully
consolidated since the beginning of 2017
A globally leading producer of software systems for wire processing and wire
harness production; major manufacturers and Tier-1 suppliers in the automotive
industry rely on DiIT’s systems
Based on electronic drawings, DiIT’s solutions control and optimize the entire
production chain from the cutting area right through to shipping, including
generating all necessary production data
Acquisition of DiIT AG
22

Wire ProcessingIntegrated process chain for wire harness engineering and production
23
Process
DiIT
software
solution
Production
engineering
Engineering
4Wire – PPG(Production Plan
Generation)
Manufacturing execution
Cutting areaPreassembly /
Kitting
4Wire – CAO(Cutting and Assembly Optimization)
Assembly and
Logistics
Final assembly /
Shipment
4Wire – PLS(Production and
Logistics Suite)
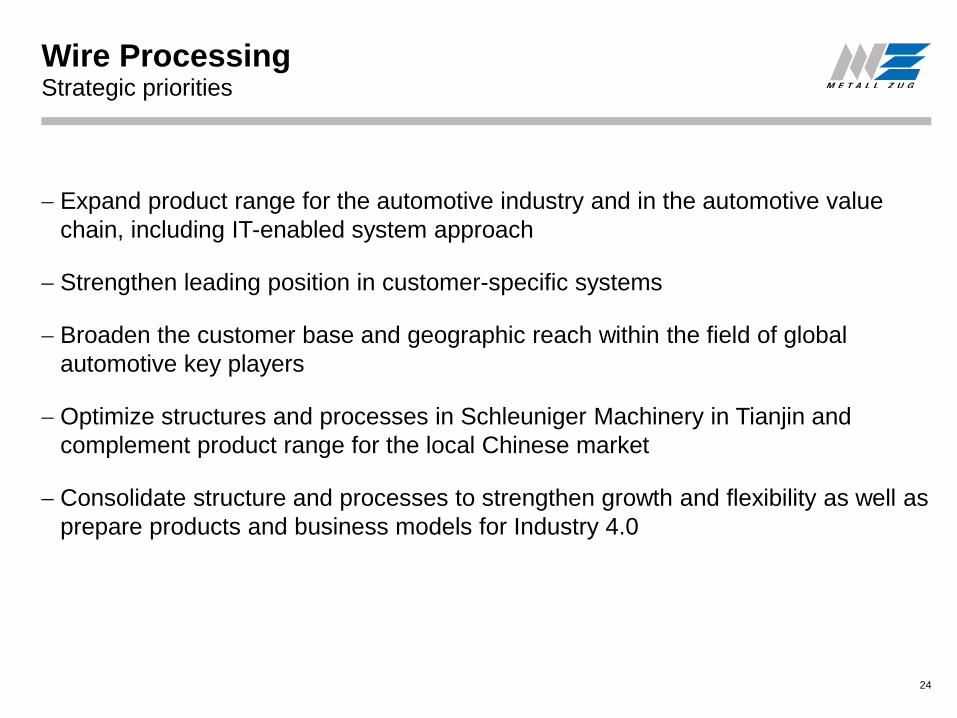
Wire Processing
Expand product range for the automotive industry and in the automotive value
chain, including IT-enabled system approach
Strengthen leading position in customer-specific systems
Broaden the customer base and geographic reach within the field of global
automotive key players
Optimize structures and processes in Schleuniger Machinery in Tianjin and
complement product range for the local Chinese market
Consolidate structure and processes to strengthen growth and flexibility as well as
prepare products and business models for Industry 4.0
Strategic priorities
24
Group Financial Report
HY 1/17

Group financial report
26
Key figures HY 1/17
Organic gross sales growth in local currencies of 0.3% (acquisition effect of
0.8% and a FX impact of -0.2%)
Sales growth in Infection Control and Wire Processing, sales decline in
Household Appliances
Decline in EBIT and EBIT margin due to lower sales in Household Appliances;
various additional expenses for the development of production sites, for
digitization as well as for new products and markets
Strong financial result led to a significant increase in net income
Higher equity ratio despite goodwill offset in equity (M&A), higher cash dividend
CHF million HY 1/17 HY 1/16 ∆ 2016
Gross sales 445.4 441.4 0.9% 960.6
Operating income (EBIT) 28.2 31.6 -10.8% 94.1
EBIT margin 6.3% 7.2% -90bp 9.8%
Financial result 14.4 0.6 10.3
Net income 33.8 23.9 41.4% 84.9
Equity ratio 77.8% 76.9% 90bp 76.9%

27
Income statement
Group financial report
CHF million HY 1/17 in % ∆ HY 1/16 in %
Gross sales 445.4 100.0% 0.9% 441.4 100.0%
Net sales 436.9 98.1% 1.1% 432.3 97.9%
Cost of materials (incl. ∆ inv.) -139.2 31.3% -2.1% -136.3 30.9%
Personnel expenses -191.1 42.9% -3.0% -185.6 42.1%
Other operating expenses -66.5 14.9% -3.1% -64.4 14.6%
Operating income (EBIT) 28.2 6.3% -10.8% 31.6 7.2%
Financial result 14.4 3.2% 0.6 0.1%
Income before taxes 42.6 9.6% 32.1% 32.3 7.3%
Taxes -9.0 2.0% -2.5% -8.8 2.0%
Minorities 0.2 0.0% 58.6% 0.4 0.1%
Net income 33.8 7.6% 41.4% 23.9 5.4%

Group financial report
28
Gross sales analysis
ORGANIC GROWTH EXTERNAL REPORTED
BU organic growth in % of BUs’ gross sales

Group financial report
29
Operating income (EBIT) analysis
OPERATIONAL AT BU LEVEL CORPORATE REPORTED

Group financial report
* EBIT margins of HY 2/16 and FY 16 excl. MCHF 5.1 profit from the sale of the property in Ballwil 30
Metall Zug Group seasonality
* HY 1/16 as % of FY excl. MCHF 5.1 profit from the sale of the property in Ballwil
• Stable seasonality in terms of net sales
• Higher seasonality at EBIT level last year

Metall Zug Group
31
Balance sheet
CHF million 06/30/2017 in % 12/31/2016
Cash and cash equivalents / securities 504.9 44.6% 543.5
Other current assets 300.0 26.5% 284.2
Current assets 804.9 71.1% 827.7
Tangible assets 276.1 24.4% 274.0
Financial & intangible assets 51.4 4.5% 50.9
Fixed assets 327.5 28.9% 324.9
Total assets 1 132.4 100.0% 1 152.7
Current & long-term financial liabilities 0.7 0.1% 0.5
Other liabilities 250.1 22.1% 265.9
Total liabilities 250.9 22.2% 266.4
Shareholders’ equity 881.5 77.8% 886.3
Total liabilities and shareholders’ equity 1132.4 100.0% 1 152.7
Net cash 504.2 44.5% 543.0

Metall Zug Group
32
Cash flow statement
CHF million HY 1/17 HY 1/16 ∆ % 2016
Cash flow from operating activities -0.4 2.6 95.4
- of which change in net working capital -23.8 -19.6 11.2
- of which taxes paid -14.0 -18.8 -27.6
Cash flow from investing activities -24.6 -16.2 -51.8% -50.6
- of which investments in tangible assets -13.2 -17.4 -55.4
- of which investments in intangible assets -4.0 -2.1 -5.4
- of which investments in group companies -7.9 -0.0 -0.0
Free cash flow -25.0 -13.6 -83.6% 44.9
Cash flow from financing activities -28.4 -29.3 3.1% -29.8
- of which dividend -31.4 -29.4 -29.4

Investments in sustainable
future growth

R&DImportant success factor
R&D expenses including personnel costs, cost of material, overhead costs and
external services, charged directly to the income statement
Ongoing product innovation in all Business Units
Investment in digitization of today’s and future products
34
CHF million 2016 2015 2014 2013
Expenses in R&D 81.2 80.1 72.9 71.7
in % of gross sales 8.5% 8.6% 7.9% 7.9%
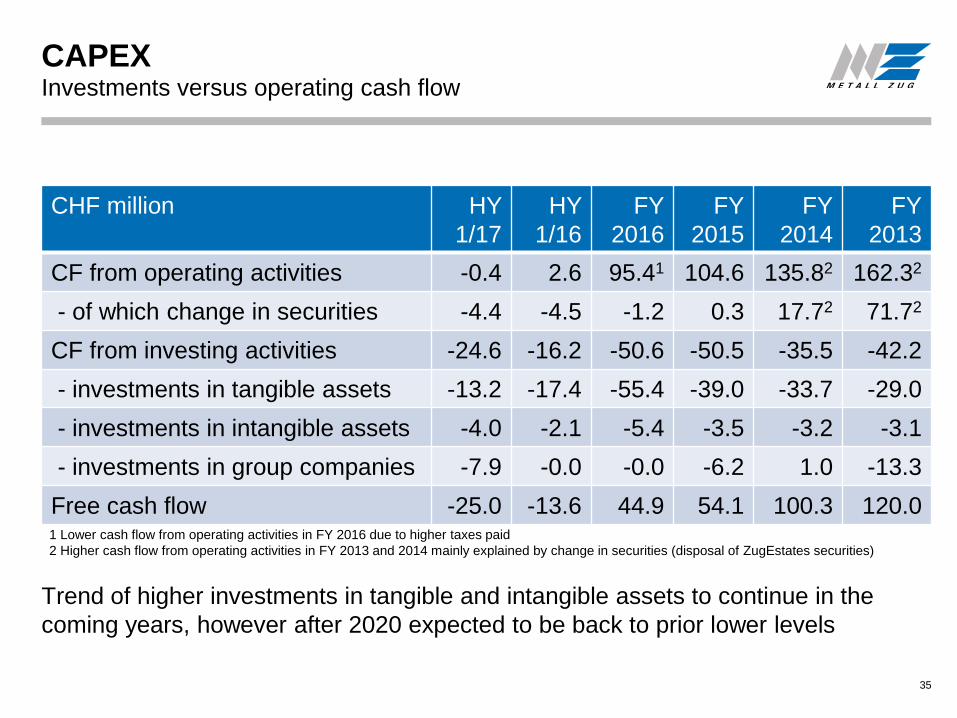
CAPEXInvestments versus operating cash flow
Trend of higher investments in tangible and intangible assets to continue in the
coming years, however after 2020 expected to be back to prior lower levels
35
CHF million HY
1/17
HY
1/16
FY
2016
FY
2015
FY
2014
FY
2013
CF from operating activities -0.4 2.6 95.41 104.6 135.82 162.32
- of which change in securities -4.4 -4.5 -1.2 0.3 17.72 71.72
CF from investing activities -24.6 -16.2 -50.6 -50.5 -35.5 -42.2
- investments in tangible assets -13.2 -17.4 -55.4 -39.0 -33.7 -29.0
- investments in intangible assets -4.0 -2.1 -5.4 -3.5 -3.2 -3.1
- investments in group companies -7.9 -0.0 -0.0 -6.2 1.0 -13.3
Free cash flow -25.0 -13.6 44.9 54.1 100.3 120.01 Lower cash flow from operating activities in FY 2016 due to higher taxes paid
2 Higher cash flow from operating activities in FY 2013 and 2014 mainly explained by change in securities (disposal of ZugEstates securities)

Zephyr (new production plant)
Transformation of the V-ZUG site in ZugModernization of V-ZUG production: Zephyr being the next step
36
V-ZUG vertical production
ZUGgate
Mistral
Zephyr
Further concentration and
automatization of production
processes enables V-ZUG to grow
and is needed in order to maintain
competitive production of household
appliances in Zug
Investigation of contamination of the
site during 2017 as part of the
extensive preparation work
New production plant Zephyr
Current location of the machinery

Transformation of the V-ZUG site in ZugCore themes for the Technology Cluster Zug
37
Smart city
Simulation technology
Sensor technology
Rapid prototyping
Urban industries
Me
ga
them
es
An
ch
or th
em
es
Foodtech
Medtech
Building technology
Center of excellence kitchen
Center of excellence cleaning
Cleantech
CO2-mitigation

Information for Investors

Investment case
39
Preparing for an insecure future
All three Business Units have to cope with short visibility and limited predictability
with regards to their market environment and therefore have to become highly
flexible
All Business Units are well positioned in attractive markets with growth potential
based on competitive product portfolios, strong customer relationships and
opportunities related to digital business and processes
Earnings growth drivers are internationalization in Household Appliances, the new
structure and service offering in Infection Control and the broader product portfolio
(including testing and system integration) in Wire Processing
Stable shareholder base with an entrepreneurial family as its main shareholder
pursues a decidedly long-term perspective creating sustainable value for all
stakeholders
Strong balance sheet enables investments in internal and external growth and to
pursue attractive opportunities

Metall Zug Group
March 22, 2018 Publication of the full-year results 2017
May 4, 2018 General Meeting of Shareholders
August 20, 2018 Publication of the half-year results 2018
40
Financial calendar

Metall Zug Group
Daniel Keist
Chief Financial Officer
Christian Arnold
Head of Corporate Communications & Investor Relations
Metall Zug AG
Industriestrasse 66
CH-6301 Zug
Switzerland
Phone: +41 58 768 10 20
41
Contact

Metall Zug Group
Metall Zug AG is making great efforts to include accurate and up-to-date information in this
document. However, we make no representations or warranties, expressed or implied, as to
the accuracy or completeness of the information provided in this document and disclaim any
liability whatsoever for the use of it.
The statements in this document relating to matters that are not historical facts are forward-
looking statements based on estimates and assumptions of the company and are believed to
be reasonable, but are inherently uncertain, difficult to predict and do not constitute a
guarantee of future performance. They may involve risks and uncertainties including but not
limited to: future global economic conditions, technological advances, exchange rates,
regulatory rules, market conditions, the actions of competitors and other factors beyond the
control of the company. Metall Zug AG disclaims any intention or obligation to update these
forward-looking statements.
The information provided in this document is not intended to be nor should it be construed as
an offer or solicitation for purchase or disposal, trading or any transaction in any Metall Zug
AG securities or other financial instruments. Investors must not rely solely on this information
for investment decisions.
Disclaimer
42


