49
Investor Presentation August 2017

Investor
Presentation
August 2017
This presentation, including the accompanying oral presentation (collectively, this “presentation”), does not constitute an offer to sell or the solicitation of an offer to buy any
securities. This presentation is provided by On Deck Capital, Inc. (“OnDeck”) for informational purposes only. No representations express or implied are being made by OnDeck or
any other person as to the accuracy or completeness of the information contained herein.
This presentation contains “forward-looking statements” within the meaning of the Private Securities Litigation Reform Act of 1995 and other legal authority. Forward-looking
statements include statements about scalability, growing distribution channels, credit predictability and information concerning our future financial performance, business plans and
objectives, potential growth opportunities, financing plans, competitive position, industry environment and potential market opportunities. Forward-looking statements can also be
identified by words such as "will," "enables," "expects”, “may,” "allows," "continues," "believes,” “intends,” "anticipates," "estimates" or similar expressions. Forward-looking
statements are neither historical facts nor assurances of future performance. They are based only on our current beliefs, expectations and assumptions regarding the future of our
business, anticipated events and trends, the economy and other future conditions. Moreover, we do not assume responsibility for the accuracy and completeness of forward-looking
statements. As such, they are subject to inherent uncertainties, changes in circumstances, known and unknown risks and other factors that are difficult to predict and in many cases
outside our control.
As a result, you should not rely on any forward-looking statements. Our expected results may not be achieved, and actual results may differ materially from our expectations.
Important factors that could cause actual results to differ from our forward-looking statements are the risks that we may not be able to manage our anticipated or actual growth
effectively, that our credit models do not adequately identify potential risks, the timing and amount of expected savings from cost rationalization programs and other risks, including
those under the heading “Risk Factors” in our Annual Report on Form 10-K for the year ended December 31, 2016 and in other documents that we file with the Securities and
Exchange Commission, or SEC, from time to time which are available on the SEC website at www.sec.gov. We undertake no obligation to publicly update any forward-looking
statements for any reason after the date of this presentation to conform these statements to actual results or to changes in our expectations, except as required by law.
In addition to U.S. GAAP financial information, this presentation includes certain non-GAAP financial measures. We believe that non-GAAP measures can provide useful
supplemental information for period-to-period comparisons of our core business and are useful to investors and others in understanding and evaluating our operating results. These
non-GAAP measures have not been calculated in accordance with U.S. GAAP. You should not consider them in isolation or as a substitute for an analysis of our results under U.S.
GAAP. There are a number of limitations related to the use of these non-GAAP measures compared to their nearest U.S. GAAP equivalents. In addition, other companies may
calculate non-GAAP financial measures differently or may use other measures to evaluate their performance, all of which could reduce the usefulness of our non-GAAP financial
measures as tools for comparison. The non-GAAP measures contained in this presentation include Adjusted EBITDA, Adjusted Net Income (Loss), Adjusted Expense Ratio,
Adjusted Operating Yield and certain operating expense categories, all of which exclude stock-based compensation, as well as Net Interest Margin After Credit Losses. Please refer
to pages 35 through 49 in the Appendix of this presentation for a description of these non-GAAP measures, their respective limitations and reconciliations to U.S. GAAP.
Forward-Looking Statements
2
1,159 1,037
590 464
1H '16 1H '17 2Q '16 2Q '17
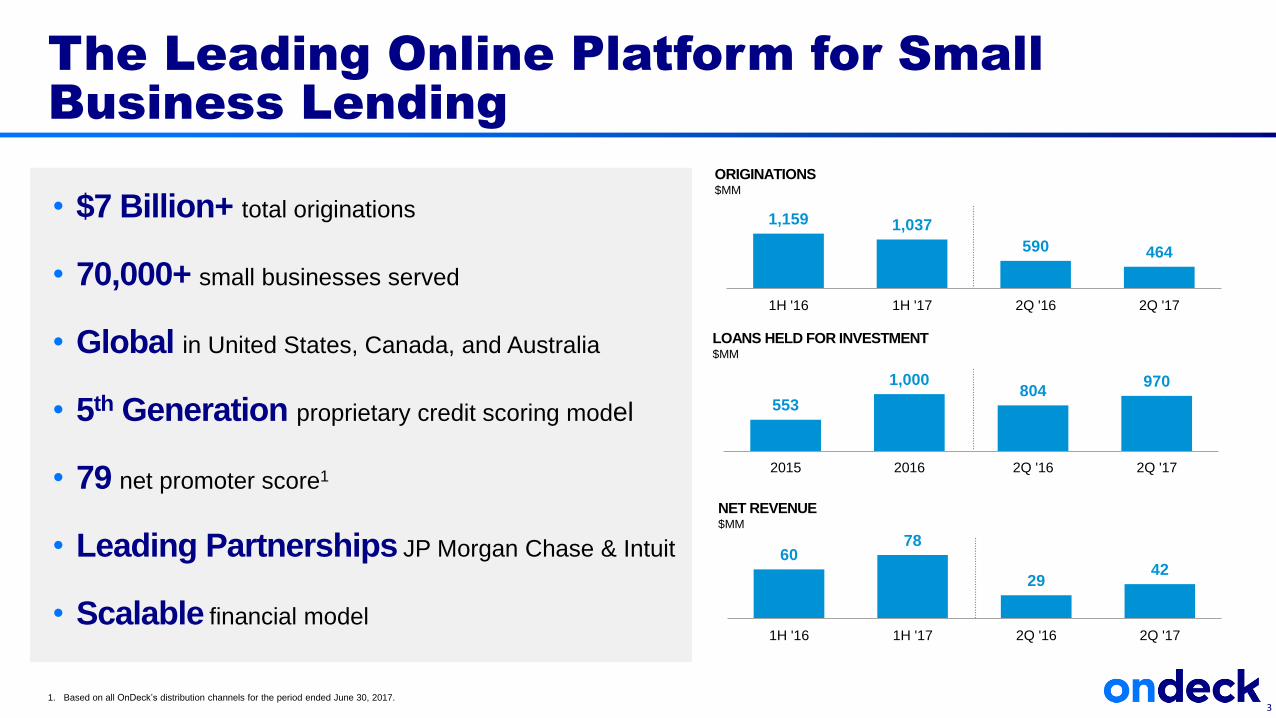
ORIGINATIONS$MM
• $7 Billion+ total originations
• 70,000+ small businesses served
• Global in United States, Canada, and Australia
• 5th Generation proprietary credit scoring model
• 79 net promoter score1
• Leading Partnerships JP Morgan Chase & Intuit
• Scalable financial model
The Leading Online Platform for Small
Business Lending
1. Based on all OnDeck’s distribution channels for the period ended June 30, 2017.3
6078
2942
1H '16 1H '17 2Q '16 2Q '17
NET REVENUE$MM
LOANS HELD FOR INVESTMENT$MM
553
1,000804
970
2015 2016 2Q '16 2Q '17
4
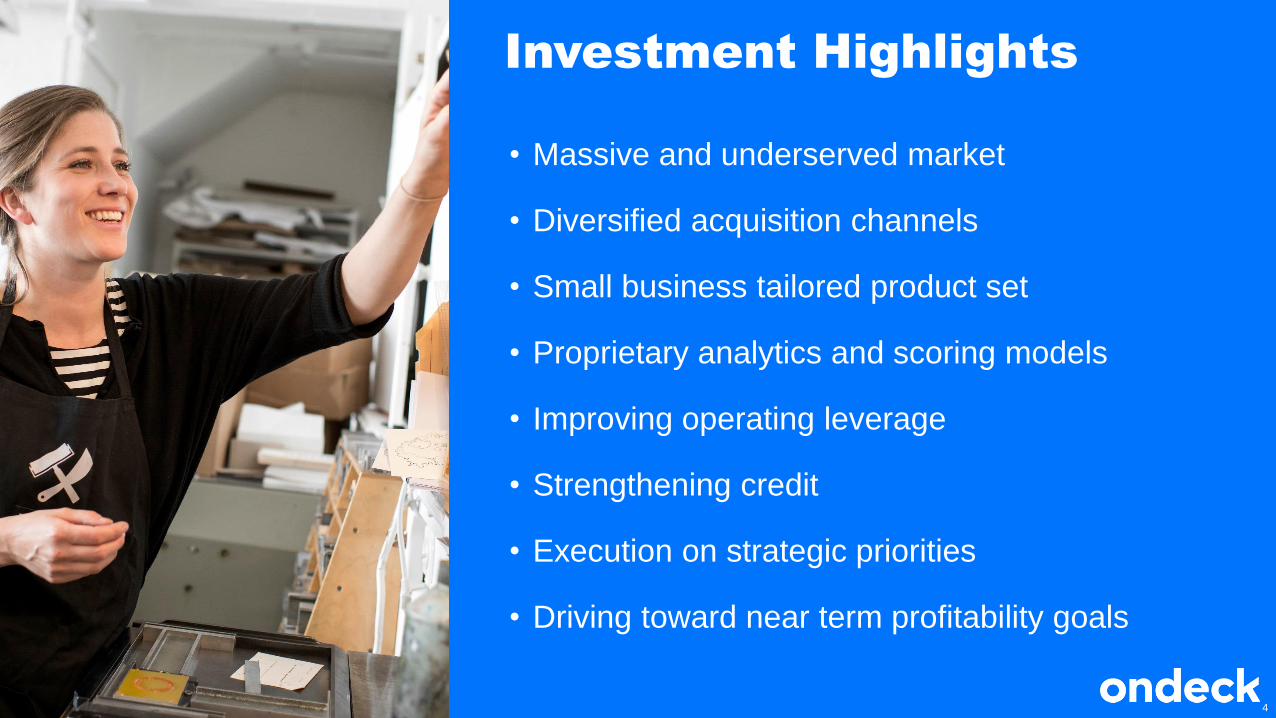
Investment Highlights
• Massive and underserved market
• Diversified acquisition channels
• Small business tailored product set
• Proprietary analytics and scoring models
• Improving operating leverage
• Strengthening credit
• Execution on strategic priorities
• Driving toward near term profitability goals
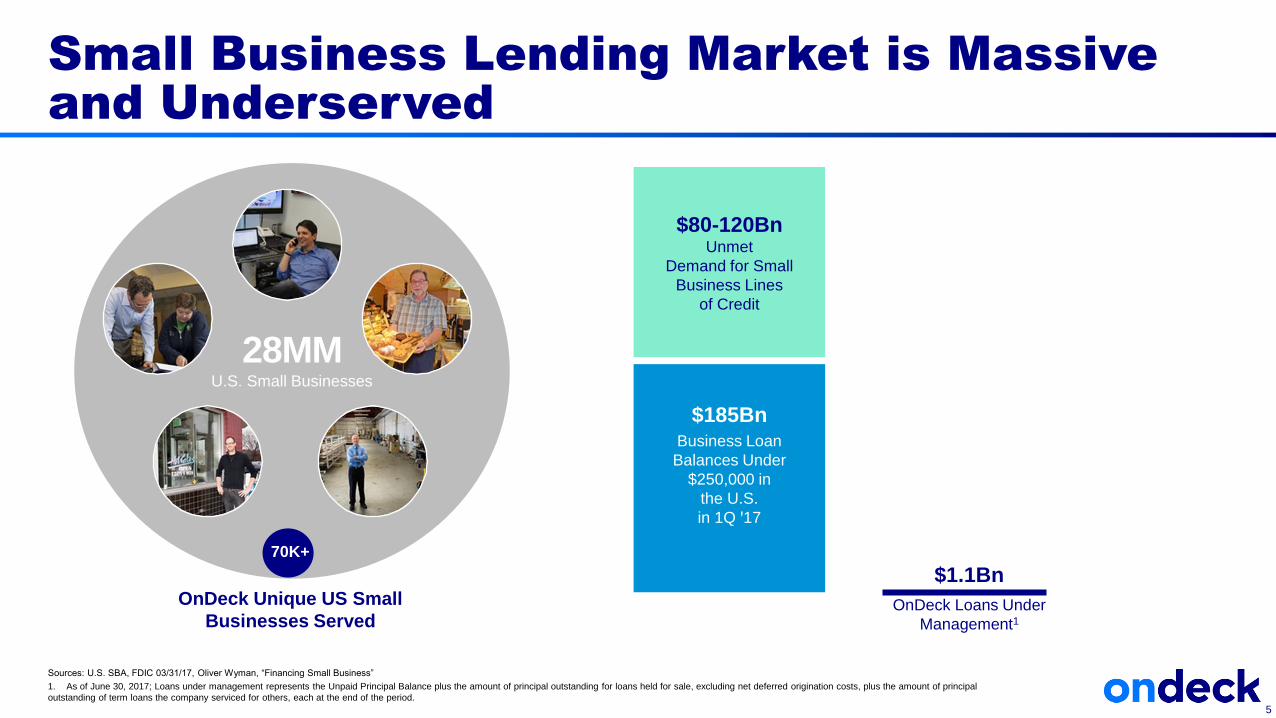
Small Business Lending Market is Massive
and Underserved
Sources: U.S. SBA, FDIC 03/31/17, Oliver Wyman, “Financing Small Business”
1. As of June 30, 2017; Loans under management represents the Unpaid Principal Balance plus the amount of principal outstanding for loans held for sale, excluding net deferred origination costs, plus the amount of principal
outstanding of term loans the company serviced for others, each at the end of the period.
5
28MMU.S. Small Businesses
OnDeck Unique US Small
Businesses Served
70K+
$80-120BnUnmet
Demand for Small
Business Lines
of Credit
$185BnBusiness Loan
Balances Under
$250,000 in
the U.S.
in 1Q ꞌ17
$1.1Bn
OnDeck Loans Under
Management1
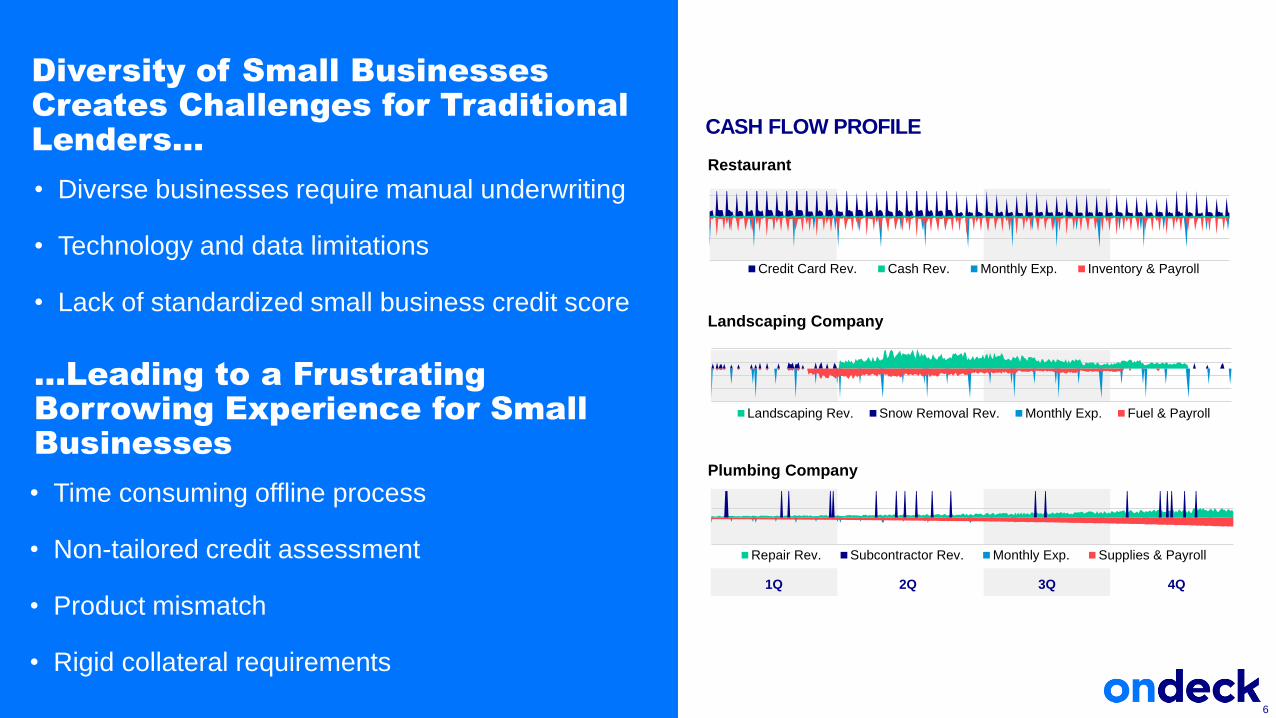
Diversity of Small Businesses
Creates Challenges for Traditional
Lenders…
• Diverse businesses require manual underwriting
• Technology and data limitations
• Lack of standardized small business credit score
6
Credit Card Rev. Cash Rev. Monthly Exp. Inventory & Payroll
Landscaping Rev. Snow Removal Rev. Monthly Exp. Fuel & Payroll
Repair Rev. Subcontractor Rev. Monthly Exp. Supplies & Payroll
CASH FLOW PROFILE
Restaurant
Landscaping Company
Plumbing Company
1Q 2Q 3Q 4Q
…Leading to a Frustrating
Borrowing Experience for Small
Businesses
• Time consuming offline process
• Non-tailored credit assessment
• Product mismatch
• Rigid collateral requirements
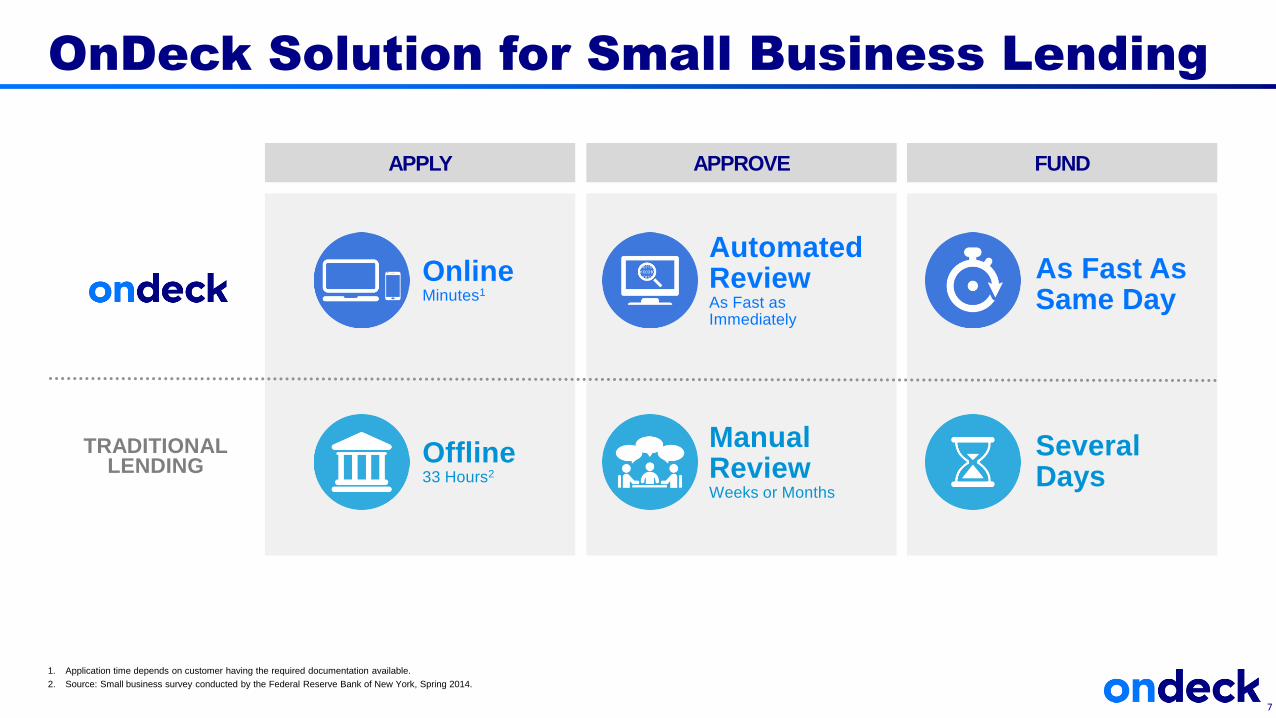
Manual ReviewWeeks or Months
Offline33 Hours2
OnDeck Solution for Small Business Lending
1. Application time depends on customer having the required documentation available.
2. Source: Small business survey conducted by the Federal Reserve Bank of New York, Spring 2014.
7
APPLY
TRADITIONAL LENDING
Several Days
OnlineMinutes1
Automated ReviewAs Fast as Immediately
As Fast As Same Day
APPROVE FUND
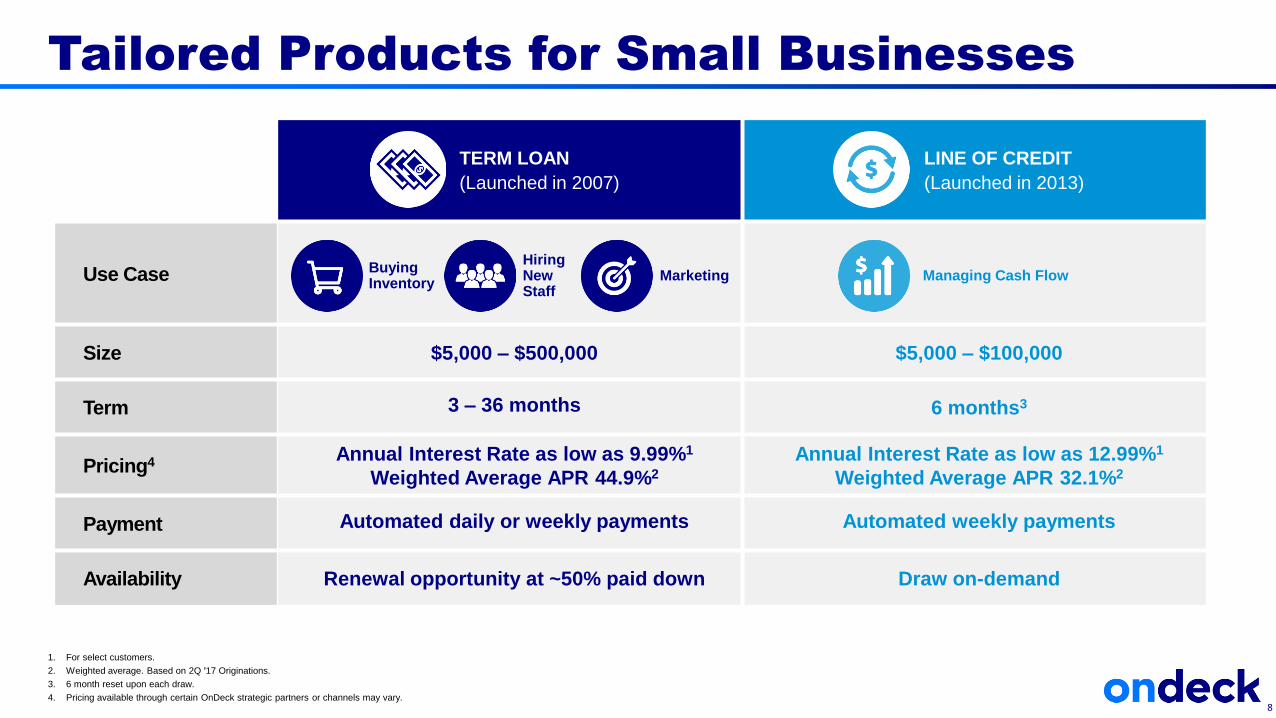
TERM LOAN
(Launched in 2007)
LINE OF CREDIT
(Launched in 2013)
Use Case
Size $5,000 – $500,000 $5,000 – $100,000
Term 3 – 36 months 6 months3
Pricing4 Annual Interest Rate as low as 9.99%1
Weighted Average APR 44.9%2
Annual Interest Rate as low as 12.99%1
Weighted Average APR 32.1%2
Payment Automated daily or weekly payments Automated weekly payments
Availability Renewal opportunity at ~50% paid down Draw on-demand
Tailored Products for Small Businesses
1. For select customers.
2. Weighted average. Based on 2Q ꞌ17 Originations.
3. 6 month reset upon each draw.
4. Pricing available through certain OnDeck strategic partners or channels may vary.
HiringNewStaff
Buying Inventory
Marketing Managing Cash Flow
8
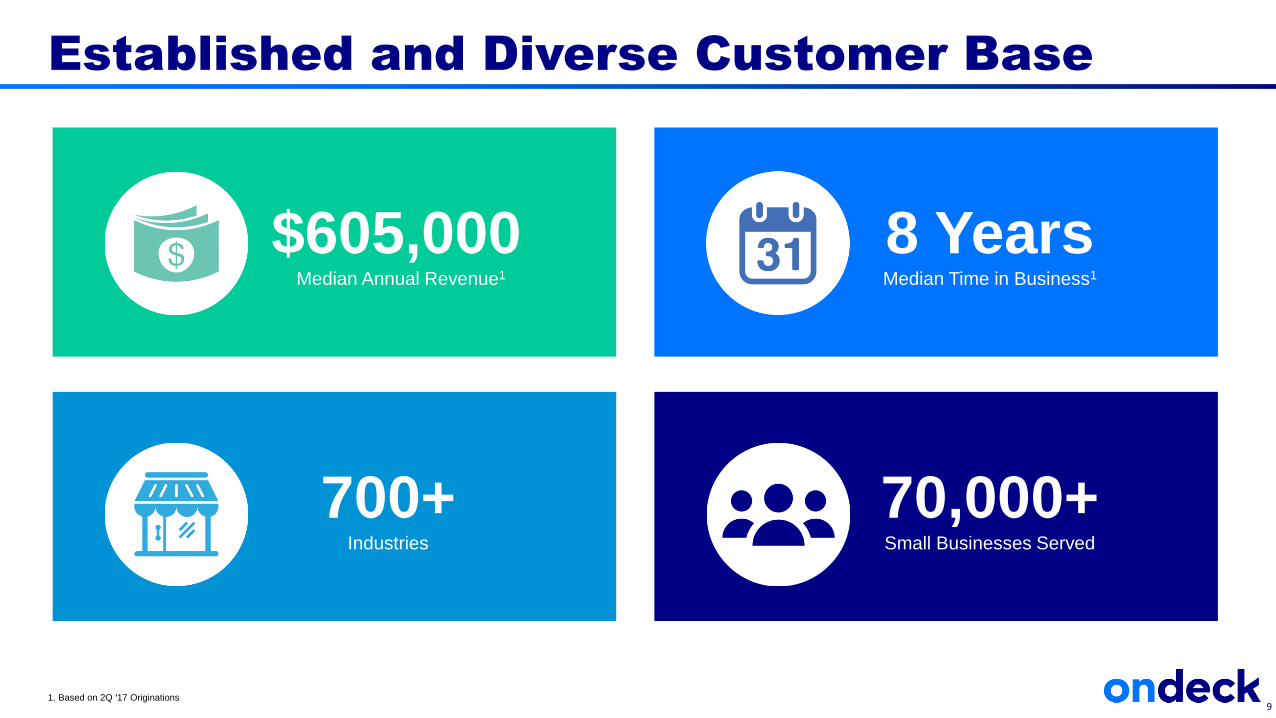
70,000+Small Businesses Served
8 YearsMedian Time in Business1
Established and Diverse Customer Base
1. Based on 2Q ꞌ17 Originations
$605,000Median Annual Revenue1
700+Industries
9
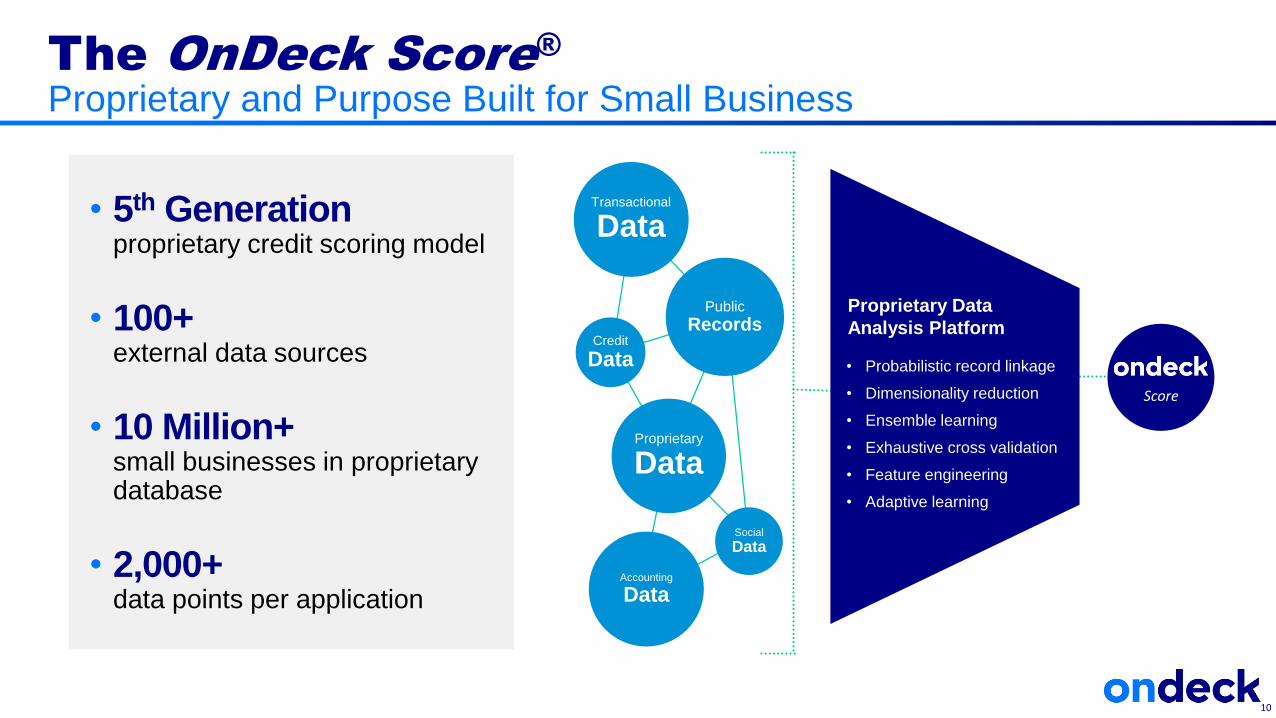
• 5th Generationproprietary credit scoring model
• 100+ external data sources
• 10 Million+ small businesses in proprietary database
• 2,000+ data points per application
The OnDeck Score®
Proprietary and Purpose Built for Small Business
10
Score
• Probabilistic record linkage
• Dimensionality reduction
• Ensemble learning
• Exhaustive cross validation
• Feature engineering
• Adaptive learning
Proprietary Data
Analysis Platform
Public
RecordsCredit
Data
Social
Data
Proprietary
Data
Transactional
Data
Accounting
Data
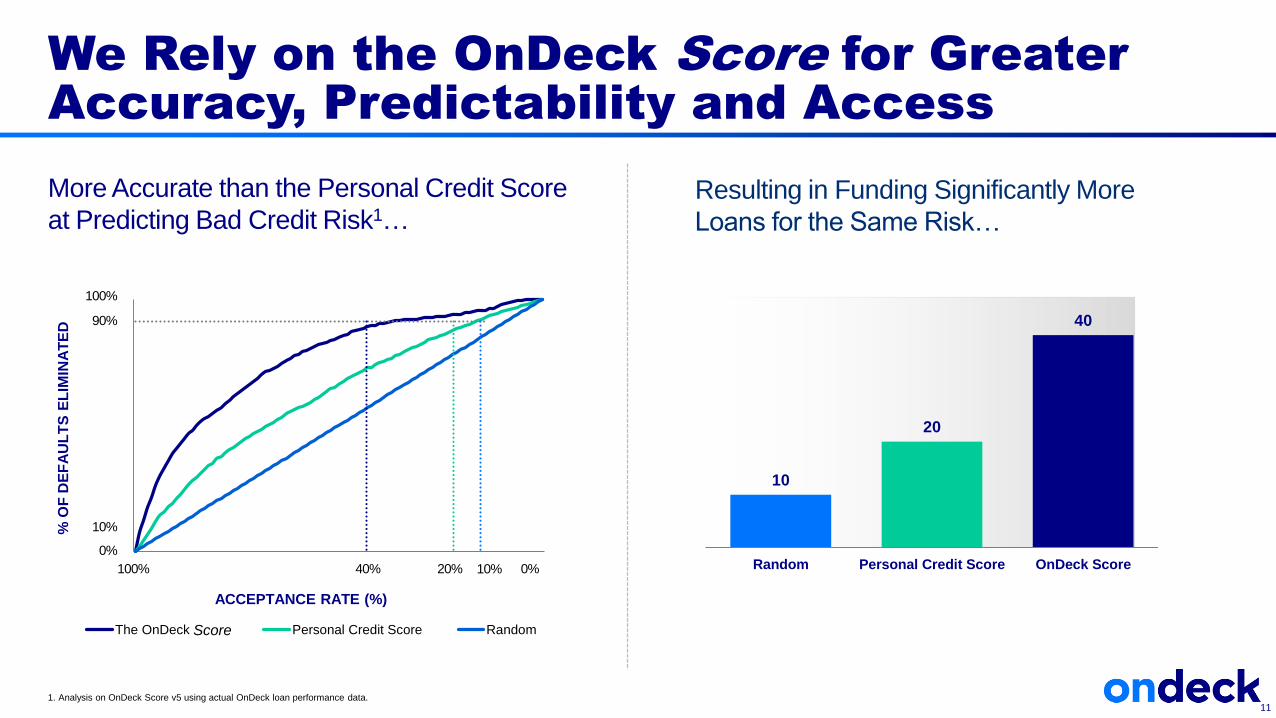
We Rely on the OnDeck Score for Greater
Accuracy, Predictability and Access
1. Analysis on OnDeck Score v5 using actual OnDeck loan performance data.11
10
20
40
Random Personal Credit Score OnDeck Score
More Accurate than the Personal Credit Score
at Predicting Bad Credit Risk1…Resulting in Funding Significantly More
Loans for the Same Risk…
ACCEPTANCE RATE (%)
The OnDeck Score Personal Credit Score Random
90%
100%
0%
100% 40% 20% 10% 0%
% O
F D
EF
AU
LT
S E
LIM
INA
TE
D
10%
Score
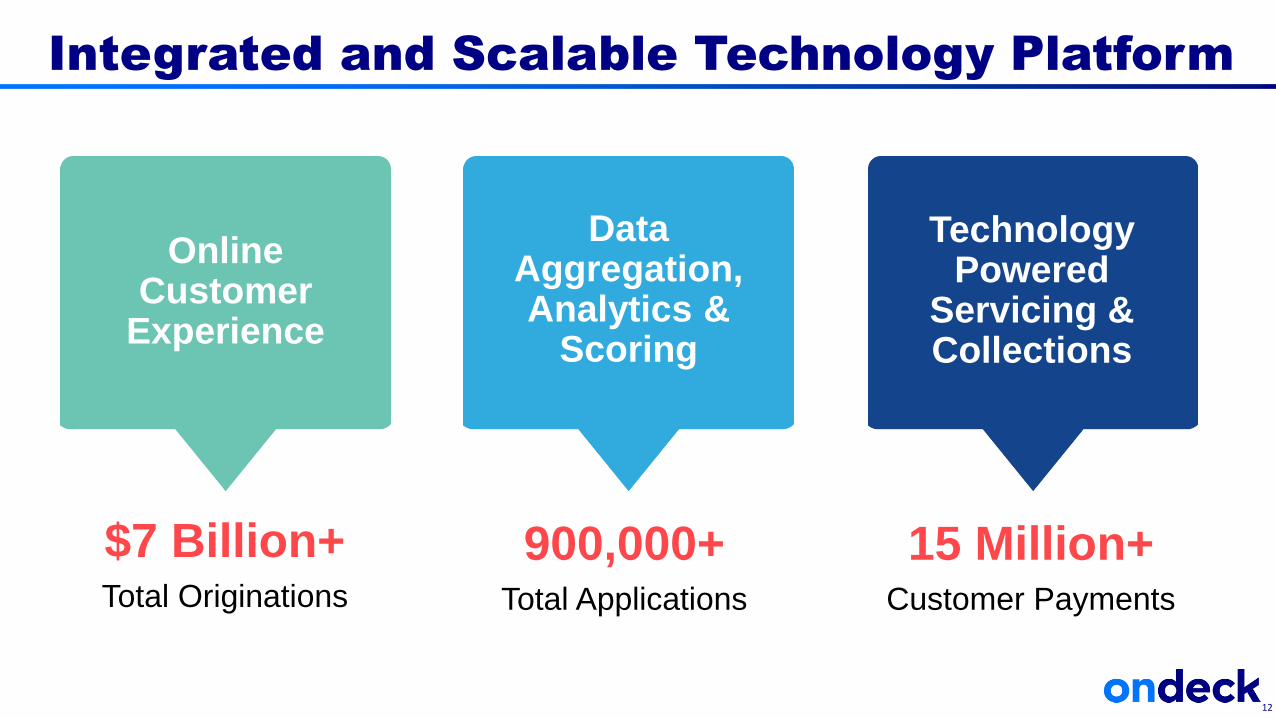
Online Customer
Experience
Integrated and Scalable Technology Platform
900,000+Total Applications
Data Aggregation, Analytics &
Scoring
15 Million+Customer Payments
Technology Powered
Servicing & Collections
12
$7 Billion+Total Originations
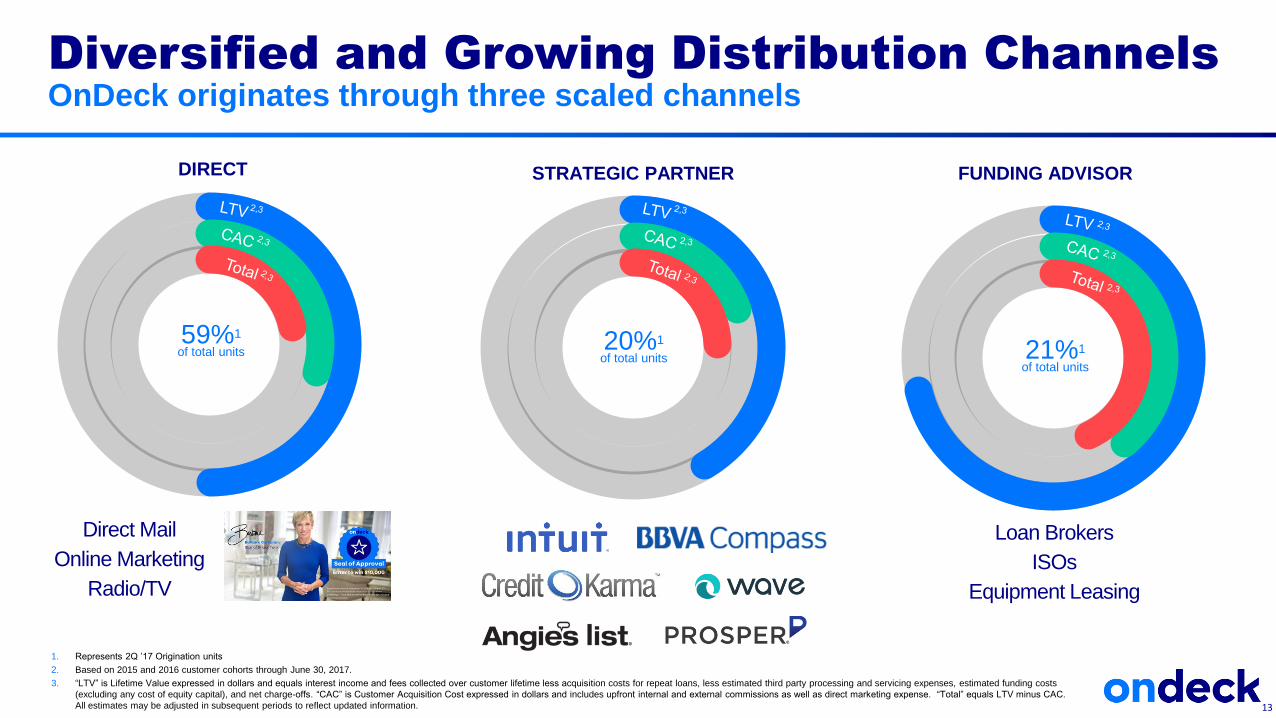
Diversified and Growing Distribution Channels
OnDeck originates through three scaled channels
1. Represents 2Q ’17 Origination units
2. Based on 2015 and 2016 customer cohorts through June 30, 2017.
3. “LTV” is Lifetime Value expressed in dollars and equals interest income and fees collected over customer lifetime less acquisition costs for repeat loans, less estimated third party processing and servicing expenses, estimated funding costs
(excluding any cost of equity capital), and net charge-offs. “CAC” is Customer Acquisition Cost expressed in dollars and includes upfront internal and external commissions as well as direct marketing expense. “Total” equals LTV minus CAC.
All estimates may be adjusted in subsequent periods to reflect updated information.
Direct Mail
Online Marketing
Radio/TV
Loan Brokers
ISOs
Equipment Leasing
DIRECT STRATEGIC PARTNER FUNDING ADVISOR
59%1
of total units20%1
of total units 21%1
of total units
13
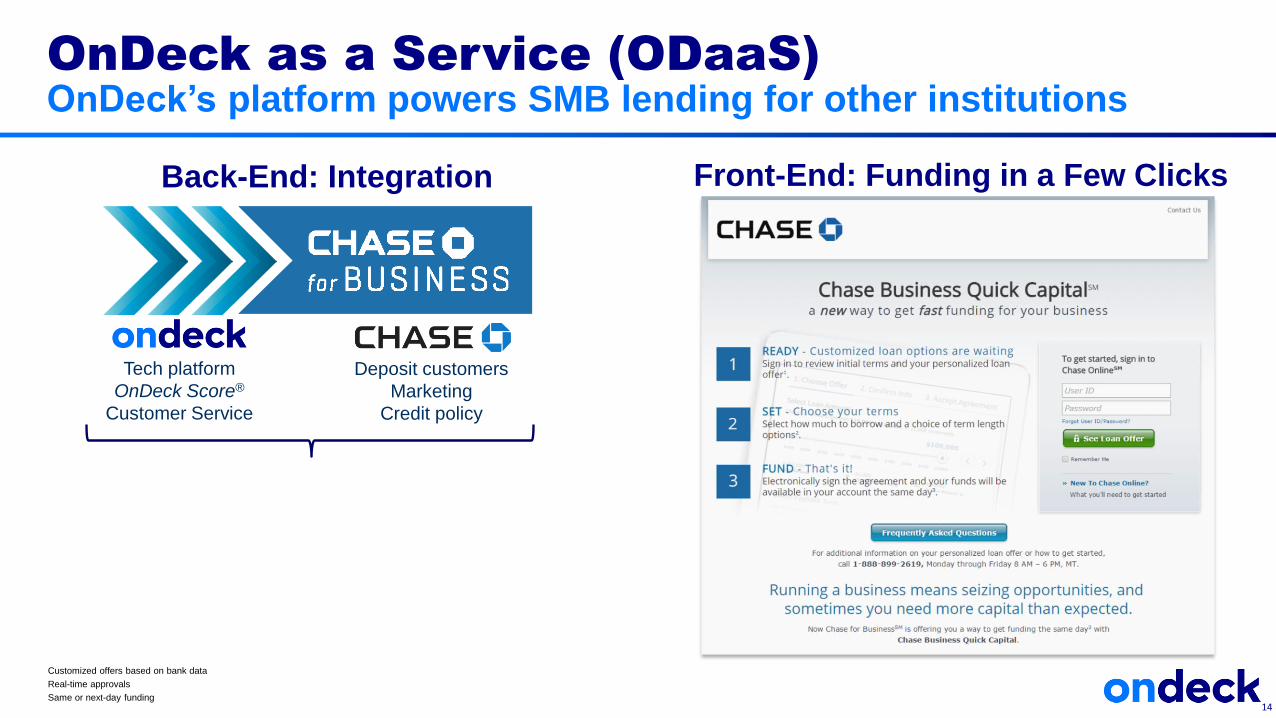
OnDeck as a Service (ODaaS)
OnDeck’s platform powers SMB lending for other institutions
Customized offers based on bank data
Real-time approvals
Same or next-day funding14
Deposit customers
Marketing
Credit policy
Tech platform
OnDeck Score®
Customer Service
Back-End: Integration Front-End: Funding in a Few Clicks
15
Strategic Priorities
Achieve profitability by YE 2017 and profitable growth in 2018 by:
• Growing responsibly
• Strengthening credit
• Improving operating leverage
• Diversifying funding
• Broadening product reach
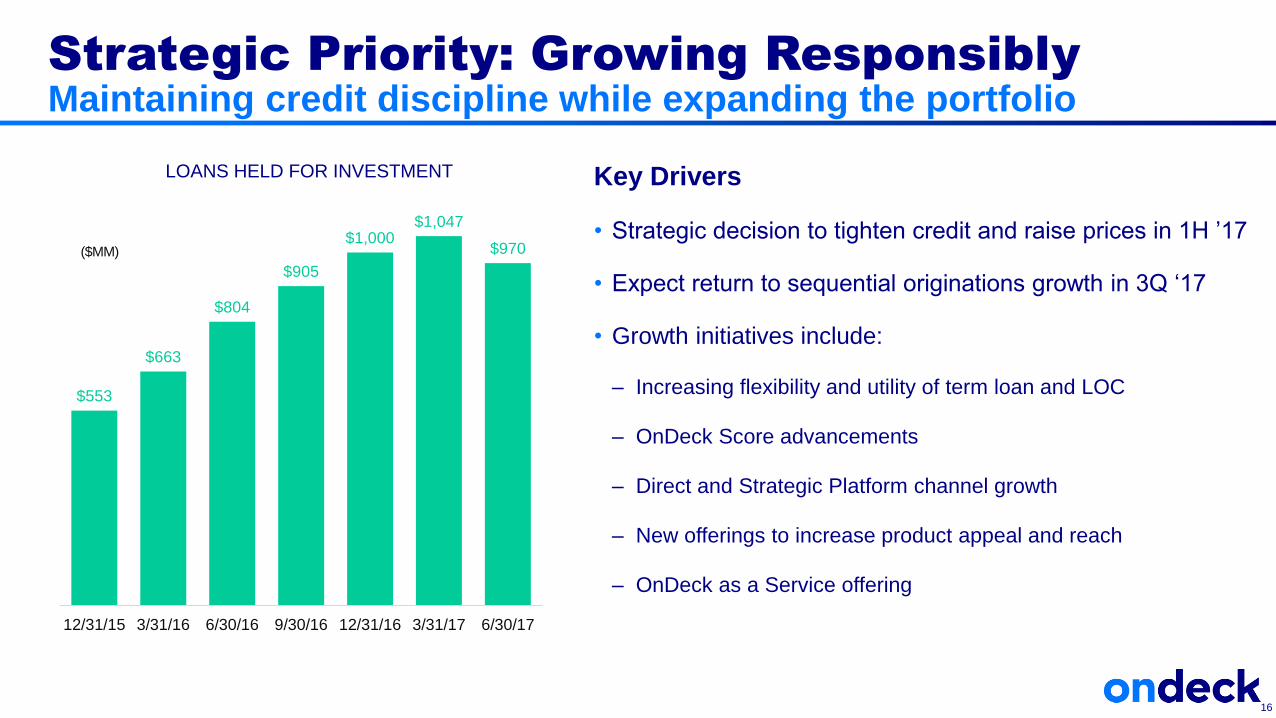
$553
$663
$804
$905
$1,000$1,047
$970
0
200
400
600
800
1000
1200
12/31/15 3/31/16 6/30/16 9/30/16 12/31/16 3/31/17 6/30/17
Strategic Priority: Growing Responsibly
Maintaining credit discipline while expanding the portfolio
16
LOANS HELD FOR INVESTMENT
($MM)
Key Drivers
• Strategic decision to tighten credit and raise prices in 1H ’17
• Expect return to sequential originations growth in 3Q ‘17
• Growth initiatives include:
– Increasing flexibility and utility of term loan and LOC
– OnDeck Score advancements
– Direct and Strategic Platform channel growth
– New offerings to increase product appeal and reach
– OnDeck as a Service offering
17
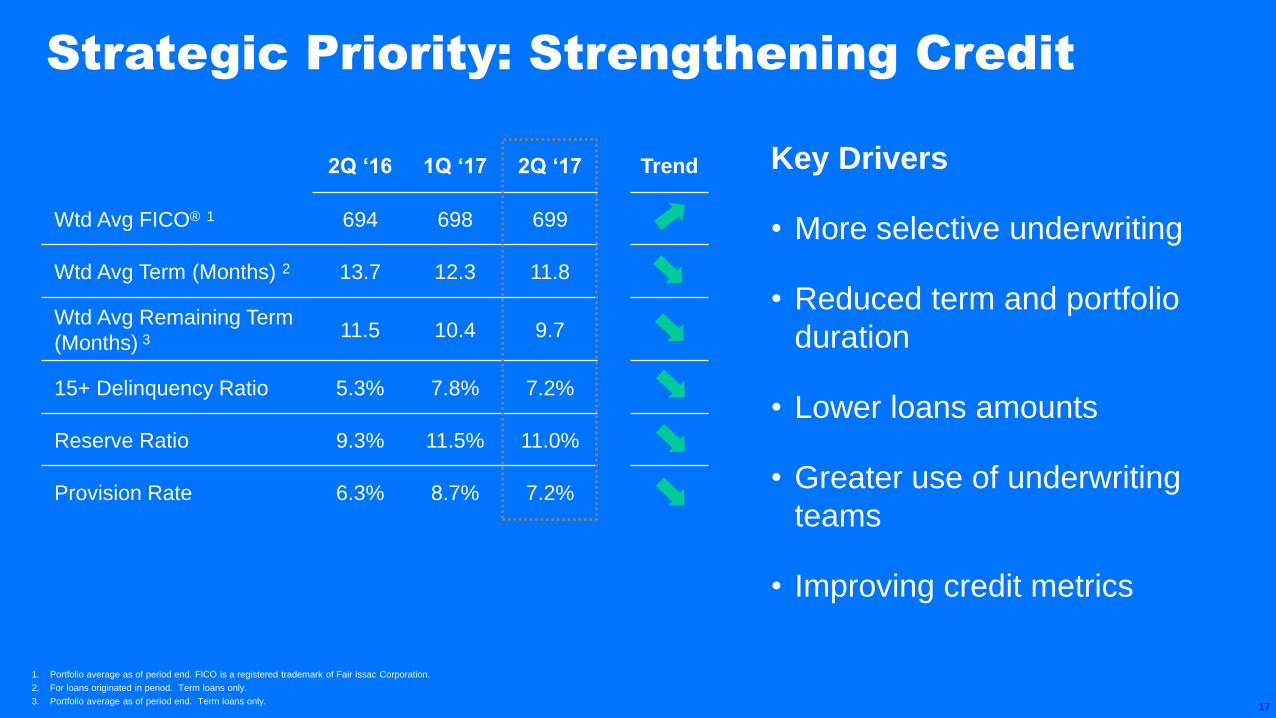
Key Drivers
• More selective underwriting
• Reduced term and portfolio
duration
• Lower loans amounts
• Greater use of underwriting
teams
• Improving credit metrics
2Q ‘16 1Q ‘17 2Q ‘17 Trend
Wtd Avg FICO® 1 694 698 699
Wtd Avg Term (Months) 2 13.7 12.3 11.8
Wtd Avg Remaining Term
(Months) 311.5 10.4 9.7
15+ Delinquency Ratio 5.3% 7.8% 7.2%
Reserve Ratio 9.3% 11.5% 11.0%
Provision Rate 6.3% 8.7% 7.2%
1. Portfolio average as of period end. FICO is a registered trademark of Fair Issac Corporation.
2. For loans originated in period. Term loans only.
3. Portfolio average as of period end. Term loans only.
Strategic Priority: Strengthening Credit
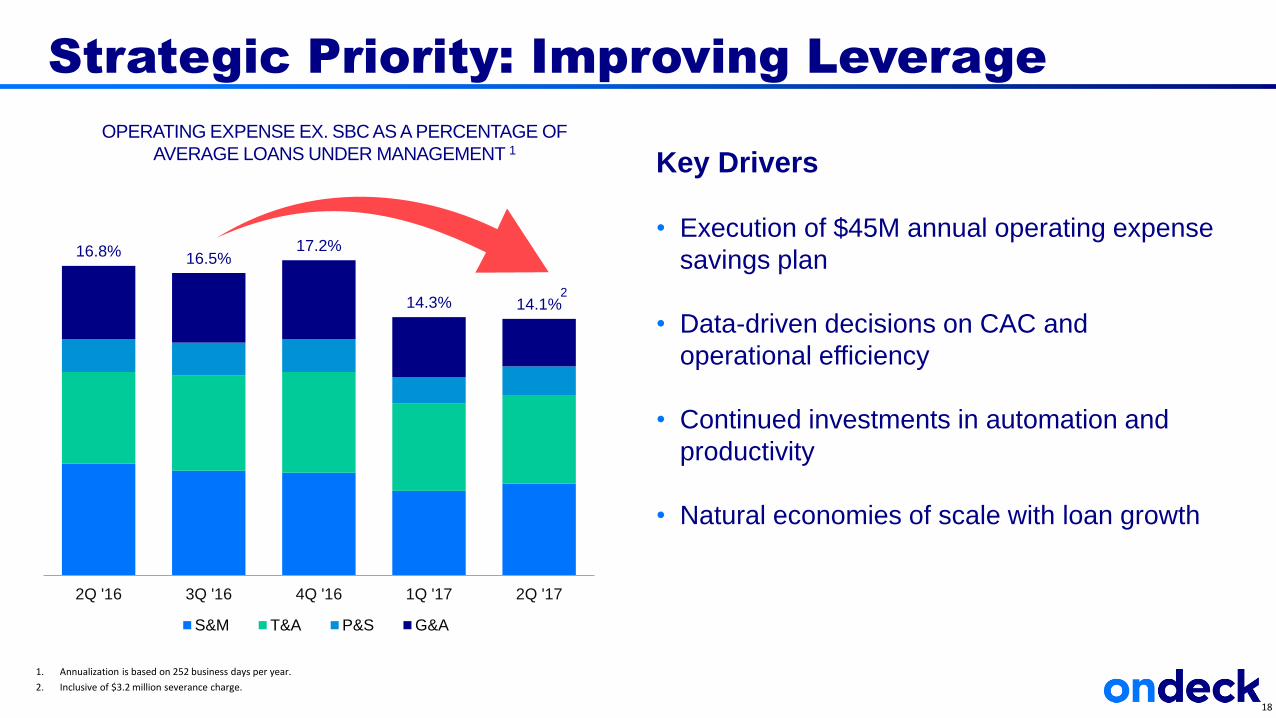
16.8% 16.5%17.2%
14.3% 14.1%
2Q '16 3Q '16 4Q '16 1Q '17 2Q '17
S&M T&A P&S G&A
Key Drivers
• Execution of $45M annual operating expense
savings plan
• Data-driven decisions on CAC and
operational efficiency
• Continued investments in automation and
productivity
• Natural economies of scale with loan growth
Strategic Priority: Improving Leverage
18
OPERATING EXPENSE EX. SBC AS A PERCENTAGE OF
AVERAGE LOANS UNDER MANAGEMENT 1
1. Annualization is based on 252 business days per year.
2. Inclusive of $3.2 million severance charge.
2
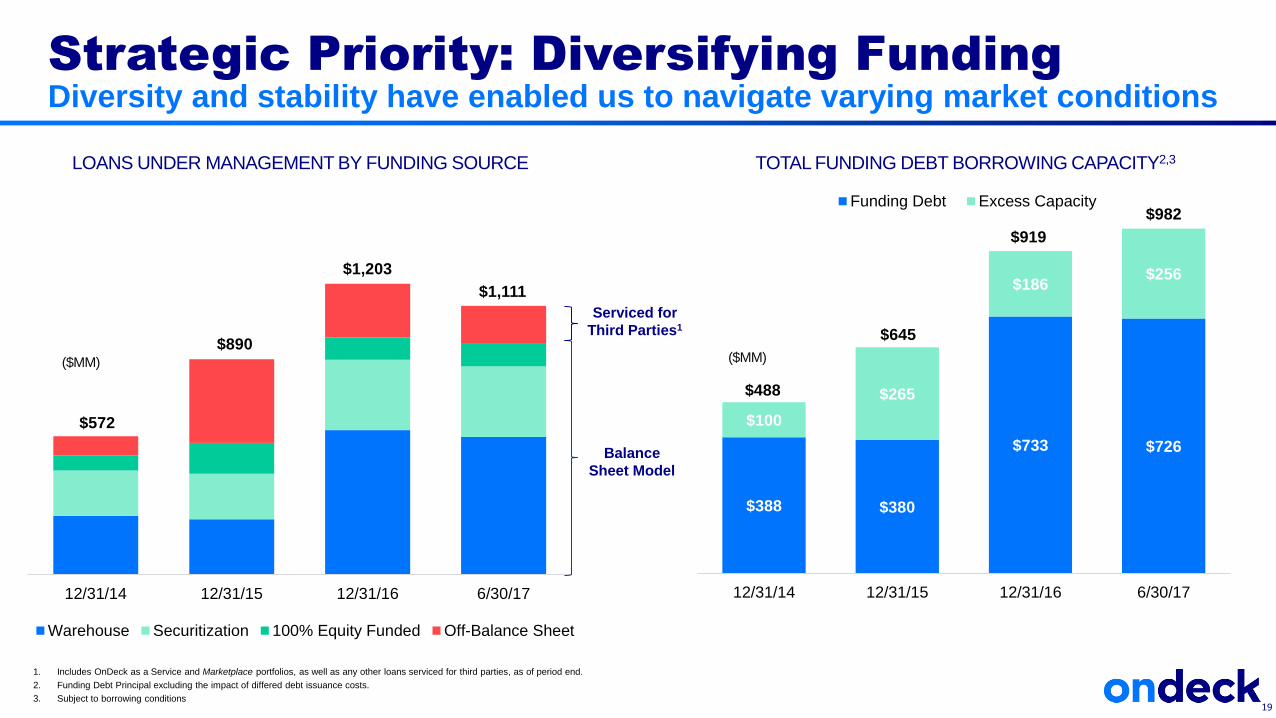
12/31/14 12/31/15 12/31/16 6/30/17
Warehouse Securitization 100% Equity Funded Off-Balance Sheet
$388 $380
$733 $726
$100
$265
$186$256
12/31/14 12/31/15 12/31/16 6/30/17
Funding Debt Excess Capacity
Serviced for
Third Parties1
Balance
Sheet Model
Strategic Priority: Diversifying Funding
Diversity and stability have enabled us to navigate varying market conditions
19
LOANS UNDER MANAGEMENT BY FUNDING SOURCE TOTAL FUNDING DEBT BORROWING CAPACITY2,3
$572
$890
$1,203
$1,111
1. Includes OnDeck as a Service and Marketplace portfolios, as well as any other loans serviced for third parties, as of period end.
2. Funding Debt Principal excluding the impact of differed debt issuance costs.
3. Subject to borrowing conditions
$488
$645
$919
$982
($MM) ($MM)
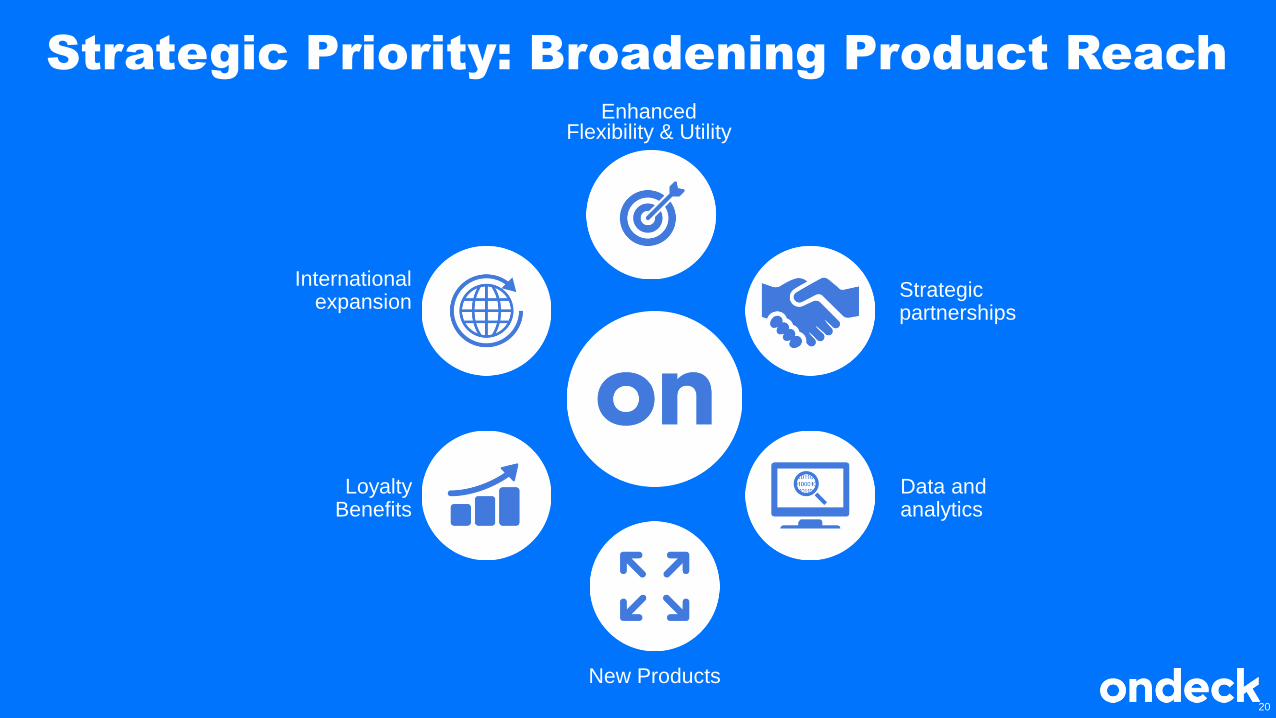
Enhanced Flexibility & Utility
Strategic partnerships
Data and analytics
New Products
Loyalty Benefits
International expansion
20
Strategic Priority: Broadening Product Reach
• Improving bottom line performance
• Attractive loan portfolio characteristics
• Compelling customer lifetime value
• Substantial lending spreads
• Inherent operating leverage
• GAAP profitable by end of year 2017
21
Financial Highlights
22
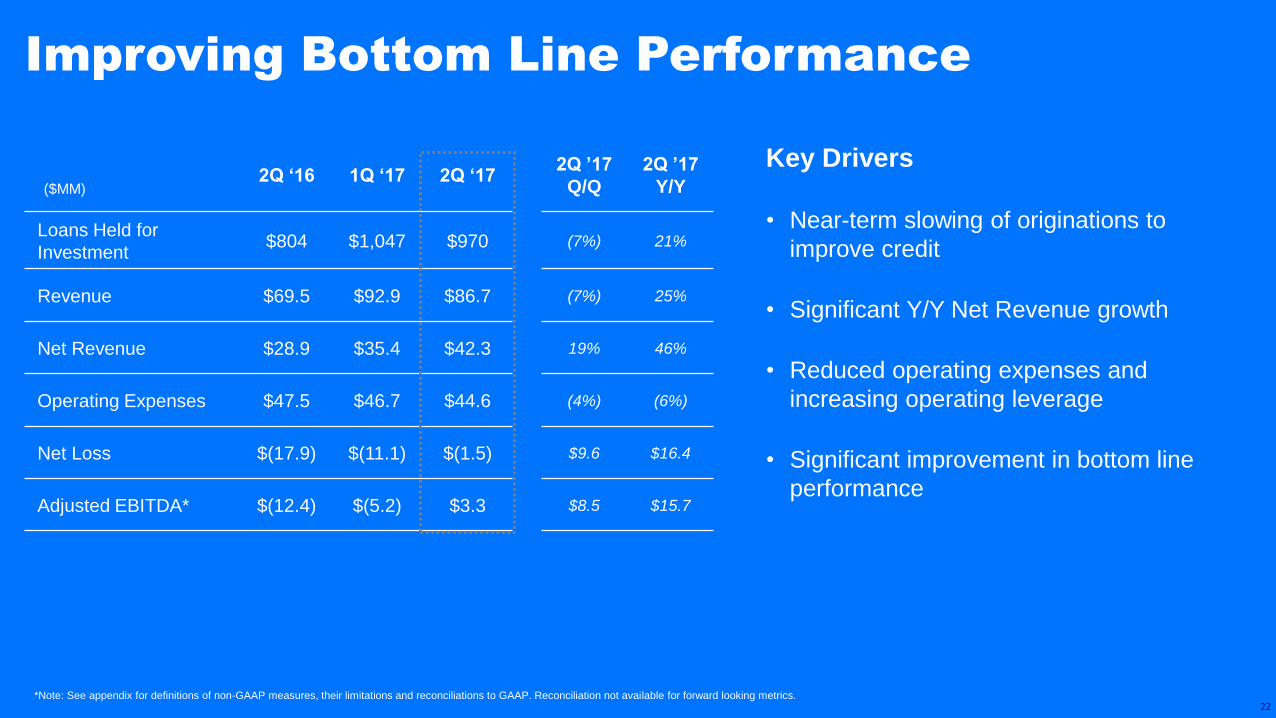
Improving Bottom Line Performance
Key Drivers
• Near-term slowing of originations to
improve credit
• Significant Y/Y Net Revenue growth
• Reduced operating expenses and
increasing operating leverage
• Significant improvement in bottom line
performance
($MM)2Q ‘16 1Q ‘17 2Q ‘17
2Q ’17
Q/Q
2Q ’17
Y/Y
Loans Held for
Investment$804 $1,047 $970 (7%) 21%
Revenue $69.5 $92.9 $86.7 (7%) 25%
Net Revenue $28.9 $35.4 $42.3 19% 46%
Operating Expenses $47.5 $46.7 $44.6 (4%) (6%)
Net Loss $(17.9) $(11.1) $(1.5) $9.6 $16.4
Adjusted EBITDA* $(12.4) $(5.2) $3.3 $8.5 $15.7
*Note: See appendix for definitions of non-GAAP measures, their limitations and reconciliations to GAAP. Reconciliation not available for forward looking metrics.
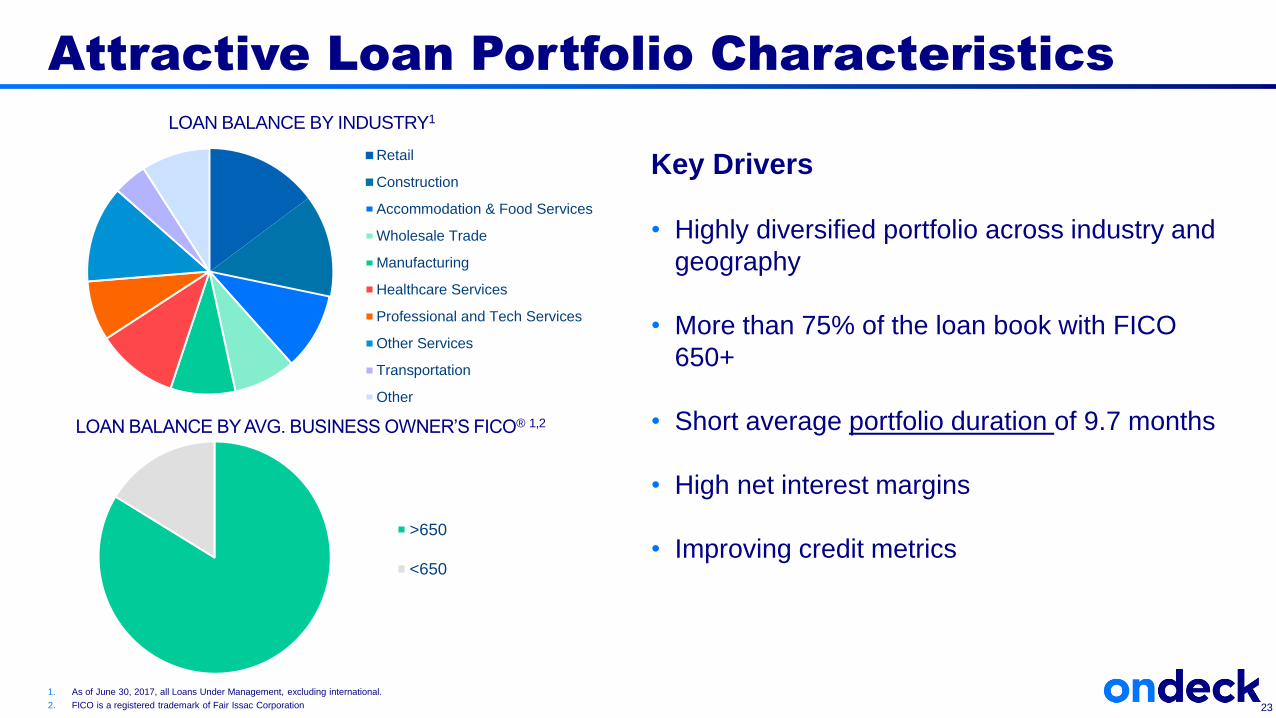
Attractive Loan Portfolio Characteristics
LOAN BALANCE BY INDUSTRY1
LOAN BALANCE BY AVG. BUSINESS OWNER’S FICO® 1,2
Key Drivers
• Highly diversified portfolio across industry and
geography
• More than 75% of the loan book with FICO
650+
• Short average portfolio duration of 9.7 months
• High net interest margins
• Improving credit metrics>650
<650
Retail
Construction
Accommodation & Food Services
Wholesale Trade
Manufacturing
Healthcare Services
Professional and Tech Services
Other Services
Transportation
Other
1. As of June 30, 2017, all Loans Under Management, excluding international.
2. FICO is a registered trademark of Fair Issac Corporation. 23
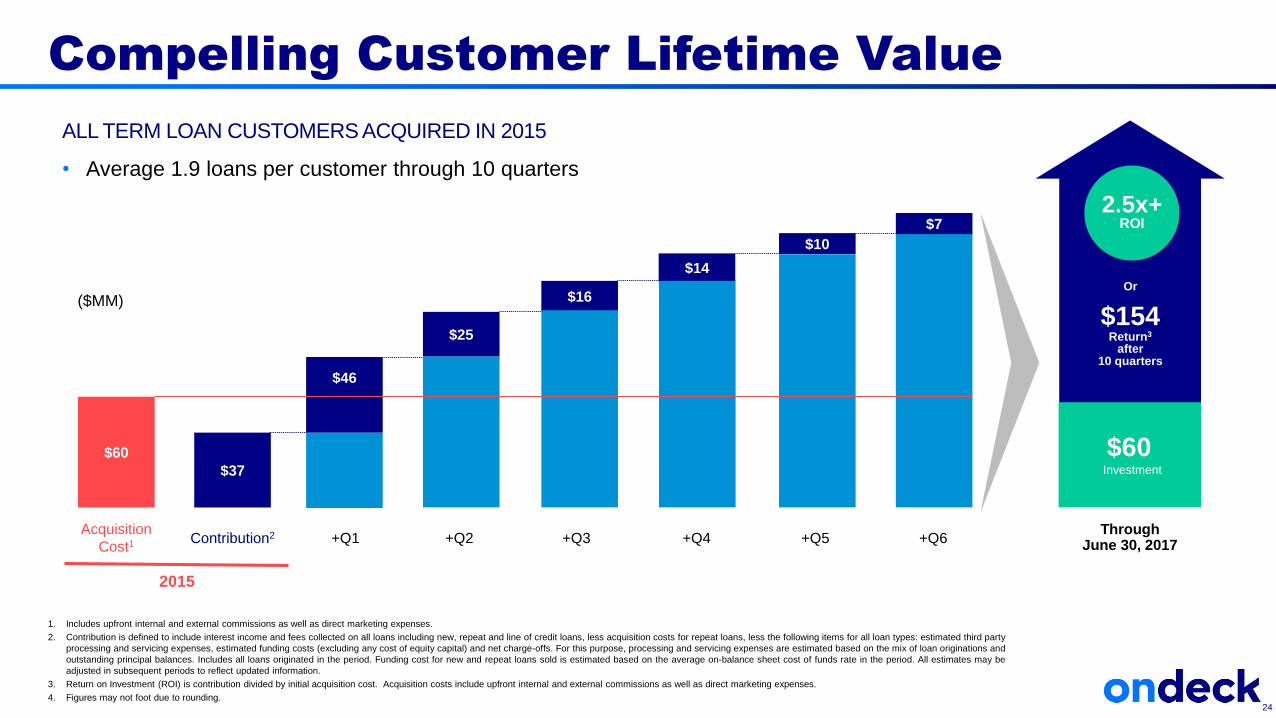
Compelling Customer Lifetime Value
1. Includes upfront internal and external commissions as well as direct marketing expenses.
2. Contribution is defined to include interest income and fees collected on all loans including new, repeat and line of credit loans, less acquisition costs for repeat loans, less the following items for all loan types: estimated third party
processing and servicing expenses, estimated funding costs (excluding any cost of equity capital) and net charge-offs. For this purpose, processing and servicing expenses are estimated based on the mix of loan originations and
outstanding principal balances. Includes all loans originated in the period. Funding cost for new and repeat loans sold is estimated based on the average on-balance sheet cost of funds rate in the period. All estimates may be
adjusted in subsequent periods to reflect updated information.
3. Return on Investment (ROI) is contribution divided by initial acquisition cost. Acquisition costs include upfront internal and external commissions as well as direct marketing expenses.
4. Figures may not foot due to rounding.24
ALL TERM LOAN CUSTOMERS ACQUIRED IN 2015
• Average 1.9 loans per customer through 10 quarters
Or
$154Return3
after 10 quarters
$60Investment
2.5x+ROI
($MM)
2015
$60
$37
$25
Acquisition
Cost1Contribution2 +Q1 +Q2
$46
Through June 30, 2017
$16
+Q3
$14
+Q4
$10
+Q5
$7
+Q6
25
19% 19%
15% 15%
11%
33% 33% 33% 34%33%
40%42% 43% 44% 43%
30% 29% 29%30%
29%
--
0.1%
0.1%
0.2%
0.2%
0.3%
0.3%
0.4%
0.4%
0.5%
0.05
0.1
0.15
0.2
0.25
0.3
2Q '16 3Q '16 4Q '16 1Q '17 2Q '17
Net Interest Margin After Losses Effective Interest Yield
Weighted Average APR Net Interest Margin
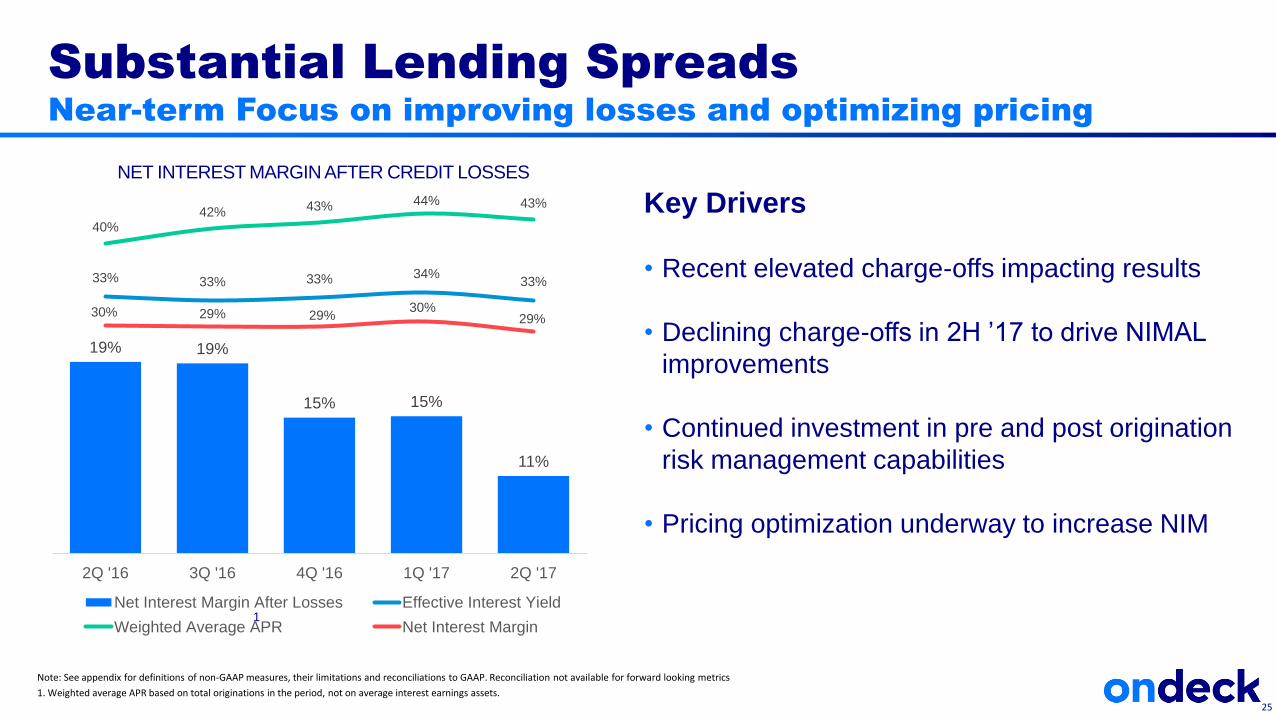
Substantial Lending Spreads
Near-term Focus on improving losses and optimizing pricing
Key Drivers
• Recent elevated charge-offs impacting results
• Declining charge-offs in 2H ’17 to drive NIMAL
improvements
• Continued investment in pre and post origination
risk management capabilities
• Pricing optimization underway to increase NIM
NET INTEREST MARGIN AFTER CREDIT LOSSES
Note: See appendix for definitions of non-GAAP measures, their limitations and reconciliations to GAAP. Reconciliation not available for forward looking metrics
1. Weighted average APR based on total originations in the period, not on average interest earnings assets.
1
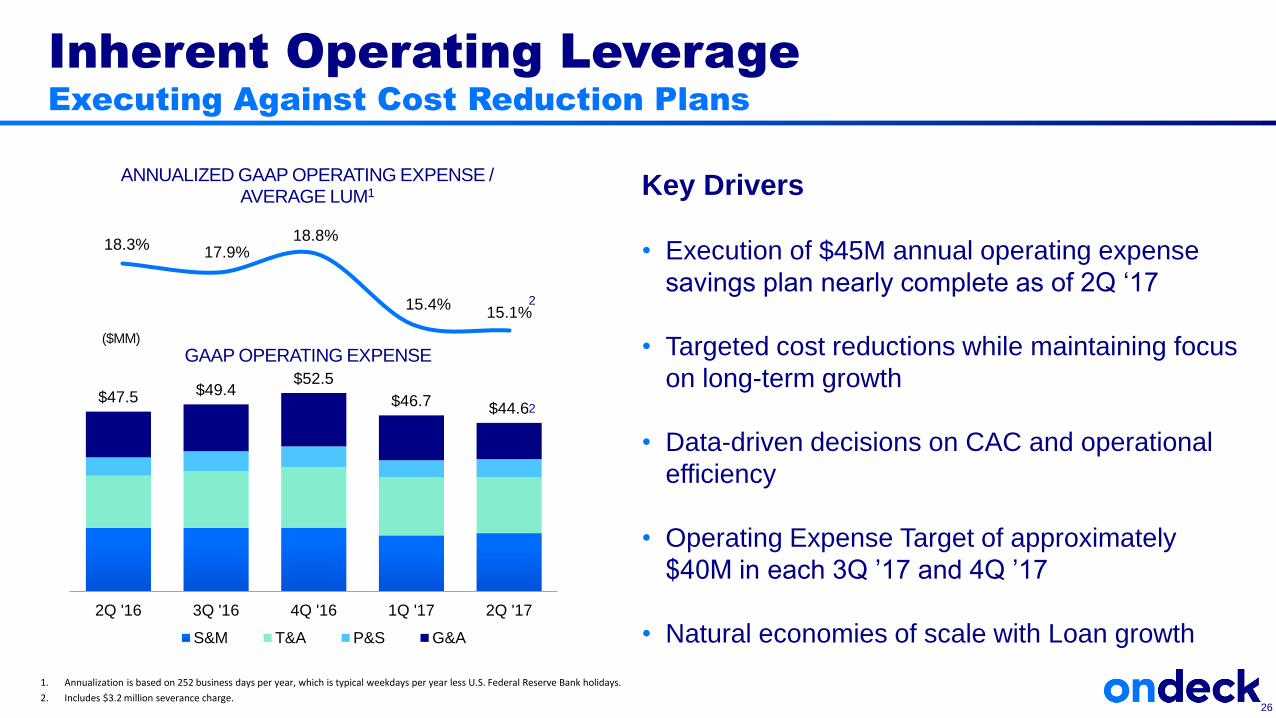
18.3%17.9%
18.8%
15.4%15.1%
ANNUALIZED GAAP OPERATING EXPENSE / AVERAGE LUM1 Key Drivers
• Execution of $45M annual operating expense
savings plan nearly complete as of 2Q ‘17
• Targeted cost reductions while maintaining focus
on long-term growth
• Data-driven decisions on CAC and operational
efficiency
• Operating Expense Target of approximately
$40M in each 3Q ’17 and 4Q ’17
• Natural economies of scale with Loan growth
1. Annualization is based on 252 business days per year, which is typical weekdays per year less U.S. Federal Reserve Bank holidays.
2. Includes $3.2 million severance charge.
$47.5 $49.4$52.5
$46.7$44.6
2Q '16 3Q '16 4Q '16 1Q '17 2Q '17
GAAP OPERATING EXPENSE
S&M T&A P&S G&A
Inherent Operating Leverage
Executing Against Cost Reduction Plans
($MM)
2
2
26
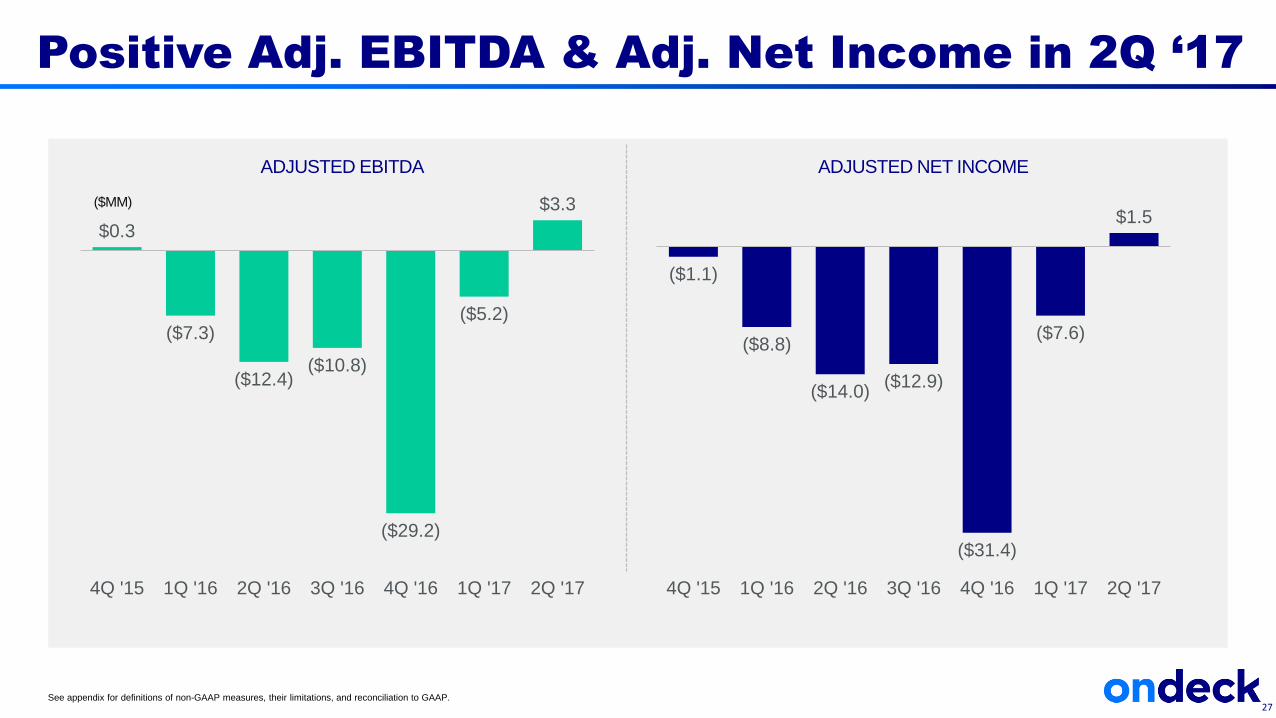
Positive Adj. EBITDA & Adj. Net Income in 2Q ‘17
See appendix for definitions of non-GAAP measures, their limitations, and reconciliation to GAAP.
$0.3
($7.3)
($12.4)($10.8)
($29.2)
($5.2)
$3.3
4Q '15 1Q '16 2Q '16 3Q '16 4Q '16 1Q '17 2Q '17
($MM)
($1.1)
($8.8)
($14.0)($12.9)
($31.4)
($7.6)
$1.5
4Q '15 1Q '16 2Q '16 3Q '16 4Q '16 1Q '17 2Q '17
ADJUSTED EBITDA ADJUSTED NET INCOME
27
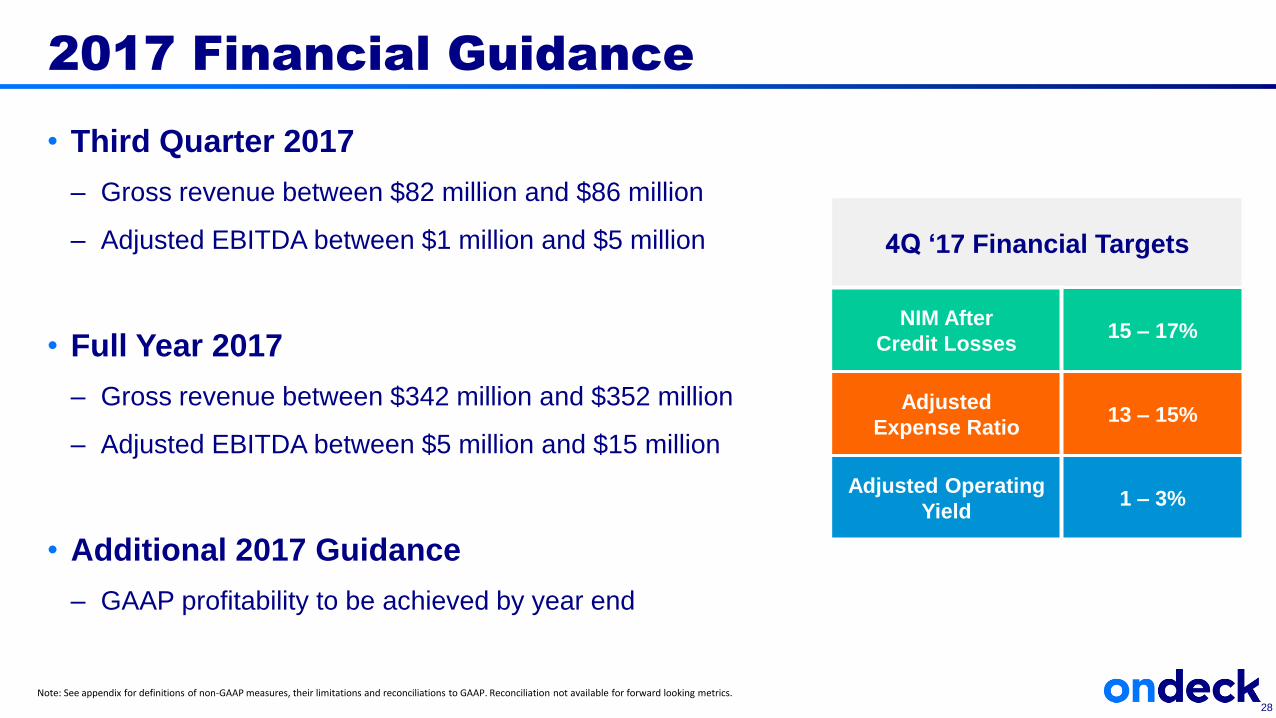
2017 Financial Guidance
• Third Quarter 2017
– Gross revenue between $82 million and $86 million
– Adjusted EBITDA between $1 million and $5 million
• Full Year 2017
– Gross revenue between $342 million and $352 million
– Adjusted EBITDA between $5 million and $15 million
• Additional 2017 Guidance
– GAAP profitability to be achieved by year end
4Q ‘17 Financial Targets
NIM After
Credit Losses15 – 17%
Adjusted
Expense Ratio13 – 15%
Adjusted Operating
Yield1 – 3%
Note: See appendix for definitions of non-GAAP measures, their limitations and reconciliations to GAAP. Reconciliation not available for forward looking metrics.
28

Appendix
29
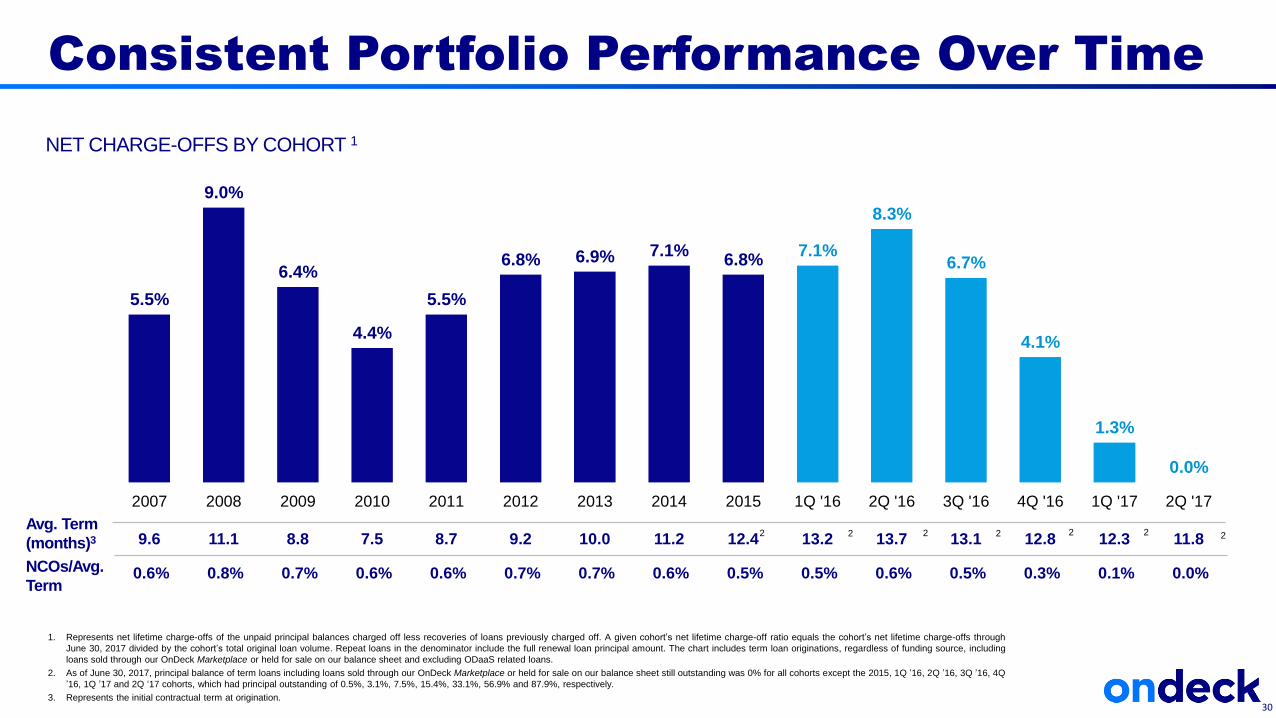
5.5%
9.0%
6.4%
4.4%
5.5%
6.8% 6.9% 7.1%6.8%
7.1%
8.3%
6.7%
4.1%
1.3%
0.0%
2007 2008 2009 2010 2011 2012 2013 2014 2015 1Q '16 2Q '16 3Q '16 4Q '16 1Q '17 2Q '17
2 2 2 2 2
Consistent Portfolio Performance Over Time
1. Represents net lifetime charge-offs of the unpaid principal balances charged off less recoveries of loans previously charged off. A given cohort’s net lifetime charge-off ratio equals the cohort’s net lifetime charge-offs through
June 30, 2017 divided by the cohort’s total original loan volume. Repeat loans in the denominator include the full renewal loan principal amount. The chart includes term loan originations, regardless of funding source, including
loans sold through our OnDeck Marketplace or held for sale on our balance sheet and excluding ODaaS related loans.
2. As of June 30, 2017, principal balance of term loans including loans sold through our OnDeck Marketplace or held for sale on our balance sheet still outstanding was 0% for all cohorts except the 2015, 1Q ’16, 2Q ’16, 3Q ’16, 4Q
’16, 1Q ’17 and 2Q ‘17 cohorts, which had principal outstanding of 0.5%, 3.1%, 7.5%, 15.4%, 33.1%, 56.9% and 87.9%, respectively.
3. Represents the initial contractual term at origination.
NET CHARGE-OFFS BY COHORT 1
9.6 11.1 8.8 7.5 8.7 9.2 10.0 11.2 12.4 13.2 13.7 13.1 12.8 12.3 11.8Avg. Term
(months)32 2
0.6% 0.8% 0.7% 0.6% 0.6% 0.7% 0.7% 0.6% 0.5% 0.5% 0.6% 0.5% 0.3% 0.1% 0.0%NCOs/Avg.
Term
30
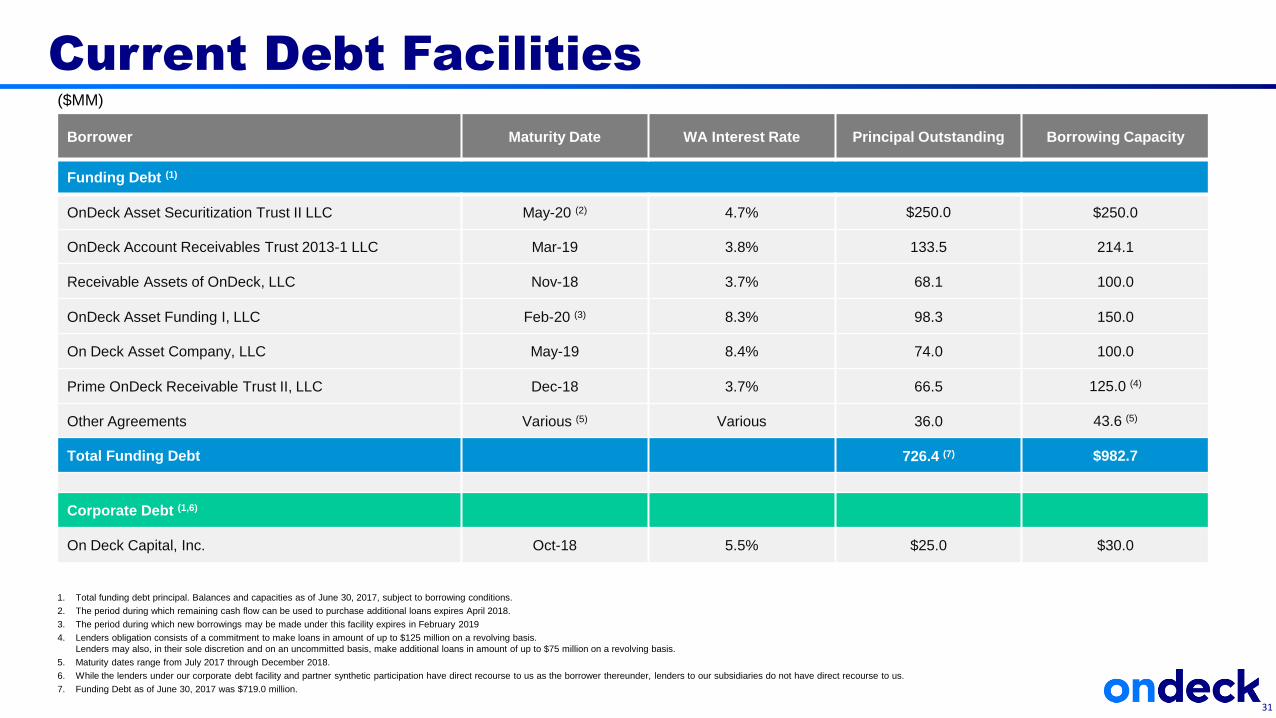
Current Debt Facilities
1. Total funding debt principal. Balances and capacities as of June 30, 2017, subject to borrowing conditions.
2. The period during which remaining cash flow can be used to purchase additional loans expires April 2018.
3. The period during which new borrowings may be made under this facility expires in February 2019
4. Lenders obligation consists of a commitment to make loans in amount of up to $125 million on a revolving basis.
Lenders may also, in their sole discretion and on an uncommitted basis, make additional loans in amount of up to $75 million on a revolving basis.
5. Maturity dates range from July 2017 through December 2018.
6. While the lenders under our corporate debt facility and partner synthetic participation have direct recourse to us as the borrower thereunder, lenders to our subsidiaries do not have direct recourse to us.
7. Funding Debt as of June 30, 2017 was $719.0 million.
Borrower Maturity Date WA Interest Rate Principal Outstanding Borrowing Capacity
Funding Debt (1)
OnDeck Asset Securitization Trust II LLC May-20 (2) 4.7% $250.0 $250.0
OnDeck Account Receivables Trust 2013-1 LLC Mar-19 3.8% 133.5 214.1
Receivable Assets of OnDeck, LLC Nov-18 3.7% 68.1 100.0
OnDeck Asset Funding I, LLC Feb-20 (3) 8.3% 98.3 150.0
On Deck Asset Company, LLC May-19 8.4% 74.0 100.0
Prime OnDeck Receivable Trust II, LLC Dec-18 3.7% 66.5 125.0 (4)
Other Agreements Various (5) Various 36.0 43.6 (5)
Total Funding Debt 726.4 (7) $982.7
Corporate Debt (1,6)
On Deck Capital, Inc. Oct-18 5.5% $25.0 $30.0
31
($MM)
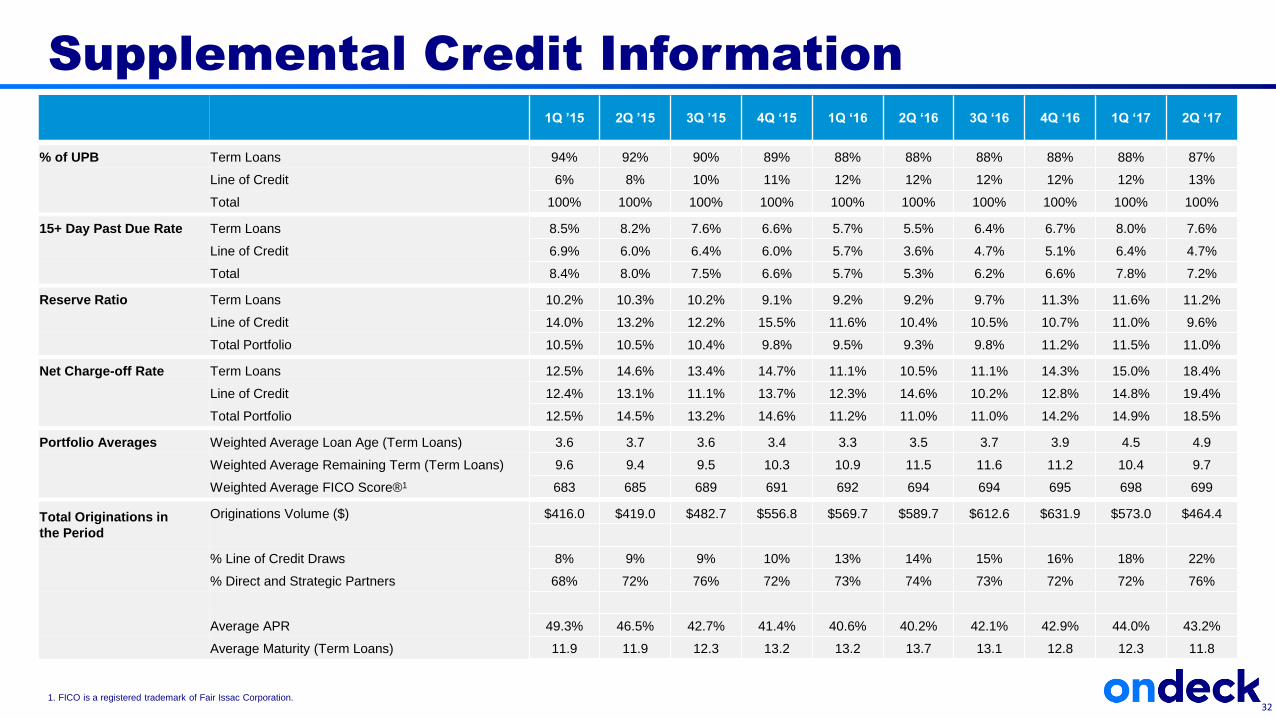
Supplemental Credit Information
1. FICO is a registered trademark of Fair Issac Corporation.32
1Q ’15 2Q ’15 3Q ’15 4Q ‘15 1Q ‘16 2Q ‘16 3Q ‘16 4Q ‘16 1Q ‘17 2Q ‘17
% of UPB Term Loans 94% 92% 90% 89% 88% 88% 88% 88% 88% 87%
Line of Credit 6% 8% 10% 11% 12% 12% 12% 12% 12% 13%
Total 100% 100% 100% 100% 100% 100% 100% 100% 100% 100%
15+ Day Past Due Rate Term Loans 8.5% 8.2% 7.6% 6.6% 5.7% 5.5% 6.4% 6.7% 8.0% 7.6%
Line of Credit 6.9% 6.0% 6.4% 6.0% 5.7% 3.6% 4.7% 5.1% 6.4% 4.7%
Total 8.4% 8.0% 7.5% 6.6% 5.7% 5.3% 6.2% 6.6% 7.8% 7.2%
Reserve Ratio Term Loans 10.2% 10.3% 10.2% 9.1% 9.2% 9.2% 9.7% 11.3% 11.6% 11.2%
Line of Credit 14.0% 13.2% 12.2% 15.5% 11.6% 10.4% 10.5% 10.7% 11.0% 9.6%
Total Portfolio 10.5% 10.5% 10.4% 9.8% 9.5% 9.3% 9.8% 11.2% 11.5% 11.0%
Net Charge-off Rate Term Loans 12.5% 14.6% 13.4% 14.7% 11.1% 10.5% 11.1% 14.3% 15.0% 18.4%
Line of Credit 12.4% 13.1% 11.1% 13.7% 12.3% 14.6% 10.2% 12.8% 14.8% 19.4%
Total Portfolio 12.5% 14.5% 13.2% 14.6% 11.2% 11.0% 11.0% 14.2% 14.9% 18.5%
Portfolio Averages Weighted Average Loan Age (Term Loans) 3.6 3.7 3.6 3.4 3.3 3.5 3.7 3.9 4.5 4.9
Weighted Average Remaining Term (Term Loans) 9.6 9.4 9.5 10.3 10.9 11.5 11.6 11.2 10.4 9.7
Weighted Average FICO Score®1 683 685 689 691 692 694 694 695 698 699
Total Originations in
the Period
Originations Volume ($) $416.0 $419.0 $482.7 $556.8 $569.7 $589.7 $612.6 $631.9 $573.0 $464.4
% Line of Credit Draws 8% 9% 9% 10% 13% 14% 15% 16% 18% 22%
% Direct and Strategic Partners 68% 72% 76% 72% 73% 74% 73% 72% 72% 76%
Average APR 49.3% 46.5% 42.7% 41.4% 40.6% 40.2% 42.1% 42.9% 44.0% 43.2%
Average Maturity (Term Loans) 11.9 11.9 12.3 13.2 13.2 13.7 13.1 12.8 12.3 11.8
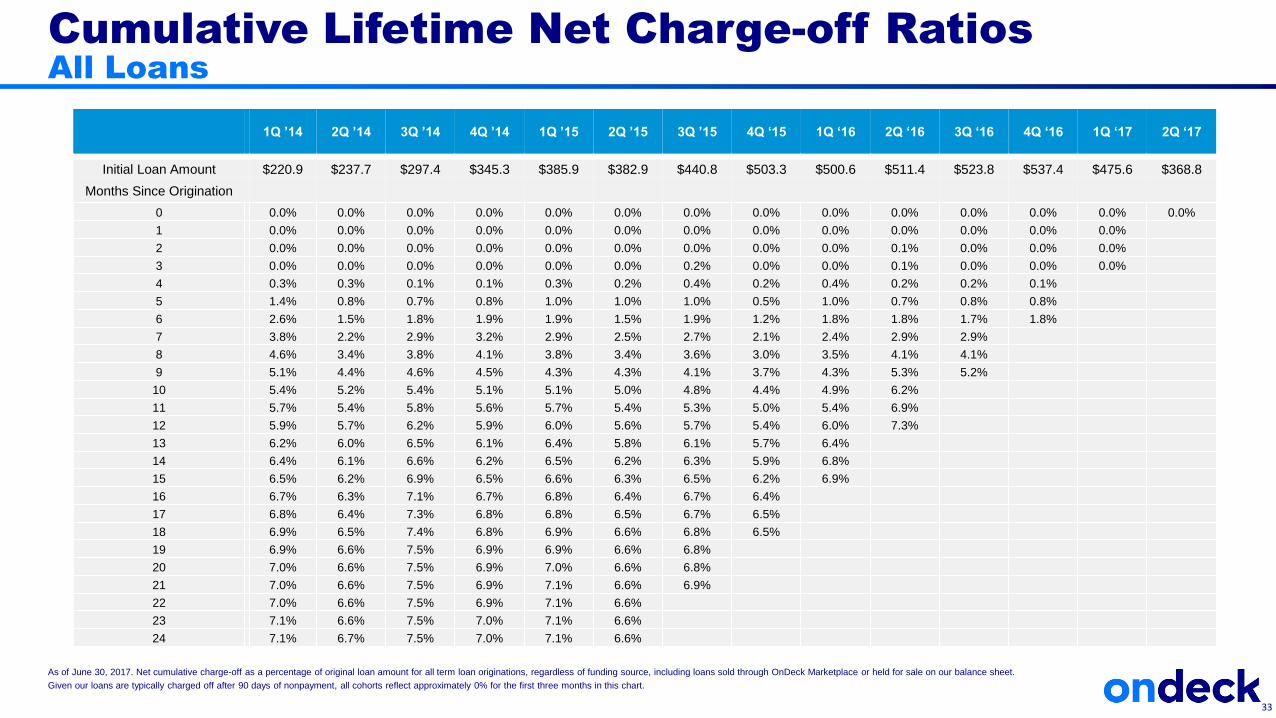
Cumulative Lifetime Net Charge-off Ratios
All Loans
As of June 30, 2017. Net cumulative charge-off as a percentage of original loan amount for all term loan originations, regardless of funding source, including loans sold through OnDeck Marketplace or held for sale on our balance sheet.
Given our loans are typically charged off after 90 days of nonpayment, all cohorts reflect approximately 0% for the first three months in this chart.
33
1Q ’14 2Q ’14 3Q ’14 4Q ’14 1Q ’15 2Q ’15 3Q ’15 4Q ‘15 1Q ‘16 2Q ‘16 3Q ‘16 4Q ‘16 1Q ‘17 2Q ‘17
Initial Loan Amount $220.9 $237.7 $297.4 $345.3 $385.9 $382.9 $440.8 $503.3 $500.6 $511.4 $523.8 $537.4 $475.6 $368.8
Months Since Origination
0 0.0% 0.0% 0.0% 0.0% 0.0% 0.0% 0.0% 0.0% 0.0% 0.0% 0.0% 0.0% 0.0% 0.0%
1 0.0% 0.0% 0.0% 0.0% 0.0% 0.0% 0.0% 0.0% 0.0% 0.0% 0.0% 0.0% 0.0%
2 0.0% 0.0% 0.0% 0.0% 0.0% 0.0% 0.0% 0.0% 0.0% 0.1% 0.0% 0.0% 0.0%
3 0.0% 0.0% 0.0% 0.0% 0.0% 0.0% 0.2% 0.0% 0.0% 0.1% 0.0% 0.0% 0.0%
4 0.3% 0.3% 0.1% 0.1% 0.3% 0.2% 0.4% 0.2% 0.4% 0.2% 0.2% 0.1%
5 1.4% 0.8% 0.7% 0.8% 1.0% 1.0% 1.0% 0.5% 1.0% 0.7% 0.8% 0.8%
6 2.6% 1.5% 1.8% 1.9% 1.9% 1.5% 1.9% 1.2% 1.8% 1.8% 1.7% 1.8%
7 3.8% 2.2% 2.9% 3.2% 2.9% 2.5% 2.7% 2.1% 2.4% 2.9% 2.9%
8 4.6% 3.4% 3.8% 4.1% 3.8% 3.4% 3.6% 3.0% 3.5% 4.1% 4.1%
9 5.1% 4.4% 4.6% 4.5% 4.3% 4.3% 4.1% 3.7% 4.3% 5.3% 5.2%
10 5.4% 5.2% 5.4% 5.1% 5.1% 5.0% 4.8% 4.4% 4.9% 6.2%
11 5.7% 5.4% 5.8% 5.6% 5.7% 5.4% 5.3% 5.0% 5.4% 6.9%
12 5.9% 5.7% 6.2% 5.9% 6.0% 5.6% 5.7% 5.4% 6.0% 7.3%
13 6.2% 6.0% 6.5% 6.1% 6.4% 5.8% 6.1% 5.7% 6.4%
14 6.4% 6.1% 6.6% 6.2% 6.5% 6.2% 6.3% 5.9% 6.8%
15 6.5% 6.2% 6.9% 6.5% 6.6% 6.3% 6.5% 6.2% 6.9%
16 6.7% 6.3% 7.1% 6.7% 6.8% 6.4% 6.7% 6.4%
17 6.8% 6.4% 7.3% 6.8% 6.8% 6.5% 6.7% 6.5%
18 6.9% 6.5% 7.4% 6.8% 6.9% 6.6% 6.8% 6.5%
19 6.9% 6.6% 7.5% 6.9% 6.9% 6.6% 6.8%
20 7.0% 6.6% 7.5% 6.9% 7.0% 6.6% 6.8%
21 7.0% 6.6% 7.5% 6.9% 7.1% 6.6% 6.9%
22 7.0% 6.6% 7.5% 6.9% 7.1% 6.6%
23 7.1% 6.6% 7.5% 7.0% 7.1% 6.6%
24 7.1% 6.7% 7.5% 7.0% 7.1% 6.6%
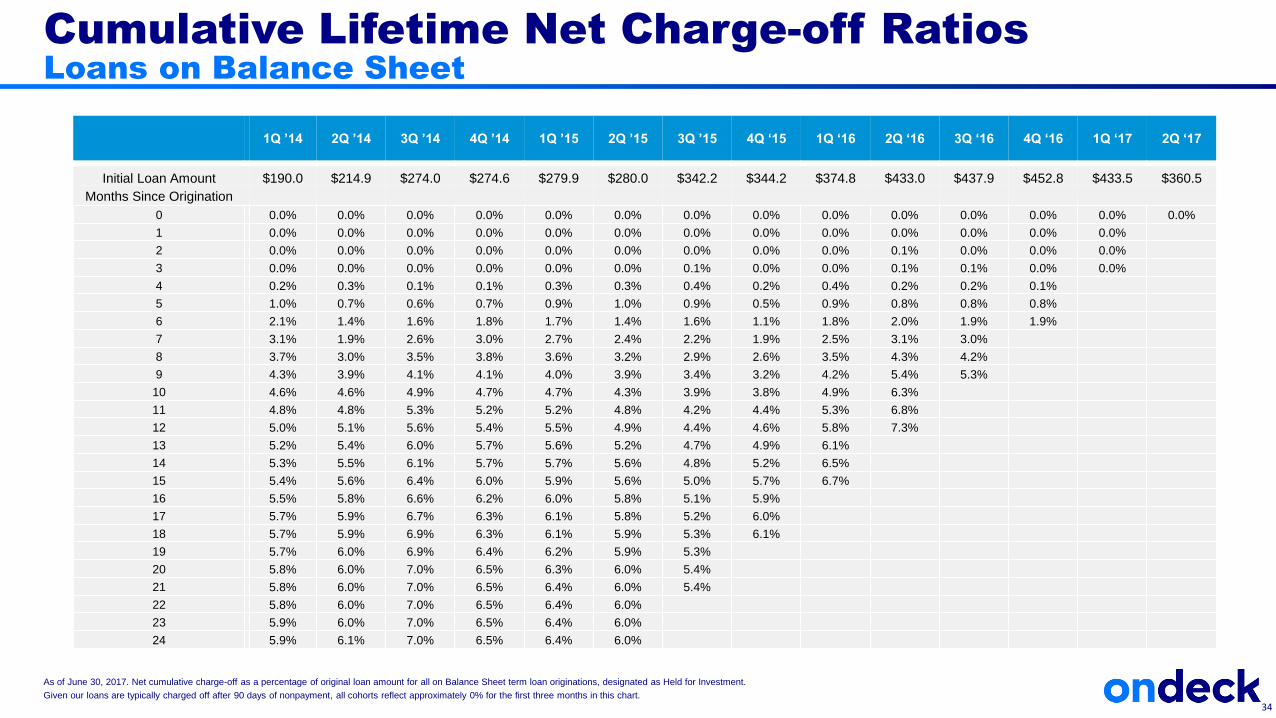
Cumulative Lifetime Net Charge-off Ratios
Loans on Balance Sheet
34
1Q ’14 2Q ’14 3Q ’14 4Q ’14 1Q ’15 2Q ’15 3Q ’15 4Q ‘15 1Q ‘16 2Q ‘16 3Q ‘16 4Q ‘16 1Q ‘17 2Q ‘17
Initial Loan Amount $190.0 $214.9 $274.0 $274.6 $279.9 $280.0 $342.2 $344.2 $374.8 $433.0 $437.9 $452.8 $433.5 $360.5
Months Since Origination
0 0.0% 0.0% 0.0% 0.0% 0.0% 0.0% 0.0% 0.0% 0.0% 0.0% 0.0% 0.0% 0.0% 0.0%
1 0.0% 0.0% 0.0% 0.0% 0.0% 0.0% 0.0% 0.0% 0.0% 0.0% 0.0% 0.0% 0.0%
2 0.0% 0.0% 0.0% 0.0% 0.0% 0.0% 0.0% 0.0% 0.0% 0.1% 0.0% 0.0% 0.0%
3 0.0% 0.0% 0.0% 0.0% 0.0% 0.0% 0.1% 0.0% 0.0% 0.1% 0.1% 0.0% 0.0%
4 0.2% 0.3% 0.1% 0.1% 0.3% 0.3% 0.4% 0.2% 0.4% 0.2% 0.2% 0.1%
5 1.0% 0.7% 0.6% 0.7% 0.9% 1.0% 0.9% 0.5% 0.9% 0.8% 0.8% 0.8%
6 2.1% 1.4% 1.6% 1.8% 1.7% 1.4% 1.6% 1.1% 1.8% 2.0% 1.9% 1.9%
7 3.1% 1.9% 2.6% 3.0% 2.7% 2.4% 2.2% 1.9% 2.5% 3.1% 3.0%
8 3.7% 3.0% 3.5% 3.8% 3.6% 3.2% 2.9% 2.6% 3.5% 4.3% 4.2%
9 4.3% 3.9% 4.1% 4.1% 4.0% 3.9% 3.4% 3.2% 4.2% 5.4% 5.3%
10 4.6% 4.6% 4.9% 4.7% 4.7% 4.3% 3.9% 3.8% 4.9% 6.3%
11 4.8% 4.8% 5.3% 5.2% 5.2% 4.8% 4.2% 4.4% 5.3% 6.8%
12 5.0% 5.1% 5.6% 5.4% 5.5% 4.9% 4.4% 4.6% 5.8% 7.3%
13 5.2% 5.4% 6.0% 5.7% 5.6% 5.2% 4.7% 4.9% 6.1%
14 5.3% 5.5% 6.1% 5.7% 5.7% 5.6% 4.8% 5.2% 6.5%
15 5.4% 5.6% 6.4% 6.0% 5.9% 5.6% 5.0% 5.7% 6.7%
16 5.5% 5.8% 6.6% 6.2% 6.0% 5.8% 5.1% 5.9%
17 5.7% 5.9% 6.7% 6.3% 6.1% 5.8% 5.2% 6.0%
18 5.7% 5.9% 6.9% 6.3% 6.1% 5.9% 5.3% 6.1%
19 5.7% 6.0% 6.9% 6.4% 6.2% 5.9% 5.3%
20 5.8% 6.0% 7.0% 6.5% 6.3% 6.0% 5.4%
21 5.8% 6.0% 7.0% 6.5% 6.4% 6.0% 5.4%
22 5.8% 6.0% 7.0% 6.5% 6.4% 6.0%
23 5.9% 6.0% 7.0% 6.5% 6.4% 6.0%
24 5.9% 6.1% 7.0% 6.5% 6.4% 6.0%
As of June 30, 2017. Net cumulative charge-off as a percentage of original loan amount for all on Balance Sheet term loan originations, designated as Held for Investment.
Given our loans are typically charged off after 90 days of nonpayment, all cohorts reflect approximately 0% for the first three months in this chart.
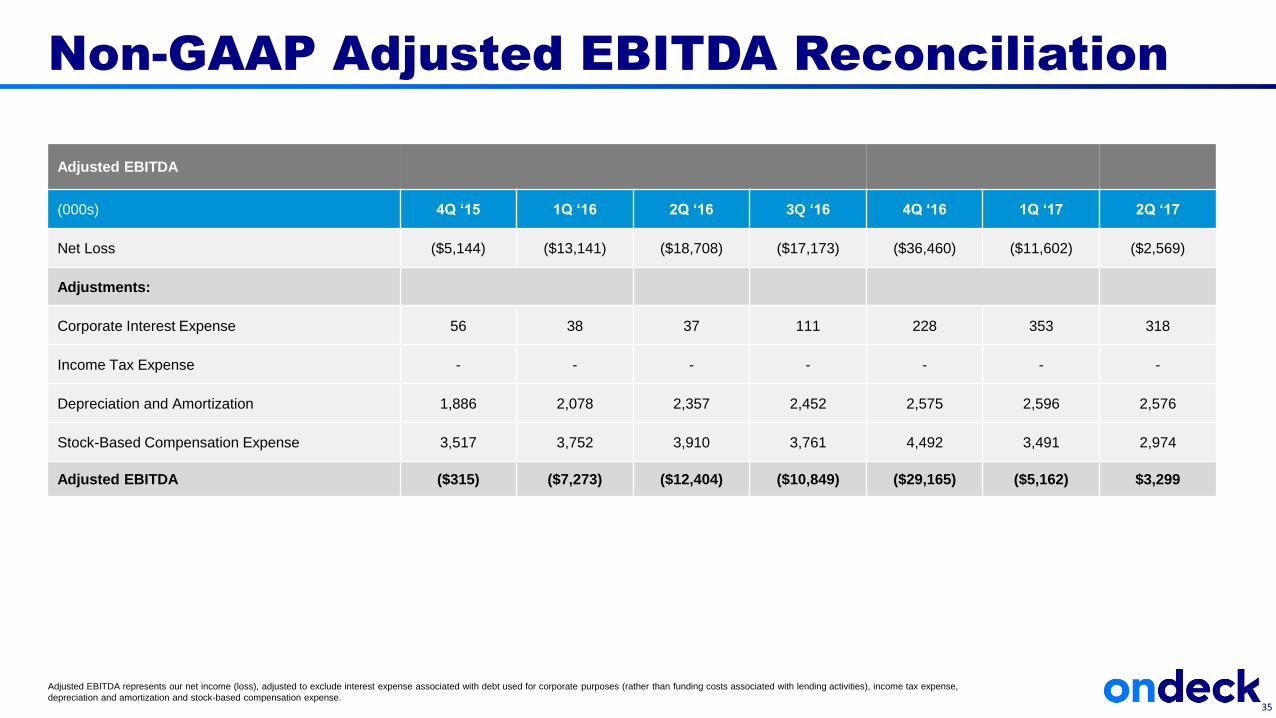
Adjusted EBITDA
(000s) 4Q ‘15 1Q ‘16 2Q ‘16 3Q ‘16 4Q ‘16 1Q ‘17 2Q ‘17
Net Loss ($5,144) ($13,141) ($18,708) ($17,173) ($36,460) ($11,602) ($2,569)
Adjustments:
Corporate Interest Expense 56 38 37 111 228 353 318
Income Tax Expense - - - - - - -
Depreciation and Amortization 1,886 2,078 2,357 2,452 2,575 2,596 2,576
Stock-Based Compensation Expense 3,517 3,752 3,910 3,761 4,492 3,491 2,974
Adjusted EBITDA ($315) ($7,273) ($12,404) ($10,849) ($29,165) ($5,162) $3,299
Non-GAAP Adjusted EBITDA Reconciliation
Adjusted EBITDA represents our net income (loss), adjusted to exclude interest expense associated with debt used for corporate purposes (rather than funding costs associated with lending activities), income tax expense,
depreciation and amortization and stock-based compensation expense. 35
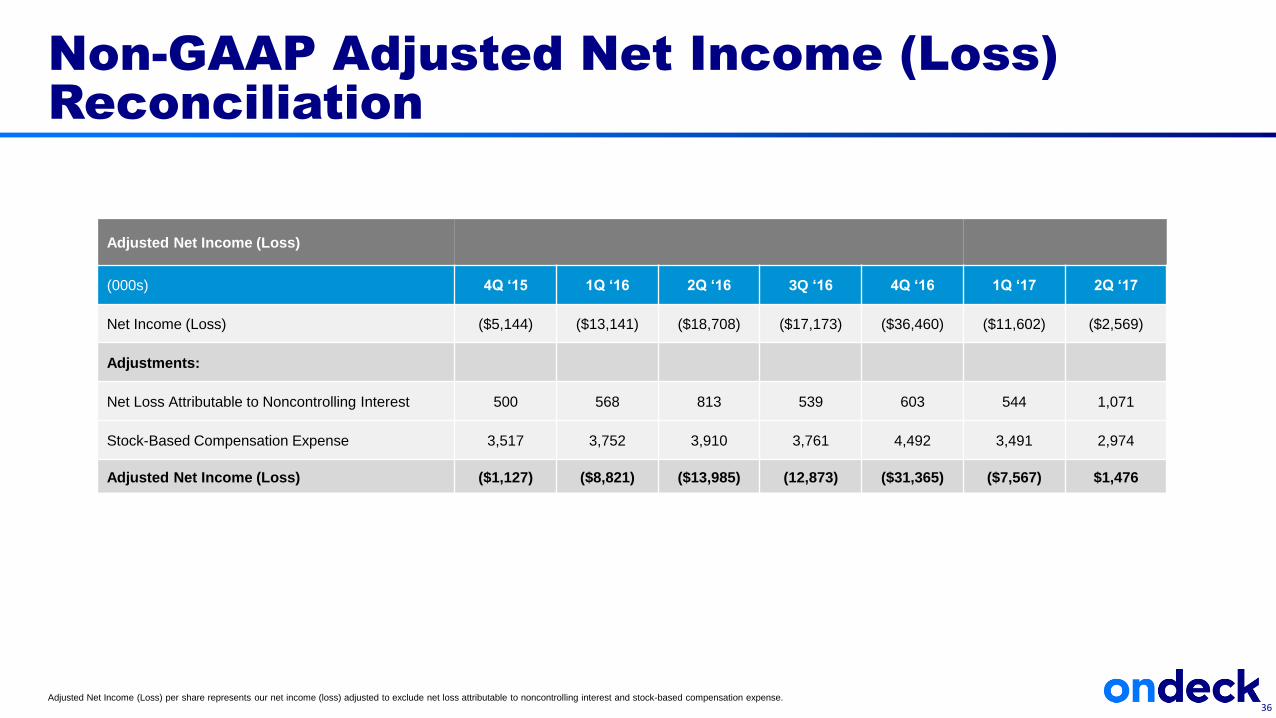
Adjusted Net Income (Loss)
(000s) 4Q ‘15 1Q ‘16 2Q ‘16 3Q ‘16 4Q ‘16 1Q ‘17 2Q ‘17
Net Income (Loss) ($5,144) ($13,141) ($18,708) ($17,173) ($36,460) ($11,602) ($2,569)
Adjustments:
Net Loss Attributable to Noncontrolling Interest 500 568 813 539 603 544 1,071
Stock-Based Compensation Expense 3,517 3,752 3,910 3,761 4,492 3,491 2,974
Adjusted Net Income (Loss) ($1,127) ($8,821) ($13,985) (12,873) ($31,365) ($7,567) $1,476
Non-GAAP Adjusted Net Income (Loss)
Reconciliation
Adjusted Net Income (Loss) per share represents our net income (loss) adjusted to exclude net loss attributable to noncontrolling interest and stock-based compensation expense.36
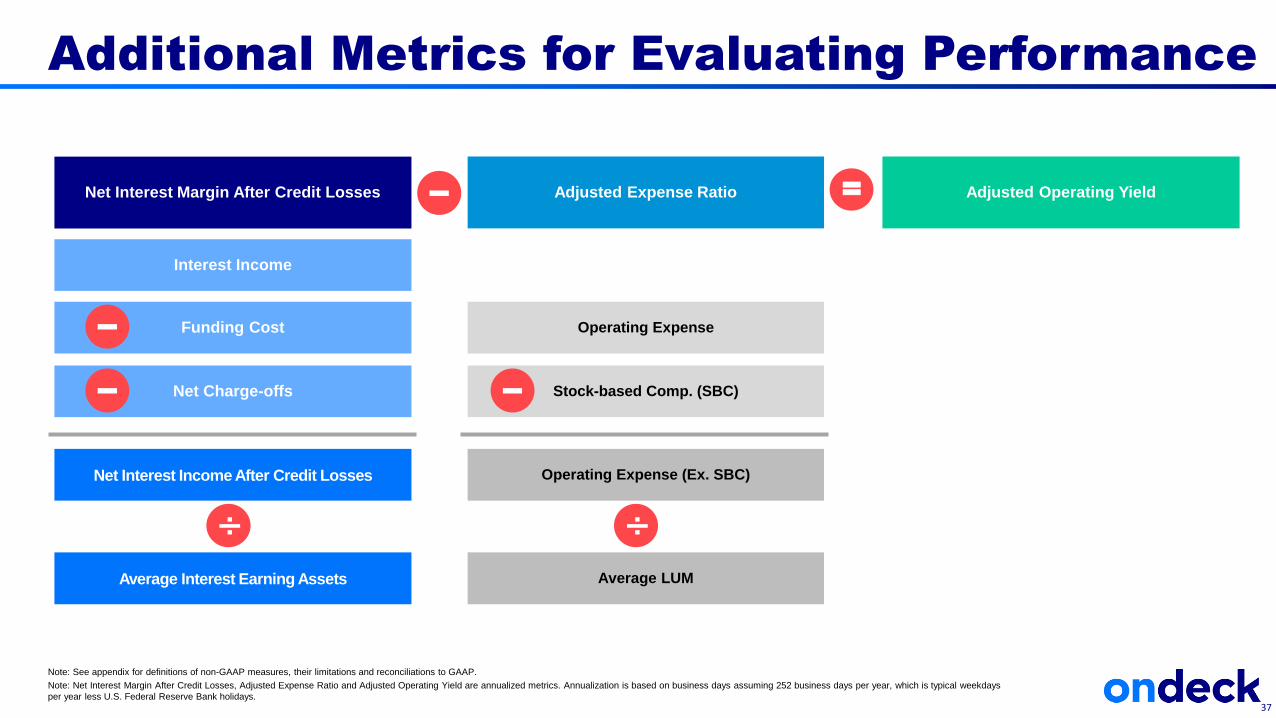
Additional Metrics for Evaluating Performance
37
Note: See appendix for definitions of non-GAAP measures, their limitations and reconciliations to GAAP.
Note: Net Interest Margin After Credit Losses, Adjusted Expense Ratio and Adjusted Operating Yield are annualized metrics. Annualization is based on business days assuming 252 business days per year, which is typical weekdays
per year less U.S. Federal Reserve Bank holidays.
Funding Cost
Interest Income
Net Charge-offs
Net Interest Income After Credit Losses
Average Interest Earning Assets
Stock-based Comp. (SBC)
Operating Expense
Operating Expense (Ex. SBC)
Average LUM
÷
Net Interest Margin After Credit Losses Adjusted Expense Ratio Adjusted Operating Yield=
÷
• Describes earnings
potential (spread) of loan
book
• Comparable to reported
metrics of other finance
companies
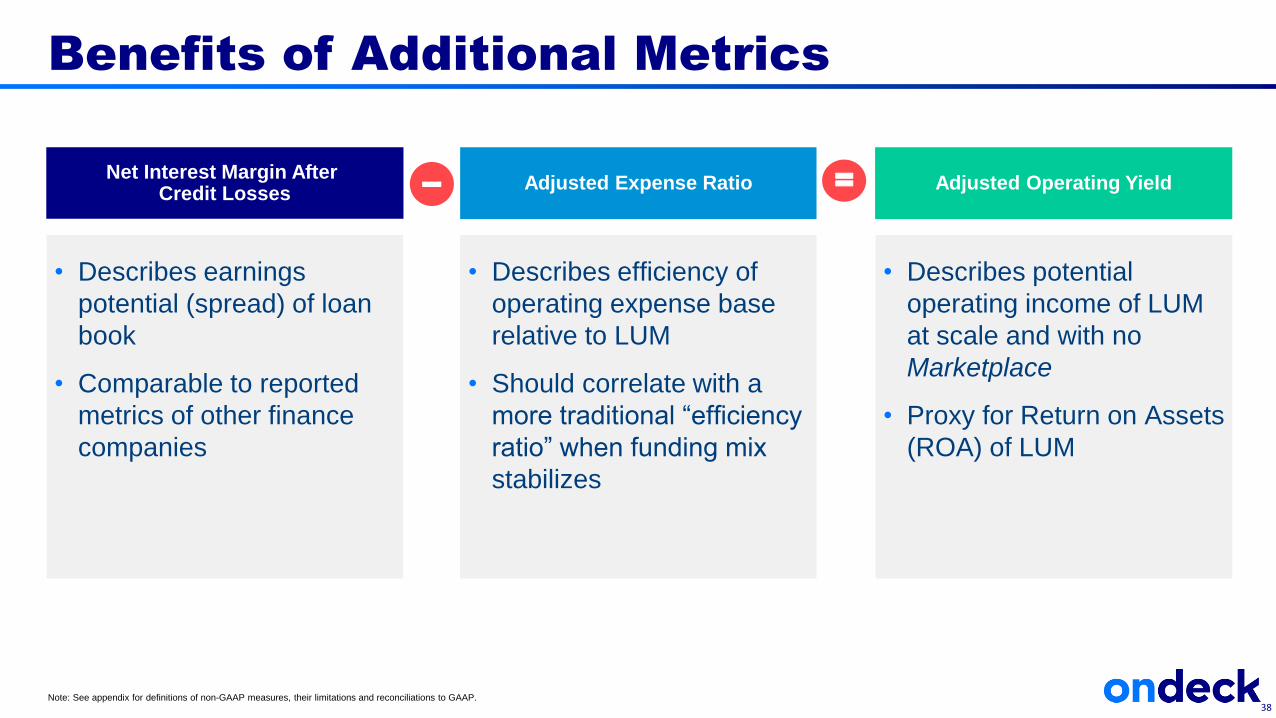
Benefits of Additional Metrics
Note: See appendix for definitions of non-GAAP measures, their limitations and reconciliations to GAAP.
Net Interest Margin After Credit Losses
Adjusted Expense Ratio Adjusted Operating Yield=
• Describes efficiency of
operating expense base
relative to LUM
• Should correlate with a
more traditional “efficiency
ratio” when funding mix
stabilizes
• Describes potential
operating income of LUM
at scale and with no
Marketplace
• Proxy for Return on Assets
(ROA) of LUM
38
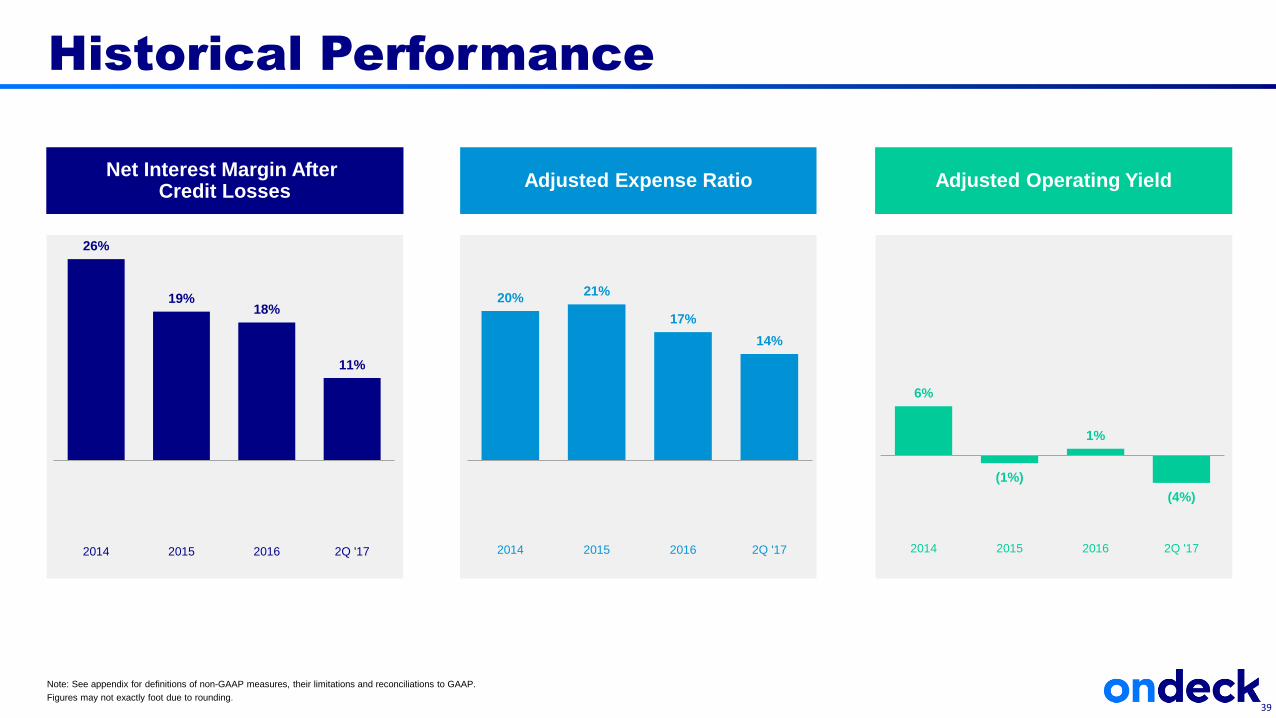
Historical Performance
Note: See appendix for definitions of non-GAAP measures, their limitations and reconciliations to GAAP.
Figures may not exactly foot due to rounding.
Net Interest Margin After Credit Losses
26%
19%18%
11%
2014 2015 2016 2Q '17
Adjusted Expense Ratio
20%21%
17%
14%
2014 2015 2016 2Q '17
Adjusted Operating Yield
6%
(1%)
1%
(4%)
2014 2015 2016 2Q '17
39
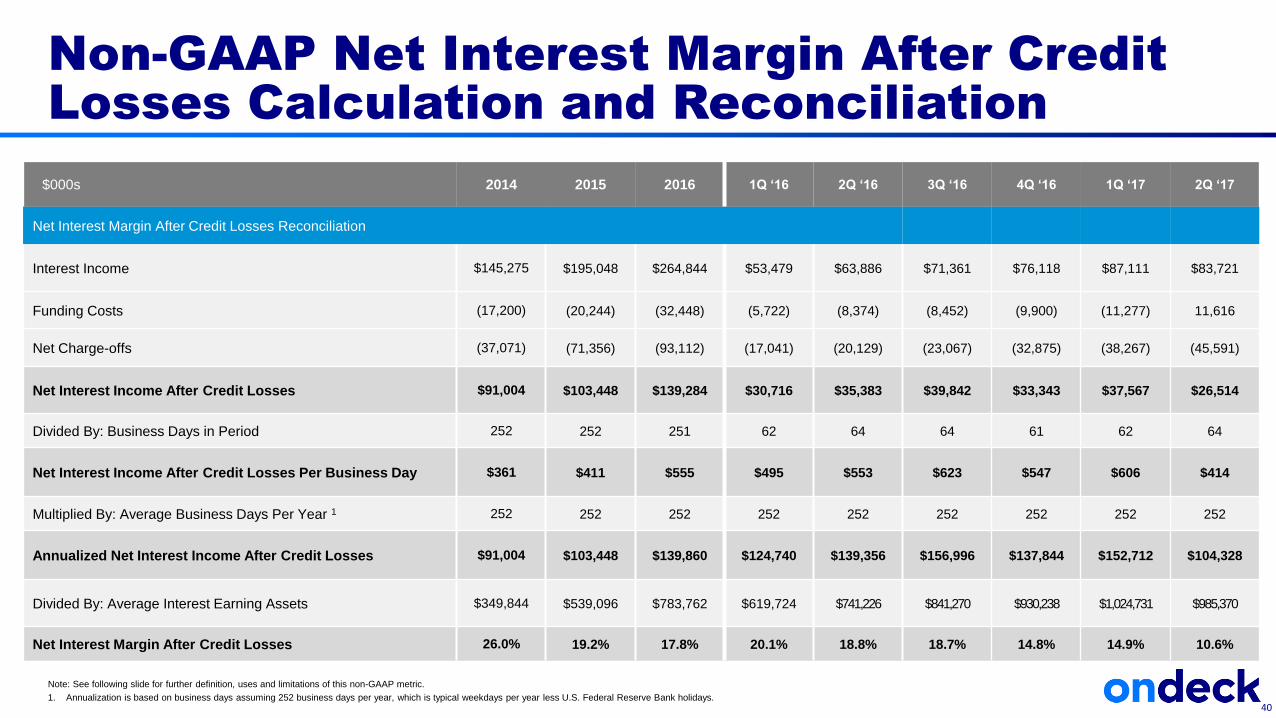
Non-GAAP Net Interest Margin After Credit
Losses Calculation and Reconciliation
Note: See following slide for further definition, uses and limitations of this non-GAAP metric.
1. Annualization is based on business days assuming 252 business days per year, which is typical weekdays per year less U.S. Federal Reserve Bank holidays.40
$000s 2014 2015 2016 1Q ‘16 2Q ‘16 3Q ‘16 4Q ‘16 1Q ‘17 2Q ‘17
Net Interest Margin After Credit Losses Reconciliation
Interest Income $145,275 $195,048 $264,844 $53,479 $63,886 $71,361 $76,118 $87,111 $83,721
Funding Costs (17,200) (20,244) (32,448) (5,722) (8,374) (8,452) (9,900) (11,277) 11,616
Net Charge-offs (37,071) (71,356) (93,112) (17,041) (20,129) (23,067) (32,875) (38,267) (45,591)
Net Interest Income After Credit Losses $91,004 $103,448 $139,284 $30,716 $35,383 $39,842 $33,343 $37,567 $26,514
Divided By: Business Days in Period 252 252 251 62 64 64 61 62 64
Net Interest Income After Credit Losses Per Business Day $361 $411 $555 $495 $553 $623 $547 $606 $414
Multiplied By: Average Business Days Per Year 1 252 252 252 252 252 252 252 252 252
Annualized Net Interest Income After Credit Losses $91,004 $103,448 $139,860 $124,740 $139,356 $156,996 $137,844 $152,712 $104,328
Divided By: Average Interest Earning Assets $349,844 $539,096 $783,762 $619,724 $741,226 $841,270 $930,238 $1,024,731 $985,370
Net Interest Margin After Credit Losses 26.0% 19.2% 17.8% 20.1% 18.8% 18.7% 14.8% 14.9% 10.6%
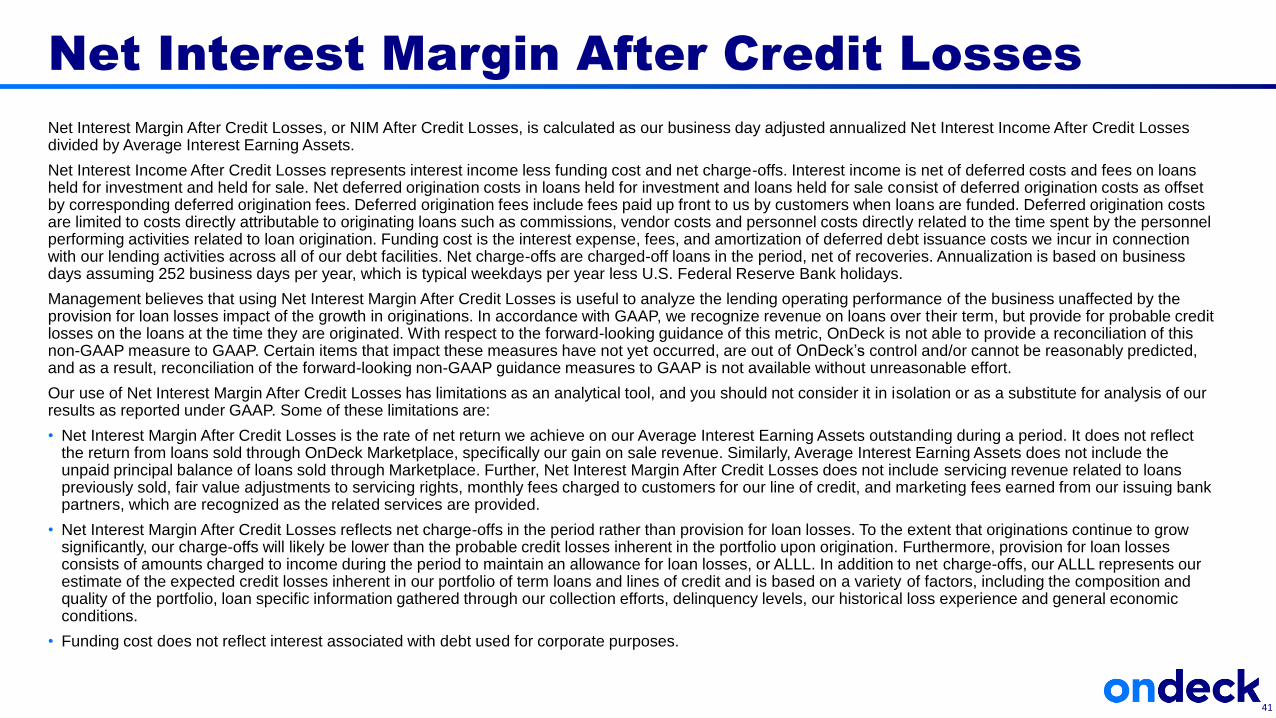
Net Interest Margin After Credit Losses, or NIM After Credit Losses, is calculated as our business day adjusted annualized Net Interest Income After Credit Losses divided by Average Interest Earning Assets.
Net Interest Income After Credit Losses represents interest income less funding cost and net charge-offs. Interest income is net of deferred costs and fees on loans held for investment and held for sale. Net deferred origination costs in loans held for investment and loans held for sale consist of deferred origination costs as offset by corresponding deferred origination fees. Deferred origination fees include fees paid up front to us by customers when loans are funded. Deferred origination costs are limited to costs directly attributable to originating loans such as commissions, vendor costs and personnel costs directly related to the time spent by the personnel performing activities related to loan origination. Funding cost is the interest expense, fees, and amortization of deferred debt issuance costs we incur in connection with our lending activities across all of our debt facilities. Net charge-offs are charged-off loans in the period, net of recoveries. Annualization is based on business days assuming 252 business days per year, which is typical weekdays per year less U.S. Federal Reserve Bank holidays.
Management believes that using Net Interest Margin After Credit Losses is useful to analyze the lending operating performance of the business unaffected by the provision for loan losses impact of the growth in originations. In accordance with GAAP, we recognize revenue on loans over their term, but provide for probable credit losses on the loans at the time they are originated. With respect to the forward-looking guidance of this metric, OnDeck is not able to provide a reconciliation of this non-GAAP measure to GAAP. Certain items that impact these measures have not yet occurred, are out of OnDeck’s control and/or cannot be reasonably predicted, and as a result, reconciliation of the forward-looking non-GAAP guidance measures to GAAP is not available without unreasonable effort.
Our use of Net Interest Margin After Credit Losses has limitations as an analytical tool, and you should not consider it in isolation or as a substitute for analysis of our results as reported under GAAP. Some of these limitations are:
• Net Interest Margin After Credit Losses is the rate of net return we achieve on our Average Interest Earning Assets outstanding during a period. It does not reflect the return from loans sold through OnDeck Marketplace, specifically our gain on sale revenue. Similarly, Average Interest Earning Assets does not include the unpaid principal balance of loans sold through Marketplace. Further, Net Interest Margin After Credit Losses does not include servicing revenue related to loans previously sold, fair value adjustments to servicing rights, monthly fees charged to customers for our line of credit, and marketing fees earned from our issuing bank partners, which are recognized as the related services are provided.
• Net Interest Margin After Credit Losses reflects net charge-offs in the period rather than provision for loan losses. To the extent that originations continue to grow significantly, our charge-offs will likely be lower than the probable credit losses inherent in the portfolio upon origination. Furthermore, provision for loan losses consists of amounts charged to income during the period to maintain an allowance for loan losses, or ALLL. In addition to net charge-offs, our ALLL represents our estimate of the expected credit losses inherent in our portfolio of term loans and lines of credit and is based on a variety of factors, including the composition and quality of the portfolio, loan specific information gathered through our collection efforts, delinquency levels, our historical loss experience and general economic conditions.
• Funding cost does not reflect interest associated with debt used for corporate purposes.
Net Interest Margin After Credit Losses
41
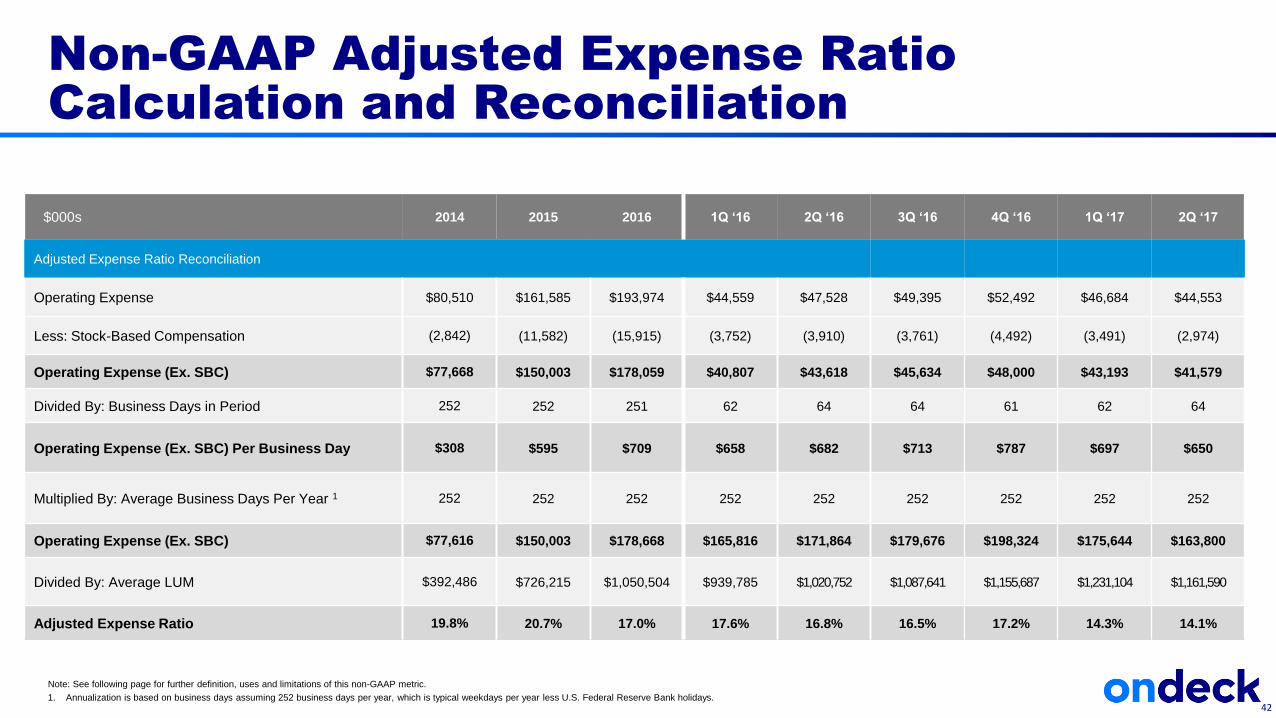
$000s 2014 2015 2016 1Q ‘16 2Q ‘16 3Q ‘16 4Q ‘16 1Q ‘17 2Q ‘17
Adjusted Expense Ratio Reconciliation
Operating Expense $80,510 $161,585 $193,974 $44,559 $47,528 $49,395 $52,492 $46,684 $44,553
Less: Stock-Based Compensation (2,842) (11,582) (15,915) (3,752) (3,910) (3,761) (4,492) (3,491) (2,974)
Operating Expense (Ex. SBC) $77,668 $150,003 $178,059 $40,807 $43,618 $45,634 $48,000 $43,193 $41,579
Divided By: Business Days in Period 252 252 251 62 64 64 61 62 64
Operating Expense (Ex. SBC) Per Business Day $308 $595 $709 $658 $682 $713 $787 $697 $650
Multiplied By: Average Business Days Per Year 1 252 252 252 252 252 252 252 252 252
Operating Expense (Ex. SBC) $77,616 $150,003 $178,668 $165,816 $171,864 $179,676 $198,324 $175,644 $163,800
Divided By: Average LUM $392,486 $726,215 $1,050,504 $939,785 $1,020,752 $1,087,641 $1,155,687 $1,231,104 $1,161,590
Adjusted Expense Ratio 19.8% 20.7% 17.0% 17.6% 16.8% 16.5% 17.2% 14.3% 14.1%
Non-GAAP Adjusted Expense Ratio
Calculation and Reconciliation
Note: See following page for further definition, uses and limitations of this non-GAAP metric.
1. Annualization is based on business days assuming 252 business days per year, which is typical weekdays per year less U.S. Federal Reserve Bank holidays.42
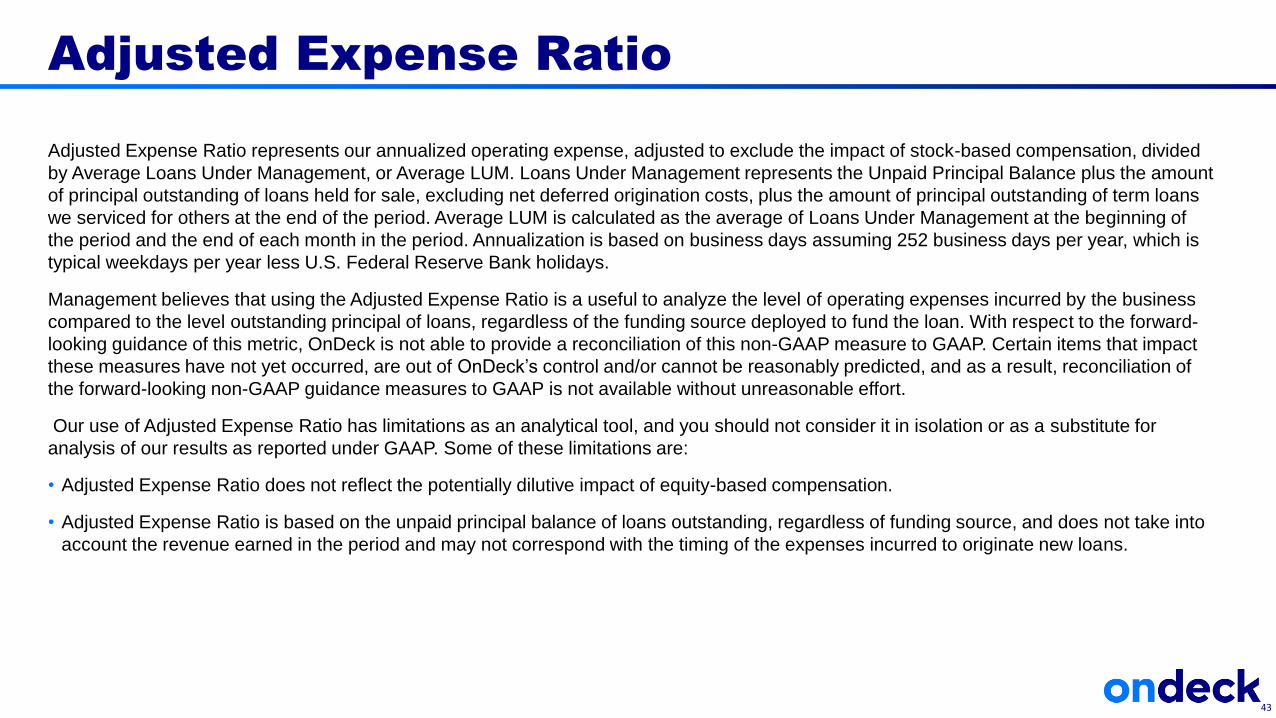
Adjusted Expense Ratio represents our annualized operating expense, adjusted to exclude the impact of stock-based compensation, divided
by Average Loans Under Management, or Average LUM. Loans Under Management represents the Unpaid Principal Balance plus the amount
of principal outstanding of loans held for sale, excluding net deferred origination costs, plus the amount of principal outstanding of term loans
we serviced for others at the end of the period. Average LUM is calculated as the average of Loans Under Management at the beginning of
the period and the end of each month in the period. Annualization is based on business days assuming 252 business days per year, which is
typical weekdays per year less U.S. Federal Reserve Bank holidays.
Management believes that using the Adjusted Expense Ratio is a useful to analyze the level of operating expenses incurred by the business
compared to the level outstanding principal of loans, regardless of the funding source deployed to fund the loan. With respect to the forward-
looking guidance of this metric, OnDeck is not able to provide a reconciliation of this non-GAAP measure to GAAP. Certain items that impact
these measures have not yet occurred, are out of OnDeck’s control and/or cannot be reasonably predicted, and as a result, reconciliation of
the forward-looking non-GAAP guidance measures to GAAP is not available without unreasonable effort.
Our use of Adjusted Expense Ratio has limitations as an analytical tool, and you should not consider it in isolation or as a substitute for
analysis of our results as reported under GAAP. Some of these limitations are:
• Adjusted Expense Ratio does not reflect the potentially dilutive impact of equity-based compensation.
• Adjusted Expense Ratio is based on the unpaid principal balance of loans outstanding, regardless of funding source, and does not take into
account the revenue earned in the period and may not correspond with the timing of the expenses incurred to originate new loans.
Adjusted Expense Ratio
43
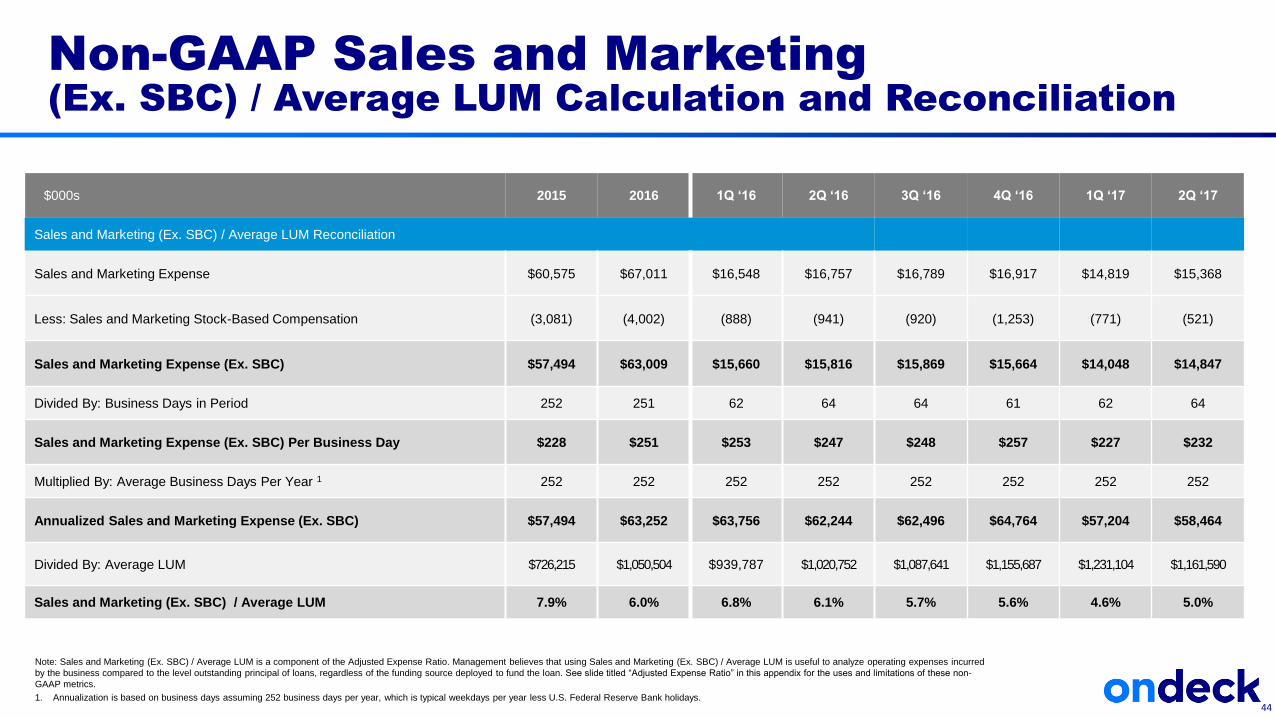
$000s 2015 2016 1Q ‘16 2Q ‘16 3Q ‘16 4Q ‘16 1Q ‘17 2Q ‘17
Sales and Marketing (Ex. SBC) / Average LUM Reconciliation
Sales and Marketing Expense $60,575 $67,011 $16,548 $16,757 $16,789 $16,917 $14,819 $15,368
Less: Sales and Marketing Stock-Based Compensation (3,081) (4,002) (888) (941) (920) (1,253) (771) (521)
Sales and Marketing Expense (Ex. SBC) $57,494 $63,009 $15,660 $15,816 $15,869 $15,664 $14,048 $14,847
Divided By: Business Days in Period 252 251 62 64 64 61 62 64
Sales and Marketing Expense (Ex. SBC) Per Business Day $228 $251 $253 $247 $248 $257 $227 $232
Multiplied By: Average Business Days Per Year 1 252 252 252 252 252 252 252 252
Annualized Sales and Marketing Expense (Ex. SBC) $57,494 $63,252 $63,756 $62,244 $62,496 $64,764 $57,204 $58,464
Divided By: Average LUM $726,215 $1,050,504 $939,787 $1,020,752 $1,087,641 $1,155,687 $1,231,104 $1,161,590
Sales and Marketing (Ex. SBC) / Average LUM 7.9% 6.0% 6.8% 6.1% 5.7% 5.6% 4.6% 5.0%
Non-GAAP Sales and Marketing
(Ex. SBC) / Average LUM Calculation and Reconciliation
Note: Sales and Marketing (Ex. SBC) / Average LUM is a component of the Adjusted Expense Ratio. Management believes that using Sales and Marketing (Ex. SBC) / Average LUM is useful to analyze operating expenses incurred
by the business compared to the level outstanding principal of loans, regardless of the funding source deployed to fund the loan. See slide titled “Adjusted Expense Ratio” in this appendix for the uses and limitations of these non-
GAAP metrics.
1. Annualization is based on business days assuming 252 business days per year, which is typical weekdays per year less U.S. Federal Reserve Bank holidays.44
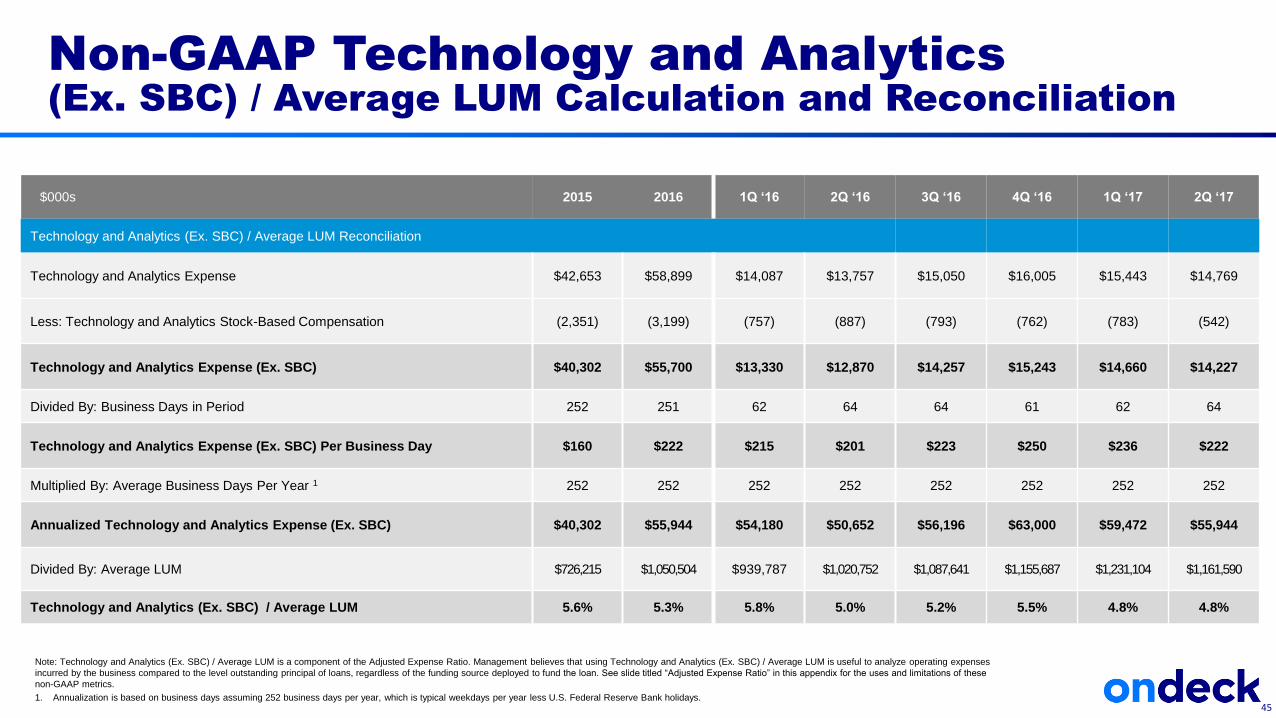
$000s 2015 2016 1Q ‘16 2Q ‘16 3Q ‘16 4Q ‘16 1Q ‘17 2Q ‘17
Technology and Analytics (Ex. SBC) / Average LUM Reconciliation
Technology and Analytics Expense $42,653 $58,899 $14,087 $13,757 $15,050 $16,005 $15,443 $14,769
Less: Technology and Analytics Stock-Based Compensation (2,351) (3,199) (757) (887) (793) (762) (783) (542)
Technology and Analytics Expense (Ex. SBC) $40,302 $55,700 $13,330 $12,870 $14,257 $15,243 $14,660 $14,227
Divided By: Business Days in Period 252 251 62 64 64 61 62 64
Technology and Analytics Expense (Ex. SBC) Per Business Day $160 $222 $215 $201 $223 $250 $236 $222
Multiplied By: Average Business Days Per Year 1 252 252 252 252 252 252 252 252
Annualized Technology and Analytics Expense (Ex. SBC) $40,302 $55,944 $54,180 $50,652 $56,196 $63,000 $59,472 $55,944
Divided By: Average LUM $726,215 $1,050,504 $939,787 $1,020,752 $1,087,641 $1,155,687 $1,231,104 $1,161,590
Technology and Analytics (Ex. SBC) / Average LUM 5.6% 5.3% 5.8% 5.0% 5.2% 5.5% 4.8% 4.8%
Non-GAAP Technology and Analytics
(Ex. SBC) / Average LUM Calculation and Reconciliation
Note: Technology and Analytics (Ex. SBC) / Average LUM is a component of the Adjusted Expense Ratio. Management believes that using Technology and Analytics (Ex. SBC) / Average LUM is useful to analyze operating expenses
incurred by the business compared to the level outstanding principal of loans, regardless of the funding source deployed to fund the loan. See slide titled “Adjusted Expense Ratio” in this appendix for the uses and limitations of these
non-GAAP metrics.
1. Annualization is based on business days assuming 252 business days per year, which is typical weekdays per year less U.S. Federal Reserve Bank holidays.45
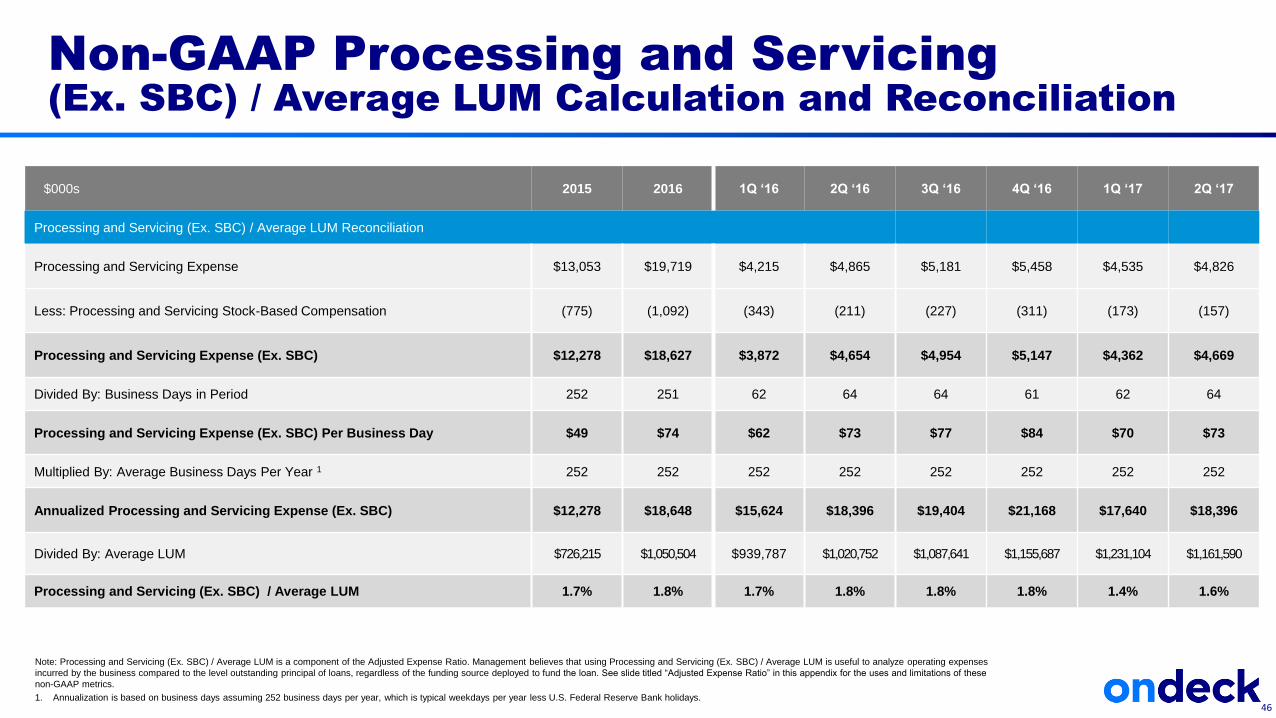
$000s 2015 2016 1Q ‘16 2Q ‘16 3Q ‘16 4Q ‘16 1Q ‘17 2Q ‘17
Processing and Servicing (Ex. SBC) / Average LUM Reconciliation
Processing and Servicing Expense $13,053 $19,719 $4,215 $4,865 $5,181 $5,458 $4,535 $4,826
Less: Processing and Servicing Stock-Based Compensation (775) (1,092) (343) (211) (227) (311) (173) (157)
Processing and Servicing Expense (Ex. SBC) $12,278 $18,627 $3,872 $4,654 $4,954 $5,147 $4,362 $4,669
Divided By: Business Days in Period 252 251 62 64 64 61 62 64
Processing and Servicing Expense (Ex. SBC) Per Business Day $49 $74 $62 $73 $77 $84 $70 $73
Multiplied By: Average Business Days Per Year 1 252 252 252 252 252 252 252 252
Annualized Processing and Servicing Expense (Ex. SBC) $12,278 $18,648 $15,624 $18,396 $19,404 $21,168 $17,640 $18,396
Divided By: Average LUM $726,215 $1,050,504 $939,787 $1,020,752 $1,087,641 $1,155,687 $1,231,104 $1,161,590
Processing and Servicing (Ex. SBC) / Average LUM 1.7% 1.8% 1.7% 1.8% 1.8% 1.8% 1.4% 1.6%
Non-GAAP Processing and Servicing
(Ex. SBC) / Average LUM Calculation and Reconciliation
Note: Processing and Servicing (Ex. SBC) / Average LUM is a component of the Adjusted Expense Ratio. Management believes that using Processing and Servicing (Ex. SBC) / Average LUM is useful to analyze operating expenses
incurred by the business compared to the level outstanding principal of loans, regardless of the funding source deployed to fund the loan. See slide titled “Adjusted Expense Ratio” in this appendix for the uses and limitations of these
non-GAAP metrics.
1. Annualization is based on business days assuming 252 business days per year, which is typical weekdays per year less U.S. Federal Reserve Bank holidays.46
$000s 2015 2016 1Q ‘16 2Q ‘16 3Q ‘16 4Q ‘16 1Q ‘17 2Q ‘17
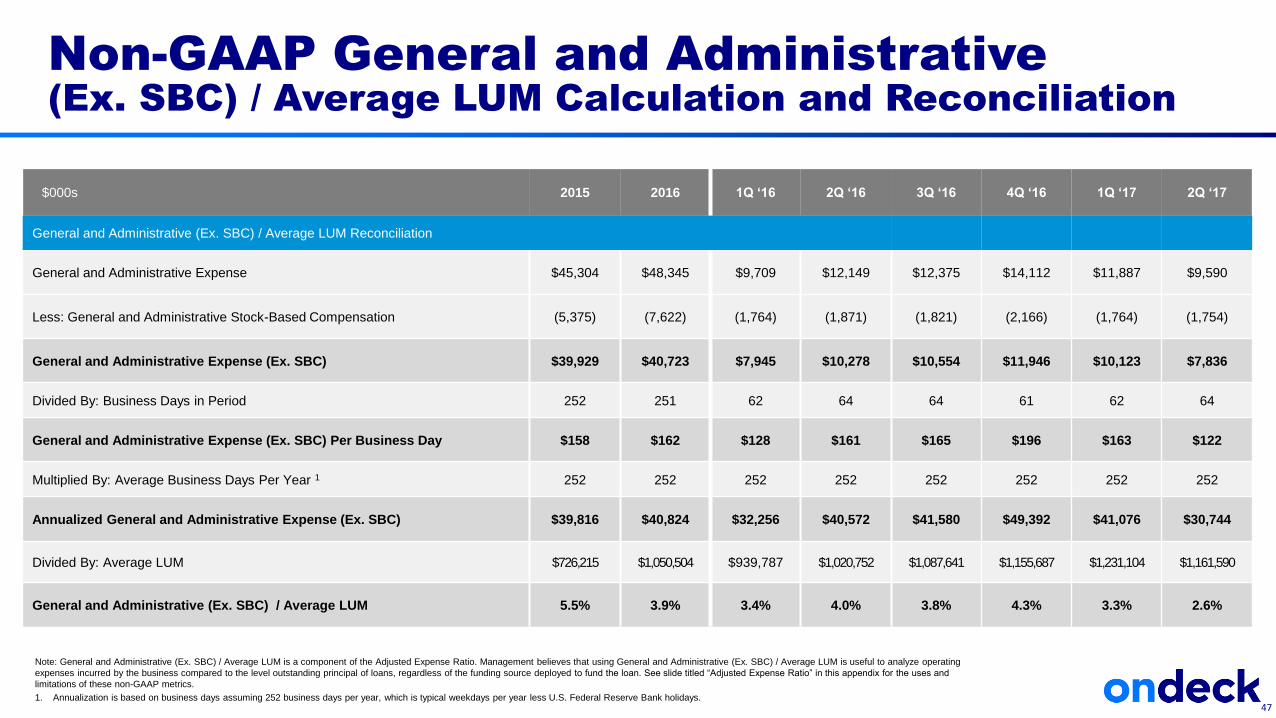
General and Administrative (Ex. SBC) / Average LUM Reconciliation
General and Administrative Expense $45,304 $48,345 $9,709 $12,149 $12,375 $14,112 $11,887 $9,590
Less: General and Administrative Stock-Based Compensation (5,375) (7,622) (1,764) (1,871) (1,821) (2,166) (1,764) (1,754)
General and Administrative Expense (Ex. SBC) $39,929 $40,723 $7,945 $10,278 $10,554 $11,946 $10,123 $7,836
Divided By: Business Days in Period 252 251 62 64 64 61 62 64
General and Administrative Expense (Ex. SBC) Per Business Day $158 $162 $128 $161 $165 $196 $163 $122
Multiplied By: Average Business Days Per Year 1 252 252 252 252 252 252 252 252
Annualized General and Administrative Expense (Ex. SBC) $39,816 $40,824 $32,256 $40,572 $41,580 $49,392 $41,076 $30,744
Divided By: Average LUM $726,215 $1,050,504 $939,787 $1,020,752 $1,087,641 $1,155,687 $1,231,104 $1,161,590
General and Administrative (Ex. SBC) / Average LUM 5.5% 3.9% 3.4% 4.0% 3.8% 4.3% 3.3% 2.6%
Non-GAAP General and Administrative
(Ex. SBC) / Average LUM Calculation and Reconciliation
Note: General and Administrative (Ex. SBC) / Average LUM is a component of the Adjusted Expense Ratio. Management believes that using General and Administrative (Ex. SBC) / Average LUM is useful to analyze operating
expenses incurred by the business compared to the level outstanding principal of loans, regardless of the funding source deployed to fund the loan. See slide titled “Adjusted Expense Ratio” in this appendix for the uses and
limitations of these non-GAAP metrics.
1. Annualization is based on business days assuming 252 business days per year, which is typical weekdays per year less U.S. Federal Reserve Bank holidays.47
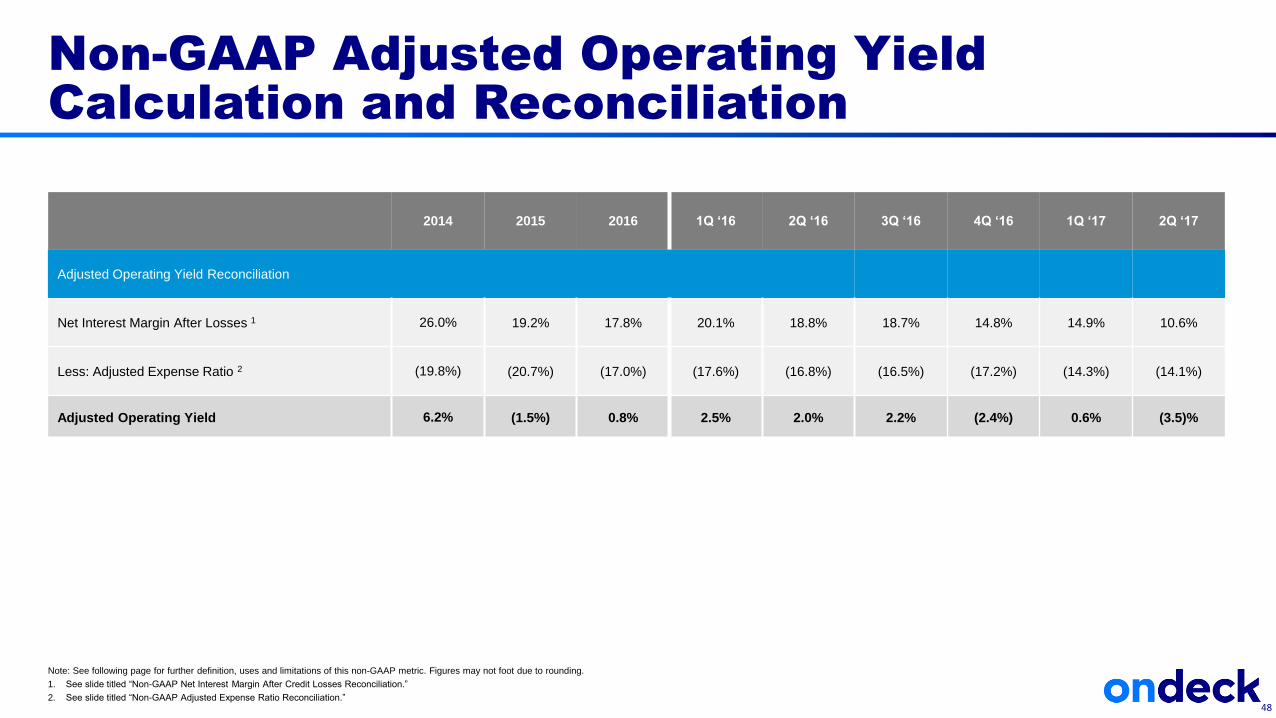
2014 2015 2016 1Q ‘16 2Q ‘16 3Q ‘16 4Q ‘16 1Q ‘17 2Q ‘17
Adjusted Operating Yield Reconciliation
Net Interest Margin After Losses 1 26.0% 19.2% 17.8% 20.1% 18.8% 18.7% 14.8% 14.9% 10.6%
Less: Adjusted Expense Ratio 2 (19.8%) (20.7%) (17.0%) (17.6%) (16.8%) (16.5%) (17.2%) (14.3%) (14.1%)
Adjusted Operating Yield 6.2% (1.5%) 0.8% 2.5% 2.0% 2.2% (2.4%) 0.6% (3.5)%
Non-GAAP Adjusted Operating Yield
Calculation and Reconciliation
Note: See following page for further definition, uses and limitations of this non-GAAP metric. Figures may not foot due to rounding.
1. See slide titled “Non-GAAP Net Interest Margin After Credit Losses Reconciliation.”
2. See slide titled “Non-GAAP Adjusted Expense Ratio Reconciliation.”48
Adjusted Operating Yield represents our Net Interest Margin After Credit Losses less the Adjusted Expense Ratio.
Management believes that using Adjusted Operating Yield is a useful tool to evaluate the operating performance of the business unaffected by
the growth in originations and regardless of funding strategy. With respect to the forward-looking guidance of this metric, OnDeck is not able to
provide a reconciliation of this non-GAAP measure to GAAP. Certain items that impact these measures have not yet occurred, are out of
OnDeck’s control and/or cannot be reasonably predicted, and as a result, reconciliation of the forward-looking non-GAAP guidance measures
to GAAP is not available without unreasonable effort.
Our use of Adjusted Operating Yield has limitations as an analytical tool, and you should not consider it in isolation or as a substitute for
analysis of our results as reported under GAAP. Some of these limitations are:
• Net Interest Margin After Credit Losses uses Average Interest Earning Assets in the denominator of the calculation whereas Adjusted
Expense Ratio uses Average Loans Under Management in the denominator. Subtracting one metric from the other is purely illustrative and
does not reflect the operating performance of the business.
• Using Adjusted Operating Yield as a measure to compare Net Interest Margin After Credit Losses to Adjusted Expense Ratio assumes that
loans sold through the OnDeck Marketplace are of similar origination, performance characteristics and return as loans held for investment
and held for sale, which are funded on-balance sheet through our asset-backed revolving facilities, asset-backed securitization facilities,
and internal equity.
• Using Net Interest Margin After Credit Losses as a measure to compare against Adjusted Expense Ratio assumes that the rate of return of
loans funded through the OnDeck Marketplace is similar to that of our loans held for investment or held for sale. Should our Marketplace
Gain on Sale Rates materially differ, both positively or negatively, this may limit the utility of comparing Net Interest Margin After Credit
Losses to Adjusted Expense Ratio as a means of measuring the operations of the business.
Adjusted Operating Yield
49


![Investor Presentations2.q4cdn.com/.../[FINAL]-September-Investor-Presentation.pdf2 These materials and the accompanying oral presentation contain “forward-looking statements”within](https://static.documents.pub/doc/80x56/5ffa2febc342c265233a1664/investor-presentations2q4cdncomfinal-september-investor-2-these-materials.jpg)


