33
www.ricemidstream.com 1 Investor Presentation May 2017
www.ricemidstream.com1
Investor Presentation
May 2017
www.ricemidstream.com2
Cautionary StatementsFORWARD-LOOKING STATEMENTS
This presentation and the oral statements made in connection therewith may contain “forward looking statements” within the meaning of securities laws. All statements, other than statements of historical fact, regarding Rice
Midstream’s and Rice Energy’s strategies, future operations, financial positions, estimated revenues and income/losses, projected costs, as amended, prospects, plans and objectives of management are forward-looking
statements. These statements often include the words “could,” “believe,” “anticipate,” “may,” “assume,” “forecast,” “position,” “predict,” “strategy,” “expect,” “intend,” “plan,” “estimate,” “project,” “budget,” “potential,”
“guidance,” or “continue” and similar expressions intended to identify forward-looking statements, although not all forward-looking statements contain such identifying words. Without limiting the generality of the foregoing,
forward-looking statements with respect to Rice Midstream contained in this presentation specifically include expectation of plans, strategies, objectives and anticipated or targeted financial and operating results of Rice
Midstream and other guidance included in this presentation, and forward-looking statements contained in this presentation with respect to Rice Energy specifically include estimates of its reserves, expectations of plans,
strategies, objectives and anticipated or targeted financial and operating results, including as to its drilling program, acreage position, production, hedging activities, leverage, capital expenditure levels, projected returns, the
terms, timing and completion of any sale of a portion of Rice Olympus Midstream LLC to RMP, and other guidance included in this presentation. These forward-looking statements are based on Rice Midstream’s and Rice Energy’s
current expectations and assumptions about future events and are based on currently available information as to the outcome and timing of future events. Rice Midstream and Rice Energy assume no obligation to and do not intend
to update any forward looking statements included herein. You are cautioned not to place undue reliance on any forward-looking statements. Rice Midstream and Rice Energy caution you that these forward-looking statements are
subject to all of the risks and uncertainties, most of which are difficult to predict and many of which are beyond their control, incident to the exploration for and development, production, gathering and sale of natural gas, natural
gas liquids and oil, as well as Rice Midstream’s gathering and compression and water services business. These risks include, but are not limited to, commodity price volatility; inflation; lack of availability of drilling and production
equipment and services; environmental risks; drilling and other operating risks; regulatory changes; the uncertainty inherent in estimating natural gas reserves and in projecting future rates of production and throughput volumes,
cash flow and access to capital; the timing of development expenditures of Rice Energy and Rice Midstream’s other customers; risks relating to joint venture operations; and the other risks described under “Risk Factors” in each
of Rice Midstream’s and Rice Energy’s most recent Form 10-Ks, Form 10-Qs and other filings with the Securities and Exchange Commission. Should one or more of these risks or uncertainties occur, or should underlying
assumptions prove incorrect, Rice Midstream’s and Rice Energy’s actual results and plans could differ materially from those expressed in any forward-looking statements.
This presentation has been prepared by Rice Midstream and Rice Energy and includes market data and other statistical information from sources believed by Rice Midstream and Rice Energy to be reliable, including independent
industry publications, government publications or other published independent sources. Some data are also based on Rice Midstream’s and Rice Energy’s good faith estimates, which are derived from their review of internal
sources, as well as the independent sources described above. Although Rice Midstream and Rice Energy believe these sources are reliable, neither has independently verified the information, and neither can guarantee its
accuracy and completeness.
NON-PROVEN OIL AND GAS VOLUME MEASURES
The SEC permits oil and gas companies, in their filings with the SEC, to disclose proved reserves, which are reserve estimates that geological and engineering data demonstrate with reasonable certainty to be recoverable in
future years from known reservoirs under existing economic and operating conditions and certain probable and possible reserves that meet the SEC’s definition for such terms. Rice Energy may use certain broader terms such as
EUR (estimated ultimate recovery of resources), and Rice Energy may use other descriptions of volumes of potentially recoverable hydrocarbon resources throughout this presentation that the SEC does not permit to be included
in SEC filings. These broader classifications do not constitute reserves as defined by the SEC, and Rice Energy does not attempt to distinguish these classifications from probable or possible reserves as defined by SEC guidelines.
Rice Energy’s estimates of EURs have been prepared by its independent reserve engineers. These estimates are by their nature more speculative than estimates of proved, probable and possible reserves and accordingly are
subject to substantially greater risk of being actually realized, particularly in areas or zones where there has been limited or no drilling history. Rice Energy includes these estimates to demonstrate what it believes to be the
potential for future drilling and production by the company. Actual locations drilled and quantities that may be ultimately recovered from Rice Energy’s properties will differ substantially. In addition, Rice Energy has made no
commitment to drill all of the drilling locations which have been attributed to these quantities. Ultimate recoveries will be dependent upon numerous factors, including actual encountered geological conditions, the impact of
future oil and gas pricing, exploration and development costs, and Rice Energy’s future drilling decisions and budgets based upon its future evaluation of risk, returns and the availability of capital and, in many areas, the outcome
of negotiation of drilling arrangements with holders of adjacent or fractional interest leases. Estimates of resource potential and other figures may change significantly as development of Rice Energy’s properties provide
additional data, and, therefore, actual quantities that may ultimately be recovered will likely differ from these estimates.
Rice Energy’s forecast and expectations for future periods are dependent upon many assumptions, including estimates of production decline rates from existing wells, the undertaking and outcome of future drilling activity and
activity that may be affected by significant commodity price declines or drilling cost increases.
Certain of Rice Energy's wells are named after superheroes and monster trucks, some of which may be trademarked. Despite their size and strength, Rice Energy's wells are in no manner affiliated with such superheroes or
monster trucks.
Initial production rates are subject to decline over time and should not be regarded as reflective of sustained production levels. In particular, production from horizontal drilling in shale oil and natural gas resource plays and tight
natural gas plays that are stimulated with extensive pressure fracturing are typically characterized by significant early declines in production rates.
www.ricemidstream.com3
Non-GAAP Financial MeasuresRMP Adjusted EBITDA, Distributable Cash Flow and DCF Coverage Ratio
Adjusted EBITDA is a supplemental non-GAAP financial measure that is used by management and external users of RMP’s consolidated financial statements, such as securities analysts, investors and lenders. Management defines Adjusted EBITDA as net income (loss) before interest expense, depreciation expense, amortization expense, non-cash stock compensation expense, amortization of deferred financing costs and other non-recurring items. Adjusted EBITDA is not a measure of net income as determined by GAAP.
Distributable cash flow and DCF coverage ratio are supplemental non-GAAP financial measures that are used by management and external users of RMP’s consolidated financial statements, such as securities analysts, investors and lenders. Management definesdistributable cash flow as Adjusted EBITDA less cash interest expense and estimated maintenance capital expenditures. Management defines DCF coverage ratio as distributable cash flow divided by total distributions declared. Distributable cash flow does not reflect changes in working capital balances and is not a presentation made in accordance with GAAP.
Adjusted EBITDA, distributable cash flow and DCF coverage ratio are non-GAAP supplemental financial measures that management and external users of RMP’s consolidated financial statements, such as industry analysts, investors, lenders and rating agencies, may use to assess the financial performance of RMP’s assets, without regard to financing methods, capital structure or historical cost basis; RMP’s operating performance and return on capital as compared to other companies in the midstream energy sector, without regard to historical cost basis or, in the case of Adjusted EBITDA, financing or capital structure; RMP’s ability to incur and service debt and fund capital expenditures; the ability of RMP’s assets to generate sufficient cash flow to make distributions to RMP’s unitholders; and the viability of acquisitions and other capital expenditure projects and the returns on investment of various investment opportunities.
Management believes that the presentation of Adjusted EBITDA, distributable cash flow and DCF coverage ratio will provide useful information to investors in assessing RMP’s financial condition and results of operations. The GAAP measures most directly comparable to Adjusted EBITDA and distributable cash flow is net income. RMP’s non-GAAP financial measures of Adjusted EBITDA and distributable cash flow should not be considered as an alternative to GAAP net income. Each of Adjusted EBITDA and distributable cash flow has important limitations as an analytical tool because it excludes some but not all items that affect net income. You should not consider Adjusted EBITDA, distributable cash flow or DCF coverage ratio in isolation or as a substitute for analysis of RMP’s results as reported under GAAP. Because Adjusted EBITDA and distributable cash flow and DCF coverage ratio may be defined differently by other companies in the industry, RMP’s definitions of Adjusted EBITDA, distributable cash flow and DCF coverage ratio may not be comparable to similarly titled measures of other companies, thereby diminishing its utility.
Management has not provided projected net income or reconciliations of its projected Adjusted EBITDA and projected distributable cash flow to projected net income, the most comparable financial measure calculated in accordance with GAAP because this metricincludes the impact of certain non-cash items that management is unable to project with any reasonable degree of accuracy without unreasonable effort.
Further, management does not provide guidance with respect to the intra-year timing of its capital spending, which impact debt and equity and equity earnings, among other items, that are reconciling items between Adjusted EBITDA and net income. The timing of capital expenditures is volatile as it depends on weather, regulatory approvals, contractor availability, system performance and various other items. Management provides a range for the forecasts of Adjusted EBITDA and distributable cash flow to allow for the variability in the timing of spending and the impact on the related reconciling items, many of which interplay with each other. Therefore, the reconciliation of Adjusted EBITDA to projected net income is not available without unreasonable effort.
Rice Energy Adjusted EBITDAX and Further Adjusted EBITDAX
Adjusted EBITDAX and Further Adjusted EBITDAX are supplemental non-GAAP financial measures that are used by management and external users of RICE’s consolidated financial statements, such as industry analysts, investors, lenders and rating agencies. RICE defines Adjusted EBITDAX as net income (loss) before non-controlling interest; interest expense; income taxes; depreciation, depletion and amortization; amortization of deferred financing costs; amortization of intangible assets; derivative fair value (gain) loss, excluding net cash receipts on settled derivative instruments; non-cash stock compensation expense; non-cash incentive unit expense; exploration expenses; and other non-recurring items. RICE defines Further Adjusted EBIDAX as Adjusted EBIDAX after non-controlling interest and water revenue adjustment. Neither Adjusted EBITDAX nor Further Adjusted EBITDAX is a measure of net income as determined by United States generally accepted accounting principles, or GAAP.
Management believes Adjusted EBITDAX is useful because it allows them to more effectively evaluate RICE’s operating performance and compare the results of RICE’s operations from period to period and against its peers without regard to its financing methods or capital structure. RICE excludes the items listed above from net income (loss) in arriving at Adjusted EBITDAX because these amounts can vary substantially from company to company within the industry depending upon accounting methods and book values of assets, capital structures and the method by which the assets were acquired. Management believes Further Adjusted EBITDAX is useful because it allows them to assess the level of consolidated leverage of the company and compare this level to peers. The adjustments made to Adjusted EBITDAX to calculate Further Adjusted EBITDAX address the intercompany eliminations of items impacting Adjusted EBITDAX as a result of the consolidation of RMP, the outstanding indebtedness of which is consolidated with that of the company without regard to non-controlling interest. These adjustments include the addition of non-controlling interest as well as a water revenue adjustment attributable to charges for fresh water delivery services and produced water hauling services provided by RMP to the company, a charge that generates revenue for RMP but does not have a corresponding expense at the company level, as such costs are capitalized.
Adjusted EBITDAX and Further Adjusted EBITDAX should not be considered as alternatives to, or more meaningful than, net income as determined in accordance with GAAP or as indicators of RICE’s operating performance or liquidity. Certain items excluded from Adjusted EBITDAX and Further Adjusted EBITDAX are significant components in understanding and assessing a company’s financial performance, such as a company’s cost of capital and tax structure, as well as the historic costs of depreciable assets, none of which are components of Adjusted EBITDAX or Further Adjusted EBITDAX. RICE’s computations of Adjusted EBITDAX and Further Adjusted EBITDAX may not be comparable to other similarly titled measures of other companies. RICE believes that these measures are a widely followed measures of operating performance used by investors.
RMH Adjusted EBITDA
RMH Adjusted EBITDA is a supplemental non-GAAP financial measure that is used by management and external users of the RMH’s financial statements, such as industry analysts, investors, lenders and rating agencies. RMH defines Adjusted EBITDA as operating income (loss) before incentive unit expense; acquisition expense; impairment of fixed assets; stock compensation expense; depreciation, depletion and amortization; and other non-recurring items. Adjusted EBITDA is not a measure of operating income as determined by United States generally accepted accounting principles, or GAAP. Management believes RMH Adjusted EBITDA is useful because it allows them to more effectively evaluate RMH’s operating performance and compare the results of RMH’s operations from period to period without regard to its financing methods or capital structure. RMH excludes the items listed above from operating income (loss) in arriving at Adjusted EBITDA because these amounts can vary substantially from company to company within the industry depending upon accounting methods and book values of assets, capital structures and the method by which the assets were acquired.
RMH Adjusted EBITDA should not be considered as an alternative to, or more meaningful than, operating income as determined in accordance with GAAP or as indicators of RMH’s operating performance or liquidity. Certain items excluded from Adjusted EBITDA aresignificant components in understanding and assessing a company’s financial performance, such as a company’s cost of capital, as well as the historic costs of depreciable assets, none of which are components of Adjusted EBITDA. RMH’s computations of Adjusted EBITDA may not be comparable to other similarly titled measures of other companies. RICE believes that the measure is a widely followed measures of operating performance used by investors.
Management has not provided projected RMH net income or a reconciliation of projected RMH Adjusted EBITDA to projected RMH net income, the most comparable financial measure calculated in accordance with GAAP. Management is unable to project RMH net income because this metric includes the impact of certain non-cash items such as depreciation expense that management is unable to project with any reasonable degree of accuracy without unreasonable effort. Therefore, management is unable to provide projected RMH net income, or the related reconciliation of projected RMH Adjusted EBITDA to projected net income.
Further, management does not provide guidance with respect to the intra-year timing of its capital spending, which impact debt and equity and equity earnings, among other items, that are reconciling items between Adjusted EBITDA and net income. The timing of capital expenditures is volatile as it depends on weather, regulatory approvals, contractor availability, system performance and various other items. Management provides a range for the forecasts of Adjusted EBITDA and distributable cash flow to allow for the variability in the timing of spending and the impact on the related reconciling items, many of which interplay with each other. Therefore, the reconciliation of Adjusted EBITDA to projected net income is not available without unreasonable effort.
www.ricemidstream.com4
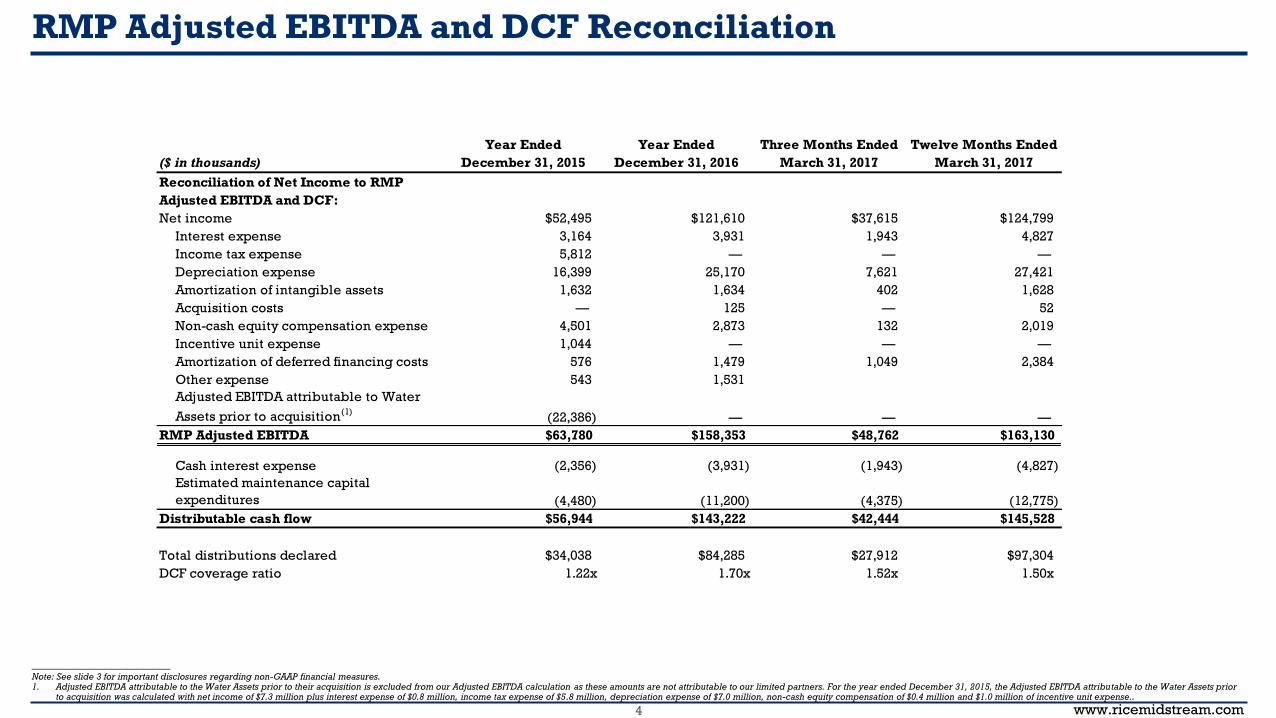
RMP Adjusted EBITDA and DCF Reconciliation
__________________________Note: See slide 3 for important disclosures regarding non-GAAP financial measures. 1. Adjusted EBITDA attributable to the Water Assets prior to their acquisition is excluded from our Adjusted EBITDA calculation as these amounts are not attributable to our limited partners. For the year ended December 31, 2015, the Adjusted EBITDA attributable to the Water Assets prior
to acquisition was calculated with net income of $7.3 million plus interest expense of $0.8 million, income tax expense of $5.8 million, depreciation expense of $7.0 million, non-cash equity compensation of $0.4 million and $1.0 million of incentive unit expense..
Year Ended Year Ended Three Months Ended Twelve Months Ended
($ in thousands) December 31, 2015 December 31, 2016 March 31, 2017 March 31, 2017
Reconciliation of Net Income to RMP
Adjusted EBITDA and DCF:
Net income $52,495 $121,610 $37,615 $124,799
Interest expense 3,164 3,931 1,943 4,827
Income tax expense 5,812 — — —
Depreciation expense 16,399 25,170 7,621 27,421
Amortization of intangible assets 1,632 1,634 402 1,628
Acquisition costs — 125 — 52
Non-cash equity compensation expense 4,501 2,873 132 2,019
Incentive unit expense 1,044 — — —
Amortization of deferred financing costs 576 1,479 1,049 2,384
Other expense 543 1,531
Adjusted EBITDA attributable to Water
Assets prior to acquisition(1)
(22,386) — — —
RMP Adjusted EBITDA $63,780 $158,353 $48,762 $163,130
Cash interest expense (2,356) (3,931) (1,943) (4,827)
Estimated maintenance capital
expenditures (4,480) (11,200) (4,375) (12,775)
Distributable cash flow $56,944 $143,222 $42,444 $145,528
Total distributions declared $34,038 $84,285 $27,912 $97,304
DCF coverage ratio 1.22x 1.70x 1.52x 1.50x
www.ricemidstream.com5
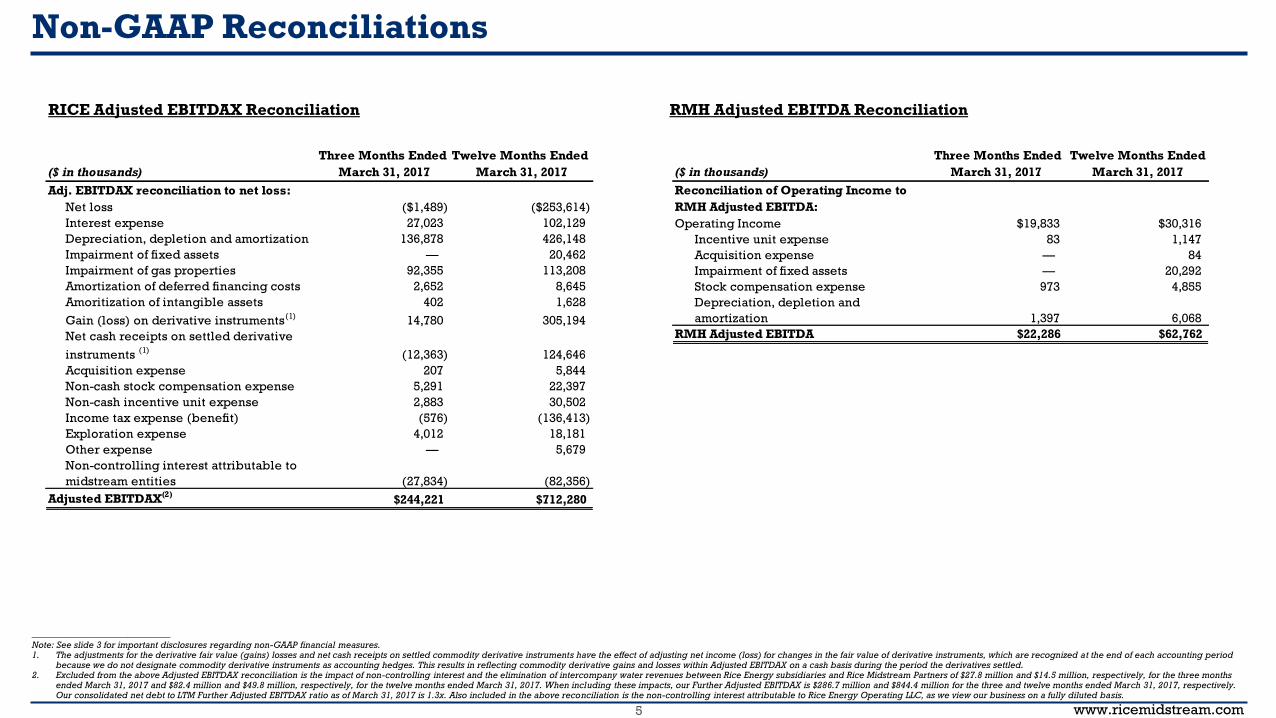
Non-GAAP Reconciliations
__________________________Note: See slide 3 for important disclosures regarding non-GAAP financial measures. 1. The adjustments for the derivative fair value (gains) losses and net cash receipts on settled commodity derivative instruments have the effect of adjusting net income (loss) for changes in the fair value of derivative instruments, which are recognized at the end of each accounting period
because we do not designate commodity derivative instruments as accounting hedges. This results in reflecting commodity derivative gains and losses within Adjusted EBITDAX on a cash basis during the period the derivatives settled.2. Excluded from the above Adjusted EBITDAX reconciliation is the impact of non-controlling interest and the elimination of intercompany water revenues between Rice Energy subsidiaries and Rice Midstream Partners of $27.8 million and $14.5 million, respectively, for the three months
ended March 31, 2017 and $82.4 million and $49.8 million, respectively, for the twelve months ended March 31, 2017. When including these impacts, our Further Adjusted EBITDAX is $286.7 million and $844.4 million for the three and twelve months ended March 31, 2017, respectively. Our consolidated net debt to LTM Further Adjusted EBITDAX ratio as of March 31, 2017 is 1.3x. Also included in the above reconciliation is the non-controlling interest attributable to Rice Energy Operating LLC, as we view our business on a fully diluted basis.
RICE Adjusted EBITDAX Reconciliation RMH Adjusted EBITDA Reconciliation
Three Months Ended Twelve Months Ended
($ in thousands) March 31, 2017 March 31, 2017
Reconciliation of Operating Income to
RMH Adjusted EBITDA:
Operating Income $19,833 $30,316
Incentive unit expense 83 1,147
Acquisition expense — 84
Impairment of fixed assets — 20,292
Stock compensation expense 973 4,855
Depreciation, depletion and
amortization 1,397 6,068
RMH Adjusted EBITDA $22,286 $62,762
Three Months Ended Twelve Months Ended
($ in thousands) March 31, 2017 March 31, 2017
Net loss ($1,489) ($253,614)
Interest expense 27,023 102,129
Depreciation, depletion and amortization 136,878 426,148
Impairment of fixed assets — 20,462
Impairment of gas properties 92,355 113,208
Amortization of deferred financing costs 2,652 8,645
Amoritization of intangible assets 402 1,628
Gain (loss) on derivative instruments(1)
14,780 305,194
Net cash receipts on settled derivative
instruments (1)
(12,363) 124,646
Acquisition expense 207 5,844
Non-cash stock compensation expense 5,291 22,397
Non-cash incentive unit expense 2,883 30,502
Income tax expense (benefit) (576) (136,413)
Exploration expense 4,012 18,181
Other expense — 5,679
Non-controlling interest attributable to
midstream entities (27,834) (82,356)
Adjusted EBITDAX(2)
$244,221 $712,280
Adj. EBITDAX reconciliation to net loss:

www.ricemidstream.com6
Top-Tier Distribution Growth
Drive Excellence through Innovation and Stewardship
Leverage Sponsor for Growth Visibility
Maintain a Strong, Conservative Balance Sheet
Provide Excellent Customer Service
Invest in the Core
RMP Strategy
www.ricemidstream.com7
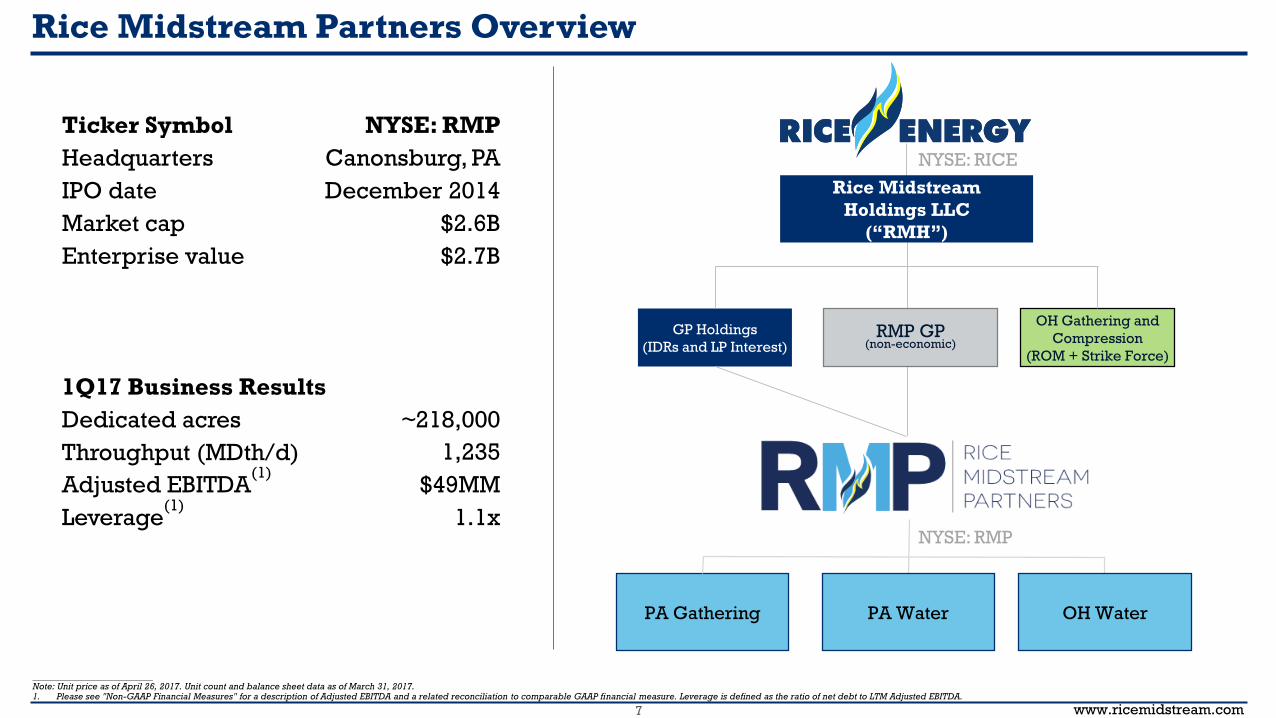
Ticker Symbol
Headquarters
IPO date
Market cap
Enterprise value
1Q17 Business Results
Dedicated acres
Throughput (MDth/d)
Adjusted EBITDA(1)
Leverage(1)
Rice Midstream Partners Overview
__________________________Note: Unit price as of April 26, 2017. Unit count and balance sheet data as of March 31, 2017.1. Please see "Non-GAAP Financial Measures" for a description of Adjusted EBITDA and a related reconciliation to comparable GAAP financial measure. Leverage is defined as the ratio of net debt to LTM Adjusted EBITDA.
NYSE: RMP
Canonsburg, PA
December 2014
$2.6B
$2.7B
~218,000
1,235
$49MM
1.1x
OH Gathering and
Compression
(ROM + Strike Force)
GP Holdings
(IDRs and LP Interest)
Rice Midstream
Holdings LLC
(“RMH”)
RMP GP(non-economic)
PA Water OH WaterPA Gathering
NYSE: RICE
NYSE: RMP
www.ricemidstream.com8
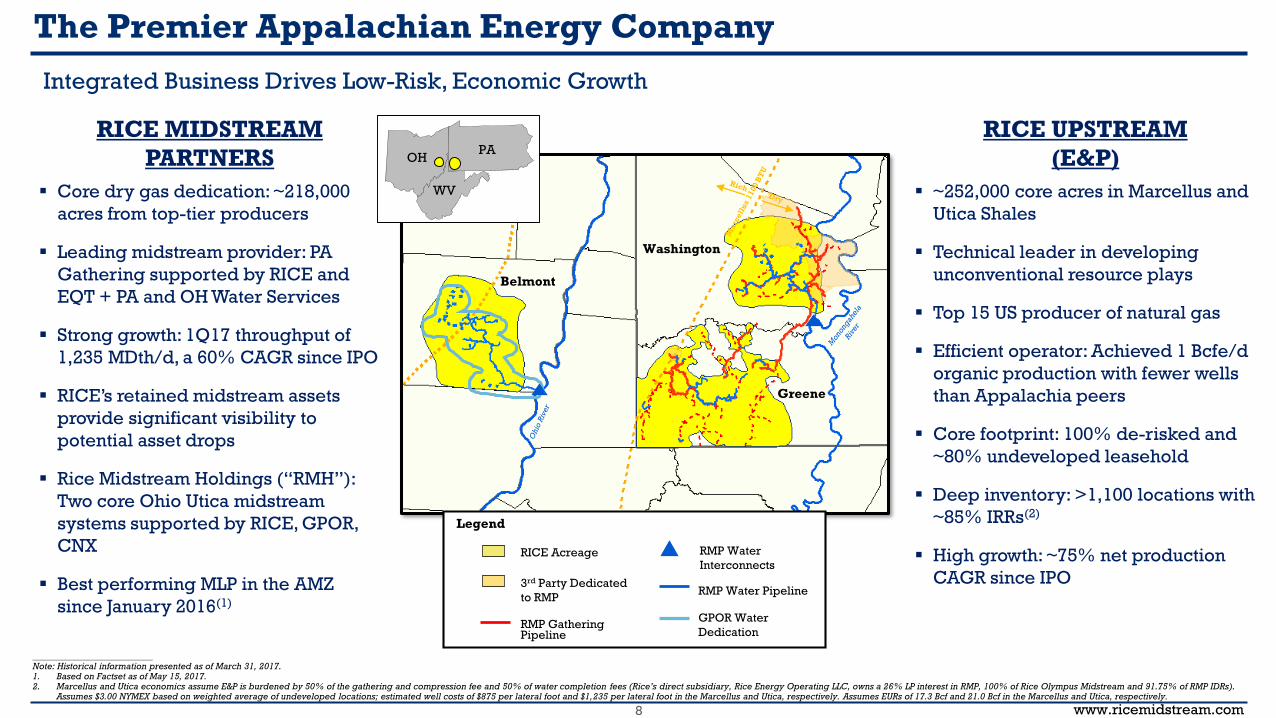
The Premier Appalachian Energy Company
RICE UPSTREAM
(E&P)
▪ ~252,000 core acres in Marcellus and
Utica Shales
▪ Technical leader in developing
unconventional resource plays
▪ Top 15 US producer of natural gas
▪ Efficient operator: Achieved 1 Bcfe/d
organic production with fewer wells
than Appalachia peers
▪ Core footprint: 100% de-risked and
~80% undeveloped leasehold
▪ Deep inventory: >1,100 locations with
~85% IRRs(2)
▪ High growth: ~75% net production
CAGR since IPO
RICE MIDSTREAM
PARTNERS
▪ Core dry gas dedication: ~218,000
acres from top-tier producers
▪ Leading midstream provider: PA
Gathering supported by RICE and
EQT + PA and OH Water Services
▪ Strong growth: 1Q17 throughput of
1,235 MDth/d, a 60% CAGR since IPO
▪ RICE’s retained midstream assets
provide significant visibility to
potential asset drops
▪ Rice Midstream Holdings (“RMH”):
Two core Ohio Utica midstream
systems supported by RICE, GPOR,
CNX
▪ Best performing MLP in the AMZ
since January 2016(1)
__________________________Note: Historical information presented as of March 31, 2017.1. Based on Factset as of May 15, 2017.2. Marcellus and Utica economics assume E&P is burdened by 50% of the gathering and compression fee and 50% of water completion fees (Rice’s direct subsidiary, Rice Energy Operating LLC, owns a 26% LP interest in RMP, 100% of Rice Olympus Midstream and 91.75% of RMP IDRs).
Assumes $3.00 NYMEX based on weighted average of undeveloped locations; estimated well costs of $875 per lateral foot and $1,235 per lateral foot in the Marcellus and Utica, respectively. Assumes EURs of 17.3 Bcf and 21.0 Bcf in the Marcellus and Utica, respectively.
Integrated Business Drives Low-Risk, Economic Growth
Beaver
3rd Party Dedicated
to RMP
GPOR Water
Dedication
RMP Water
InterconnectsRICE Acreage
RMP Gathering Pipeline
RMP Water Pipeline
Washington
Belmont
Greene
OHPA
WV
Legend

www.ricemidstream.com9
$64
$158
$193
2015 2016 2017E
▪ ~218,000 acres dedicated in core of dry gas Marcellus
▪ Primary customers: RICE and EQT
▪ 100% of cash flow supported by long-term, fee-based contracts
▪ 2017E budget focused on Greene County build-out, funded through projected cash flow/cash on hand and revolver
Significant RMP Adj. EBITDA Growth(1) ($MM)
RMP: Core System and Execution Drives High Growth
__________________________1. Please see "Non-GAAP Financial Measures" for a description of Adjusted EBITDA and related reconciliations to comparable GAAP financial measures.
Gathering
&
Compression
Water
$150
$43
Beaver3rd Party Dedicated
to RMP
GPOR Water
DedicationRMP Water
Interconnects
RICE Acreage RMP Gathering Pipeline
RMP Water Pipeline
Washington
Belmont
Greene
OHPA
WV
Legend

www.ricemidstream.com10
Premier Appalachian MLP
Peer 1 Peer 2 Peer 3 Peer 4
✓ ✓ ✓ ✓✓
✓ ✓ ✓ ✓✓
20%+ 2017E
Distribution
Growth
<2.0x YE17E
Leverage(1)
✓ ✓ ✓ ✓✓>1.35x 2017E
DCF
Coverage(1)
__________________________Note: Peers include AM, CNNX, DM and EQM. Based on Factset and public company estimates as of February 15, 2017. Leverage represents a ratio of net debt to Adjusted EBITDA. 1. Please see "Non-GAAP Financial Measures" for a description of Adjusted EBITDA and DCF coverage ratio.
✓ ✓ ✓ ✓✓>1.4x 2018E
DCF
Coverage(1)
✓ ✓ ✓ ✓✓<2.5x YE18E
Leverage(1)
www.ricemidstream.com11
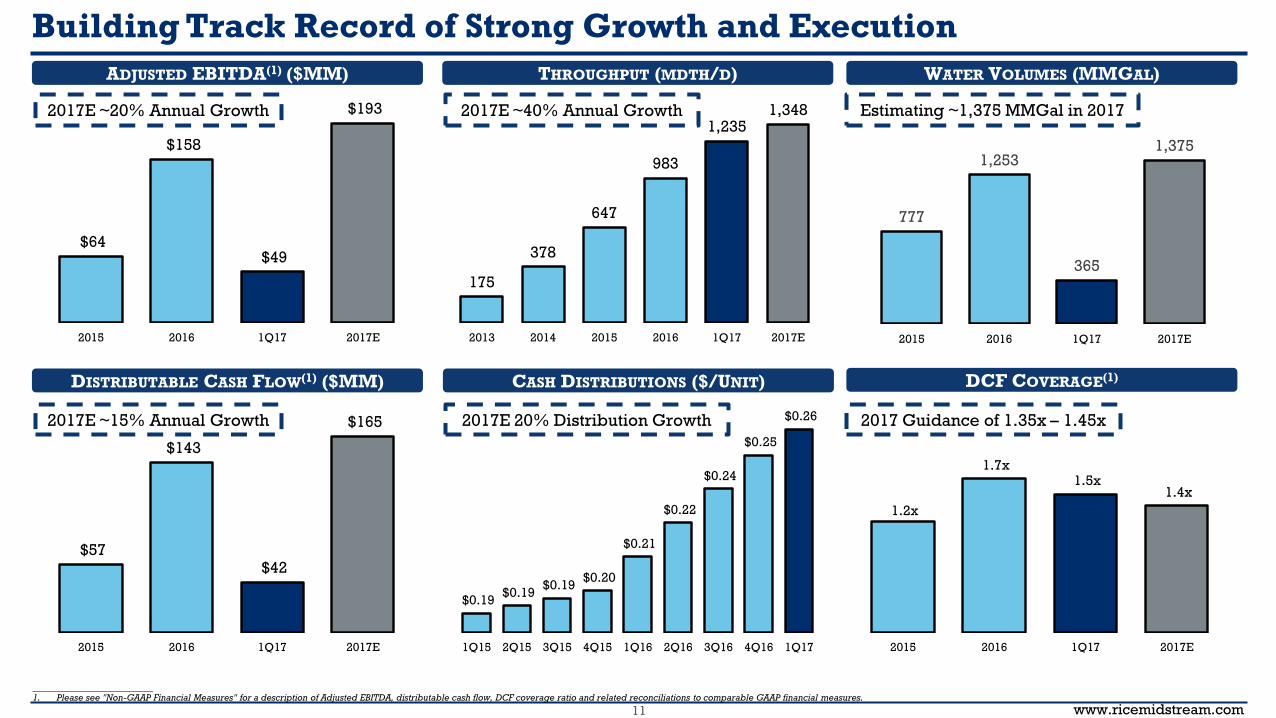
$64
$158
$49
$193
2015 2016 1Q17 2017E
175
378
647
983
1,2351,348
2013 2014 2015 2016 1Q17 2017E
$57
$143
$42
$165
2015 2016 1Q17 2017E
$0.19 $0.19
$0.19 $0.20
$0.21
$0.22
$0.24
$0.25
$0.26
1Q15 2Q15 3Q15 4Q15 1Q16 2Q16 3Q16 4Q16 1Q17
1.2x
1.7x 1.5x
1.4x
2015 2016 1Q17 2017E
Building Track Record of Strong Growth and Execution
CASH DISTRIBUTIONS ($/UNIT)
ADJUSTED EBITDA(1) ($MM) THROUGHPUT (MDTH/D)
DISTRIBUTABLE CASH FLOW(1) ($MM)
WATER VOLUMES (MMGAL)
DCF COVERAGE(1)
2017E 20% Distribution Growth2017E ~15% Annual Growth
2017E ~20% Annual Growth 2017E ~40% Annual Growth Estimating ~1,375 MMGal in 2017
2017 Guidance of 1.35x – 1.45x
__________________________1. Please see "Non-GAAP Financial Measures" for a description of Adjusted EBITDA, distributable cash flow, DCF coverage ratio and related reconciliations to comparable GAAP financial measures.
777
1,253
365
1,375
2015 2016 1Q17 2017E

www.ricemidstream.com12
–
500,000
1,000,000
1,500,000
2,000,000
2,500,000
3,000,000
3,500,000
Jan '14 Jan '15 Jan '16 Jan '17
Unparalleled Midstream Growth
RICE has positioned itself as the premier Appalachian core dry gas midstream player
1Q 2017 throughput of ~2,204 MDth/d through RMH and RMP midstream systems
RMP System: 1,235 MDth/d (19% 3rd Party)
RMH System: 969 MDth/d (52% 3rd Party)
2017E Throughput
Dth
/d
RMH – 3rd
Party
RMH – RICE
Operated
RMP – 3rd
Party
RMP – RICE
Operated

www.ricemidstream.com13
Jan '14 Jan '15 Jan '16 Jan '17
RMP 3rd Party Dedications from Top Operators in the Basin
__________________________1. Calculated based on weighted average historic throughput from January 1, 2015 through December 31, 2016.
▪ High quality 3rd party operators with active development programs and healthy returns
▪ EQT is primary 3rd party customer and is a technical leader with a strong balance sheet to support development
▪ ~29,000 gross acres dedicated in Pennsylvania
– 232 MDth/d gathered in 1Q17 (19% of RMP’s throughput)
PA 3rd Party Gathering Dedication Summary
Dedicated Acreage 29,000
1Q17 Throughput 232 MDth/d
Remaining Contract Term ~10 years (wtd. avg.)
Gathering Fee(1) $0.40/Dth
Expect 20% of
2017 throughput
from top-tier third-
party producers
2017E
3rd Party
RICE
Operated
www.ricemidstream.com14
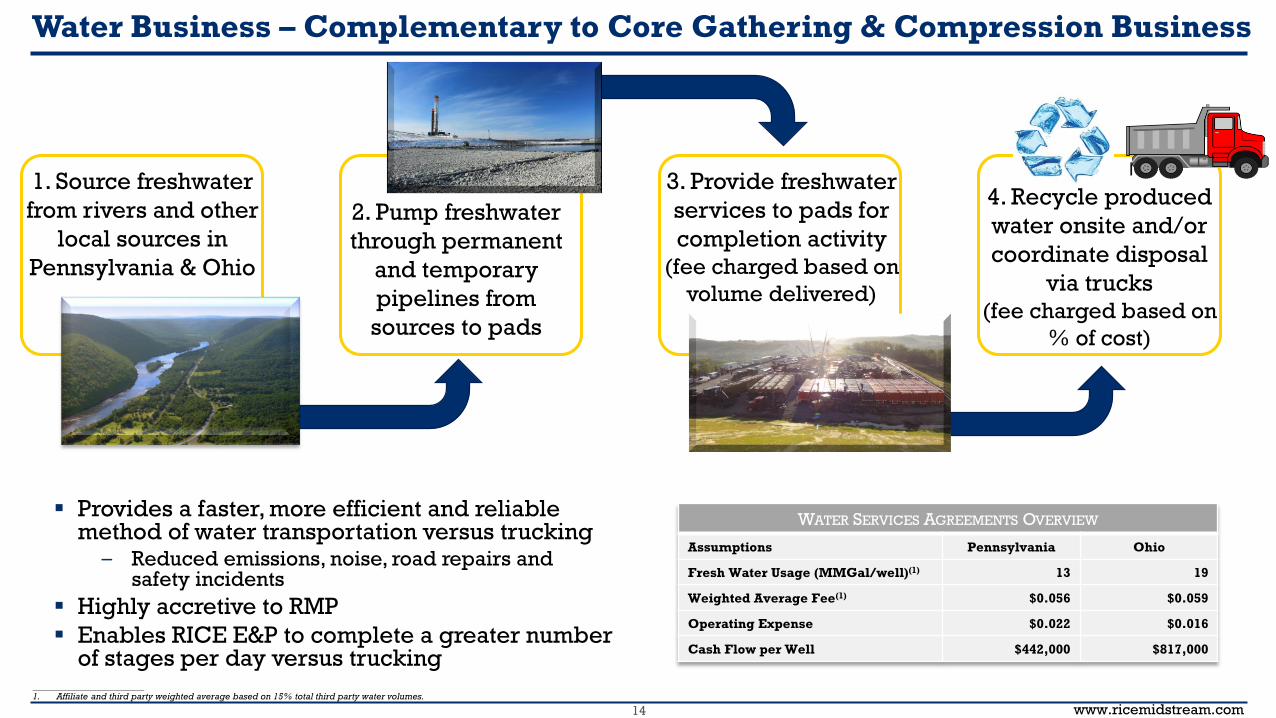
Water Business – Complementary to Core Gathering & Compression Business
4. Recycle produced
water onsite and/or
coordinate disposal
via trucks
(fee charged based on
% of cost)
2. Pump freshwater
through permanent
and temporary
pipelines from
sources to pads
1. Source freshwater
from rivers and other
local sources in
Pennsylvania & Ohio
3. Provide freshwater
services to pads for
completion activity
(fee charged based on
volume delivered)
▪ Provides a faster, more efficient and reliable method of water transportation versus trucking
– Reduced emissions, noise, road repairs and safety incidents
▪ Highly accretive to RMP
▪ Enables RICE E&P to complete a greater number of stages per day versus trucking
__________________________1. Affiliate and third party weighted average based on 15% total third party water volumes.
WATER SERVICES AGREEMENTS OVERVIEW
Assumptions Pennsylvania Ohio
Fresh Water Usage (MMGal/well)(1) 13 19
Weighted Average Fee(1) $0.056 $0.059
Operating Expense $0.022 $0.016
Cash Flow per Well $442,000 $817,000

www.ricemidstream.com15
RMH: Core Utica Gathering Systems with High Growth
~166,000 dedicated acres with ~70% from high quality 3rd party customers
▪ ROM: 100% owned gathering and compression system in Central Belmont
– Dedication from RICE and GPOR covering ~68,000 core acres in Belmont
– Buildout substantially complete with strong growth outlook in 2018+
– RMH evaluating sale of over one-third of ROM to RMP in second half 2017
▪ Strike Force: Midstream joint venture with GPOR to invest in gathering and compression assets
– Dedication from GPOR and CNX covering ~98,000 core acres in Belmont and Monroe
– Ownership: RICE 75% and GPOR 25%
– Buildout in progress with rapid growth profile driving drop down potential
OHPA
WV
Legend
Rice Olympus Gathering GPOR Dedicated to RICE
RICE Acreage Dedicated to 3rd Party
Strike Force JV AMI
Belmont
Monroe
RICE Acreage
Strike Force Gathering
www.ricemidstream.com16
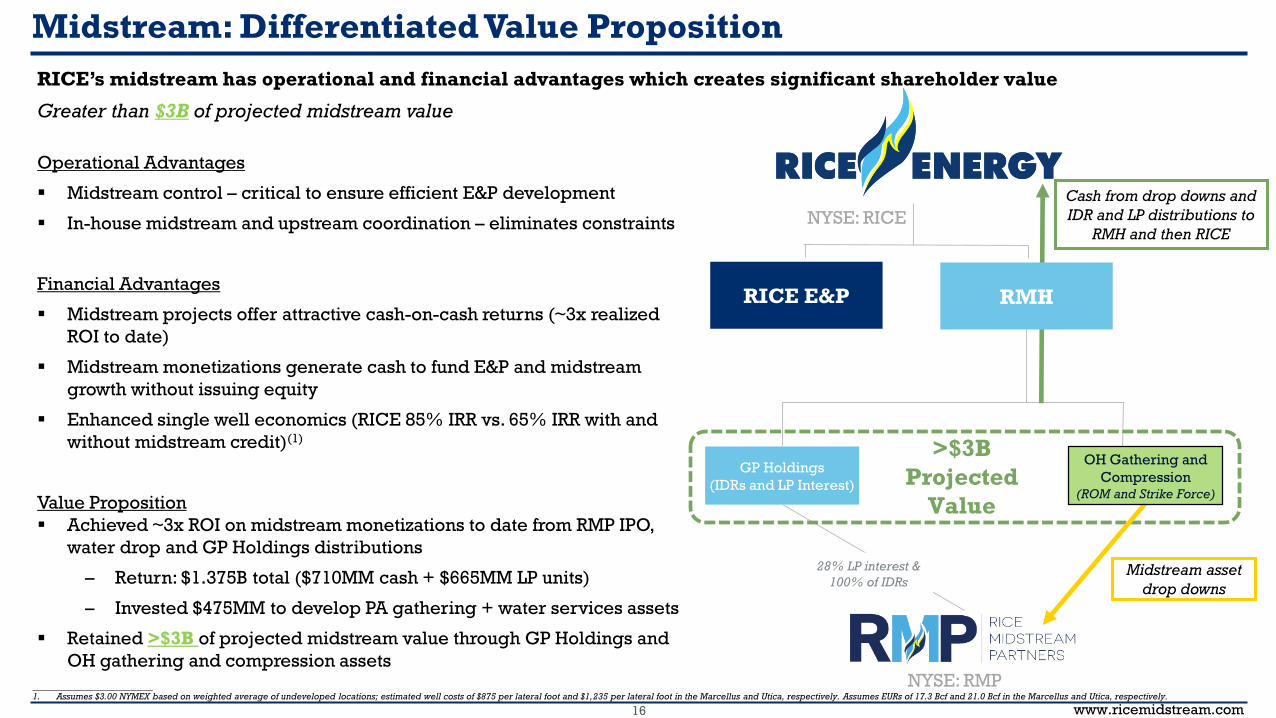
Midstream: Differentiated Value Proposition
Operational Advantages
▪ Midstream control – critical to ensure efficient E&P development
▪ In-house midstream and upstream coordination – eliminates constraints
Financial Advantages
▪ Midstream projects offer attractive cash-on-cash returns (~3x realized
ROI to date)
▪ Midstream monetizations generate cash to fund E&P and midstream
growth without issuing equity
▪ Enhanced single well economics (RICE 85% IRR vs. 65% IRR with and
without midstream credit)(1)
Value Proposition
▪ Achieved ~3x ROI on midstream monetizations to date from RMP IPO,
water drop and GP Holdings distributions
– Return: $1.375B total ($710MM cash + $665MM LP units)
– Invested $475MM to develop PA gathering + water services assets
▪ Retained >$3B of projected midstream value through GP Holdings and
OH gathering and compression assets
GP Holdings
(IDRs and LP Interest)
RICE E&P
Cash from drop downs and
IDR and LP distributions to
RMH and then RICE
Midstream asset
drop downs
>$3B
Projected
Value
RMH
28% LP interest &
100% of IDRs
RICE’s midstream has operational and financial advantages which creates significant shareholder value
Greater than $3B of projected midstream value
OH Gathering and
Compression(ROM and Strike Force)
__________________________1. Assumes $3.00 NYMEX based on weighted average of undeveloped locations; estimated well costs of $875 per lateral foot and $1,235 per lateral foot in the Marcellus and Utica, respectively. Assumes EURs of 17.3 Bcf and 21.0 Bcf in the Marcellus and Utica, respectively.
NYSE: RICE
NYSE: RMP

www.ricemidstream.com17
RMP Well Positioned for Continued Strong Growth
▪ Core Midstream Footprint and Prolific Organic Growth
– ~218,000 acres dedicated from some of the most active operators in SW Appalachia
– Well positioned to deliver 2017 expected 20% distribution growth with current asset base, while maintaining projected DCF coverage(1) of 1.35x – 1.45x
– Affirming top-tier annual distribution growth target of 20% through 2023
– Targeting ~1.4x DCF coverage ratio(1) and leverage less than 2.5x through 2019
▪ Financial Strength – Clean Balance Sheet and Ample Liquidity
– Low 1Q17 leverage(1) of 1.1x, expecting to exit 2017 <2.0x
– 1Q17 liquidity of $673MM consisting of $660MM revolving credit facility availability and $13MM cash on hand
▪ Premier E&P Sponsorship with RICE
– Top-tier well results generate pre-tax single-well returns of ~85%(2)
– Healthy balance sheet and low consolidated leverage(3) of 1.3x
– Concentrated core dry gas position + multi-well pad drilling = minimal RMP capex to meaningfully increase gathering throughput, compression and water delivery volumes
▪ Attractive Drop Down Potential
– ~166,000 dedicated acres with ~70% from high quality 3rd party customers
– Strong expected 2017 RMH throughput growth of ~65% to ~1,155 MDth/d
– RMH evaluating sale of over one-third of ROM to RMP in 2H17
__________________________1. Please see "Non-GAAP Financial Measures" for a description of Adjusted EBITDA, distributable cash flow and DCF coverage ratio. Leverage is defined as the ratio of net debt to LTM Adjusted EBITDA. 2. Marcellus and Utica economics assume E&P is burdened by 50% of the gathering and compression fee and 50% of water completion fees (Rice’s direct subsidiary, Rice Energy Operating, LLC, owns a 26% LP interest in RMP, 100% of Rice Olympus Midstream and 91.75% of RMP IDRs).
Assumes $3.00 NYMEX based on weighted average of undeveloped locations; estimated well costs of $875 per lateral foot and $1,235 per lateral foot in the Marcellus and Utica, respectively. Assumes EURs of 17.3 Bcf and 21.0 Bcf in the Marcellus and Utica, respectively.3. Please see “Non-GAAP Financial Measures” for a description of Adjusted EBITDAX, Further Adjusted EBITDAX and a related reconciliation to the comparable GAAP financial measure. Consolidated leverage is defined as the ratio of net debt to LTM Further Adjusted EBITDAX.
www.ricemidstream.com18
Rice Energy Overview
www.ricemidstream.com19
861
194
47
1,102
92%
72%
19%
85%
0%
30%
60%
90%
0
200
400
600
800
1,000
1,200
Marcellus OH Utica Dry OH Utica Wet Total
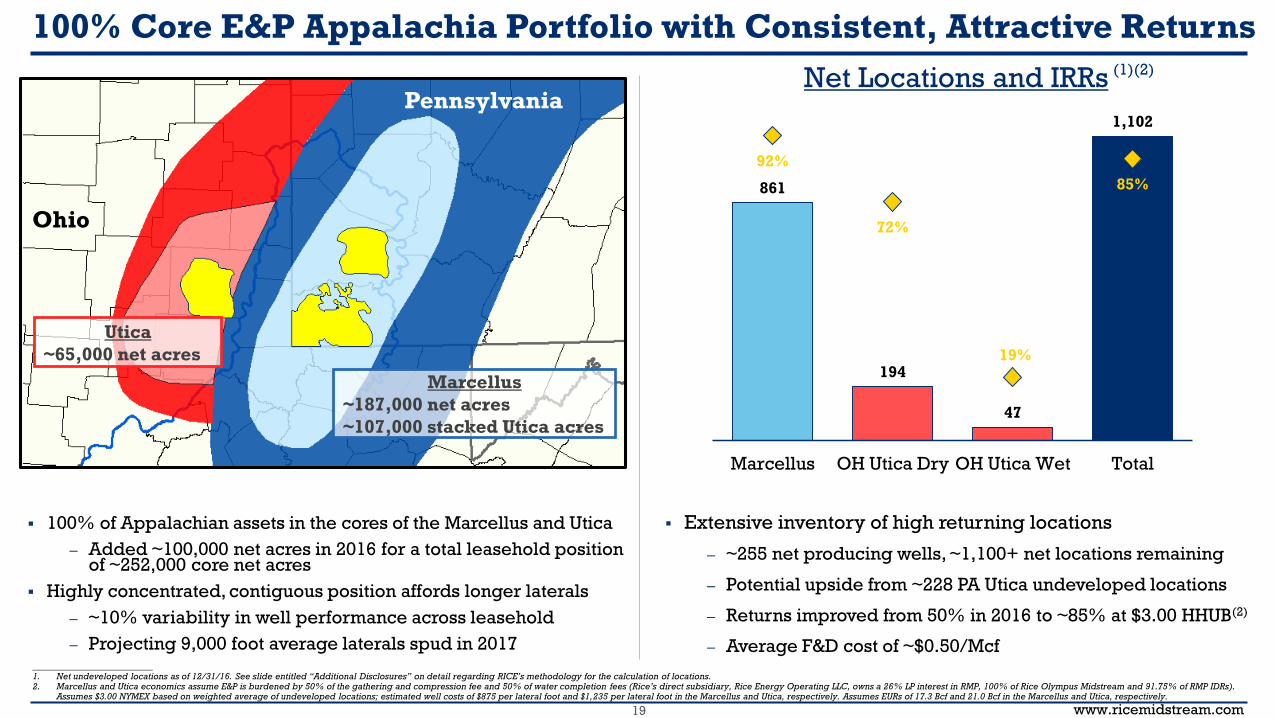
100% Core E&P Appalachia Portfolio with Consistent, Attractive Returns
▪ 100% of Appalachian assets in the cores of the Marcellus and Utica
– Added ~100,000 net acres in 2016 for a total leasehold position of ~252,000 core net acres
▪ Highly concentrated, contiguous position affords longer laterals
– ~10% variability in well performance across leasehold
– Projecting 9,000 foot average laterals spud in 2017__________________________1. Net undeveloped locations as of 12/31/16. See slide entitled “Additional Disclosures” on detail regarding RICE’s methodology for the calculation of locations.2. Marcellus and Utica economics assume E&P is burdened by 50% of the gathering and compression fee and 50% of water completion fees (Rice’s direct subsidiary, Rice Energy Operating LLC, owns a 26% LP interest in RMP, 100% of Rice Olympus Midstream and 91.75% of RMP IDRs).
Assumes $3.00 NYMEX based on weighted average of undeveloped locations; estimated well costs of $875 per lateral foot and $1,235 per lateral foot in the Marcellus and Utica, respectively. Assumes EURs of 17.3 Bcf and 21.0 Bcf in the Marcellus and Utica, respectively.
Utica
~65,000 net acres
Marcellus
~187,000 net acres
~107,000 stacked Utica acres
▪ Extensive inventory of high returning locations
– ~255 net producing wells, ~1,100+ net locations remaining
– Potential upside from ~228 PA Utica undeveloped locations
– Returns improved from 50% in 2016 to ~85% at $3.00 HHUB(2)
– Average F&D cost of ~$0.50/Mcf
Net Locations and IRRs
Ohio
Pennsylvania
(1)(2)

www.ricemidstream.com20
▪ RICE’s industry-leading well results are evident in 1-4 year cumulative production per well
▪ 100% of RICE’s expected future Appalachian activity is focused within its concentrated, core acreage position
Proven, Repeatable Well Design Drives Industry-Leading Results
__________________________
Note: Data for RICE based on actuals through 3/31/17, peer data based on Pennsylvania Department of Environmental Protection production reports through 2/28/17 and Ohio Department of Natural Resources report through 12/31/16.
RICE Utica RICE Marcellus
Industry Marcellus + Utica
Days Online
SW Appalachia - Marcellus SW Appalachia - Utica
RICE MarcellusRICE Utica
Cu
mu
lati
ve
Pro
du
cti
on
pe
r 1
,00
0’
(Mc
fe)
0
200,000
400,000
600,000
800,000
1,000,000
0 500 1,000 1,500
0
200,000
400,000
600,000
800,000
1,000,000
0 500 1,000 1,500
www.ricemidstream.com21
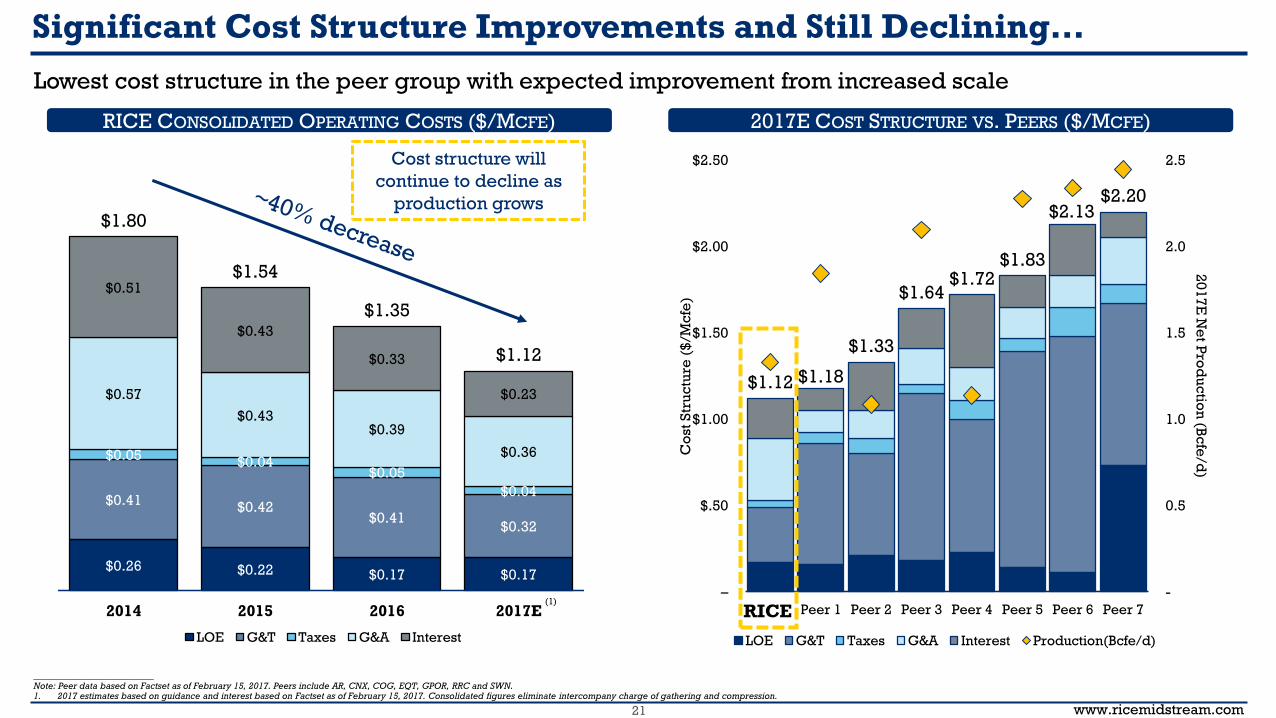
$1.12 $1.18
$1.33
$1.64 $1.72
$1.83
$2.13 $2.20
-
0.5
1.0
1.5
2.0
2.5
–
$.50
$1.00
$1.50
$2.00
$2.50
RICE Peer 1 Peer 2 Peer 3 Peer 4 Peer 5 Peer 6 Peer 7
20
17
E N
et P
rod
uc
tion
(Bc
fe/d
)
Co
st S
tru
ctu
re (
$/M
cfe
)
LOE G&T Taxes G&A Interest Production(Bcfe/d)
Significant Cost Structure Improvements and Still Declining…
$0.26 $0.22 $0.17 $0.17
$0.41$0.42
$0.41$0.32
$0.05$0.04
$0.05
$0.04
$0.57
$0.43$0.39
$0.36
$0.51
$0.43
$0.33
$0.23
$1.80
$1.54
$1.35
$1.12
2014 2015 2016 2017E
LOE G&T Taxes G&A Interest
__________________________Note: Peer data based on Factset as of February 15, 2017. Peers include AR, CNX, COG, EQT, GPOR, RRC and SWN.1. 2017 estimates based on guidance and interest based on Factset as of February 15, 2017. Consolidated figures eliminate intercompany charge of gathering and compression.
Lowest cost structure in the peer group with expected improvement from increased scale
(1)
Cost structure will
continue to decline as
production grows
RICE CONSOLIDATED OPERATING COSTS ($/MCFE) 2017E COST STRUCTURE VS. PEERS ($/MCFE)
RICE
www.ricemidstream.com22
__________________________Note: A = Actuals, E = Estimate and T = Target.1. Based on mid-point of 2017 annual Appalachia production guidance.2. Defined as fully funding D&C capital expenditures from internal E&P cash flows.3. Marcellus and Utica economics assume E&P is burdened by 50% of the gathering and compression fee and 50% of water completion fees (Rice’s direct subsidiary, Rice Energy Operating LLC, owns a 26% LP interest in RMP, 100% of Rice Olympus Midstream and 91.75% of RMP IDRs).
Assumes $3.00 NYMEX based on weighted average of undeveloped locations; estimated well costs of $875 per lateral foot and $1,235 per lateral foot in the Marcellus and Utica, respectively. Assumes EURs of 17.3 Bcf and 21.0 Bcf in the Marcellus and Utica, respectively.4. 2017 percent hedged based on 2017 net production guidance. 2018 and 2019 percent hedged based on 2018 and 2019 targeted net production.
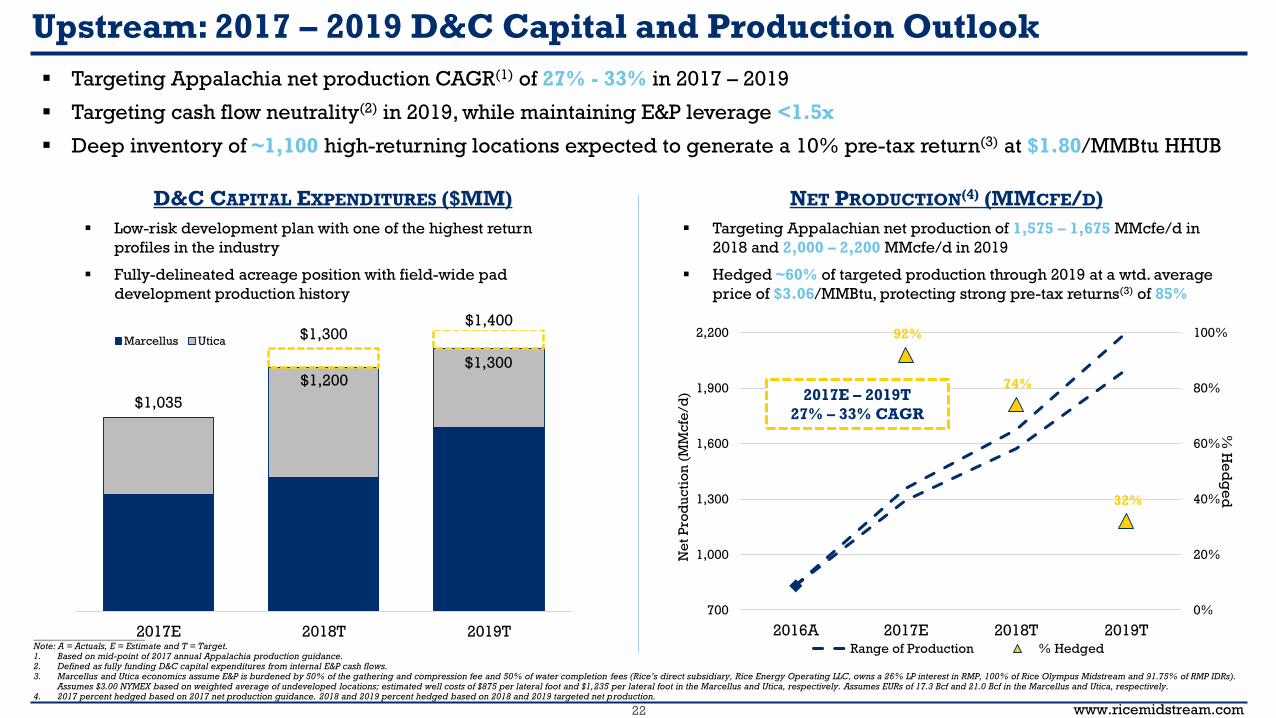
92%
74%
32%
0%
20%
40%
60%
80%
100%
700
1,000
1,300
1,600
1,900
2,200
2016A 2017E 2018T 2019T
% H
ed
ge
d
Ne
t P
rod
uc
tio
n (
MM
cfe
/d)
Range of Production % Hedged
Upstream: 2017 – 2019 D&C Capital and Production Outlook
2017E – 2019T
27% – 33% CAGR
D&C CAPITAL EXPENDITURES ($MM) NET PRODUCTION(4) (MMCFE/D)
▪ Targeting Appalachia net production CAGR(1) of 27% - 33% in 2017 – 2019
▪ Targeting cash flow neutrality(2) in 2019, while maintaining E&P leverage <1.5x
▪ Deep inventory of ~1,100 high-returning locations expected to generate a 10% pre-tax return(3) at $1.80/MMBtu HHUB
▪ Low-risk development plan with one of the highest return
profiles in the industry
▪ Fully-delineated acreage position with field-wide pad
development production history
▪ Targeting Appalachian net production of 1,575 – 1,675 MMcfe/d in
2018 and 2,000 – 2,200 MMcfe/d in 2019
▪ Hedged ~60% of targeted production through 2019 at a wtd. average
price of $3.06/MMBtu, protecting strong pre-tax returns(3) of 85%
$1,035
$1,300$1,400
2017E 2018T 2019T
Marcellus Utica
$1,200$1,300
www.ricemidstream.com23
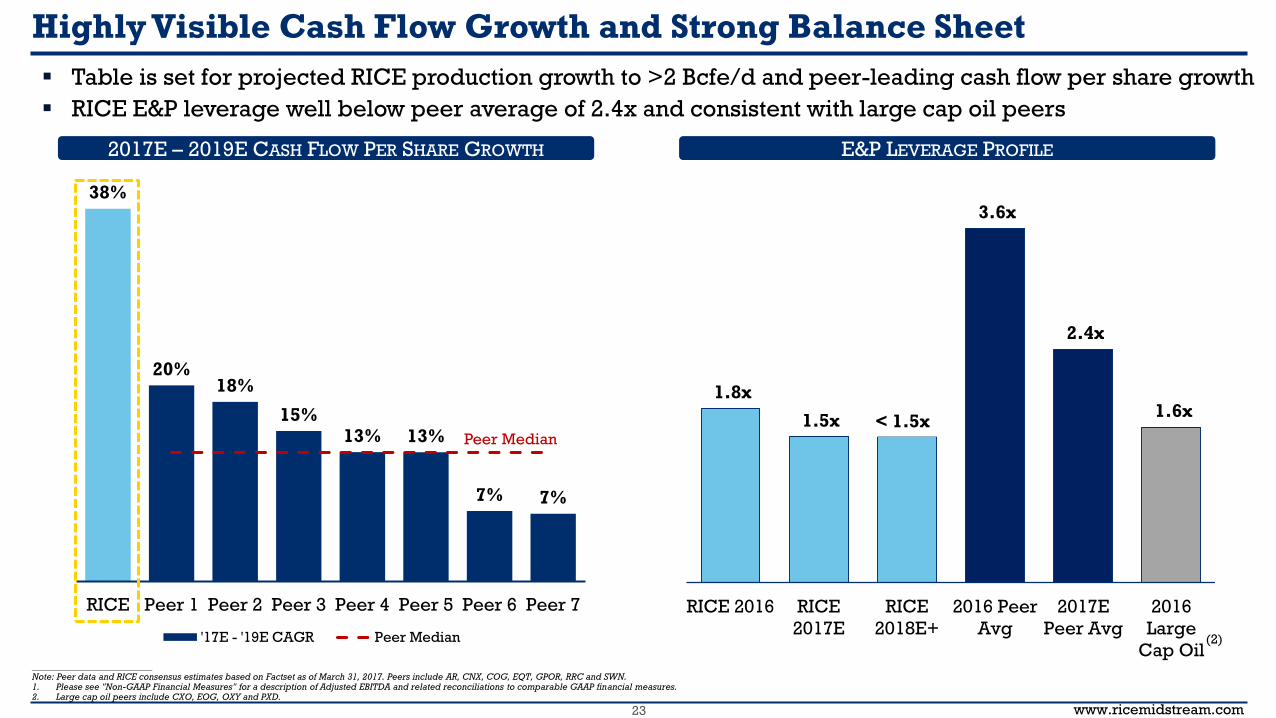
1.8x
1.5x ~ 1.5x
3.6x
2.4x
1.6x
RICE 2016 RICE
2017E
RICE
2018E+
2016 Peer
Avg
2017E
Peer Avg
2016
Large
Cap Oil
38%
20%18%
15%13% 13%
7% 7%
–
10%
20%
30%
40%
RICE Peer 1 Peer 2 Peer 3 Peer 4 Peer 5 Peer 6 Peer 7
'17E - '19E CAGR Peer Median
Peer Median
Highly Visible Cash Flow Growth and Strong Balance Sheet
▪ Table is set for projected RICE production growth to >2 Bcfe/d and peer-leading cash flow per share growth
▪ RICE E&P leverage well below peer average of 2.4x and consistent with large cap oil peers
2017E – 2019E CASH FLOW PER SHARE GROWTH E&P LEVERAGE PROFILE
__________________________Note: Peer data and RICE consensus estimates based on Factset as of March 31, 2017. Peers include AR, CNX, COG, EQT, GPOR, RRC and SWN.1. Please see "Non-GAAP Financial Measures" for a description of Adjusted EBITDA and related reconciliations to comparable GAAP financial measures.2. Large cap oil peers include CXO, EOG, OXY and PXD.
(2)
< 1.5x
www.ricemidstream.com24
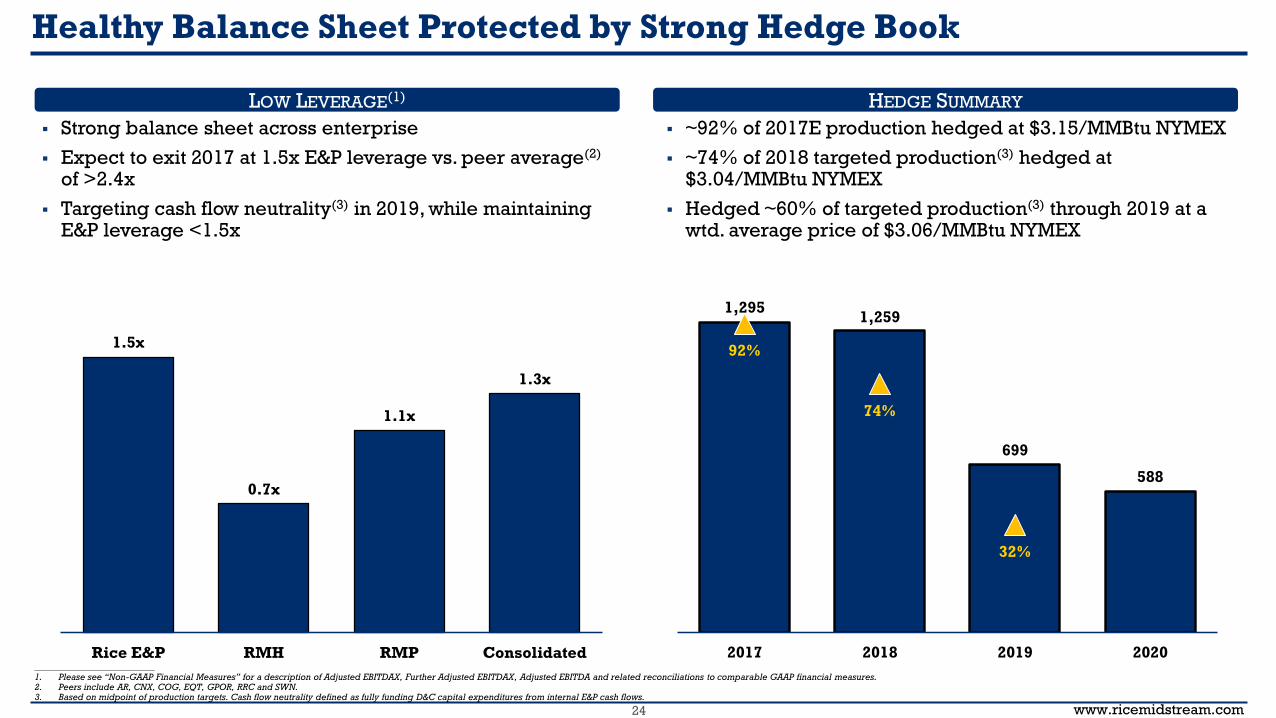
1,295 1,259
699
588
92%
74%
32%
0%
10%
20%
30%
40%
50%
60%
70%
80%
90%
100%
–
200
400
600
800
1,000
1,200
1,400
2017 2018 2019 2020
Healthy Balance Sheet Protected by Strong Hedge Book
1.5x
0.7x
1.1x
1.3x
Rice E&P RMH RMP Consolidated__________________________1. Please see “Non-GAAP Financial Measures” for a description of Adjusted EBITDAX, Further Adjusted EBITDAX, Adjusted EBITDA and related reconciliations to comparable GAAP financial measures.2. Peers include AR, CNX, COG, EQT, GPOR, RRC and SWN.3. Based on midpoint of production targets. Cash flow neutrality defined as fully funding D&C capital expenditures from internal E&P cash flows.
▪ Strong balance sheet across enterprise
▪ Expect to exit 2017 at 1.5x E&P leverage vs. peer average(2)
of >2.4x
▪ Targeting cash flow neutrality(3) in 2019, while maintaining E&P leverage <1.5x
▪ ~92% of 2017E production hedged at $3.15/MMBtu NYMEX
▪ ~74% of 2018 targeted production(3) hedged at $3.04/MMBtu NYMEX
▪ Hedged ~60% of targeted production(3) through 2019 at a wtd. average price of $3.06/MMBtu NYMEX
LOW LEVERAGE(1) HEDGE SUMMARY
www.ricemidstream.com25
53%
92%
142%
206%
39%
72%
115%
166%
$2.50 $3.00 $3.50 $4.00
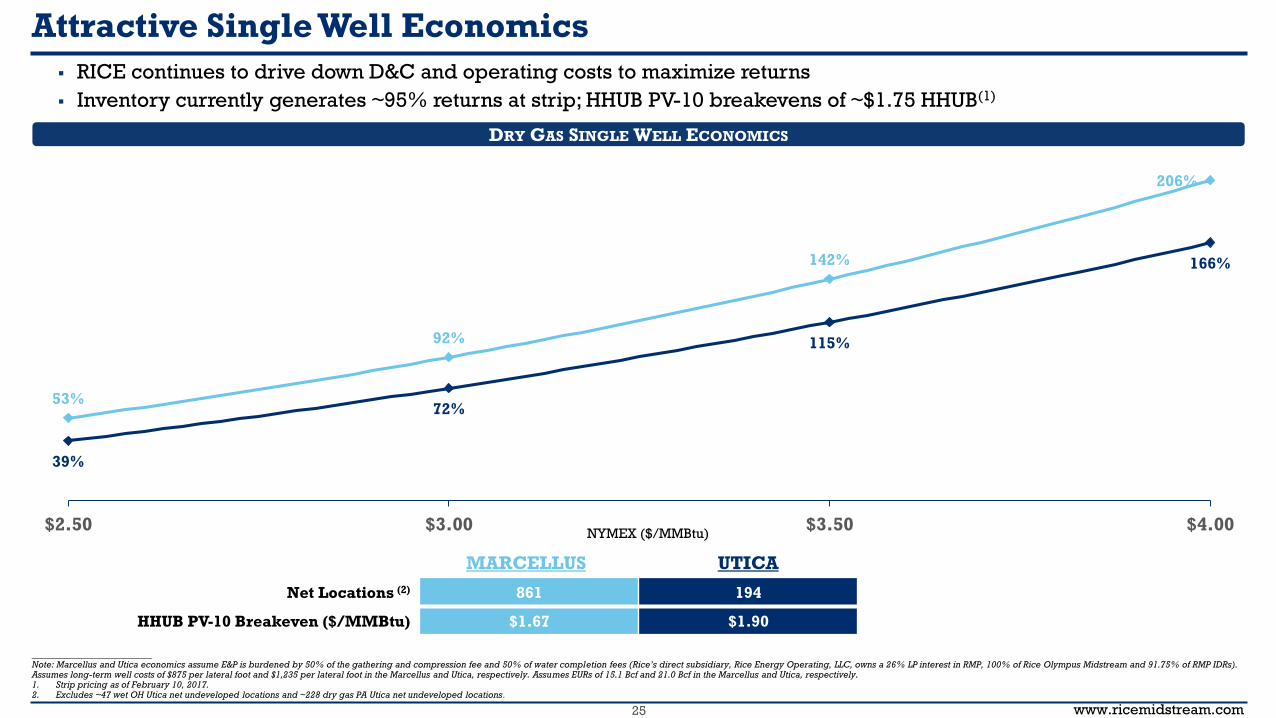
Attractive Single Well Economics
▪ RICE continues to drive down D&C and operating costs to maximize returns
▪ Inventory currently generates ~95% returns at strip; HHUB PV-10 breakevens of ~$1.75 HHUB(1)
Net Locations (2) 861 194
HHUB PV-10 Breakeven ($/MMBtu) $1.67 $1.90
DRY GAS SINGLE WELL ECONOMICS
__________________________Note: Marcellus and Utica economics assume E&P is burdened by 50% of the gathering and compression fee and 50% of water completion fees (Rice’s direct subsidiary, Rice Energy Operating, LLC, owns a 26% LP interest in RMP, 100% of Rice Olympus Midstream and 91.75% of RMP IDRs). Assumes long-term well costs of $875 per lateral foot and $1,235 per lateral foot in the Marcellus and Utica, respectively. Assumes EURs of 15.1 Bcf and 21.0 Bcf in the Marcellus and Utica, respectively.1. Strip pricing as of February 10, 2017.2. Excludes ~47 wet OH Utica net undeveloped locations and ~228 dry gas PA Utica net undeveloped locations.
NYMEX ($/MMBtu)
MARCELLUS UTICA
www.ricemidstream.com26
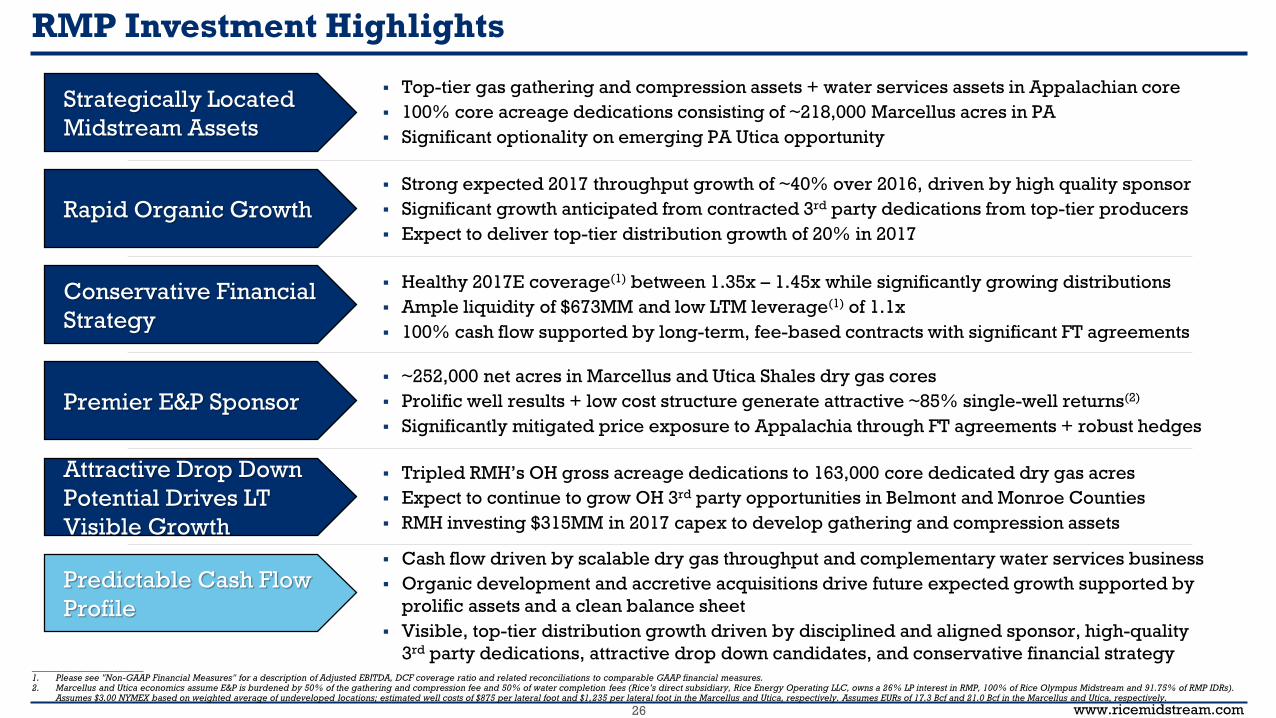
RMP Investment Highlights
__________________________1. Please see "Non-GAAP Financial Measures" for a description of Adjusted EBITDA, DCF coverage ratio and related reconciliations to comparable GAAP financial measures.2. Marcellus and Utica economics assume E&P is burdened by 50% of the gathering and compression fee and 50% of water completion fees (Rice’s direct subsidiary, Rice Energy Operating LLC, owns a 26% LP interest in RMP, 100% of Rice Olympus Midstream and 91.75% of RMP IDRs).
Assumes $3.00 NYMEX based on weighted average of undeveloped locations; estimated well costs of $875 per lateral foot and $1,235 per lateral foot in the Marcellus and Utica, respectively. Assumes EURs of 17.3 Bcf and 21.0 Bcf in the Marcellus and Utica, respectively.
▪ Top-tier gas gathering and compression assets + water services assets in Appalachian core
▪ 100% core acreage dedications consisting of ~218,000 Marcellus acres in PA
▪ Significant optionality on emerging PA Utica opportunity
▪ Strong expected 2017 throughput growth of ~40% over 2016, driven by high quality sponsor
▪ Significant growth anticipated from contracted 3rd party dedications from top-tier producers
▪ Expect to deliver top-tier distribution growth of 20% in 2017
▪ Tripled RMH’s OH gross acreage dedications to 163,000 core dedicated dry gas acres
▪ Expect to continue to grow OH 3rd party opportunities in Belmont and Monroe Counties
▪ RMH investing $315MM in 2017 capex to develop gathering and compression assets
▪ Cash flow driven by scalable dry gas throughput and complementary water services business
▪ Organic development and accretive acquisitions drive future expected growth supported by
prolific assets and a clean balance sheet
▪ Visible, top-tier distribution growth driven by disciplined and aligned sponsor, high-quality
3rd party dedications, attractive drop down candidates, and conservative financial strategy
Strategically Located
Midstream Assets
Rapid Organic Growth
Premier E&P Sponsor
Attractive Drop Down
Potential Drives LT
Visible Growth
Predictable Cash Flow
Profile
Conservative Financial
Strategy
▪ Healthy 2017E coverage(1) between 1.35x – 1.45x while significantly growing distributions
▪ Ample liquidity of $673MM and low LTM leverage(1) of 1.1x
▪ 100% cash flow supported by long-term, fee-based contracts with significant FT agreements
▪ ~252,000 net acres in Marcellus and Utica Shales dry gas cores
▪ Prolific well results + low cost structure generate attractive ~85% single-well returns(2)
▪ Significantly mitigated price exposure to Appalachia through FT agreements + robust hedges
www.ricemidstream.com27
Appendix
www.ricemidstream.com28
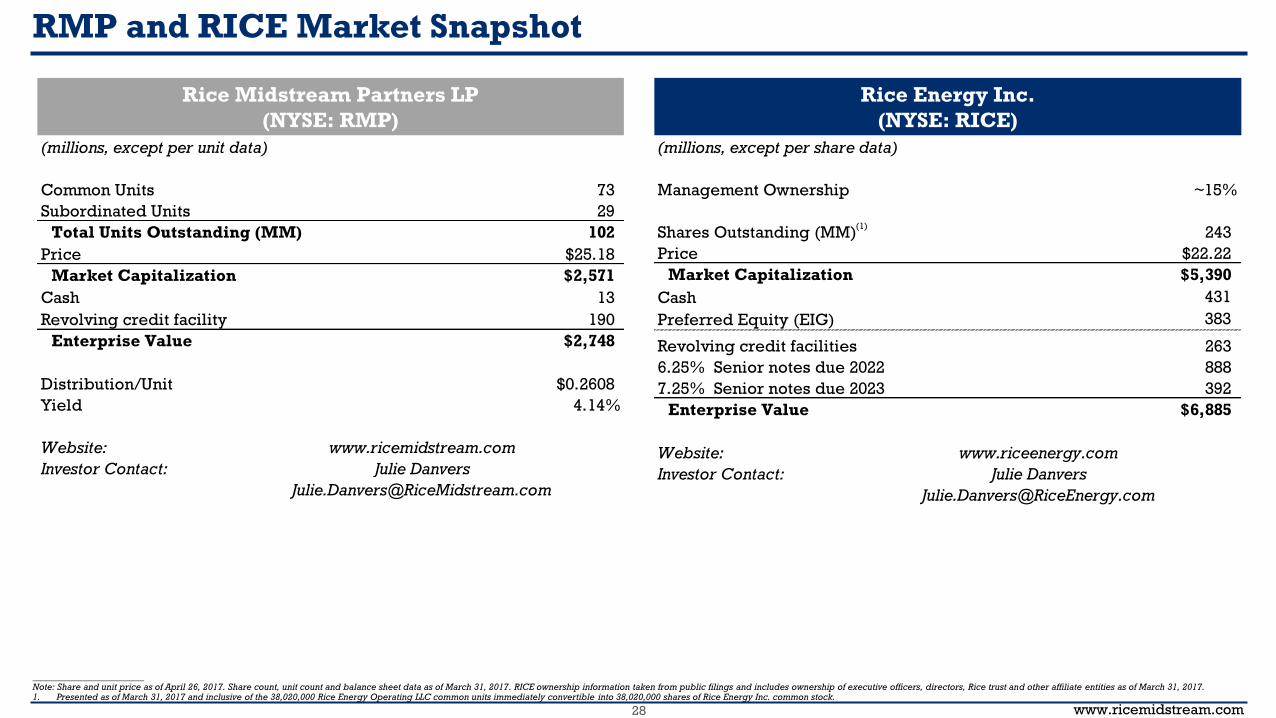
(millions, except per share data)
Management Ownership ~15%
Shares Outstanding (MM) 243
Price $22.22
Market Capitalization $5,390
Cash 431
Preferred Equity (EIG) 383
Revolving credit facilities 263
6.25% Senior notes due 2022 888
7.25% Senior notes due 2023 392
Enterprise Value $6,885
Website: www.riceenergy.com
Investor Contact: Julie Danvers
Rice Midstream Partners LP
(NYSE: RMP)
RMP and RICE Market Snapshot
__________________________Note: Share and unit price as of April 26, 2017. Share count, unit count and balance sheet data as of March 31, 2017. RICE ownership information taken from public filings and includes ownership of executive officers, directors, Rice trust and other affiliate entities as of March 31, 2017.1. Presented as of March 31, 2017 and inclusive of the 38,020,000 Rice Energy Operating LLC common units immediately convertible into 38,020,000 shares of Rice Energy Inc. common stock.
Rice Energy Inc.
(NYSE: RICE)
(1)
(millions, except per unit data)
Common Units 73
Subordinated Units 29
Total Units Outstanding (MM) 102
Price $25.18
Market Capitalization $2,571
Cash 13
Revolving credit facility 190
Enterprise Value $2,748
Distribution/Unit $0.2608
Yield 4.14%
Website:
Investor Contact:
www.ricemidstream.com
Julie Danvers

www.ricemidstream.com29
RICE and RMP Organizational Structure
DE
PA Water
Public Unitholders(72% LP Interest)
ROFO
Asset
OH WaterPA Gathering
$300MM Credit Facility +
$850MM Credit Facility
$1.45B E&P Borrowing Base
$100MM Accordion Feature
8.25%
common
equity interest
100% Series B
Preferred Equity
($375MM invested)
75% equity interest100% equity interest100% ownership91.75% common
equity interest
100% interest
RMP GP(non-economic)
GP Holdings
(IDRs and LP Interest)
EIG Managed
Funds
28% LP interest &
100% of IDRs
Rice Midstream
Holdings LLC
Rice Olympus
Midstream
(OH Gathering)
Strike Force
Midstream
(GPOR JV)
Rice E&P
__________________________Ownership percentages as of March 31, 2017.
NYSE: RICE
NYSE: RMP
www.ricemidstream.com30
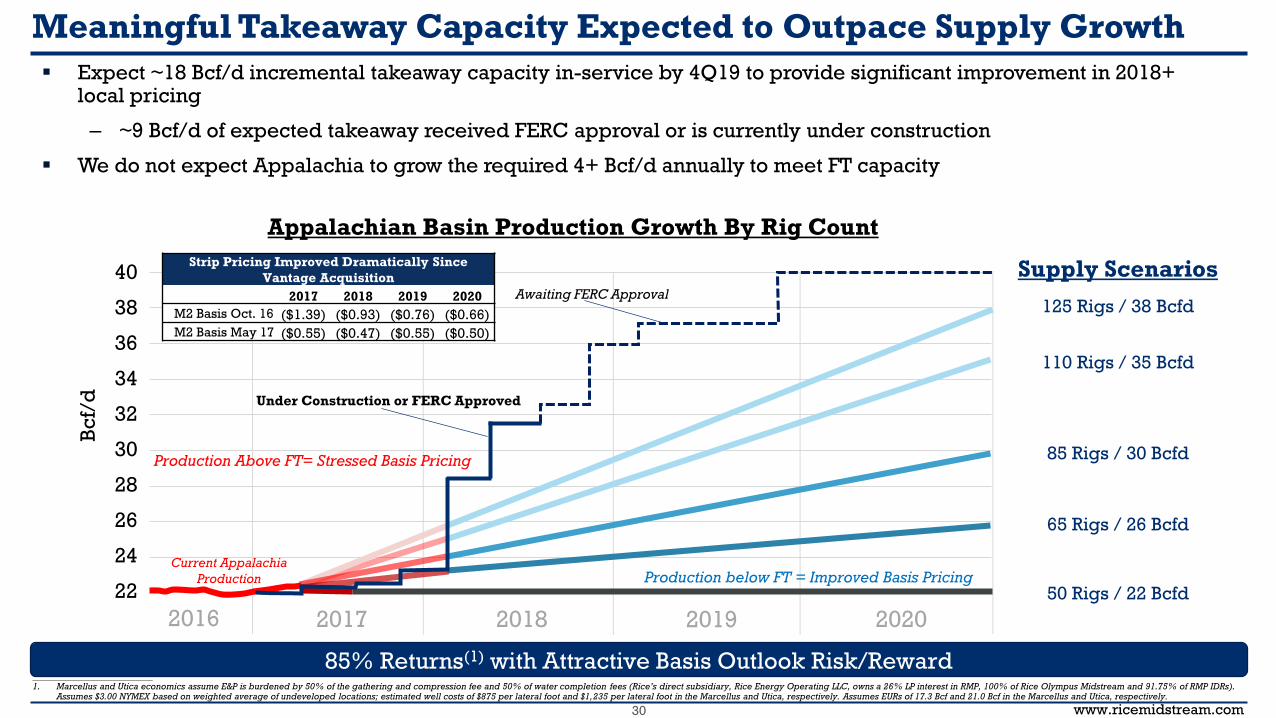
Appalachian Basin Production Growth By Rig Count
85% Returns(1) with Attractive Basis Outlook Risk/Reward
Bc
f/d
Current Appalachia
Production
125 Rigs / 38 Bcfd
110 Rigs / 35 Bcfd
85 Rigs / 30 Bcfd
65 Rigs / 26 Bcfd
50 Rigs / 22 BcfdProduction below FT = Improved Basis Pricing
Production Above FT= Stressed Basis Pricing
Strip Pricing Improved Dramatically Since
Vantage Acquisition
2017 2018 2019 2020
M2 Basis Oct. 16 ($1.39) ($0.93) ($0.76) ($0.66)
M2 Basis May 17 ($0.55) ($0.47) ($0.55) ($0.50)
Supply Scenarios
Meaningful Takeaway Capacity Expected to Outpace Supply Growth
▪ Expect ~18 Bcf/d incremental takeaway capacity in-service by 4Q19 to provide significant improvement in 2018+ local pricing
– ~9 Bcf/d of expected takeaway received FERC approval or is currently under construction
▪ We do not expect Appalachia to grow the required 4+ Bcf/d annually to meet FT capacity
38
36
34
32
30
28
26
24
22
40
2017 2018 2019 20202016
__________________________1. Marcellus and Utica economics assume E&P is burdened by 50% of the gathering and compression fee and 50% of water completion fees (Rice’s direct subsidiary, Rice Energy Operating LLC, owns a 26% LP interest in RMP, 100% of Rice Olympus Midstream and 91.75% of RMP IDRs).
Assumes $3.00 NYMEX based on weighted average of undeveloped locations; estimated well costs of $875 per lateral foot and $1,235 per lateral foot in the Marcellus and Utica, respectively. Assumes EURs of 17.3 Bcf and 21.0 Bcf in the Marcellus and Utica, respectively.
Awaiting FERC Approval
Under Construction or FERC Approved
www.ricemidstream.com31
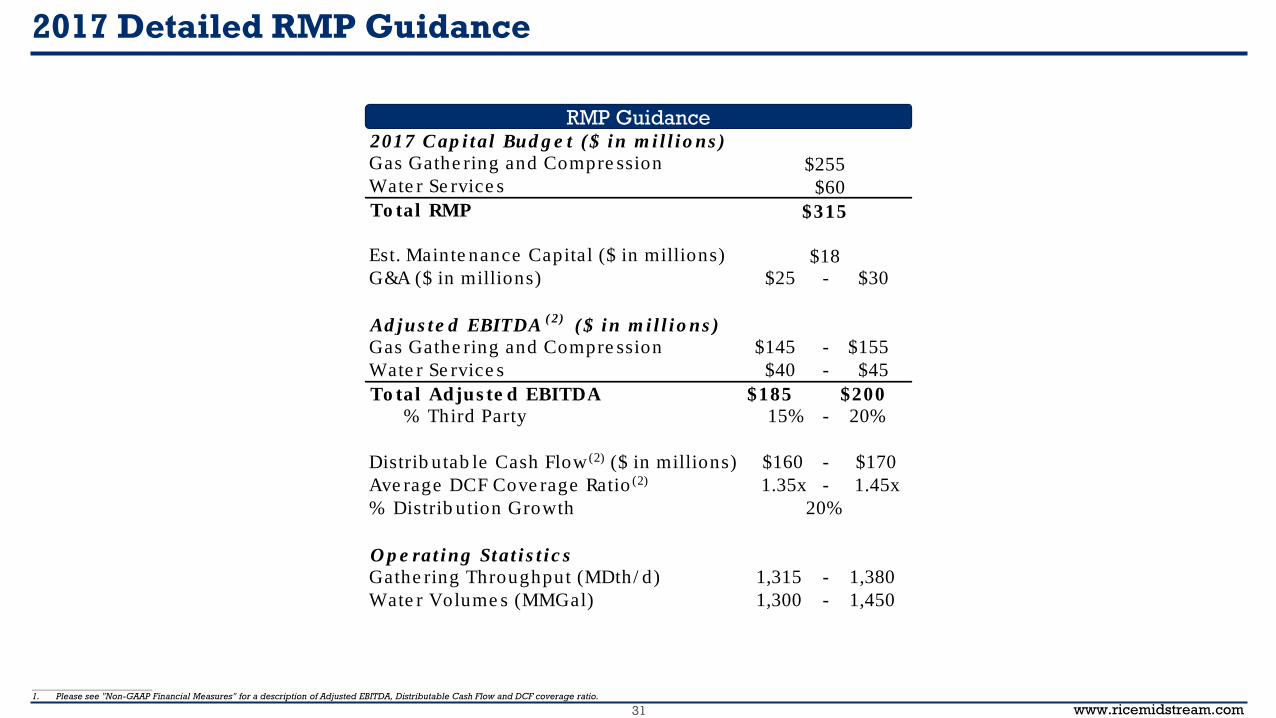
2017 Detailed RMP Guidance
RMP Guidance
__________________________1. Please see "Non-GAAP Financial Measures" for a description of Adjusted EBITDA, Distributable Cash Flow and DCF coverage ratio.
2017 C ap i tal Bud g e t ( $ in m i l l i o ns )
Gas Gathe ring and Compre ssion $255Wate r Se rvice s 0$60
To tal RMP $315
Est. Mainte nance Capital ($ in millions) $18G&A ($ in millions) $25 - $30
Ad jus te d EBITDA( 2)
( $ in m i l l i o ns )
Gas Gathe ring and Compre ssion $145 - $155
Wate r Se rvice s $40 - $45
To tal Adjus te d EBITDA $185 $200
% Third Party 15% - 20%
Distrib utab le Cash Flow (2) ($ in millions) $160 - $170
Ave rage DCF Cove rage Ratio (2) 1.35x - 1.45x
% Distrib ution Growth 20%
O p e rat ing Stat i s t i c s
Gathe ring Throughput (MDth/ d) 1,315 - 1,380
Wate r Volume s (MMGal) 1,300 - 1,450

www.ricemidstream.com32
2017 Detailed RICE Guidance
E&P Guidance RMH Guidance(1)
__________________________1. Does not assume any drop downs. RMH capital budget, G&A and Adjusted EBITDA includes our 75% proportional ownership in Strike Force. Giving effect to Gulfport Midstream’s 25% ownership interests of Strike Force, we expect a range of $95 – 105MM for 2017 Adjusted EBITDA.2. Please see "Non-GAAP Financial Measures" for a description of Adjusted EBITDA.
Net Wells Spud Online Net Production (MMcfe/d)
Operated Marcellus 75 55 Appalachia 1,205 - 1,265
Operated Ohio Utica 20 20 Barnett 85 - 90
Non-operated Ohio Utica 10 5 Total Net Production 1,290 - 1,355
Total Net Wells 105 80 % Natural gas 99%
% Operated 94%
% Marcellus 65%
% Utica 28%
Lateral Length (ft.) of Wells Spud Online
Operated Marcellus 8,500 8,000 Pricing
Operated Ohio Utica 10,500 9,000 FT Fuel & Variable (Deduction) $0.11
Non-operated Ohio Utica 9,500 8,500 Heat Content (Btu/Scf)
Marcellus 1,050
Utica 1,080
2017 Capital Budget ($ in millions)
E&P Operating Costs ($/Mcfe)
Operated Marcellus Lease Operating Expense $0.16 - $0.18
Operated Ohio Utica Gathering and Compression $0.45 - $0.47
Non-operated Ohio Utica Firm Transportation Expense $0.25 - $0.27
Total Drilling & Completion Production Taxes and Impact Fees $0.04 - $0.06
Land Total Operating Costs $0.90 - $0.98
Total E&P E&P G&A ($ in millions) $85 - $90$1,260
$585
$300
$150
$1,035
$225
2017 C ap i tal Bud g e t ( $ in m i l l io ns )
Gas Gathe ring and Compre ssion $315
G &A ( $ in m i l l io ns )
Gas Gathe ring and Compre ssion $15 - $20
Ad jus te d EBITDA( 2)
( $ in m i l l io ns )
Gas Gathe ring and Compre ssion $85 - $95
O p e rat ing Stat i s t i c s
Gathe ring Throughput (MDth/ d) 1,125 - 1,185

www.ricemidstream.com33
Additional Disclosures
Net undeveloped locations are calculated by taking our total net acreage, subtracting producing acreage, and multiplying such amount by a risking factor. Remaining risked acreage is then divided by our expected well spacing. Producing acreage is calculated with the same methodology based on actual lateral lengths and inter-well spacing.
Undeveloped Net Marcellus Locations – RICE assumes these locations have 8,000 foot laterals and 750 foot spacing between wells which yields approximately 138 acre spacing. In the Marcellus, RICE applies a 20% risking factor to its net acreage to account for inefficient unitization and the risk associated with its inability to force pool in Pennsylvania. As of December 31, 2016, RICE had approximately 185,000 net acres in the Marcellus which results in 861 undeveloped net locations.
Undeveloped Net Ohio Utica Locations – RICE assumes these locations have 9,000 foot laterals and 1,000 foot spacing between wells which yields approximately 207 acre spacing. In the Ohio Utica, RICE applies a 10% risking factor to its net acreage to account for inefficient unitization. As of December 31, 2016, RICE had approximately 63,000 net acres prospective for the Utica in Ohio which results in 241 undeveloped net locations.
Undeveloped Net Pennsylvania Utica Locations – RICE assumes these locations have 8,000 foot laterals and 2,000 foot spacing between wells which yields approximately 367 acre spacing. In the Pennsylvania Utica, RICE applies a 20% risking factor to its net acreage to account for inefficient unitization. As of December 31, 2016, RICE had approximately 105,000 net acres prospective for the Utica in Pennsylvania which results in 228 undeveloped net locations.
Determination of Identified Drilling Locations as of December 31, 2016:


