32
INVESTOR PRESENTATION FEBRUARY 2018

INVESTOR PRESENTATION
FEBRUARY 2018

2© 2018 |
Forward-Looking Statements
Forward-Looking Statements
This presentation and other written or oral statements made from time to time by representatives of Broadridge Financial Solutions, Inc. ("Broadridge" or the "Company") may contain “forward-looking statements” within the meaning of the Private Securities Litigation Reform Act of 1995. Statements that are not historical in nature, and which may be identified by the use of words such as “expects,” “assumes,” “projects,” “anticipates,” “estimates,” “we believe,” “could be” and other words of similar meaning, are forward-looking statements. In particular, information appearing in the “Fiscal Year 2018 Financial Guidance” section are forward-looking statements.
These statements are based on management’s expectations and assumptions and are subject to risks and uncertainties that may c ause actual results to differ materially from those expressed. These risks and uncertainties include those risk factors discussed in Part I, “Item 1A. Risk Factors” of our Annual Report on Form 10-K for the fiscal year ended June30, 2017 (the “2017 Annual Report”), as they may be updated in any future reports filed with the Securities and Exchange Commission. All forward-looking statements speak only as of the date of this presentation and are expressly qualified in their entirety by reference to the factors discussed in the 2017 Annual Report.
These risks include: the success of Broadridge in retaining and selling additional services to its existing clients and in obtaining new clients; Broadridge’s reliance on a relatively small number of clients, the continued financial health of those clients, and the continued use by such clients of Broadridge’s services with favorable pricing terms; any material breach of Broadridge security affecting its clients’ customer information; changes in l aws and regulations affecting Broadridge’s clients or the services provided by Broadridge; declines in participation and activity in the securities markets; the failure of Broadridge’s outsourced data center services provider to provide the anticipated levels of service; a disaster or other significant slowdown or failure of Broadridge’s systems or error in the performance of Broadridge’s services; overall market and economic conditions and their impact on the securiti es markets; Broadridge’s failure to keep pace with changes in technology and demands of its clients; Broadridge’s ability to attract and retain key personnel; th e impact of new acquisitions and divestitures; and competitive conditions. Broadridge disclaims any obligation to update or revise forward-looking statements that may be made to reflect events or circumstances that arise after the date made or to reflect the occurrence of unanticipated events, other than as required by law.

3© 2018 |
Use of Non-GAAP Financial Measures Explanation and Reconciliation of the Company’s Use of Non-GAAP Financial Measures
The Company’s results in this presentation are presented in accordance with U.S. generally accepted accounting principles ("GAAP") except where otherwise noted. In certain
circumstances, results have been presented that are not generally accepted accounting principles measures (“Non-GAAP”). These Non-GAAP measures are Adjusted Operating income, Adjusted Operating income margin, Adjusted Net earnings, Adjusted earnings per share, and Free cash flow. These Non-GAAP financial measures should be viewed in addition to, and not
as a substitute for, the Company’s reported results.
The Company believes its Non-GAAP financial measures help investors understand how management plans, measures and evaluates the Company’s business performance. Management
believes that Non-GAAP measures provide consistency in its financial reporting and facilitates investors’ understanding of the Company’s operating results and trends by providing an additional basis for comparison. Management uses these Non-GAAP financial measures to, among other things, evaluate the Company's ongoing operations, for internal planning and
forecasting purposes and in the calculation of performance-based compensation. In addition, and as a consequence of the importance of these Non-GAAP financial measures in managing its business, the Company’s Compensation Committee of the Board of Directors incorporates Non-GAAP financial measures in the eva luation process for determining management
compensation.
Adjusted Operating Income, Adjusted Operating Income Margin, Adjusted Net Earnings and Adjusted Earnings per Share
These Non-GAAP measures reflect Operating income, Operating income margin, Net earnings, and Diluted earnings per share, as adjusted to exclude the impact of certain costs, expenses, gains and losses and other specified items that management believes are not indicative of our ongoing operating performance. These adjusted measures exclude the impact of
Amortization of Acquired Intangibles and Purchased Intellectual Property, Acquisition and Integration Costs, and Tax Act items. Amortization of Acquired Intangibles and Purchased Intellectual Property represents non-cash expenses associated with the Company's acquisition activities. Acquisition and Integration Costs represent certain transaction and integration
costs associated with the Company’s acquisition activities. Tax Act items represent the net impact of a U.S. federal transition tax on earnings of certain foreign subsidiaries, foreign jurisdiction withholding taxes and certain benefits related to the remeasurement of the Company's net U.S. federal and state deferred tax liabilities attributable to the Tax Cuts and Jobs
Act (the "Tax Act"). The Company excludes Amortization of Acquired Intangibles and Purchased Intellectual Property, Acquisition and Integration Costs, and Tax Act items from these measures because excluding such information provides the Company with an understanding of the results from the primary operations of its business and these items do not reflect
ordinary operations or earnings. Management believes these measures may be useful to an investor in evaluating the underlyingoperating performance of the Company's business.
Free Cash Flow
In addition to the Non-GAAP financial measures discussed above, we provide Free cash flow information because we consider Free c ash flow to be a liquidity measure that provides useful information to management and investors about the amount of cash generated that could be used for dividends, share repurchases, strategic acquisitions, other investments, as well as
debt servicing. Free cash flow is a Non-GAAP financial measure and is defined by the Company as Net cash flows provided by opera ting activities less Capital expenditures as well as Software purchases and capitalized internal use software.
Reconciliations of such Non-GAAP measures to the most directly comparable financial measures presented in accordance with GAAP c an be found in the tables that are part of this
presentation.
Use of Material Contained Herein
The information contained in this presentation is being provided for your convenience and information only. This information is accurate as of the date of its initial presentation. If you plan to use this information for any purpose, verification of its continued accuracy is your responsibility. Broadridge assumes no duty to update or revise the information contained in this
presentation.

4© 2018 |
Market dynamics driving strong growth for Broadridge’s technology-driven solutions
Broadridge is Ready For Next
Proven strategy and experienced management team to drive sustainable growth
Uniquely positioned to deliver network value and capture additional, large market opportunities
Successful track record balancing top quartile total shareholder return with continued reinvestment

5© 2018 |
The industry’s leading choice
GOVERNANCE CAPI TAL MARKETS WEALTH MANAGEMENT
• Serve most brokers, funds, and public companies in North America
• Process 80% of outstanding shares in the United States, 50%+ for rest of world
• Distribute 90%+ of broker regulatory communications to 140M individual accounts
• Reach 80% of North American households
• Serve 18 of 23 US primary dealers for fixed income
• Process Equities for 7 of the top 10 global investment banks
• Serve 4 of 6 largest Canadian banks
• Clear and settle over $5T per day
• Support clearance and settlement in over 80 countries
• Support 50M+ accounts through our technology platform
• 25%+ of US Financial Advisors utilize Broadridge’s front office solutions
• Provide data aggregationservice for 228K+ agents and advisors
• Maintain 100K retirement plans through Broadridge’s mutual fund settlements platform
GROWING FRANCHISEGROWING FRANCHISE

6© 2018 |
Broadridge platform-based business model creates unique value
Network value
Deep financial services knowledge
Multi-client managed services approach

7© 2018 |
Broadridge’s directly addressable market is $25-40B
Key Market Trends
$9-13B
$6-12B
$10-15B
GOVERNANCE & COMMUNICATIONS
WEALTH MANAGEMENT
CAPITAL MARKETS
100% = $25-40B
DATA & ANALYTICS
DIGITIZATION
MUTUALIZATION
Large Growth Opportunity

8© 2018 |
Broadridge is focused on three key opportunities, two of which are already strong franchises
Address critical industry needs by utilizing our unique network and industry-leading platform capabilities
Well-positioned to drive International growth and extend our key franchises by becoming the preferred global provider
EXTEND GOVERNANCE
DRIVE CAPITAL MARKETS
BUILD WEALTH MANAGEMENT

9© 2018 |
Extend Governance
Key Opportunities
• Transform regulatory communications
• Develop omni-channel communications
• Build issuer services140M+RETAIL SHAREHOLDER
ACCOUNTS
150,000+INSTITUTIONAL SHAREHOLDERS
24,000+ MUTUAL FUNDS 1,100+
BANKS and BROKER-DEALERS
5,000+CORPORATE ISSUERS

10© 2018 |
Broadridge has a strong track record of digital transformation
Customer Communications2 Presentment & Payment Notifications Cloud DeliveryE-Delivery
Proxy & Other Regulatory1
Data & AnalyticsSuppression
AlgorithmsSummary Prospectus
E-Delivery Investor Mailbox Enhanced Broker Internet Platform
Mobile Proxy Voting
64%
Collectively saving our clients $15+ billion over the past decade and generatinga $200+ million recurring revenue stream tied to digitizing communications
30%
1 Proxy, Interims and Post Sale Prospectus
2 Bills, statements, trade confirms, tax documents and more
FIRST USE TODAYSUCCESSFULLY
DIGITIZED

11© 2018 |
Drive Capital Markets
Drive global technology platform
Extend with additional solutions
Create network value
Data Fabric with Global Ontology
Unified Portal
Global Position Manager Global P&L Global Sub-Ledger
Managed Services Options
Core ComponentsConnectivity Reference
DataNetting &Allocation
Clearance &Settlement
Books &Records
Funding/Collateral/
Fees
AssetServicing
Reconciliation Regulatory OperationalRisk
Asset Class and Function Coverage
Equities Exchange TradedDerivatives
Trade & Position Financing
Foreign Exchange & Money Markets
Fixed Income
SOLUTION COMPONENTS

12© 2018 |
Build Wealth Management
Drive winning targeted solutions
Create front-to-back platform of the future
Wrap in next-generation digital and data
Drive best-of-suite solutions for investment managersAdvisors Investors
• Wealth management tools
• Targeted marketing
• Wealth mobile portal
• Educational content
• Enriched, digital communications
• Trading and account servicing
• Clearance & settlement
• Client and regulatory reporting
• Business process automation & workflows

13© 2018 |
Broadridge business model is strong
Sustainable Growth
• Large, recurring revenue base with good visibility
• Organic strength driven by large addressable market opportunity
Steady Margin Expansion
• Continued scale and operational leverage
• Focus on operational efficiencies
Strong Free Cash Flow• 100+% free cash flow conversion
• Largely predictable model
Balanced Capital Allocation
• Target ~45% dividend payout ratio1
• Balance of targeted M&A and share repurchase
1 Dividend payout ratio is a percentage of prior year Adjusted Net Earnings and is subject to Board Approval

14© 2018 |
High quality revenue stream
$4.1B Total FY17 Revenues
Event-Driven Fee (5%)
~$200MAnnual Average
(FY15-FY17)$0.2B
Distribution (38%)
<10% Gross Margin
$1.6B
Recurring Fee (59%)
14%CAGR (FY14-17)
6 yrsAverage Contract
Length
5% Organic CAGR
(FY14-17)
98%Revenue
Retention Rate
$2.5B
Note: Revenue components and percentages based on FY17 results unless shown as a multi -year average or on a CAGR basis. Recurring Fee, Event-Driven Fee and Distribution exclude the impact of FX and Other.

15© 2018 |
New sales drive organic recurring revenue growth
Net New Business
Internal Growth
Total Organic Growth
Acquisitions
5-6%
FY17- FY20 Objective (CAGR)
0-1%
5-7%
~2%
3%4% 4%
FY15 FY16 FY17
1% 1%2%
FY15 FY16 FY17
4%6% 6%
FY15 FY16 FY17
2% 3%
24%
FY15 FY16 FY17
Total Recurring Revenue 7-9%
4%
2%
5%
10%
FY14- FY17 (CAGR)
Note: Totals may not sum due to rounding

16© 2018 |
Recurring FeeRevenue
Event-DrivenRevenue
DistributionRevenue
Two strong and growing segments
INVESTOR COMMUNICATION SOLUTIONS $3.4B Total Revenue
$0.2B
12.3%Margin
6%Organic Growth
KEY BUSINESSES KEY BUSINESSES
Governance
Customer Communications
Data Driven Solutions
Capital Markets Infrastructure
Wealth Management
Investment Management
21.1%Margin
6%Organic Growth
Recurring FeeRevenue
$0.8B$1.6B $1.6B
GLOBAL TECHNOLOGY & OPERATIONS$0.8B Total Revenue
Note: Revenue figures and percentages based on FY17 segment results. Margin shown is Earnings before Income Taxes margin by r eportable segment.

17© 2018 |
Capital allocation priorities
Strong Dividend
• Target ~45% payout ratio1
• Top quartile payout ratio compared toS&P 500 and leads peer group
$0.4B Returned to shareholders during FY15 – FY17
Disciplined M&A $0.8B
• Compelling returns
• Accretive to EPS within first 12-18 months
• Focus on tuck-in acquisitions
Invested in M&A during FY15 – FY17
Share Repurchase
• Commitment to return capital
• Steady buyer of our shares $0.6B Returned to shareholders during FY15 – FY172
Capital Structure $1.0B
• Ample liquidity
• Investment grade credit profile
• Weighted average cost of debt 3.4%
Revolving credit facility
1 Dividend payout ratio is a percentage of prior year Adjusted Net Earnings and is subject to Board Approval 2 Share repurchase figure shown as net of proceeds from exercise of stock options

18© 2018 |
Achieved multi-year objectives and demonstrated strong growth performance
2014 Investor Day 3-Year Objectives Excluding NACC Actuals
Recurring Fee Revenue 7% - 10% 7%14%
Total Revenue 5% - 7% 6%17%
Adjusted Op Income Margin % 18.6% - 19.5%1 18.9%15.0%
Adjusted Net Earnings 9% - 11% 9%11%
1 2014 Investor Day Objective was to expand FY14 EBIT margins by 130-220bps from 16.4% over the three year period. In Q1 of FY16 we began reporting Adjusted Operating Income. The comparable Adjusted Operating Income margin % in FY14 was 17.3% and the comparable 2014 Investor Day Objective wa s 18.6% - 19.5%. Adjusted Operating
Income Margin is an ending objective for FY17. Note: Adjusted measures are Non-GAAP measures. See Appendix for reconciliation of Non-GAAP to GAAP figures. “NACC” is the FY17 acquisition of North American
Customer Communications
Compound annual growth rates (CAGRs), except margin
Adjusted EPS - 10%12%
FY14 - FY17

19© 2018 |
Recurring Fee Revenue Growth 7-9%
Total Revenue Growth 5-7%
Adjusted Op Income Margin Expansion ~50bps/yr
Adjusted EPS Growth 14-18%
Winning formula for top quartile TSR
FY17 - FY20 three year growth objectives
Note: Compound annual growth rates (CAGRs), except margin. Three year Adjusted EPS Growth objective includes benefit from change in U.S. tax law

20© 2018 |
Track record of growth and value creation
$1.1B
$2.5B
FY0
8
FY0
9
FY1
0
FY1
1
FY1
2
FY1
3
FY1
4
FY1
5
FY1
6
FY1
7$20
$90
4/1
/07
1/1
/08
10
/1/0
8
7/1
/09
4/1
/10
1/1
/11
10
/1/1
1
7/1
/12
4/1
/13
1/1
/14
10
/1/1
4
7/1
/15
4/1
/16
1/1
/17
10
/1/1
7
9% CAGR
RECURRING FEE REVENUE GROWTH BROADRIDGE SHARE PRICE
18%Annualized TSR
$90 share price as of 12/1/17

21© 2018 |
Appendix: Broadridge Second Quarter Fiscal Year 2018 Highlights as of 2/8/2018 Earnings Call

© 2018 |
Second Quarter 2018 Revenue Growth Drivers
▪ Second Quarter 2018 Recurring fee revenues grew 5% to $562 million
▪ Second Quarter 2018 Total revenues grew 13% to $1.01 billion
$1,013 M+3%
+8% +3% 0%
$893 M
$536 M$562 M
+6%
-3%
+1% +1% +5%
+13%
22
Note: Amounts may not sum due to rounding
Organic Growth: 4%
© 2018 |
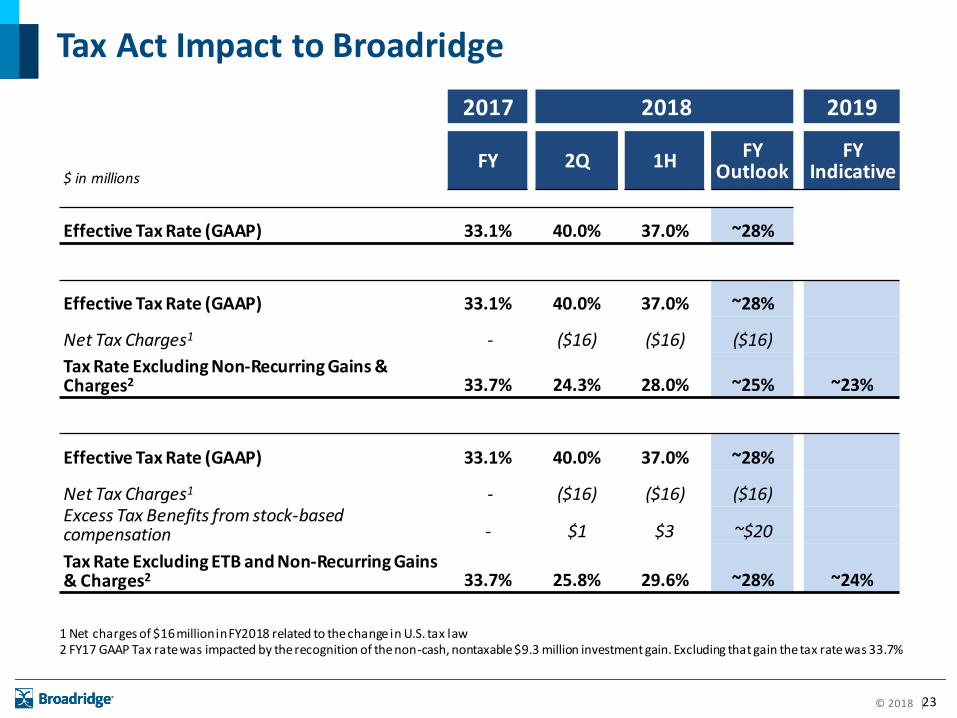
Tax Act Impact to Broadridge
2017 2018 2019
$ in millionsFY 2Q 1H FY
OutlookFY
Indicative
Effective Tax Rate (GAAP) 33.1% 40.0% 37.0% ~28%
Effective Tax Rate (GAAP) 33.1% 40.0% 37.0% ~28%
Net Tax Charges1 - ($16) ($16) ($16)
Tax Rate Excluding Non-Recurring Gains & Charges2 33.7% 24.3% 28.0% ~25% ~23%
Effective Tax Rate (GAAP) 33.1% 40.0% 37.0% ~28%
Net Tax Charges1 - ($16) ($16) ($16)Excess Tax Benefits from stock-based compensation - $1 $3 ~$20
Tax Rate Excluding ETB and Non-Recurring Gains & Charges2 33.7% 25.8% 29.6% ~28% ~24%
1 Net charges of $16 million in FY2018 related to the change in U.S. tax law2 FY17 GAAP Tax rate was impacted by the recognition of the non-cash, nontaxable $9.3 million investment gain. Excluding that gain the tax rate was 33.7%
23

© 2018 |
Second Quarter 2018 GAAP and Adjusted Operating Income and Adjusted EPS
$ in millions, except per share amounts
Year-over-Year Change in Operating Income and Adjusted Operating Income
Year-over-Year Change in EPS and Adjusted EPS
+63%
+96%
24
+103%
+108%
© 2018 |
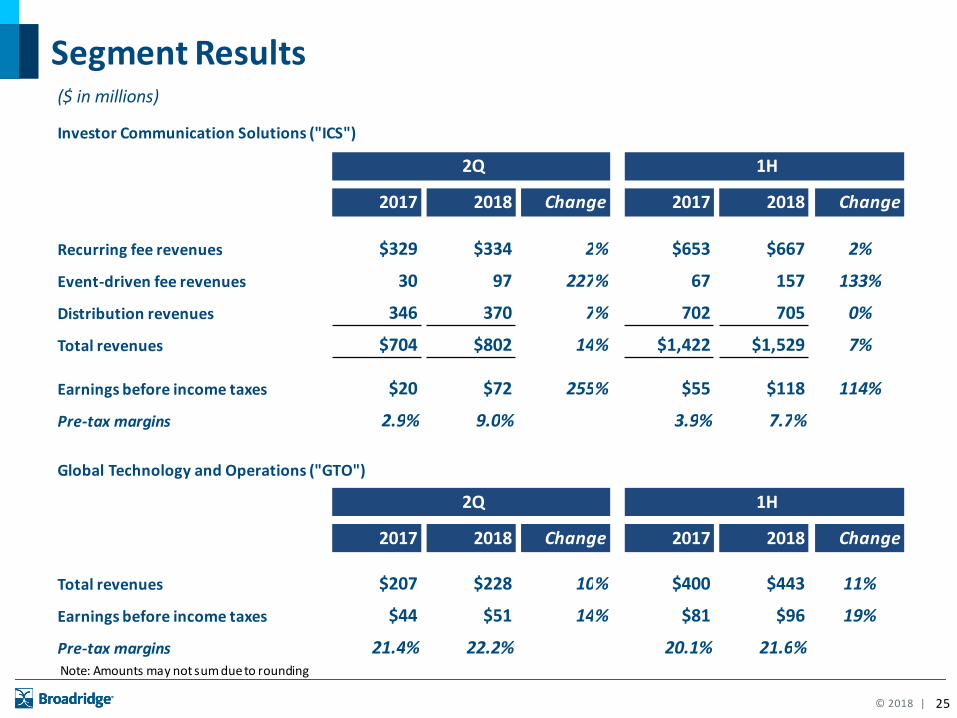
($ in millions)
Investor Communication Solutions ("ICS")
2Q 1H
2017 2018 Change 2017 2018 Change
Recurring fee revenues $329 $334 2% $653 $667 2%
Event-driven fee revenues 30 97 227% 67 157 133%
Distribution revenues 346 370 7% 702 705 0%
Total revenues $704 $802 14% $1,422 $1,529 7%
Earnings before income taxes $20 $72 255% $55 $118 114%
Pre-tax margins 2.9% 9.0% 3.9% 7.7%
Global Technology and Operations ("GTO")
2Q 1H
2017 2018 Change 2017 2018 Change
Total revenues $207 $228 10% $400 $443 11%
Earnings before income taxes $44 $51 14% $81 $96 19%
Pre-tax margins 21.4% 22.2% 20.1% 21.6%
Segment Results
Note: Amounts may not sum due to rounding
25

© 2018 |
Fiscal Year 2018 Guidance1
Original Revised
Recurring fee revenue growth 4 - 6% 4 - 6%
Total revenue growth 2 - 3% 2 - 4%
Operating income margin - GAAP ~14% ~14%
Adjusted Operating income margin - Non-GAAP ~16% ~16%
Diluted earnings per share growth* 15 - 19% 22 - 26%
Adjusted earnings per share growth* - Non-GAAP 15 - 19% 27 - 31%
Free cash flow* - Non-GAAP $400 - $450M $500 - $550M
Closed sales $170 - $210M $170 - $210M
1 Revised Fiscal Year 2018 guidance as of 2/8/2018 Second Quarter FY2018 Earnings Call* Revised FY2018 guidance includes projected $20 million, or $0.17 per share, from excess tax benefits from stock-based compensation
26

© 2018 |
Supplemental Reporting Detail
27
FISCAL YEAR 2017 AND SECOND QUARTER AND SIX MONTHS FISCAL YEAR 2018
ADDITIONAL PRODUCT LINE REPORTING
Fiscal Year Quarter Ended December 31, % Six Months Ended December 31, %
$ in millions 2017 2017 Change 2017 Change
Investor Communication Solutions ("ICS")
Equity proxy $382.0 $33.6 6% $63.6 2%
Mutual fund interims 198.2 46.9 6% 96.2 9%
Customer communications & fulfillment 763.5 187.3 -1% 368.9 -1%
Other ICS 282.0 66.5 3% 138.7 7%
Total ICS recurring fee revenues $1,625.7 $334.4 2% $667.4 2%
Equity & other 86.4 28.8 100% 59.5 85%
Mutual funds 132.5 68.6 345% 97.1 176%
Total event driven revenues $218.9 $97.3 227% $156.6 133%
Distribution 1,554.0 370.4 7% 704.7 0%
Total ICS revenues $3,398.6 $802.2 14% $1,528.6 7%
Global Technology & Operations ("GTO")
Equities & other 686.2 189.4 10% 368.4 11%
Fixed income 139.3 38.5 9% 74.5 9%
Total GTO recurring fee revenues $825.5 $228.0 10% $442.9 11%
Foreign currency exchange (81.5) (17.4) -7% (33.9) -2%
Total revenues $4,142.6 $1,012.8 13% $1,937.6 8%
Revenues by Type 0
Recurring fee revenues $2,451.2 $562.4 5% $1,110.2 5%
Event driven revenues 218.9 97.3 227% 156.6 133%
Distribution revenues 1,554.0 370.4 7% 704.7 0%
Foreign currency exchange (81.5) (17.4) -7% (33.9) -2%
Total revenues $4,142.6 $1,012.8 13% $1,937.6 8%
Amounts may not sum due to rounding
© 2018 |
GAAP Reconciliations
© 2018 |
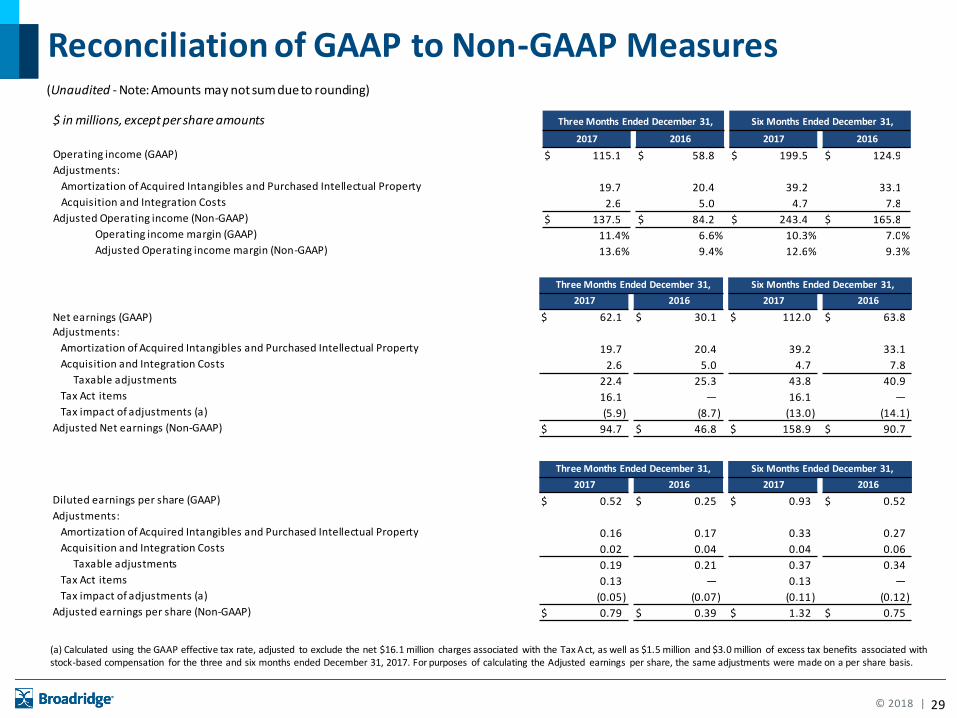
Reconciliation of GAAP to Non-GAAP Measures
$ in millions, except per share amounts Three Months Ended December 31, Six Months Ended December 31,
2017 2016 2017 2016
Operating income (GAAP) $ 115.1 $ 58.8 $ 199.5 $ 124.9Adjustments:
Amortization of Acquired Intangibles and Purchased Intellectual Property 19.7 20.4 39.2 33.1Acquisition and Integration Costs 2.6 5.0 4.7 7.8
Adjusted Operating income (Non-GAAP) $ 137.5 $ 84.2 $ 243.4 $ 165.8Operating income margin (GAAP) 11.4% 6.6% 10.3% 7.0%Adjusted Operating income margin (Non-GAAP) 13.6% 9.4% 12.6% 9.3%
Three Months Ended December 31, Six Months Ended December 31,
2017 2016 2017 2016
Net earnings (GAAP) $ 62.1 $ 30.1 $ 112.0 $ 63.8Adjustments:
Amortization of Acquired Intangibles and Purchased Intellectual Property 19.7 20.4 39.2 33.1Acquisition and Integration Costs 2.6 5.0 4.7 7.8
Taxable adjustments 22.4 25.3 43.8 40.9Tax Act items 16.1 — 16.1 —Tax impact of adjustments (a) (5.9) (8.7) (13.0) (14.1)
Adjusted Net earnings (Non-GAAP) $ 94.7 $ 46.8 $ 158.9 $ 90.7
Three Months Ended December 31, Six Months Ended December 31,
2017 2016 2017 2016
Diluted earnings per share (GAAP) $ 0.52 $ 0.25 $ 0.93 $ 0.52Adjustments:
Amortization of Acquired Intangibles and Purchased Intellectual Property 0.16 0.17 0.33 0.27Acquisition and Integration Costs 0.02 0.04 0.04 0.06
Taxable adjustments 0.19 0.21 0.37 0.34Tax Act items 0.13 — 0.13 —Tax impact of adjustments (a) (0.05) (0.07) (0.11) (0.12)
Adjusted earnings per share (Non-GAAP) $ 0.79 $ 0.39 $ 1.32 $ 0.75
(Unaudited - Note: Amounts may not sum due to rounding)
29
(a) Calculated using the GAAP effective tax rate, adjusted to exclude the net $16.1 million charges associated with the Tax A ct, as well as $1.5 million and $3.0 million of excess tax benefits associated with stock-based compensation for the three and six months ended December 31, 2017. For purposes of calculating the Adjusted earnings per share, the same adjustments were made on a per share basis.

© 2018 |
Reconciliation of GAAP to Non-GAAP Measures
Six Months Ended December 31,
2017 2016
Net cash flows provided by (used in) operating activities (GAAP) $ 141.8 $ (5.5)
Capital expenditures and Software purchases and capitalized internal use software (52.5) (32.0)
Free cash flow (Non-GAAP) $ 89.3 $ (37.5)
(Unaudited - Note: Amounts may not sum due to rounding)
30

© 2018 |
Reconciliation of GAAP to Non-GAAP Measures
31
Fiscal Years Ended June 30, 2017 2016 2015 2014
Operating income (GAAP) $ 531.6 $ 500.3 $ 466.9 $ 418.2
Adjustments:Amortization of Acquired Intangibles and Purchased Intellectual Property 72.6 31.8 25.3 22.6
Acquisition and Integration Costs 19.1 5.0 5.0 2.1
Adjusted Operating income (Non-GAAP) $ 623.3 $ 537.1 $ 497.2 $ 442.9
Operating income margin (GAAP) 12.8% 17.3% 17.3% 16.3%
Adjusted Operating income margin (Non-GAAP)15.0% 18.5% 18.5% 17.3%
Fiscal Years Ended June 30, 2017 2016 2015 2014
Net earnings (GAAP) $ 326.8 $ 307.5 $ 287.1 $ 263.0Adjustments:
Amortization of Acquired Intangibles and Purchased Intellectual Property 72.6 31.8 25.3 22.6Acquisition and Integration Costs 19.1 5.0 5.0 2.1MAL investment gain (9.3) — — —Tax impact of adjustments (30.9) (12.7) (10.5) (8.7)
Adjusted Net earnings (Non-GAAP) $ 378.3 $ 331.7 $ 306.9 $ 279.0
Fiscal Years Ended June 30, 2017 2016 2015 2014
Diluted earnings per share (GAAP) $ 2.70 $ 2.53 $ 2.32 $ 2.12Adjustments:
Amortization of Acquired Intangibles and Purchased Intellectual Property 0.60 0.26 0.20 0.18Acquisition and Integration Costs 0.16 0.04 0.04 0.02MAL investment gain (0.08) — — —Tax impact of adjustments (0.26) (0.10) (0.08) (0.07)
Adjusted earnings per share (Non-GAAP) $ 3.13 $ 2.73 $ 2.47 $ 2.25
Fiscal Years Ended June 30, 2017 2016 2015 2014
Net cash flows provided by operating activities (GAAP) $ 515.9 $ 437.7 $ 431.4 $ 387.7
Capital expenditures and Software purchases and capitalized internal use software (113.7) (75.5) (66.0) (53.4)
Free cash flow (Non-GAAP) $ 402.2 $ 362.2 $ 365.4 $ 334.3
Note: Amounts may not sum due to rounding.
(Unaudited - dollars in millions, except per share amounts)

© 2018 |
Reconciliation of GAAP to Non-GAAP Measures -Revised FY18 Guidance
(Unaudited)
Adjusted Earnings Per Share Growth Rate (1) (2)
Diluted earnings per share (GAAP) 22% - 26%
Adjusted earnings per share (Non-GAAP) 27% - 31%
Adjusted Operating Income Margin (3)
Operating income margin % (GAAP) ~14%
Adjusted Operating income margin % (Non-GAAP) ~16%
Free Cash Flow (2)
Net cash flows provided by operating activities (GAAP) $610 - $680 million
Capital expenditures and Software purchases and capitalized internal use software (110) - (130) million
Free cash flow (Non-GAAP) $500 - $550 million
(1) Adjusted EPS growth (Non-GAAP) is adjusted to exclude the projected impact of Amortization of Acquired Intangibles and Purc hased Intellectual Property, Acquisition and Integration Costs and Tax Act items, and is calculated using diluted shares outstanding. Fiscal year 2018 Non -GAAP Adjusted EPS guidance estimates exclude Amortization of
Acquired Intangibles and Purchased Intellectual Property, Acquisition and Integration Costs, net of taxes, and Tax Act items of approximately $0.65 per share.
(2) Revised guidance includes projected $20 million, or $0.17 per share, from excess tax benefits from stock -based compensation.
32
(3) Adjusted Operating income margin (Non-GAAP) is adjusted to exclude the projected impact of Amortization of Acquired Intangi bles and Purchased Intellectual Property, and Acquisition and Integration Costs. Fiscal year 2018 Non-GAAP Adjusted Operating income margin guidance estimates exclude Amortization of Acquired Intangibles and Purchased
Intellectual Property, and Acquisition and Integration Costs of approximately $90 million.


