46
Investor Presentation First Quarter FY22 NASDAQ: MLHR

Investor PresentationFirst Quarter FY22
NASDAQ: MLHR
INVESTOR PRESENTATION 2
This presentation contains forward-looking statements within the meaning of Section 27A of the Securities Act of 1933, as amended, and Section 21E of the Securities Exchange Act, as amended, that are based on management’s beliefs, assumptions, current expectations, estimates, and projections about the office furniture industry, the economy, and the company itself. Any statements that are not historical facts should be considered forward-looking statements. Words like “anticipates,” “believes,” “confident,” “estimates,” “expects,” “forecasts,” likely,” “plans,” “projects,” “should,” variations of such words, and similar expressions identify such forward-looking statements.
These statements do not guarantee future performance and are not intended as such. Actual results are subject to various risks and uncertainties that are difficult to predict with regard to timing, extent, likelihood, and degree of occurrence. These risks include, without limitation:
• the success of our growth strategy• our success in initiatives aimed at achieving long-term profit
optimization goals• risks associated with our recent acquisition of Knoll, including
the challenge of successfully integrating the business, realizing the anticipated benefits, and managing related disruptions
• our ability to comply with our debt covenants and obligations, which increased significantly in connection with our acquisition of Knoll
• employment and general economic conditions, including the pace of economic recovery in the U.S. and in our international markets
• the availability and pricing of raw materials and other supplies• our reliance on a limited number of suppliers• our ability to expand globally given the risks associated with
regulatory and legal compliance challenges and accompanying currency fluctuations
• changes in future tax legislation or interpretation of current tax legislation
• the ability to increase prices to absorb the additional costs of raw materials
• changes in global tariff regulations • the financial strength of our dealers and our customers• changes in white-collar employment levels
• the willingness of customers to undertake capital expenditures
• the types of products purchased by customers• competitive-pricing pressures• our ability to locate new retail studios and negotiate
favorable lease terms for new and existing locations and implement our studio portfolio transformation
• our ability to attract and retain key executives and other qualified employees
• our ability to continue to make product innovations• the success of newly-introduced products• our ability to integrate and benefit from acquisitions and
investments • the pace and level of government procurement• the outcome of pending litigation, governmental audits,
and/or investigations• political risk in the markets we serve• natural disasters, public health crises, and disease
outbreaks• other risks identified in our filings with the SEC
As a result of these risks and other risks that may materialize, actual results and outcomes may differ significantly from what we express or forecast in this presentation. We undertake no obligation to update, amend, or clarify forward-looking statements after the date of this presentation.
Forward looking statements

INVESTOR PRESENTATION 3
COMPANY SNAPSHOT

INVESTOR PRESENTATION 4
Creating the preeminent leader in modern design
1. Pairs two industry pioneers to catalyze the transformation of the home and office at a time of unprecedented disruption
2. Combines two highly complementary businesses to create a broader product portfolio
3. Enhances scale and capabilities to drive growth and profitability
4. Accelerates digital and technology transformation
5. Brings together common cultures and capabilities, with a shared commitment to social responsibility
6. Positions the business to deliver significant financial benefits
HERMAN MILLER + KNOLL
Company Snapshot
INVESTOR PRESENTATION 5INVESTOR PRESENTATION 5
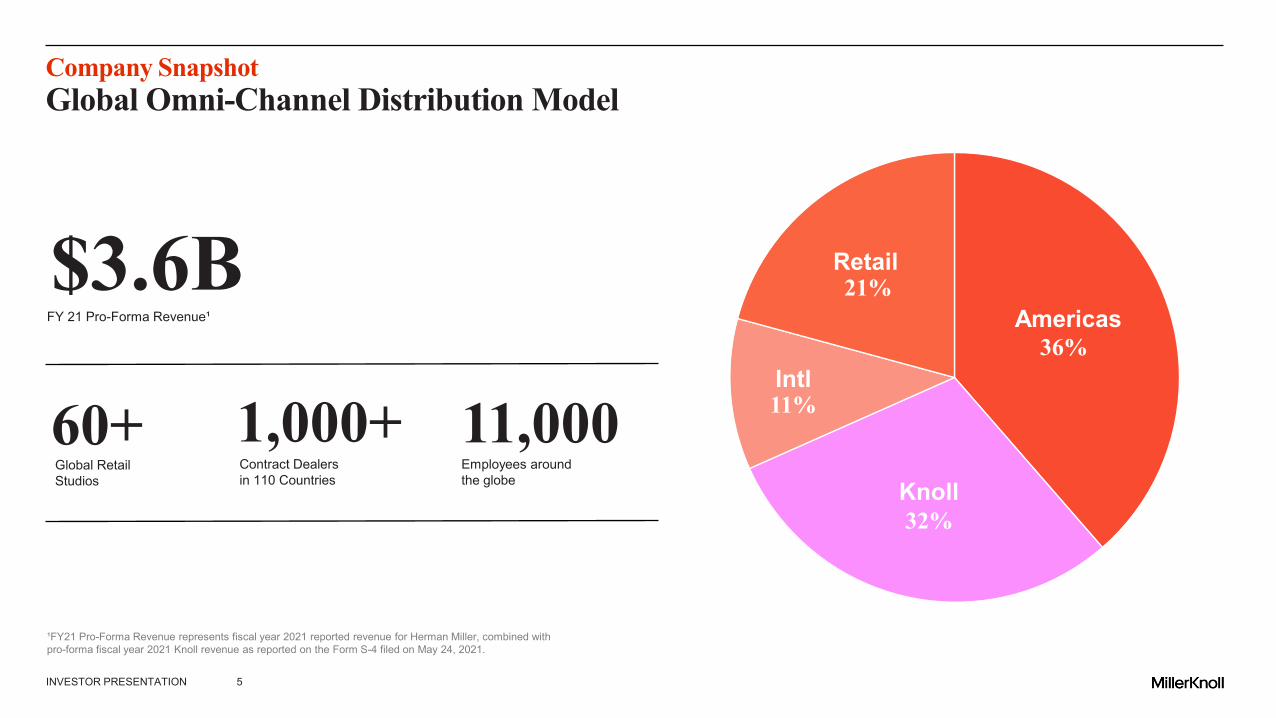
Company SnapshotGlobal Omni-Channel Distribution Model
FY 21 Pro-Forma Revenue¹
$3.6B
1,000+Contract Dealers in 110 Countries
60+Global Retail Studios
11,000Employees around the globe
Retail
11%
Americas36%
Intl
Knoll32%
21%
¹FY21 Pro-Forma Revenue represents fiscal year 2021 reported revenue for Herman Miller, combined with pro-forma fiscal year 2021 Knoll revenue as reported on the Form S-4 filed on May 24, 2021.

INVESTOR PRESENTATION 6
Company SnapshotBroad Product Library Across MillerKnoll Group of Brands

INVESTOR PRESENTATION 7
Bubble size indicates relative revenuePR
EMIU
MAC
CES
SIBL
E
COMMERCIAL RESIDENTIAL
Herman Miller Knoll
*Encompasses major brands.
maars
Colebrook Bosson
Saunders
Geiger
fully
HAY
DWR
Holly Hunt
Herman Miller
Maharam
Edelman Leather
naughtone
Knoll Studio
Knoll Textiles
muuto
DatesWeiser
Spinneybeck | filzfelt
Knoll Office
Company Snapshot

INVESTOR PRESENTATION 8
STRATEGIC CONTEXT

INVESTOR PRESENTATION 9
Digital Disruption Rise Of Direct-to-consumer Business Models
Changes In Where & How People Work
Environmental, Social, and Governance Imperative
Safe and Healthy Working Conditions
Focus on Home Environments
Strategic ContextMarket dynamics today
INVESTOR PRESENTATION 10
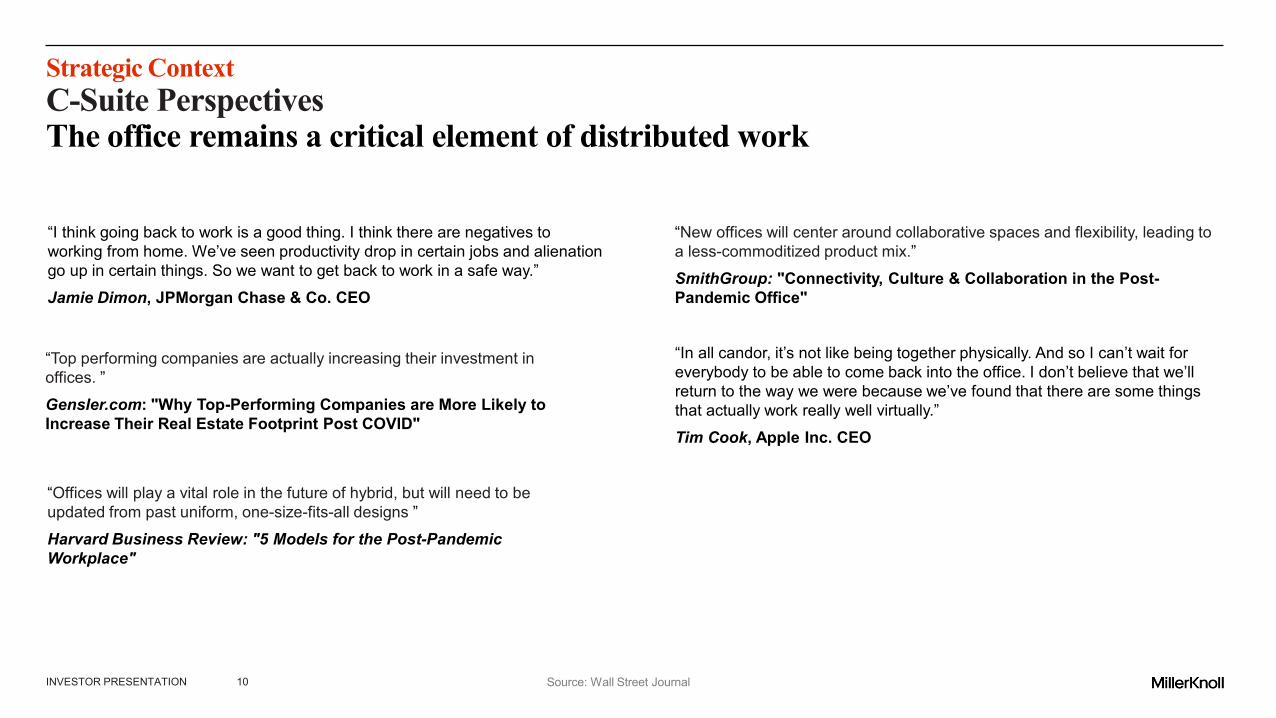
Strategic ContextC-Suite PerspectivesThe office remains a critical element of distributed work
“In all candor, it’s not like being together physically. And so I can’t wait for everybody to be able to come back into the office. I don’t believe that we’ll return to the way we were because we’ve found that there are some things that actually work really well virtually.”Tim Cook, Apple Inc. CEO
“New offices will center around collaborative spaces and flexibility, leading to a less-commoditized product mix.”SmithGroup: "Connectivity, Culture & Collaboration in the Post-Pandemic Office"
“Top performing companies are actually increasing their investment in offices. ”Gensler.com: "Why Top-Performing Companies are More Likely to Increase Their Real Estate Footprint Post COVID"
“I think going back to work is a good thing. I think there are negatives to working from home. We’ve seen productivity drop in certain jobs and alienation go up in certain things. So we want to get back to work in a safe way.”Jamie Dimon, JPMorgan Chase & Co. CEO
Source: Wall Street Journal
“Offices will play a vital role in the future of hybrid, but will need to be updated from past uniform, one-size-fits-all designs ”Harvard Business Review: "5 Models for the Post-Pandemic Workplace"

INVESTOR PRESENTATION 11Other Leading Economic Indicators include: Corporate profitability, service sector employment, Office vacancy rates, CEO and small business confidence
AIA Consensus Construction ForecastU.S. Commercial Market Sales
Source: BIFMA, May 2021 Source: The American Institute of Architects, July 2021 Source: The American Institute of Architects
2021 2022
Non-Residential -3.9% 4.6%
Commercial Total -5.4% 5.4%
Office -5.6% -0.1%
Health 1.4% 4.4%
Education -2.1% 3.6%
Hotel -19.9% 18.9%
0.3% 1.6% 2.3%
4.6%
-12.2%
1.8% -1.1%3.9%
-15.0%
-10.0%
-5.0%
0.0%
5.0%
10.0%
2016 2017 2018 2019 2020 2021P 2022F 2023F
202530354045505560
U.S. Architects Billing Index
Source: Ntl. Assoc. of Realtors U.S. Economic Outlook, August 2021
Existing Home Sales
-15.00%
-5.00%
5.00%
15.00%
25.00%
35.00%
45.00%
2013 2014 2015 2016 2017 2018 2019 2020 2021
5340 5340 5640 6000 5990
0
2000
4000
6000
8000
2018 2019 2020 2021 2022
1250 1290 13811565 1650
0
500
1000
1500
2000
2018 219 2020 2021 2022
History Forecast
Housing Starts
Source: Ntl. Assoc. of Realtors U.S. Economic Outlook, August 2021 Source: US Census Bureau; 2021 reflecting YTD through July vs.
prior YTD July
Furniture and Home Furnishing Stores
(%YOY GROWTH)
ANNUAL SALES GROWTH(THOUSANDS OF UNITS)(THOUSANDS OF UNITS)
History Forecast
Strategic ContextMacro-Economic Drivers

INVESTOR PRESENTATION 12
Strategic ContextOperating from a position of strength
Broad Product Assortment Multi-Channel Distribution Workplace Knowledge and Research
Antonella to get content from Knoll team
Antonella to get content from Knoll team

INVESTOR PRESENTATION 13
STRATEGIC PRIORITIES
INVESTOR PRESENTATION 14
1 2 3 4
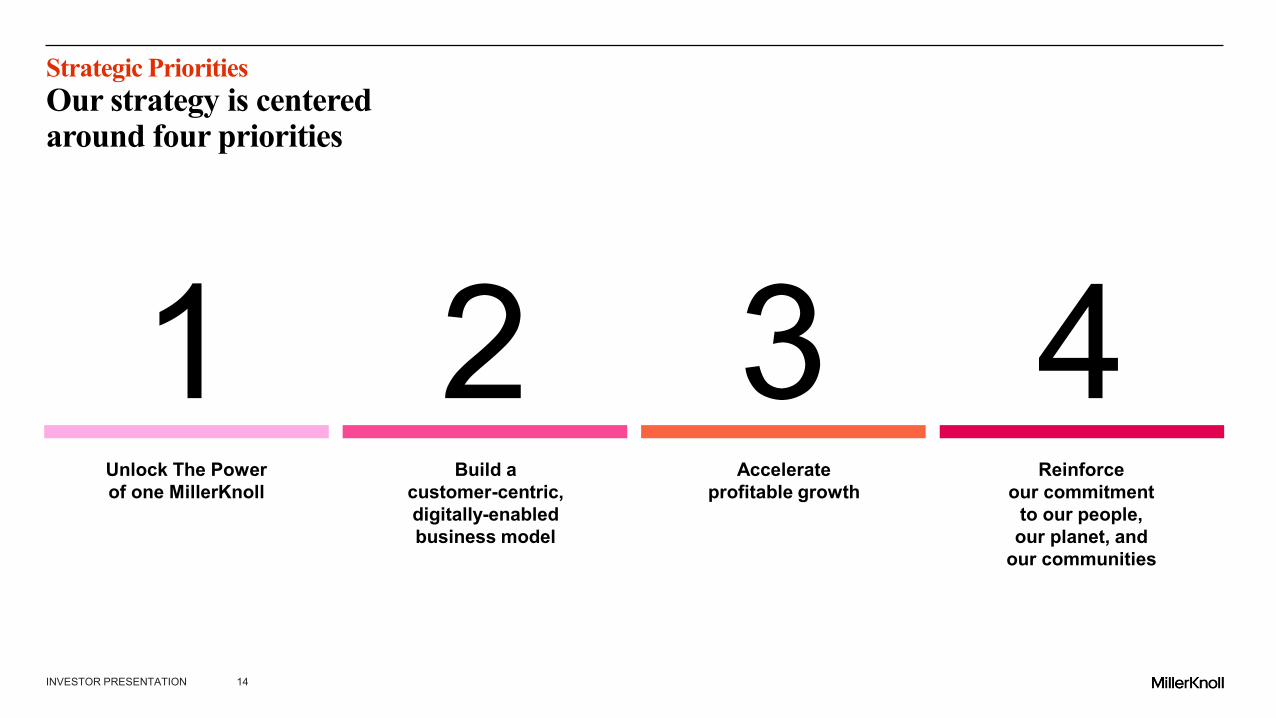
Strategic PrioritiesOur strategy is centered around four priorities
Unlock The Power of one MillerKnoll
Build a customer-centric, digitally-enabled business model
Accelerate profitable growth
Reinforce our commitment
to our people, our planet, and
our communities

INVESTOR PRESENTATION 15
Strategic PrioritiesUnlock the power of one MillerKnoll
Build an agile, collaborative,globally-connected organizationfit for continuous evolution
Simplify and tailor our go-to-market approach
Continue to lead in productand innovation
1

INVESTOR PRESENTATION 16
Strategic PrioritiesBuild a customer-centric, digitally-enabled business model
Leverage deep understanding of customer journeys to deliver inspired products and frictionless customer experiences
Drive step-change in our data, analytics, marketing, and brand capabilities
Strengthen our core technology backbone
2

INVESTOR PRESENTATION 17
Strategic PrioritiesAccelerate profitable growth
Continued leadership in Americas Contract business
Drive outsized growth in International Contract
Transform our Global Retail business
Integration of Knoll
3

INVESTOR PRESENTATION 18
Strategic PrioritiesAccelerate profitable growthContinued leadership in the Americas Contract business
Go-to-market Alignment Digital Tools New Products Profitability Improvement
3

INVESTOR PRESENTATION 19
Strategic PrioritiesAccelerate profitable growthDrive outsized growth in International Contract
Expand Dealer Distribution
Enter New Product Categories
Grow HAY and naughtone
Execute Profitability Improvement Initiatives
3

INVESTOR PRESENTATION 20
Strategic PrioritiesAccelerate profitable growthTransform our Global Retail business
Build New Digital Capabilities Increase Product Assortment Develop New Retail Seating Concept
Expand Gaming Portfolio
3

INVESTOR PRESENTATION 21
Strategic PrioritiesAccelerate profitable growthIntegration of Knoll
Enhanced scale and capability to drive growth and profitability
Accelerates digital and technology transformation
Position the business to deliver significant financial benefits
Compelling synergy opportunity
3

INVESTOR PRESENTATION 22
Strategic PrioritiesReinforce our commitment to our people, our planet, & our communities
Build, develop, and retain world-class talent
Shape an inclusive and diverse ecosystem
Elevate Our Better World Commitment
4

INVESTOR PRESENTATION 23
Strategic PrioritiesShared focus on sustainability and social good
Sustainability
2020 50 Best ESG Companies Investor’s Business Daily
2020 Platinum CSR Rating EcoVadis
Over 27,000 tons of products diverted from landfills since 2009 Through rePurpose program
Wellness
WELL Portfolio and WELL Health-Safety Rating First furniture company to register
Community Impact
Knoll Diversity Advancement Design Scholarships for Black StudentsHelp develop the next generation of design professionals
Habitat for Humanity PartnershipExpands commitment to good design and sustainable building practices
World Monuments Fund: Knoll Modernism PrizeFounding sponsor of Modernism at Risk Program, which enhances awareness of the role that Modernism plays in the built environment
Inclusivity & Diversity
CEO Action for Inclusion & Diversity Pledge Signed by Andi Owen, CEO; named four fellows to CEO Action for Racial Equity Fellowship
2020 Best Companies for Dads Working Mothers Magazine
Thirteen Consecutive Perfect Scores Human Rights Campaign Foundation’s Corporate Equality Index
Community Impact: Herman Miller Cares
COVID Response Over 170,000 masks, gowns and face shields provided to front line workers
Sustainability
Environment, Social andGovernance CommitmentsSustainability Report prepared in accordance with Global Reporting Initiative (GRI) Standards—Core Option
Conduct & Culture
Knoll Diversity & Inclusion CouncilMission to create and maintain culture of acceptance, empowerment and equitable learning and working environments
Board of DirectorsCommitted to maintaining at least 30% diversity by both gender and race

INVESTOR PRESENTATION 24
FINANCIAL PERFORMANCE
INVESTOR PRESENTATION 25
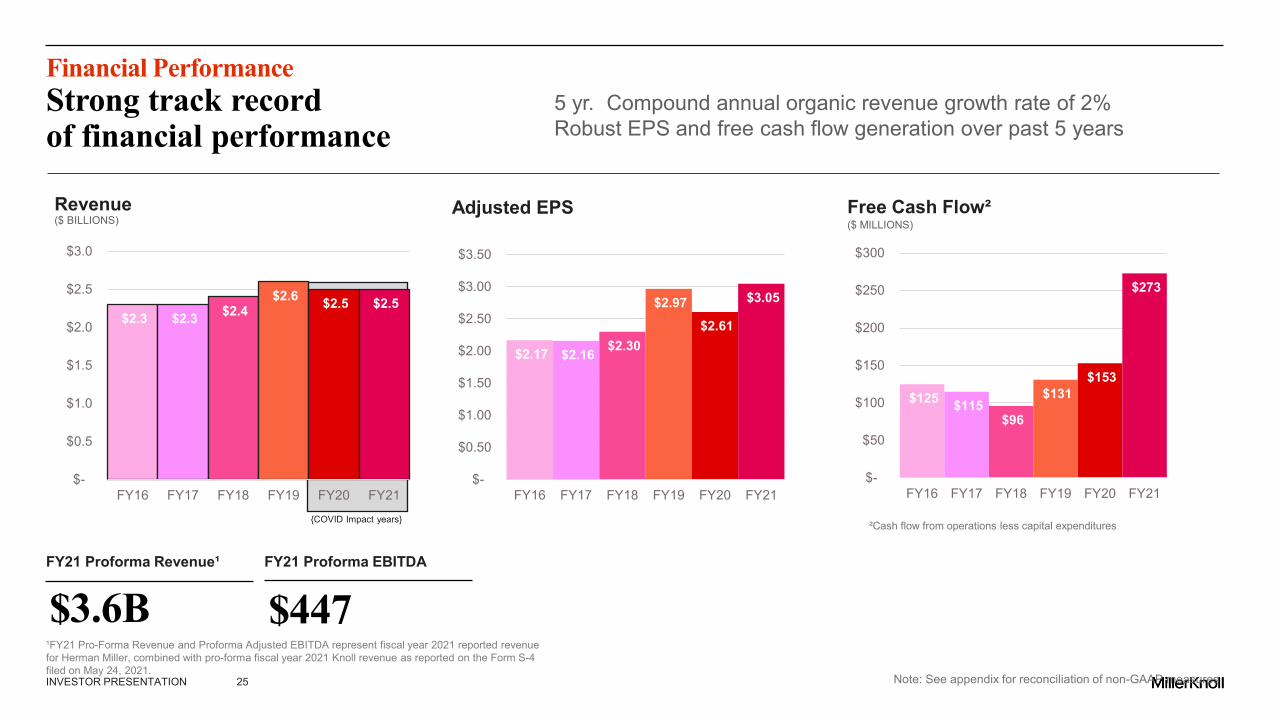
5 yr. Compound annual organic revenue growth rate of 2%Robust EPS and free cash flow generation over past 5 years
$2.17 $2.16 $2.30
$2.97 $2.61
$3.05
$-
$0.50
$1.00
$1.50
$2.00
$2.50
$3.00
$3.50
FY16 FY17 FY18 FY19 FY20 FY21
Adjusted EPS
$125 $115 $96
$131 $153
$273
$-
$50
$100
$150
$200
$250
$300
FY16 FY17 FY18 FY19 FY20 FY21
²Cash flow from operations less capital expenditures
Free Cash Flow²($ MILLIONS)
Financial PerformanceStrong track record of financial performance
Note: See appendix for reconciliation of non-GAAP measures
$2.3 $2.3 $2.4 $2.6 $2.5 $2.5
$-
$0.5
$1.0
$1.5
$2.0
$2.5
$3.0
FY16 FY17 FY18 FY19 FY20 FY21
Revenue($ BILLIONS)
{COVID Impact years}
FY21 Proforma Revenue¹
$3.6BFY21 Proforma EBITDA
$447¹FY21 Pro-Forma Revenue and Proforma Adjusted EBITDA represent fiscal year 2021 reported revenue for Herman Miller, combined with pro-forma fiscal year 2021 Knoll revenue as reported on the Form S-4 filed on May 24, 2021.
INVESTOR PRESENTATION 26
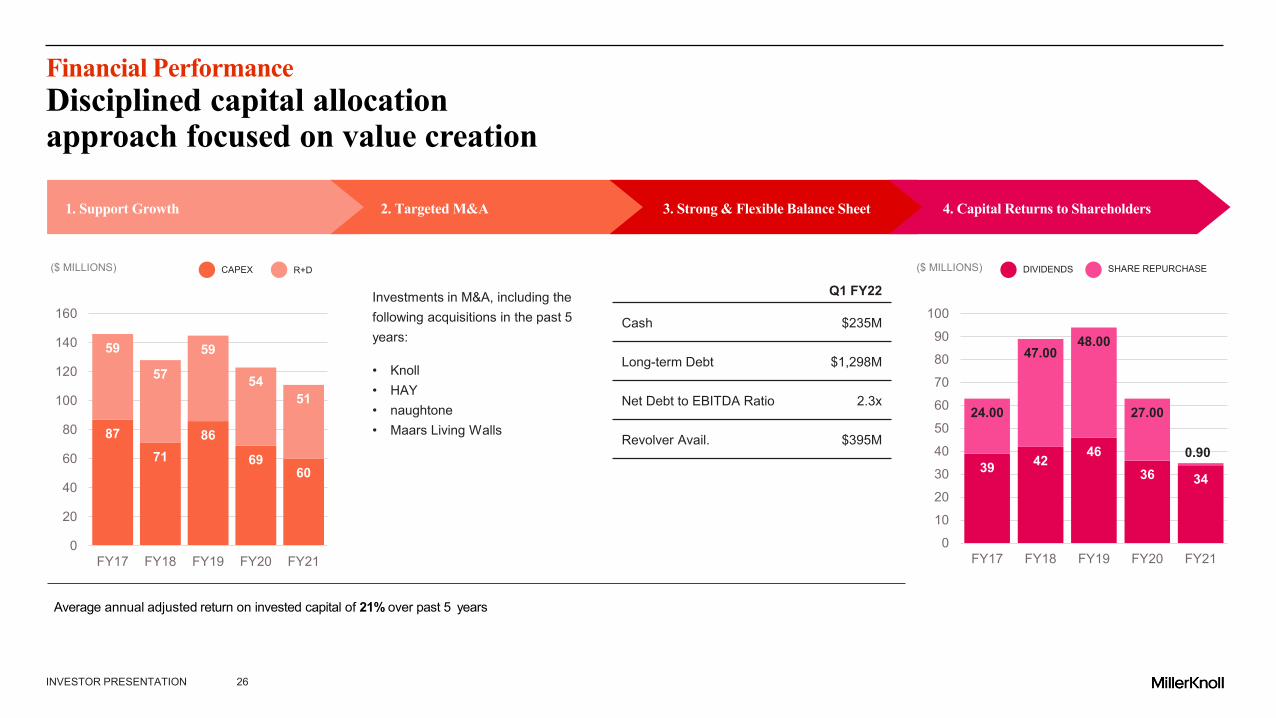
8771
86
6960
59
57
59
5451
0
20
40
60
80
100
120
140
160
FY17 FY18 FY19 FY20 FY21
($ MILLIONS)
1. Support Growth 2. Targeted M&A 3. Strong & Flexible Balance Sheet 4. Capital Returns to Shareholders
39 42 4636 34
24.00
47.0048.00
27.00
0.90
0
10
20
30
40
50
60
70
80
90
100
FY17 FY18 FY19 FY20 FY21
CAPEX R+D
Investments in M&A, including the following acquisitions in the past 5 years:
• Knoll• HAY• naughtone• Maars Living Walls
Q1 FY22
Cash $235M
Long-term Debt $1,298M
Net Debt to EBITDA Ratio 2.3x
Revolver Avail. $395M
Average annual adjusted return on invested capital of 21% over past 5 years
($ MILLIONS) DIVIDENDS SHARE REPURCHASE
Financial PerformanceDisciplined capital allocation approach focused on value creation
INVESTOR PRESENTATION 27
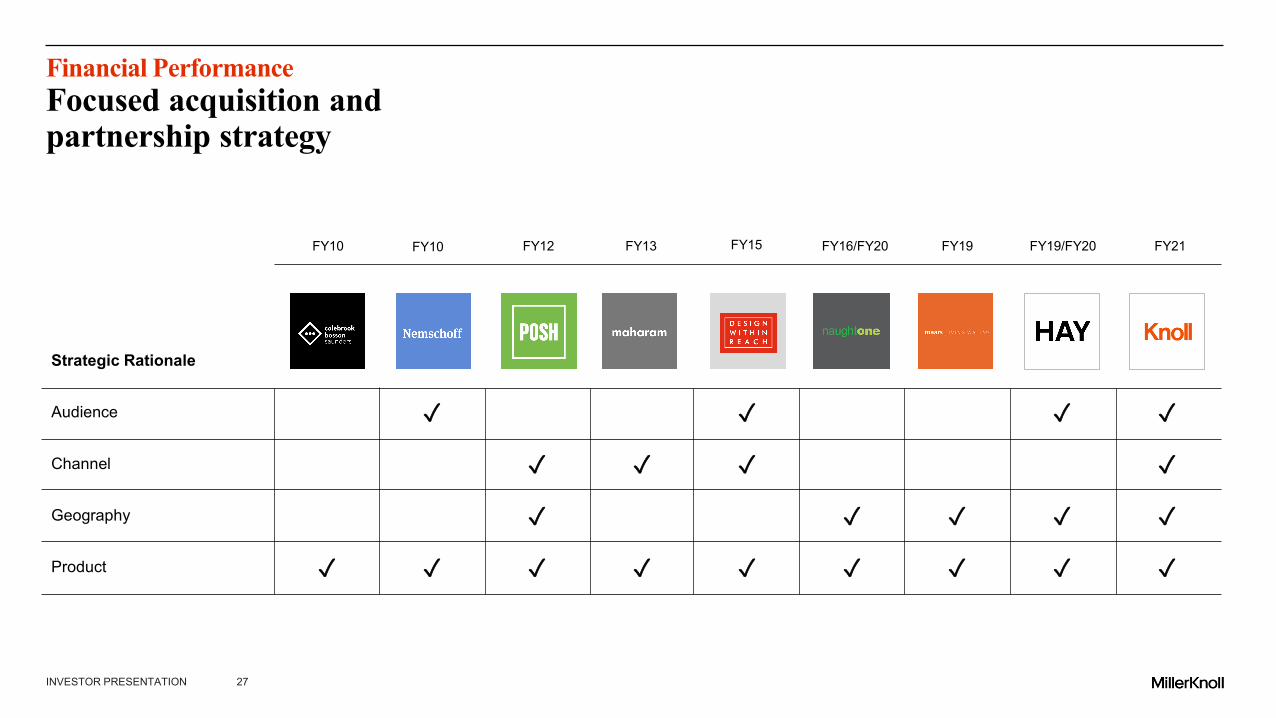
Financial PerformanceFocused acquisition and partnership strategy
Strategic Rationale
Audience
Channel
Geography
Product
✓ ✓ ✓ ✓
✓ ✓ ✓ ✓
✓ ✓ ✓ ✓ ✓
✓ ✓ ✓ ✓ ✓ ✓ ✓ ✓ ✓
FY10 FY12 FY13 FY15 FY16/FY20 FY19 FY19/FY20 FY21FY10

INVESTOR PRESENTATION 28
Financial PerformanceOur compelling story
Distinct capabilities Clear strategic priorities Strong track record of financial performance and
compelling outlook

INVESTOR PRESENTATION 29
RECENT QUARTERLY FINANCIAL TRENDS
INVESTOR PRESENTATION 30
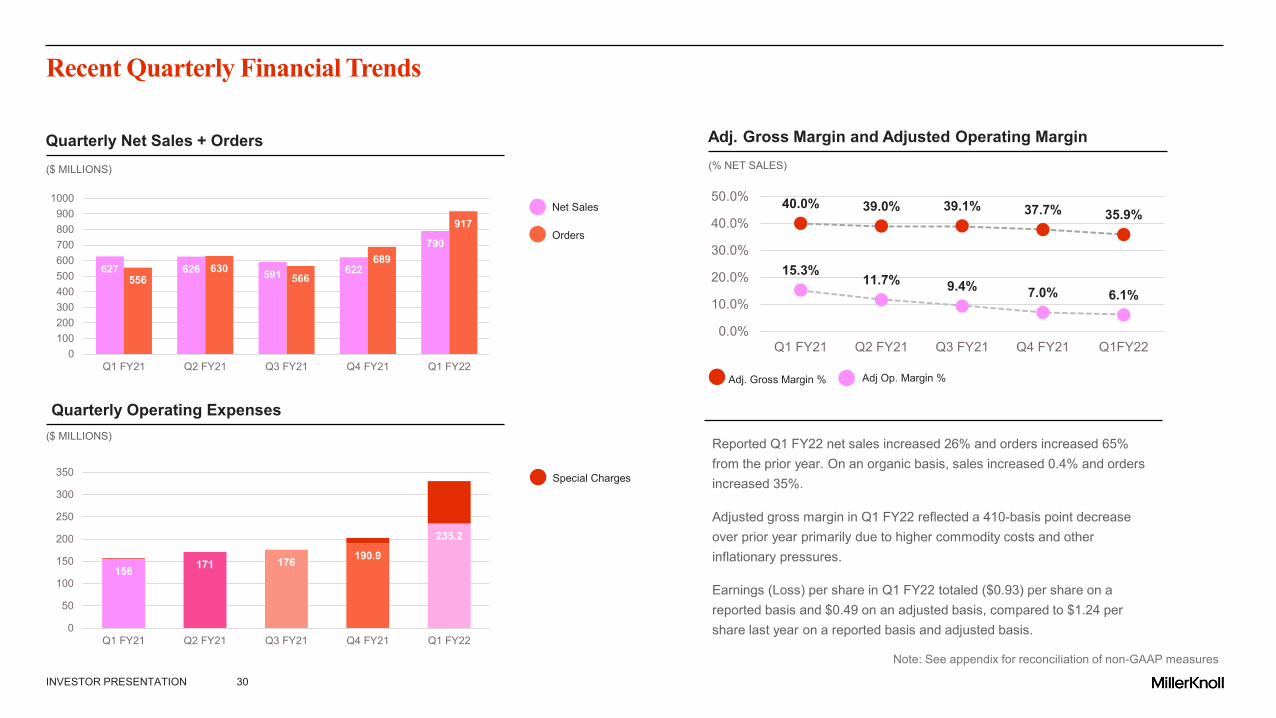
Recent Quarterly Financial Trends
Reported Q1 FY22 net sales increased 26% and orders increased 65% from the prior year. On an organic basis, sales increased 0.4% and orders increased 35%.
Adjusted gross margin in Q1 FY22 reflected a 410-basis point decrease over prior year primarily due to higher commodity costs and other inflationary pressures.
Earnings (Loss) per share in Q1 FY22 totaled ($0.93) per share on a reported basis and $0.49 on an adjusted basis, compared to $1.24 per share last year on a reported basis and adjusted basis.
Note: See appendix for reconciliation of non-GAAP measures
Quarterly Net Sales + Orders
Quarterly Operating Expenses($ MILLIONS)
($ MILLIONS)
Adj. Gross Margin and Adjusted Operating Margin(% NET SALES)
Adj. Gross Margin % Adj Op. Margin %
40.0% 39.0% 39.1% 37.7% 35.9%
15.3%11.7% 9.4% 7.0% 6.1%
0.0%
10.0%
20.0%
30.0%
40.0%
50.0%
Q1 FY21 Q2 FY21 Q3 FY21 Q4 FY21 Q1FY22
Net Sales
Orders
Special Charges
627 626 591 622
790
556630
566
689
917
0100200300400500600700800900
1000
Q1 FY21 Q2 FY21 Q3 FY21 Q4 FY21 Q1 FY22
156 171 176 190.9
235.2
0
50
100
150
200
250
300
350
Q1 FY21 Q2 FY21 Q3 FY21 Q4 FY21 Q1 FY22

INVESTOR PRESENTATION 31
Recent Quarterly Financial Trends
$297 $378 $397 $396
$235
$275 $275 $275 $275
$1,298
$0
$200
$400
$600
$800
$1,000
$1,200
$1,400
Q1 FY21 Q2 FY21 Q3 FY21 Q4 FY21 Q1 FY22
$116 $99
$46
$72
($29)
($40)
($20)
$0
$20
$40
$60
$80
$100
$120
$140
Q1 FY21 Q2 FY21 Q3 FY21 Q4 FY21 Q1 FY22
(1) See appendix for reconciliation of non-GAAP measures
Quarterly Cash Flow from Operations Quarterly Net Debt($ MILLIONS)
Net Debt to EBIDTA Ratio (Q1 FY22)
2.3x
($ MILLIONS)
Cash
Debt

INVESTOR PRESENTATION 32
Recent Quarterly Financial TrendsGuidance as provided in earnings press release dated September 29, 2021:
Q2 Fiscal2022
Revenue $1,025 to $1,065 million
Gross Margin % 35.6% to 36.6%
Adjusted Operating Expenses $305 to $311 million
Effective TaxRate 23% to 25%
Adjusted Earnings Per Share,Diluted¹ $0.55 to $0.61
¹Note: adjusted EPS excludes purchase accounting amortization
Note: See appendix for reconciliation of non-GAAP measures

INVESTOR PRESENTATION 33
APPENDIX
INVESTOR PRESENTATION 34
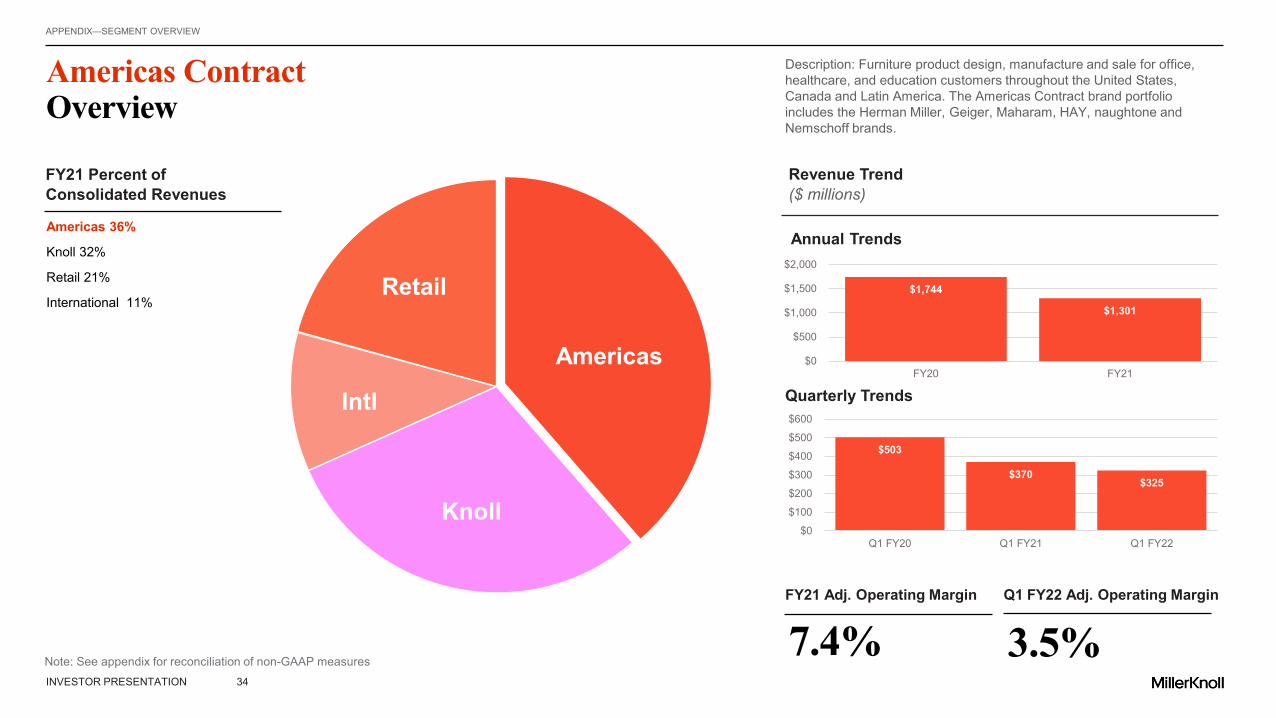
Americas ContractOverview
APPENDIX—SEGMENT OVERVIEW
Description: Furniture product design, manufacture and sale for office, healthcare, and education customers throughout the United States, Canada and Latin America. The Americas Contract brand portfolio includes the Herman Miller, Geiger, Maharam, HAY, naughtone and Nemschoff brands.
Americas 36%
Knoll 32%
Retail 21%
International 11%
FY21 Percent of Consolidated Revenues
FY21 Adj. Operating Margin
Americas
Intl
Retail
Knoll
7.4%
Revenue Trend($ millions)
$1,744
$1,301
$0
$500
$1,000
$1,500
$2,000
FY20 FY21
$503
$370 $325
$0
$100
$200
$300
$400
$500
$600
Q1 FY20 Q1 FY21 Q1 FY22
Q1 FY22 Adj. Operating Margin
3.5%
Annual Trends
Quarterly Trends
Note: See appendix for reconciliation of non-GAAP measures

INVESTOR PRESENTATION 35
Global RetailOverview
APPENDIX—SEGMENT OVERVIEW
Description: Sale of modern design furnishings and accessories in North America through multiple channels, including eCommerce storefronts, direct mailing catalogs and independent retailers. Retail brands include Design Within Reach, HAY and Herman Miller
Americas 36%
Knoll 32%
Retail 21%
International 11%
FY21 Percent of Consolidated Revenues
AmericasIntl
Retail
Knoll
Revenue Trend($ millions)
$396
$764
$0$200$400$600$800
$1,000
FY20 FY21
FY21 Adj. Operating Margin
18.7%Q1 FY22 Adj. Operating Margin
13.1%
$84
$163
$213
$0
$50
$100
$150
$200
$250
Q1 FY20 Q1 FY21 Q1 FY22
Annual Trends
Quarterly Trends
Note: See appendix for reconciliation of non-GAAP measures

INVESTOR PRESENTATION 36
International ContractOverview
APPENDIX—SEGMENT OVERVIEW
Description: Design, manufacture and sale of furniture products primarily for office settings in EMEA (49% of sales in FY21) and Asia-Pacific (51% of sales in FY21)
Americas 36%
Knoll 32%
Retail 21%
International 11%
FY21 Percent of Consolidated Revenues
AmericasIntl
Retail
Knoll
$84 $94 $99
$0
$20
$40
$60
$80
$100
$120
Q1 FY20 Q1 FY21 Q1 FY22
Revenue Trend($ millions)
FY21 Adj. Operating Margin
12.1%Q1 FY22 Adj. Operating Margin
11.4%
$346 $400
$0$100$200$300$400$500
FY20 FY21
Annual Trends
Quarterly Trends
Note: See appendix for reconciliation of non-GAAP measures

INVESTOR PRESENTATION 37
$1,160
$0$200$400$600$800
$1,000$1,200$1,400
FY21 Pro-Forma
KnollOverview
APPENDIX—SEGMENT OVERVIEW
Description: Knoll, Inc. (acquired in Q1 FY22) is a constellation of design-driven brands with a portfolio of products that include furniture, textiles, leathers, accessories, and architectural and acoustical elements. Our brands — Knoll Office, KnollStudio, KnollTextiles, KnollExtra, Spinneybeck| FilzFelt, Edelman Leather, HOLLY HUNT, DatesWeiser, Muuto, and Fully — reflect our commitment to modern design that meets the diverse requirements of high-performance workplaces and luxury interiors.
Americas 36%
Knoll 32%
Retail 21%
International 11%
FY21 Percent of Consolidated Revenues
Q1 FY22 Adj. Operating Margin
AmericasIntl
Retail
Knoll
5.3%
$156
$0$50
$100$150$200
Q1 FY22*
Revenue Trend($ millions)
Annual
Quarterly
* Q1 FY22 revenue represents sales from the Knoll acquisition date of July 19th, 2021, to quarter end.Note: See appendix for reconciliation of non-GAAP measures
INVESTOR PRESENTATION 38
This presentation contains certain non-GAAP financial measures. Each of these financial measures is calculated by excluding items the Company believes are not indicative of its ongoing operating performance. The Company presents these non-GAAP financial measures because it considers them to be important supplemental indicators of financial performance and believes them to be useful in analyzing ongoing results from operations.
These non-GAAP financial measures are not measures of financial performance under GAAP and should not be considered alternatives to GAAP. Non-GAAP financial measures have limitations as analytical tools and should not be considered in isolation or as a substitute for analysis of the Company’s results as reported under GAAP. In addition, you should be aware that in the future the Company may incur expenses similar to the adjustments presented.
AppendixReconciliation of non-gaap measures
APPENDIX—RECONCILIATION OF NON-GAAP MEASURE
INVESTOR PRESENTATION 39
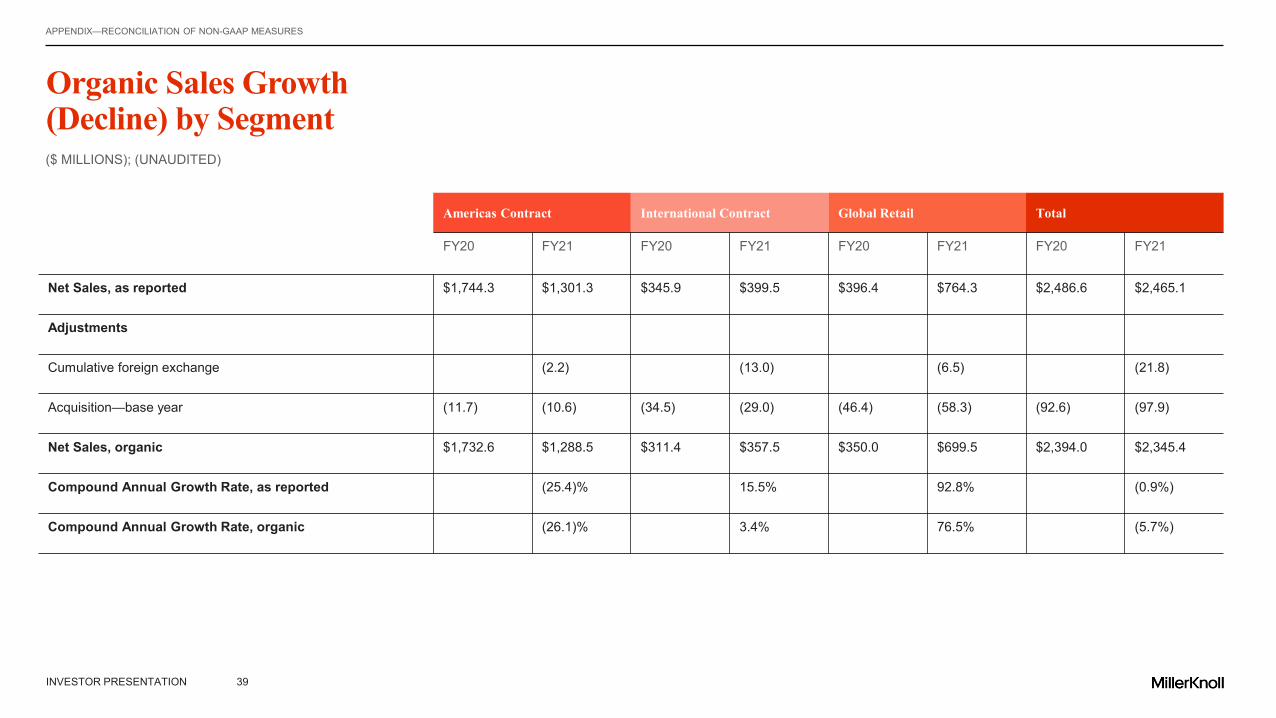
Organic Sales Growth (Decline) by Segment
APPENDIX—RECONCILIATION OF NON-GAAP MEASURES
($ MILLIONS); (UNAUDITED)
Americas Contract International Contract Global Retail Total
FY20 FY21 FY20 FY21 FY20 FY21 FY20 FY21
Net Sales, as reported $1,744.3 $1,301.3 $345.9 $399.5 $396.4 $764.3 $2,486.6 $2,465.1
Adjustments
Cumulative foreign exchange (2.2) (13.0) (6.5) (21.8)
Acquisition—base year (11.7) (10.6) (34.5) (29.0) (46.4) (58.3) (92.6) (97.9)
Net Sales, organic $1,732.6 $1,288.5 $311.4 $357.5 $350.0 $699.5 $2,394.0 $2,345.4
Compound Annual Growth Rate, as reported (25.4)% 15.5% 92.8% (0.9%)
Compound Annual Growth Rate, organic (26.1)% 3.4% 76.5% (5.7%)
INVESTOR PRESENTATION 40
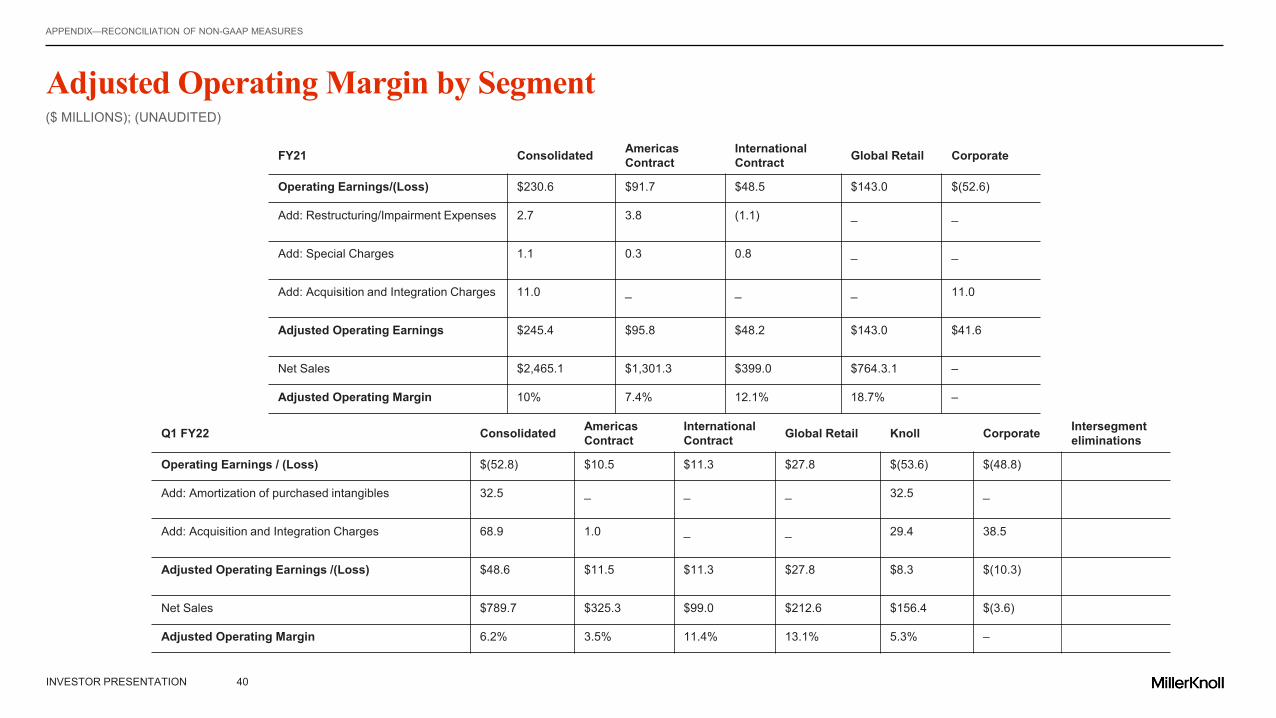
Adjusted Operating Margin by Segment
APPENDIX—RECONCILIATION OF NON-GAAP MEASURES
($ MILLIONS); (UNAUDITED)
FY21 Consolidated Americas Contract
International Contract Global Retail Corporate
Operating Earnings/(Loss) $230.6 $91.7 $48.5 $143.0 $(52.6)
Add: Restructuring/Impairment Expenses 2.7 3.8 (1.1) _ _
Add: Special Charges 1.1 0.3 0.8 _ _
Add: Acquisition and Integration Charges 11.0 _ _ _ 11.0
Adjusted Operating Earnings $245.4 $95.8 $48.2 $143.0 $41.6
Net Sales $2,465.1 $1,301.3 $399.0 $764.3.1 –
Adjusted Operating Margin 10% 7.4% 12.1% 18.7% –
Q1 FY22 Consolidated Americas Contract
International Contract Global Retail Knoll Corporate Intersegment
eliminations
Operating Earnings / (Loss) $(52.8) $10.5 $11.3 $27.8 $(53.6) $(48.8)
Add: Amortization of purchased intangibles 32.5 _ _ _ 32.5 _
Add: Acquisition and Integration Charges 68.9 1.0 _ _ 29.4 38.5
Adjusted Operating Earnings /(Loss) $48.6 $11.5 $11.3 $27.8 $8.3 $(10.3)
Net Sales $789.7 $325.3 $99.0 $212.6 $156.4 $(3.6)
Adjusted Operating Margin 6.2% 3.5% 11.4% 13.1% 5.3% –

INVESTOR PRESENTATION 41
($ MILLIONS, EXCEPT FOR PER SHARE AMOUNTS); (UNAUDITED)
Adjusted Earnings per Share
APPENDIX—RECONCILIATION OF NON-GAAP MEASURES
FY19 FY20 FY21
Earnings/(Loss) Per Share—Diluted $2.70 $(0.15) $2.92
Add: Acquisition-related Adjustments – $(0.63) $0.15
Add: Special Charges $0.18 $0.15 $0.02
Add: Restructuring/Impairment Expenses $0.13 $3.24 $0.02
Add: HAY Inventory Step-up $0.01 – –
Less: Tax Impact $(0.02) – –
Less: Non-recurring Gain – – $(0.06)
Less: Investment Fair Value Adjustment $(0.03) – –
Adjusted Earnings Per Share—Diluted $2.97 $2.61 $3.05

INVESTOR PRESENTATION 42
($ MILLIONS, EXCEPT FOR PER SHARE AMOUNTS); (UNAUDITED)
Adjusted Earnings per Share
APPENDIX—RECONCILIATION OF NON-GAAP MEASURES
Q1 FY22 Q1 FY21
Earnings Per Share—Diluted ($0.93) $1.24
Add: Special charges, after tax - $0.01
Add: Impairment charges, after tax - -
Add: Amortization of purchased intangibles, after tax $0.37 -
Add: Acquisition and integration charges, after tax $0.90 -
Add: Debt extinguishment, after tax $0.15 -
Add: Restructuring expenses, after tax - ($0.01)
Adjusted Earnings Per Share—Diluted $0.49 $1.24
Weighted Average Shares Outstanding (to Calculate Adjusted Earnings per Share) – Diluted 66,302,214 58,964,268
Note: The adjustments above are net of tax. For the three months ended August 28, 2021, the tax impact of the adjustments was $0.30. For the three months ended August 29, 2020, the tax impact of the adjustments was immaterial.

INVESTOR PRESENTATION 43
Q1 FY22 Q4 FY21 Q3 FY21 Q2 FY21 Q1 FY21
Net Sales $790 $621.5 $590.5 $626.3 $626.8
Gross Profit (GAAP) 277.5 224.0 230.9 244.2 250.0
Gross Margin (% of sales) 35.1% 36.0% 39.1% 39.0% 39.9%
Amortization of Purchased Intangibles 6.3 - - - -
Special Charges - 10.4 - - 1.0
Adj. Gross Profit (non-GAAP) $283.8 $234.4 $230.9 $244.2 $251.0
Adj. Gross Margin (% of sales) 35.9% 37.7% 39.1% 39.0% 40.0%
($ MILLIONS); (UNAUDITED)
Adjusted Gross Margin
APPENDIX—RECONCILIATION OF NON-GAAP MEASURES
Adjusted Gross Margin

INVESTOR PRESENTATION 44
Adjusted Operating Earnings
APPENDIX—RECONCILIATION OF NON-GAAP MEASURES
Adjusted Operating Earnings Q1 FY22 Q4 FY21 Q3 FY21 Q2 FY21 Q1 FY21
Net Sales $790 $621.5 $590.5 $626.3 $626.8
Operating Earnings/(Loss) (GAAP) (52.8) 9.2 55.1 71.0 95.4
Operating Margin (% of sales) (6.7%) 1.5% 9.3% 11.3% 15.2%
Add: Special Charges - 22.1* 0 (.2) 1.4
Add: Restructuring and Impairment Expenses - 1.2 .3 2.4 (1.2)
Add: Acquisition and Integration Charges 95.1 11.0 - - -
Adj. Operating Earnings (non-GAAP) 48.6 $43.5 $55.4 $73.2 $95.6
Adj. Operating Margin (% of sales) 6.1% 7.0% 9.4% 11.7% 15.3%
* Special Charges are an adjusting item for Q4 FY21, but not for full year FY21.
($ MILLIONS); (UNAUDITED)

INVESTOR PRESENTATION 45
($ MILLIONS); (UNAUDITED)
Adjusted EBITDA and Adjusted EBITDA Ratios
APPENDIX—RECONCILIATION OF NON-GAAP MEASURES
(1) “Other Adjustments” include, as applicable in the period, charges associated with business restructuring actions, impairment expenses, non-cash stock-based compensation, and other items as described in lending agreements.
Q1 FY22
Earnings Before Income Taxes (EBT) (70.7)
Add: Depreciation 23.5
Add: Amortization 10.0
Add: Interest 5.6
Add: Other Adjustments (1)1 114.8
Adjusted EBITDA—Bank 83.2
Total Cash $235
Total Debt, End of Trailing Period (includes outstanding LC’s) $1,400
Rolling 4-Quarter Net-Debt-to-Adj. EBITDA 2.3x


