39
INVESTOR PRESENTATION Q1 - FY17 July, 2016

INVESTOR PRESENTATION Q1 - FY17 July, 2016
1
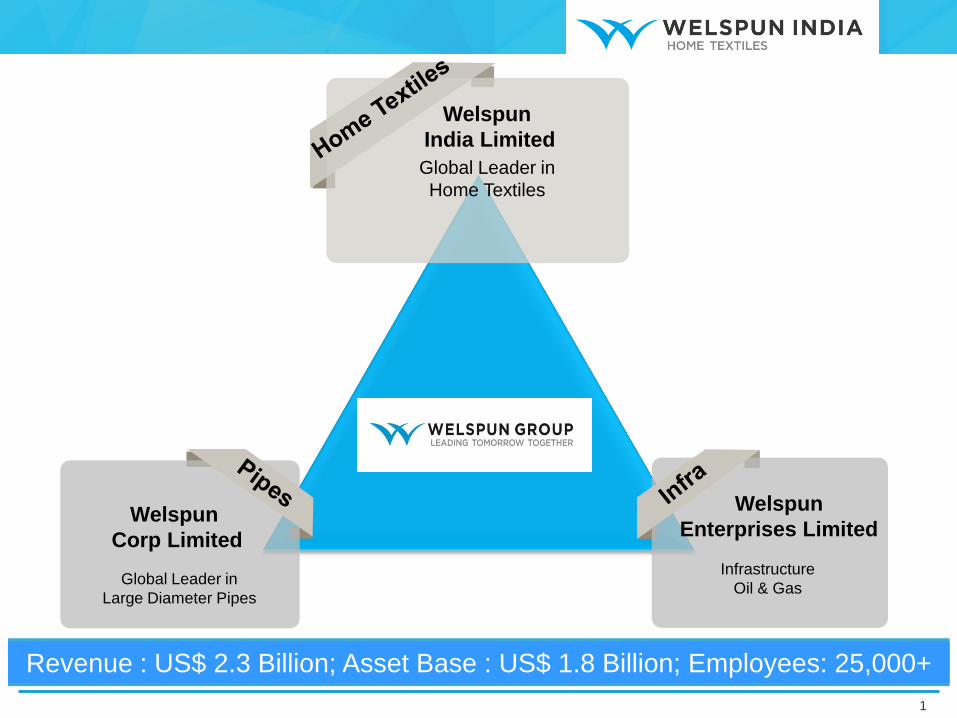
Welspun
Corp Limited
Global Leader in
Large Diameter Pipes
Revenue : US$ 2.3 Billion; Asset Base : US$ 1.8 Billion; Employees: 25,000+
Global Leader in
Home Textiles
Welspun
India Limited
Infrastructure
Oil & Gas
Welspun
Enterprises Limited
AGENDA
1. Company Overview
2. Industry Overview: Advantage India
3. Welspun India: Global Leader in Home Textiles
4. Q1 - FY17 Highlights
• Ind-AS Impact
5. Way forward
2
3
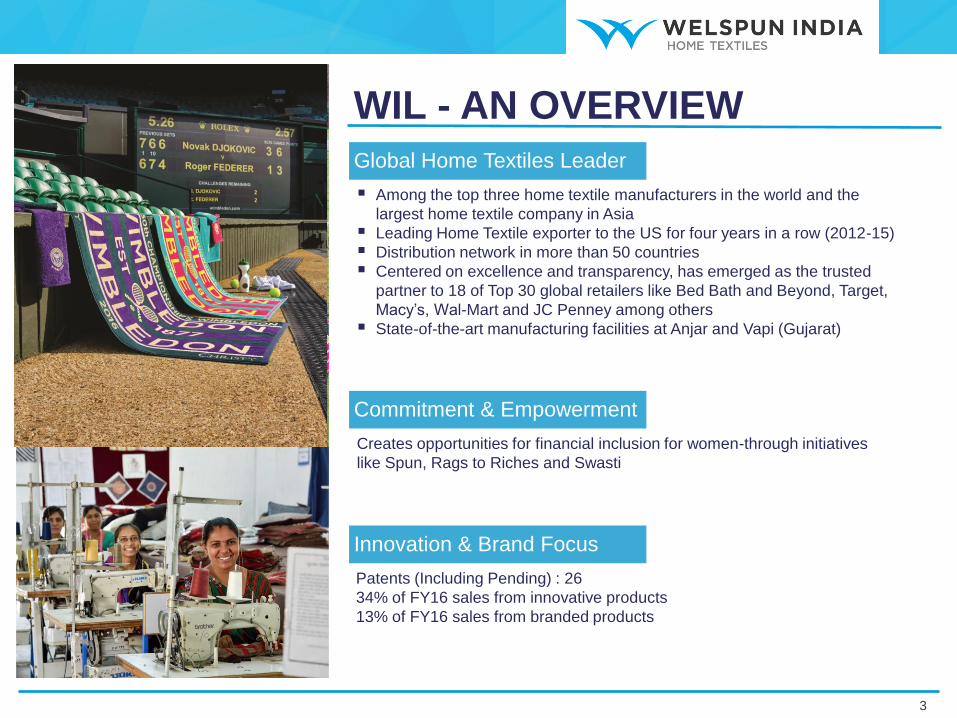
Among the top three home textile manufacturers in the world and the
largest home textile company in Asia
Leading Home Textile exporter to the US for four years in a row (2012-15)
Distribution network in more than 50 countries
Centered on excellence and transparency, has emerged as the trusted
partner to 18 of Top 30 global retailers like Bed Bath and Beyond, Target,
Macy’s, Wal-Mart and JC Penney among others
State-of-the-art manufacturing facilities at Anjar and Vapi (Gujarat)
Global Home Textiles Leader
WIL - AN OVERVIEW
Creates opportunities for financial inclusion for women-through initiatives
like Spun, Rags to Riches and Swasti
Commitment & Empowerment
Patents (Including Pending) : 26
34% of FY16 sales from innovative products
13% of FY16 sales from branded products
Innovation & Brand Focus
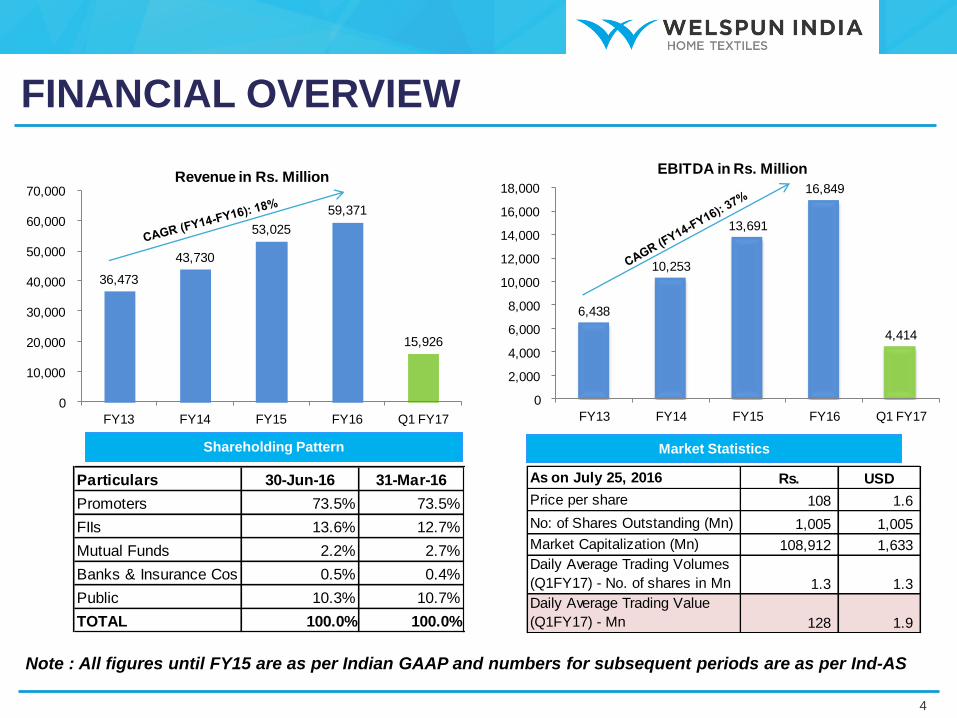
36,473
43,730
53,025
59,371
15,926
0
10,000
20,000
30,000
40,000
50,000
60,000
70,000
FY13 FY14 FY15 FY16 Q1 FY17
Revenue in Rs. Million
6,438
10,253
13,691
16,849
4,414
0
2,000
4,000
6,000
8,000
10,000
12,000
14,000
16,000
18,000
FY13 FY14 FY15 FY16 Q1 FY17
EBITDA in Rs. Million
FINANCIAL OVERVIEW
4
Shareholding Pattern Market Statistics
Particulars 30-Jun-16 31-Mar-16
Promoters 73.5% 73.5%
FIIs 13.6% 12.7%
Mutual Funds 2.2% 2.7%
Banks & Insurance Cos 0.5% 0.4%
Public 10.3% 10.7%
TOTAL 100.0% 100.0%
As on July 25, 2016 Rs. USD
Price per share 108 1.6
No: of Shares Outstanding (Mn) 1,005 1,005
Market Capitalization (Mn) 108,912 1,633
Daily Average Trading Volumes
(Q1FY17) - No. of shares in Mn 1.3 1.3
Daily Average Trading Value
(Q1FY17) - Mn 128 1.9
Note : All figures until FY15 are as per Indian GAAP and numbers for subsequent periods are as per Ind-AS

7
12 16 17
26 28
32 36
44
53
60
FY06 FY07 FY08 FY09 FY10 FY11 FY12 FY13 FY14 FY15 FY16
WIL - REVENUE MILESTONES
5
WIL Revenue in Rs. Billion
Textiles business has been growing at a CAGR of 25% since the inception of the Anjar Facility
Sustained growth indicates the potential of Home Textiles globally
International operations majorly contribute to the revenue
• 1993:
Towels
facility at
Vapi
Pre-2005
Towels
&
Sheets
Facility
at Anjar
Entry into bath
rugs
Entry into Accent
Rugs/ Carpets
Christy
Acquisit
ion
INDUSTRY OVERVIEW: ADVANTAGE INDIA
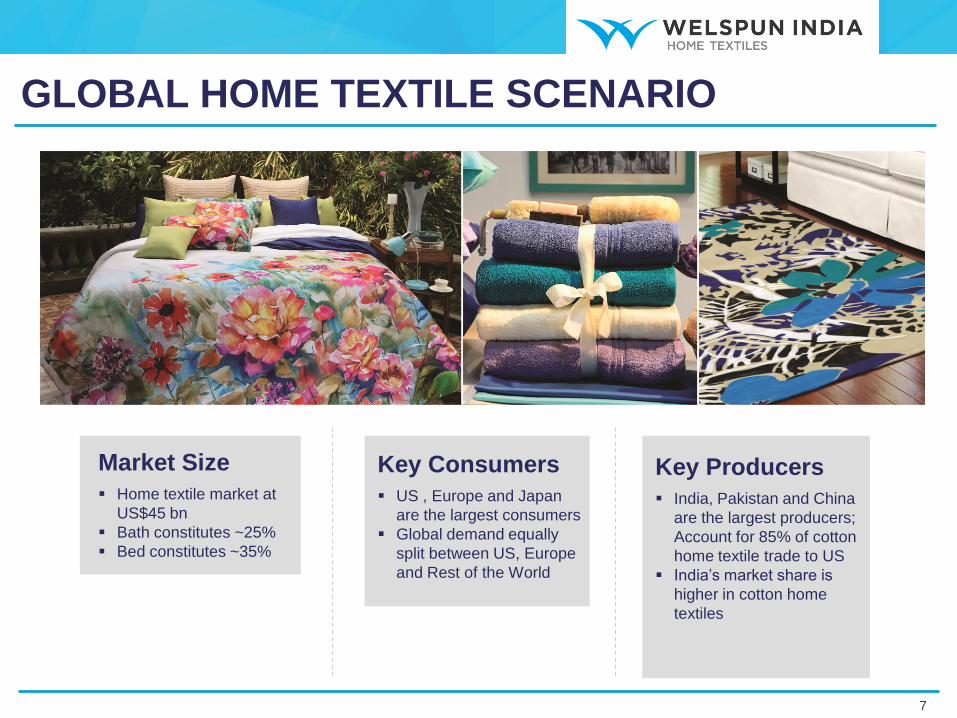
GLOBAL HOME TEXTILE SCENARIO
7
Market Size
Home textile market at
US$45 bn
Bath constitutes ~25%
Bed constitutes ~35%
Key Consumers
US , Europe and Japan
are the largest consumers
Global demand equally
split between US, Europe
and Rest of the World
Key Producers
India, Pakistan and China
are the largest producers;
Account for 85% of cotton
home textile trade to US
India’s market share is
higher in cotton home
textiles

Textiles and Clothing
US$797 bn
Textiles
US$314 bn
Home textiles
US$45 bn
US Cotton Home Textiles
US$7.5 bn
• China : 37%
• India : 5%
• China : 36%
• India : 6%
• China : 35%
• India : 11%
• China : 39%
• India : 31%
Source : WTO - 2014 data, Texprocil, OTEXA, Company estimates
STRUCTURAL CHANGE:
ASIAN DOMINANCE IN HOME TEXTILES
8
India has emerged as significant player in Home Textiles
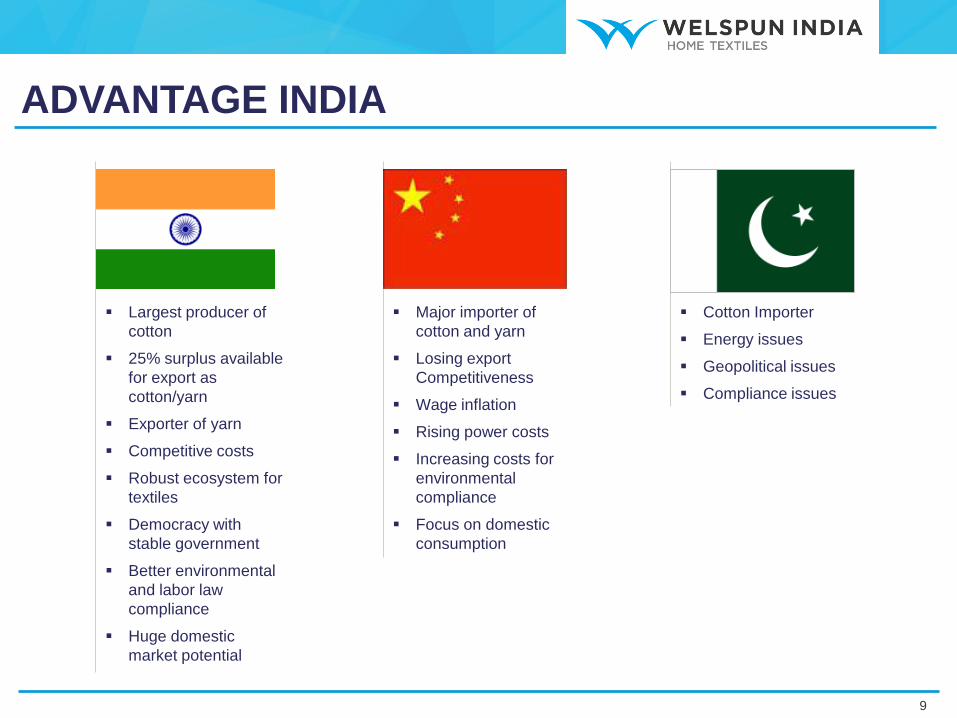
Largest producer of
cotton
25% surplus available
for export as
cotton/yarn
Exporter of yarn
Competitive costs
Robust ecosystem for
textiles
Democracy with
stable government
Better environmental
and labor law
compliance
Huge domestic
market potential
ADVANTAGE INDIA
9
Major importer of
cotton and yarn
Losing export
Competitiveness
Wage inflation
Rising power costs
Increasing costs for
environmental
compliance
Focus on domestic
consumption
Cotton Importer
Energy issues
Geopolitical issues
Compliance issues

INDIAN PLAYERS GAINING PROMINENCE GLOBALLY
India’s share
increased by 9
percentage
points in 6.5
years
India’s share
increased by 24
percentage
points in 6.5
years
US market share. Source: Otexa
10
30%
36%38% 39%
23%26% 25% 26%
22% 22% 22%20%
24%
15% 15% 15%
2009 2012 2015 YTD May 2016
Towels (Cotton)
27%
45%48%
51%
29%
22% 23% 23%26%
18% 16% 16%18%15% 13%
10%
2009 2012 2015 YTD May 2016
Sheets (Cotton)
India China Pakistan ROW
WELSPUN INDIA
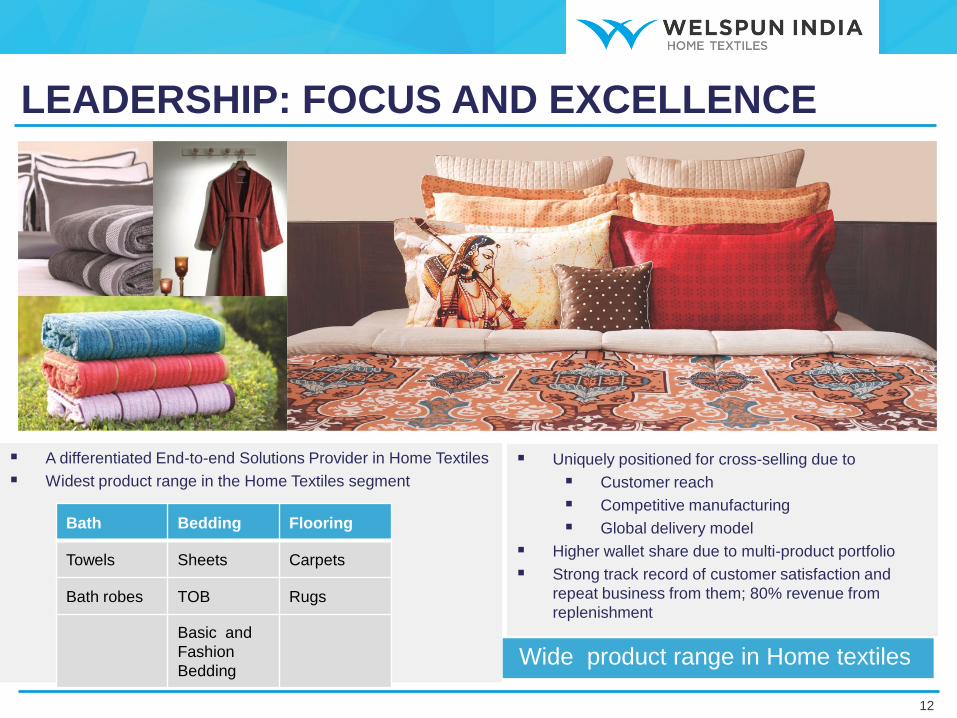
LEADERSHIP: FOCUS AND EXCELLENCE
A differentiated End-to-end Solutions Provider in Home Textiles
Widest product range in the Home Textiles segment
Bath Bedding Flooring
Towels Sheets Carpets
Bath robes TOB Rugs
Basic and
Fashion
Bedding
Uniquely positioned for cross-selling due to
Customer reach
Competitive manufacturing
Global delivery model
Higher wallet share due to multi-product portfolio
Strong track record of customer satisfaction and
repeat business from them; 80% revenue from
replenishment
Wide product range in Home textiles
12
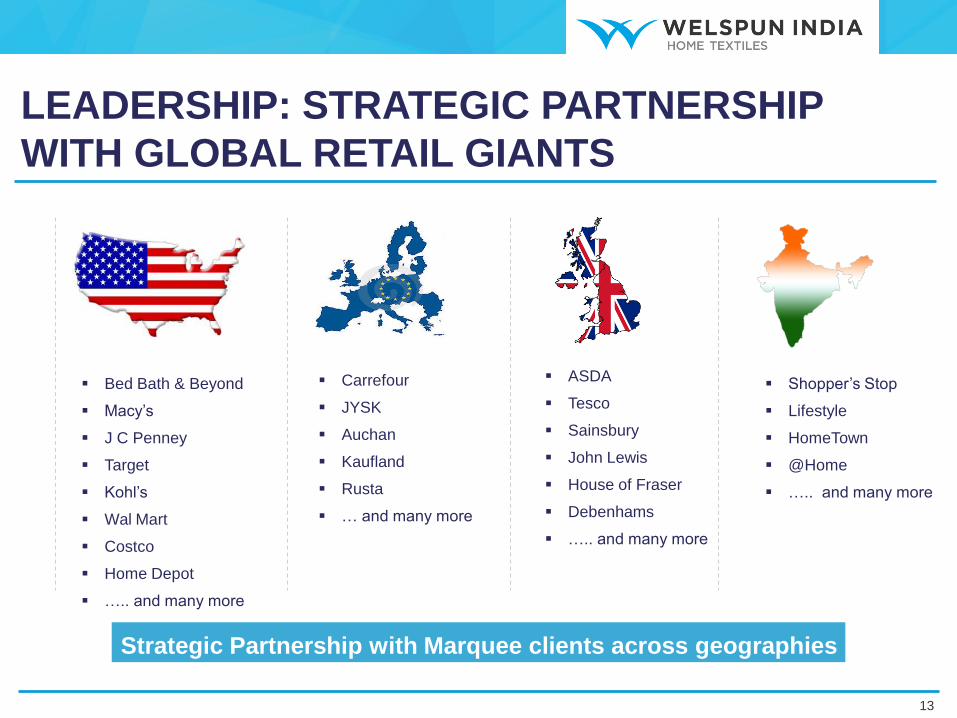
LEADERSHIP: STRATEGIC PARTNERSHIP
WITH GLOBAL RETAIL GIANTS
Bed Bath & Beyond
Macy’s
J C Penney
Target
Kohl’s
Wal Mart
Costco
Home Depot
….. and many more
Carrefour
JYSK
Auchan
Kaufland
Rusta
… and many more
ASDA
Tesco
Sainsbury
John Lewis
House of Fraser
Debenhams
….. and many more
Strategic Partnership with Marquee clients across geographies
13
Shopper’s Stop
Lifestyle
HomeTown
@Home
….. and many more

LEADERSHIP: GLOBAL REACH &
DELIVERY MODEL
14
Delivery & Reach in over 50 countries
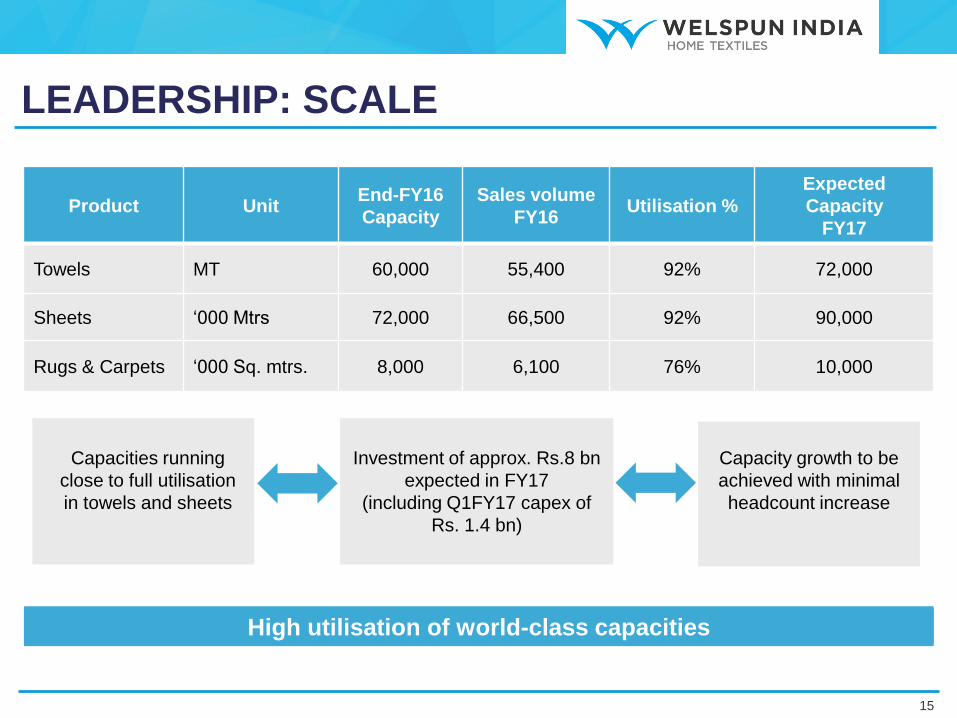
Product Unit End-FY16
Capacity
Sales volume
FY16 Utilisation %
Expected
Capacity
FY17
Towels MT 60,000 55,400 92% 72,000
Sheets ‘000 Mtrs 72,000 66,500 92% 90,000
Rugs & Carpets ‘000 Sq. mtrs. 8,000 6,100 76% 10,000
Capacities running
close to full utilisation
in towels and sheets
Investment of approx. Rs.8 bn
expected in FY17
(including Q1FY17 capex of
Rs. 1.4 bn)
Capacity growth to be
achieved with minimal
headcount increase
LEADERSHIP: SCALE
High utilisation of world-class capacities
15
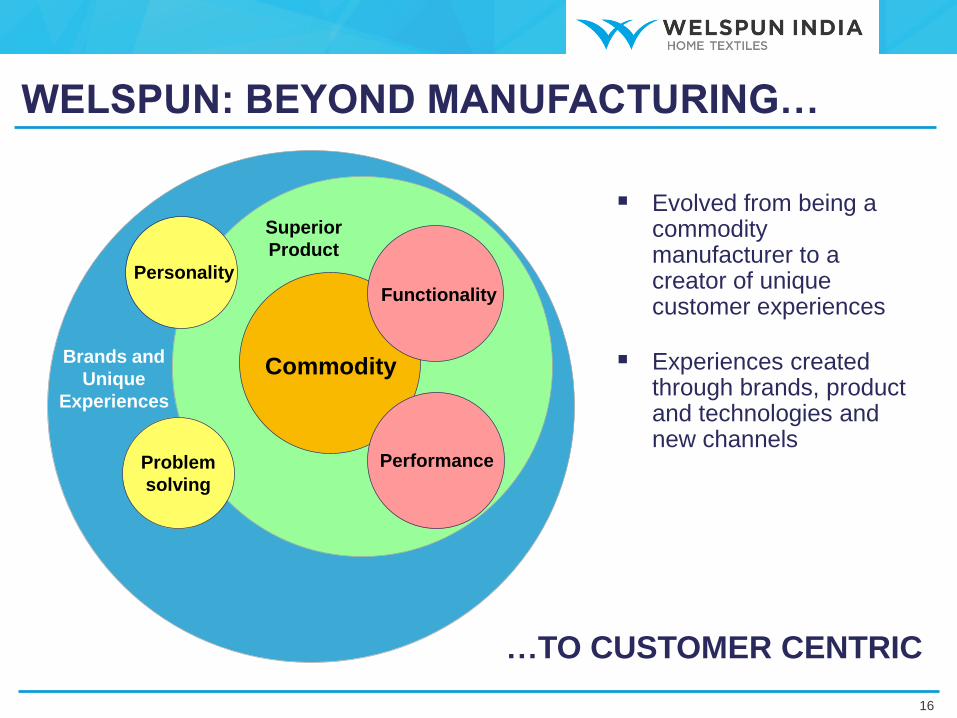
Evolved from being a commodity manufacturer to a creator of unique customer experiences
Experiences created through brands, product and technologies and new channels
…TO CUSTOMER CENTRIC
Commodity
Functionality
Performance
Superior
Product
Personality
Problem
solving
Brands and
Unique
Experiences
WELSPUN: BEYOND MANUFACTURING…
16
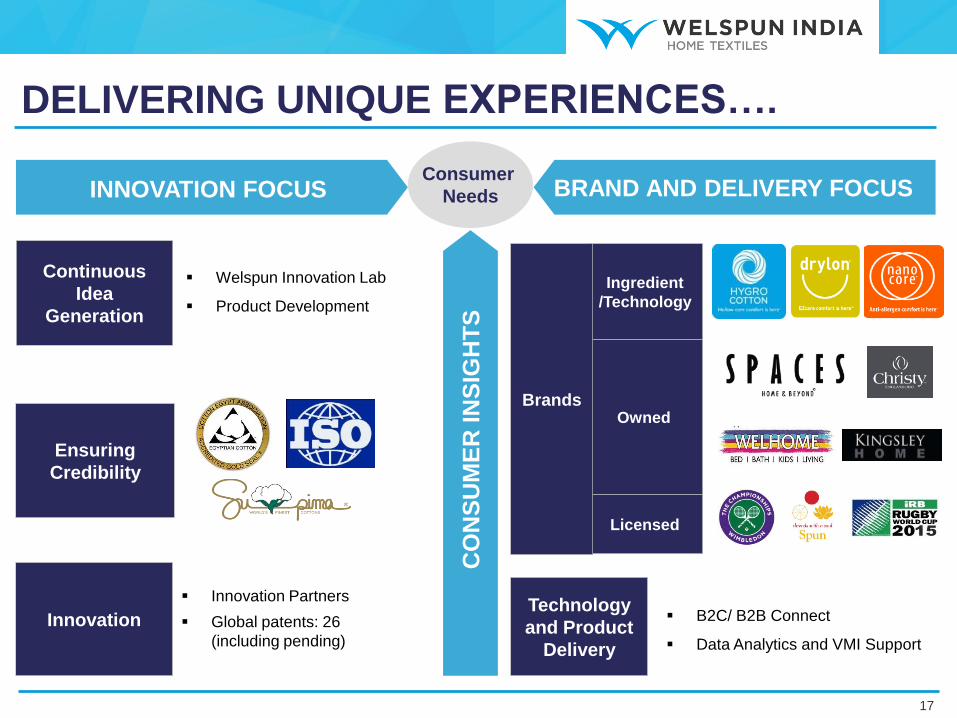
Consumer
Needs BRAND AND DELIVERY FOCUS
Ensuring
Credibility
Innovation
Innovation Partners
Global patents: 26
(including pending)
Continuous
Idea
Generation
Welspun Innovation Lab
Product Development
Owned
Technology
and Product
Delivery
Ingredient
/Technology
B2C/ B2B Connect
Data Analytics and VMI Support
Licensed
Brands
DELIVERING UNIQUE EXPERIENCES….
INNOVATION FOCUS
CO
NS
UM
ER
IN
SIG
HT
S
17
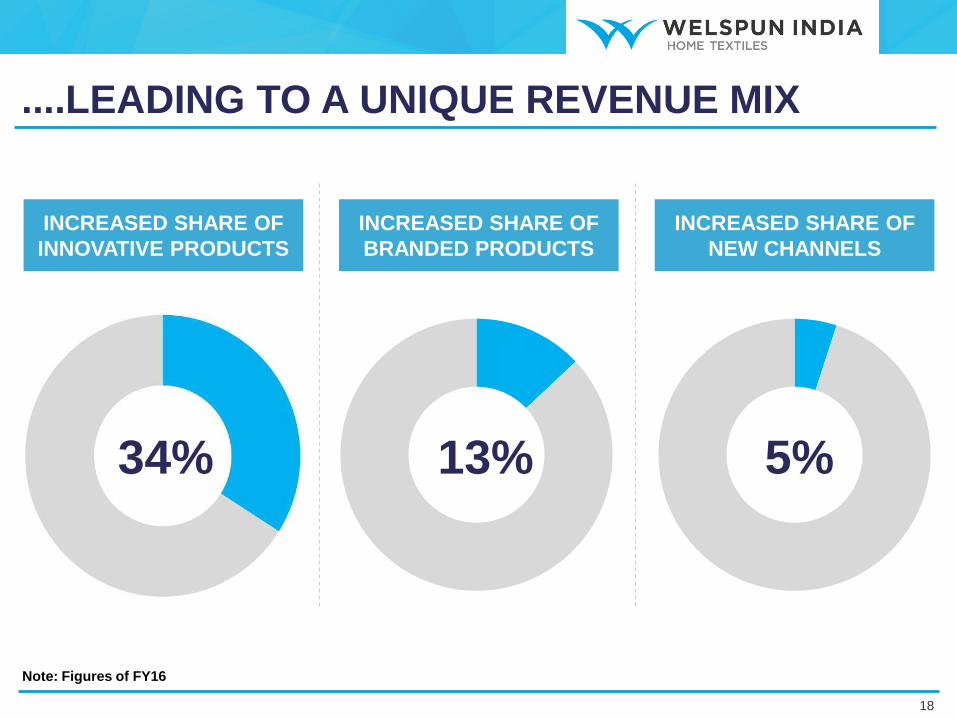
34% 13% 5%
....LEADING TO A UNIQUE REVENUE MIX
INCREASED SHARE OF
INNOVATIVE PRODUCTS
INCREASED SHARE OF
BRANDED PRODUCTS
INCREASED SHARE OF
NEW CHANNELS
18
Note: Figures of FY16
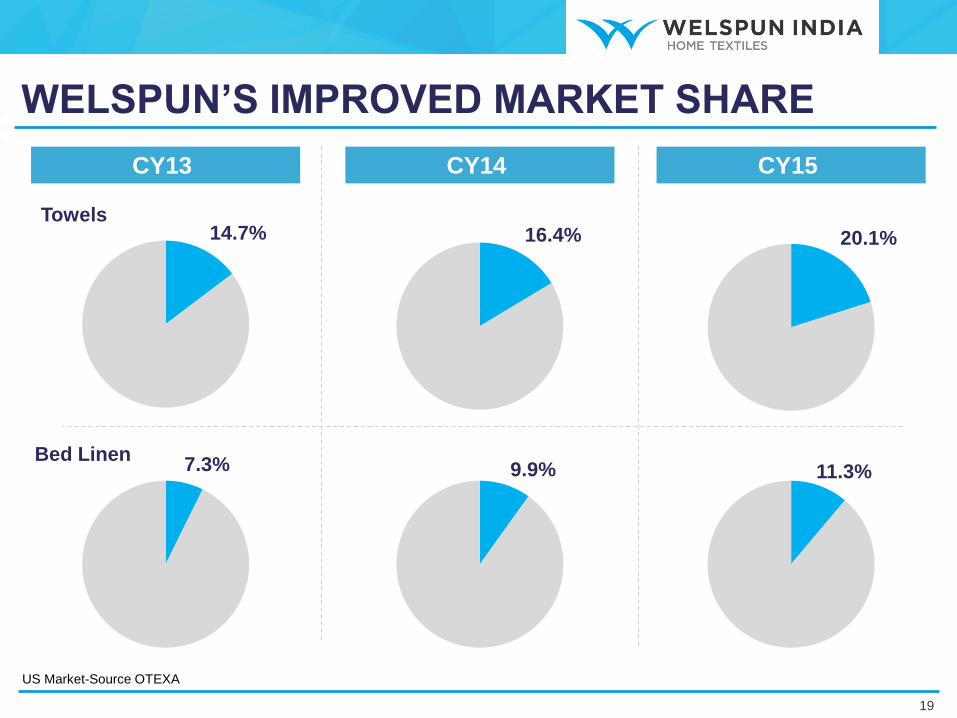
US Market-Source OTEXA
WELSPUN’S IMPROVED MARKET SHARE
14.7%
7.3%
16.4% 20.1%
9.9% 11.3%
CY13 CY14 CY15
19
Bed Linen
Towels
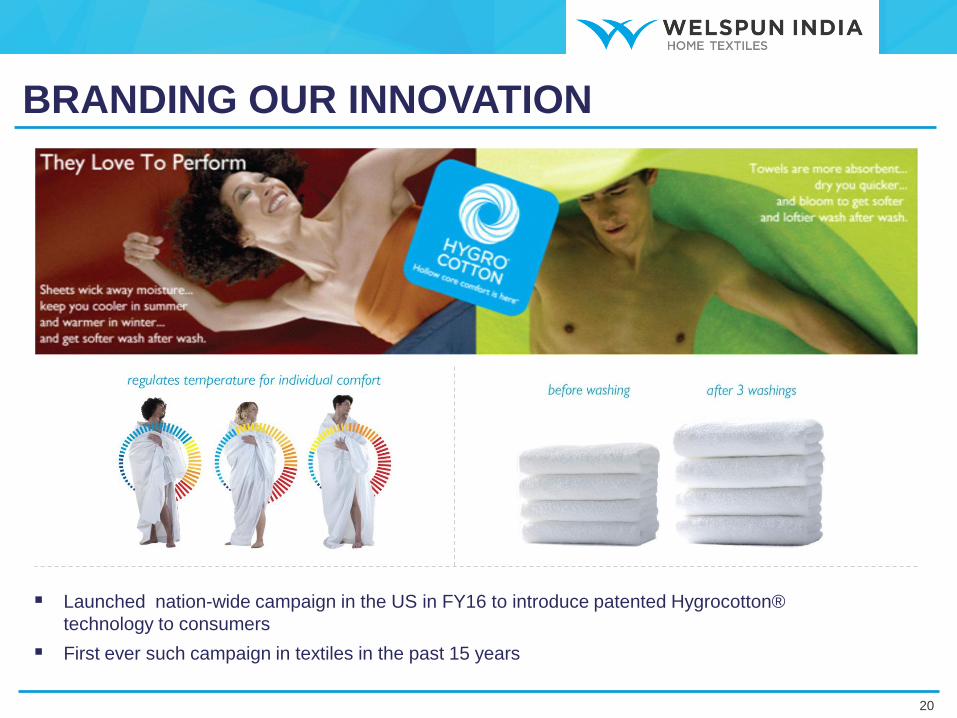
Launched nation-wide campaign in the US in FY16 to introduce patented Hygrocotton®
technology to consumers
First ever such campaign in textiles in the past 15 years
BRANDING OUR INNOVATION
20
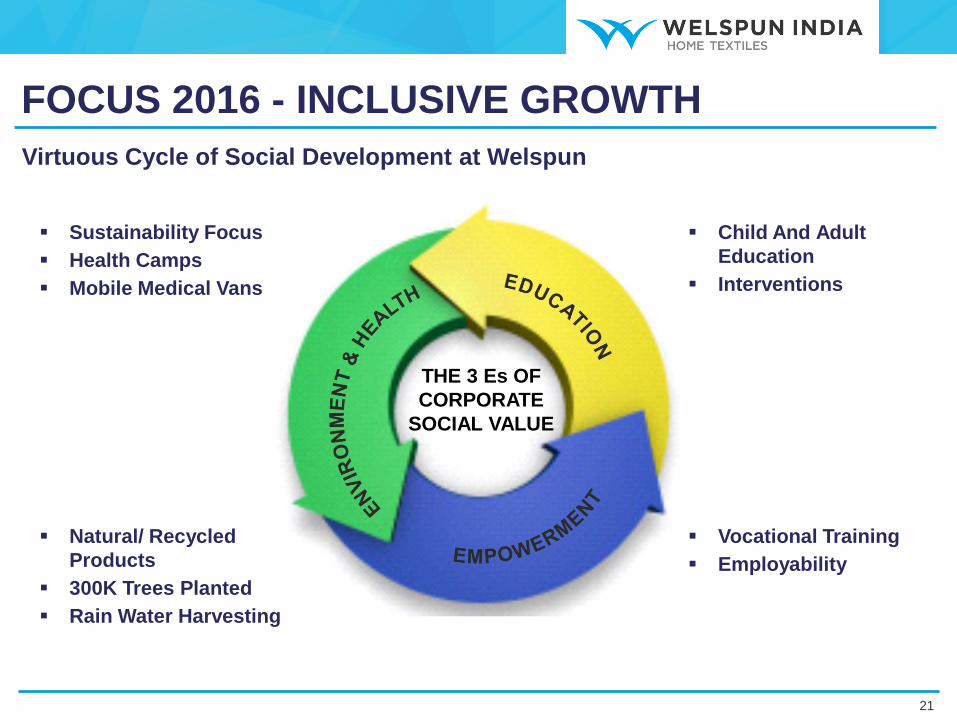
Virtuous Cycle of Social Development at Welspun
THE 3 Es OF
CORPORATE
SOCIAL VALUE
Child And Adult
Education
Interventions
Vocational Training
Employability
Natural/ Recycled
Products
300K Trees Planted
Rain Water Harvesting
Sustainability Focus
Health Camps
Mobile Medical Vans
FOCUS 2016 - INCLUSIVE GROWTH
21
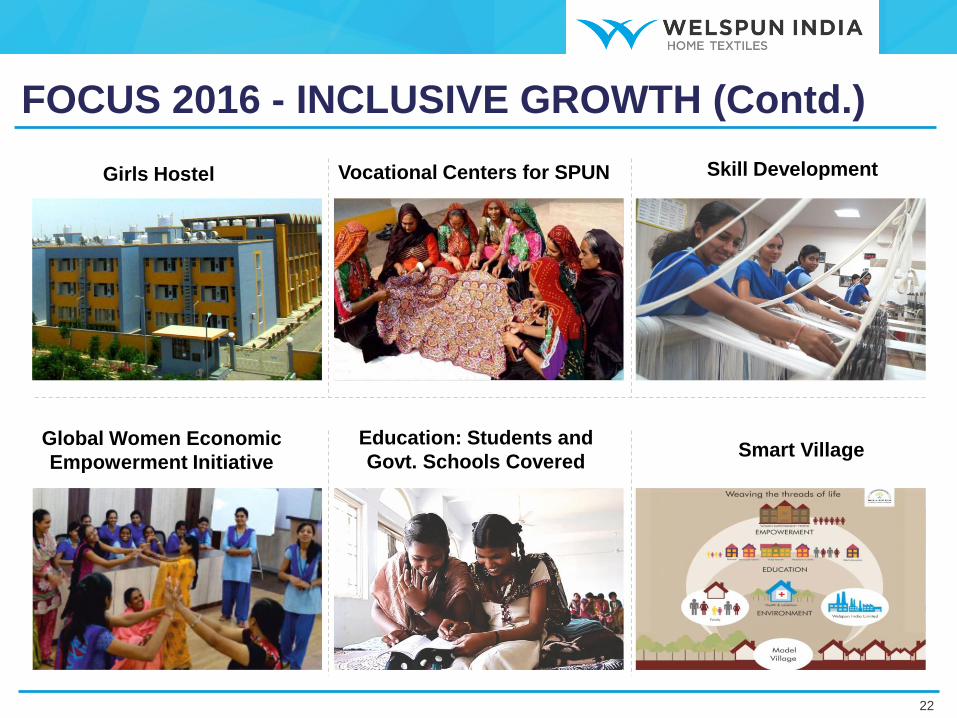
Girls Hostel Vocational Centers for SPUN Skill Development
Global Women Economic
Empowerment Initiative
Education: Students and
Govt. Schools Covered Smart Village
FOCUS 2016 - INCLUSIVE GROWTH (Contd.)
22
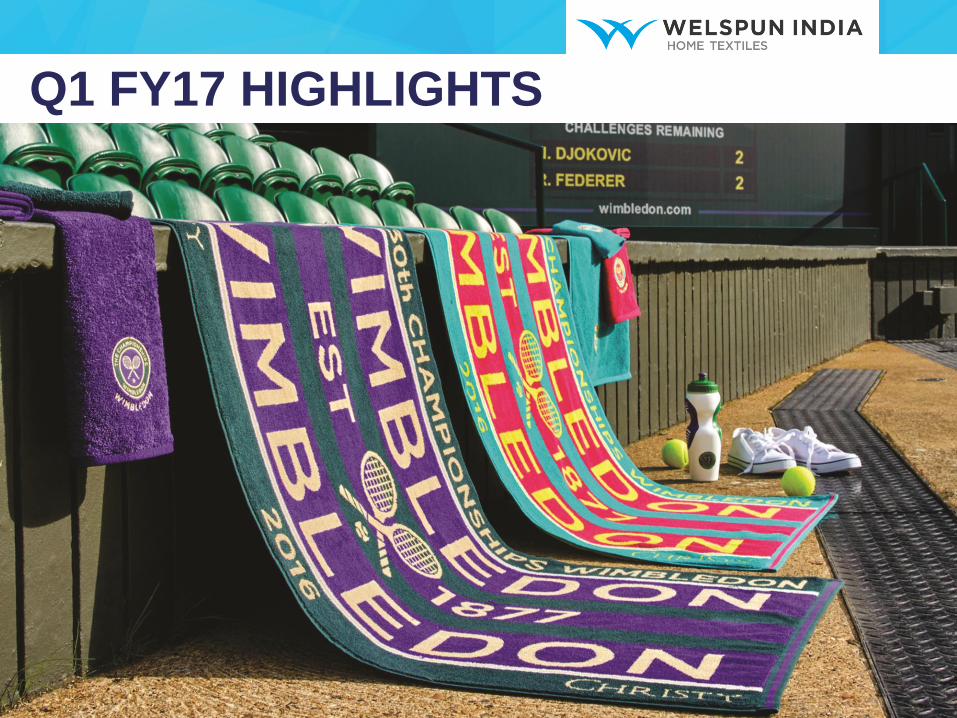
Q1 FY17 HIGHLIGHTS
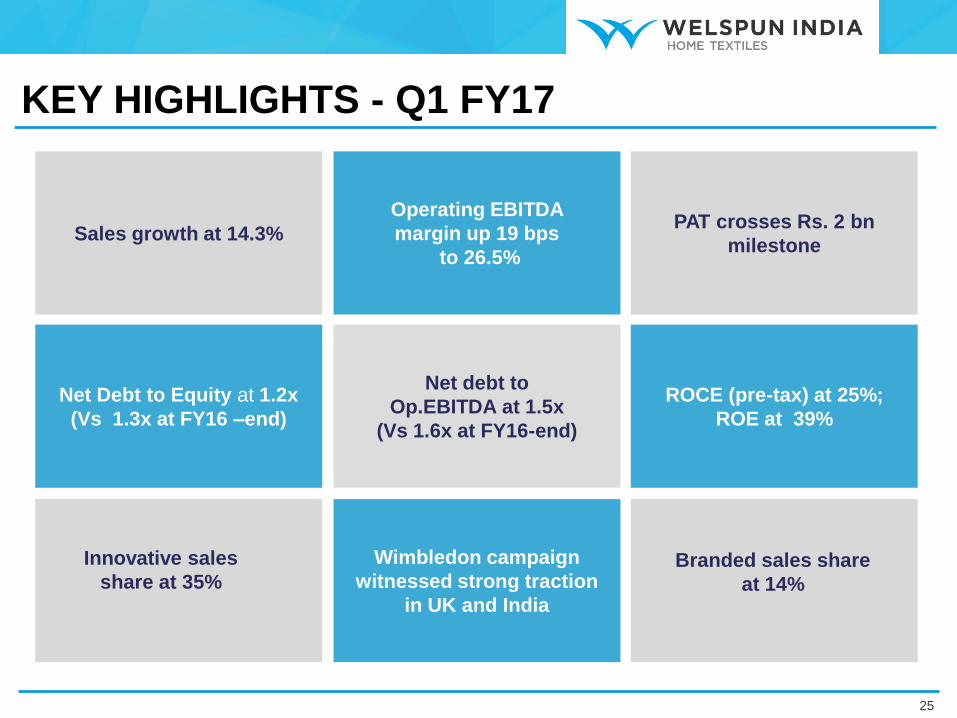
Wimbledon campaign
witnessed strong traction
in UK and India
Operating EBITDA
margin up 19 bps
to 26.5%
Net Debt to Equity at 1.2x
(Vs 1.3x at FY16 –end)
Sales growth at 14.3% PAT crosses Rs. 2 bn
milestone
ROCE (pre-tax) at 25%;
ROE at 39%
Net debt to
Op.EBITDA at 1.5x
(Vs 1.6x at FY16-end)
KEY HIGHLIGHTS - Q1 FY17
25
Innovative sales
share at 35% Branded sales share
at 14%
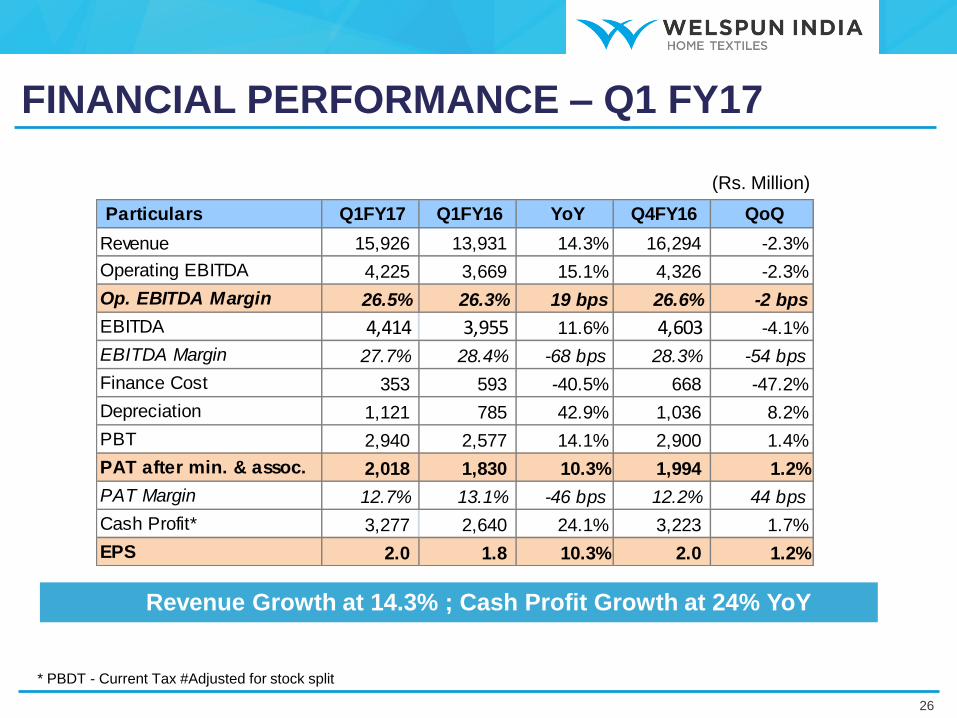
(Rs. Million)
* PBDT - Current Tax #Adjusted for stock split
Revenue Growth at 14.3% ; Cash Profit Growth at 24% YoY
FINANCIAL PERFORMANCE – Q1 FY17
26
Particulars Q1FY17 Q1FY16 YoY Q4FY16 QoQ
Revenue 15,926 13,931 14.3% 16,294 -2.3%
Operating EBITDA 4,225 3,669 15.1% 4,326 -2.3%
Op. EBITDA Margin 26.5% 26.3% 19 bps 26.6% -2 bps
EBITDA 4,414 3,955 11.6% 4,603 -4.1%
EBITDA Margin 27.7% 28.4% -68 bps 28.3% -54 bps
Finance Cost 353 593 -40.5% 668 -47.2%
Depreciation 1,121 785 42.9% 1,036 8.2%
PBT 2,940 2,577 14.1% 2,900 1.4%
PAT after min. & assoc. 2,018 1,830 10.3% 1,994 1.2%
PAT Margin 12.7% 13.1% -46 bps 12.2% 44 bps
Cash Profit* 3,277 2,640 24.1% 3,223 1.7%
EPS 2.0 1.8 10.3% 2.0 1.2%
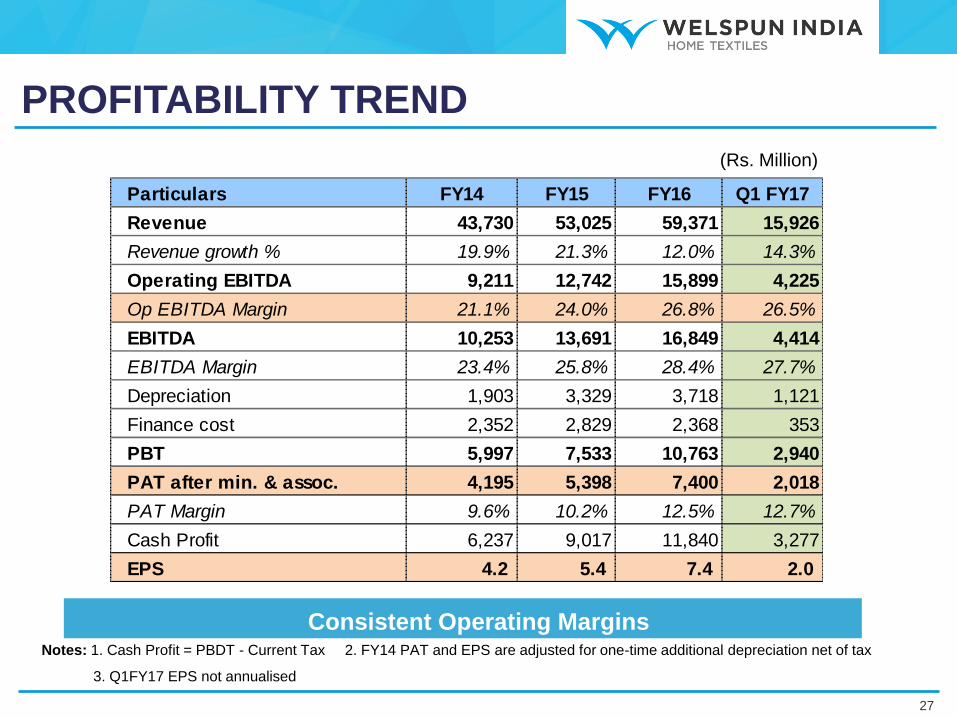
Notes: 1. Cash Profit = PBDT - Current Tax 2. FY14 PAT and EPS are adjusted for one-time additional depreciation net of tax
3. Q1FY17 EPS not annualised
Consistent Operating Margins
PROFITABILITY TREND
27
Particulars FY14 FY15 FY16 Q1 FY17
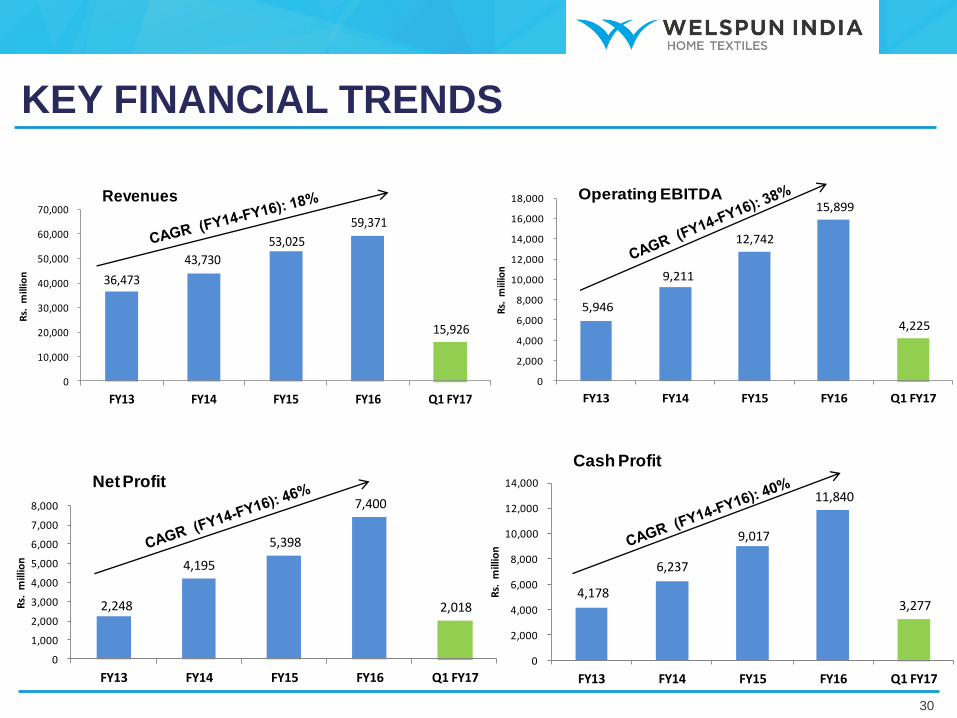
Revenue 43,730 53,025 59,371 15,926
Revenue growth % 19.9% 21.3% 12.0% 14.3%
Operating EBITDA 9,211 12,742 15,899 4,225
Op EBITDA Margin 21.1% 24.0% 26.8% 26.5%
EBITDA 10,253 13,691 16,849 4,414
EBITDA Margin 23.4% 25.8% 28.4% 27.7%
Depreciation 1,903 3,329 3,718 1,121
Finance cost 2,352 2,829 2,368 353
PBT 5,997 7,533 10,763 2,940
PAT after min. & assoc. 4,195 5,398 7,400 2,018
PAT Margin 9.6% 10.2% 12.5% 12.7%
Cash Profit 6,237 9,017 11,840 3,277
EPS 4.2 5.4 7.4 2.0
(Rs. Million)
(Rs. Million)
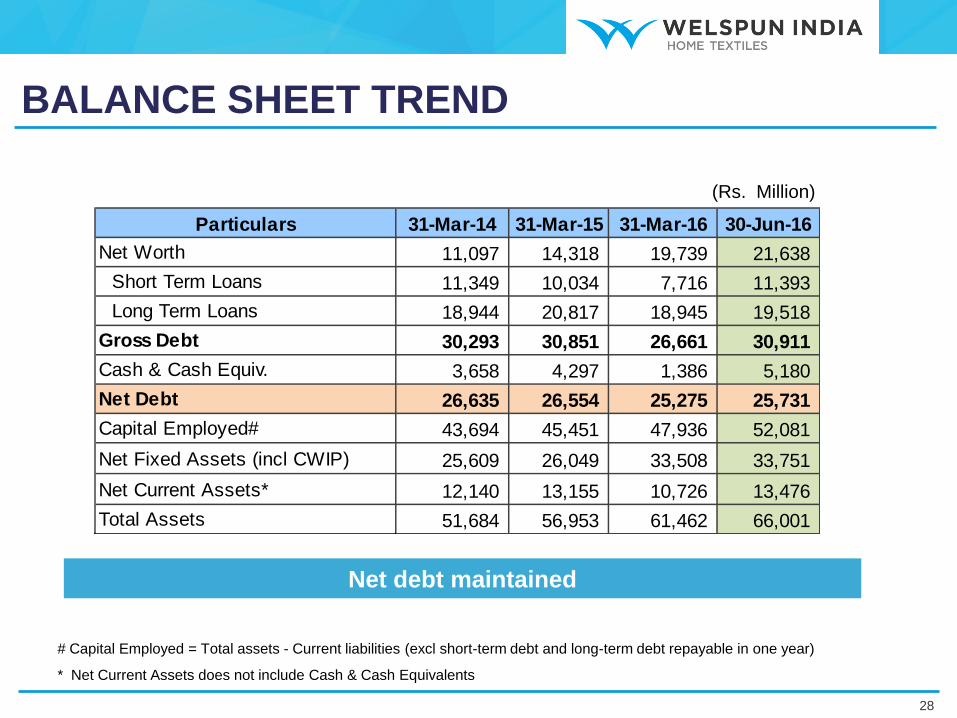
# Capital Employed = Total assets - Current liabilities (excl short-term debt and long-term debt repayable in one year)
* Net Current Assets does not include Cash & Cash Equivalents
Net debt maintained
BALANCE SHEET TREND
28
Particulars 31-Mar-14 31-Mar-15 31-Mar-16 30-Jun-16
Net Worth 11,097 14,318 19,739 21,638
Short Term Loans 11,349 10,034 7,716 11,393
Long Term Loans 18,944 20,817 18,945 19,518
Gross Debt 30,293 30,851 26,661 30,911
Cash & Cash Equiv. 3,658 4,297 1,386 5,180
Net Debt 26,635 26,554 25,275 25,731
Capital Employed# 43,694 45,451 47,936 52,081
Net Fixed Assets (incl CWIP) 25,609 26,049 33,508 33,751
Net Current Assets* 12,140 13,155 10,726 13,476
Total Assets 51,684 56,953 61,462 66,001
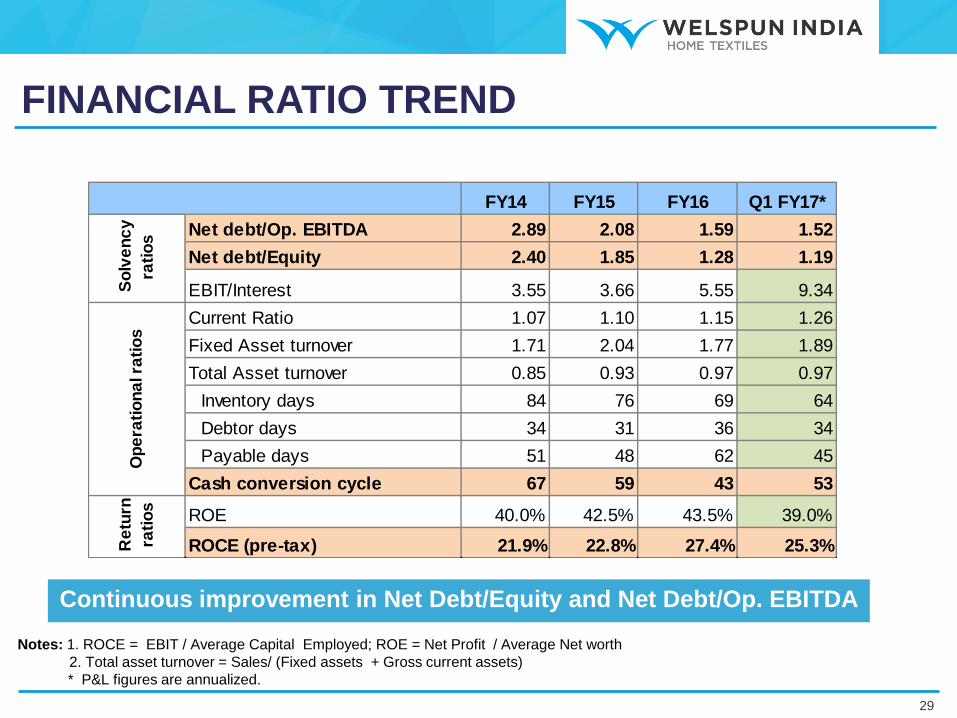
Notes: 1. ROCE = EBIT / Average Capital Employed; ROE = Net Profit / Average Net worth
2. Total asset turnover = Sales/ (Fixed assets + Gross current assets)
* P&L figures are annualized.
Continuous improvement in Net Debt/Equity and Net Debt/Op. EBITDA
FINANCIAL RATIO TREND
29
FY14 FY15 FY16 Q1 FY17*
Net debt/Op. EBITDA 2.89 2.08 1.59 1.52
Net debt/Equity 2.40 1.85 1.28 1.19
EBIT/Interest 3.55 3.66 5.55 9.34
Current Ratio 1.07 1.10 1.15 1.26
Fixed Asset turnover 1.71 2.04 1.77 1.89
Total Asset turnover 0.85 0.93 0.97 0.97
Inventory days 84 76 69 64
Debtor days 34 31 36 34
Payable days 51 48 62 45
Cash conversion cycle 67 59 43 53
ROE 40.0% 42.5% 43.5% 39.0%
ROCE (pre-tax) 21.9% 22.8% 27.4% 25.3%Re
turn
rati
os
So
lve
nc
y
rati
os
Op
era
tio
na
l ra
tio
s
4,178
6,237
9,017
11,840
3,277
0
2,000
4,000
6,000
8,000
10,000
12,000
14,000
FY13 FY14 FY15 FY16 Q1 FY17
Rs.
mill
ion
Cash Profit
5,946
9,211
12,742
15,899
4,225
0
2,000
4,000
6,000
8,000
10,000
12,000
14,000
16,000
18,000
FY13 FY14 FY15 FY16 Q1 FY17
Rs.
miil
ion
Operating EBITDA
36,473
43,730
53,025
59,371
15,926
0
10,000
20,000
30,000
40,000
50,000
60,000
70,000
FY13 FY14 FY15 FY16 Q1 FY17
Rs.
mill
ion
Revenues
2,248
4,195
5,398
7,400
2,018
0
1,000
2,000
3,000
4,000
5,000
6,000
7,000
8,000
FY13 FY14 FY15 FY16 Q1 FY17
Rs.
mill
ion
Net Profit
KEY FINANCIAL TRENDS
30

KEY RATIO TRENDS
31
21.9%22.8%
27.4%
25.3%
1%
6%
11%
16%
21%
26%
31%
36%
FY14 FY15 FY16 Q1FY17*
ROCE % (Pre- Tax)
40.0%
42.5% 43.5%
39.0%
15%
20%
25%
30%
35%
40%
45%
50%
FY14 FY15 FY16 Q1FY17*
ROE %
2.4x
1.9x
1.3x 1.2x
1.0x
1.2x
1.4x
1.6x
1.8x
2.0x
2.2x
2.4x
2.6x
2.8x
FY14 FY15 FY16 Q1FY17
Net Debt / Equity
2.9x
2.1x
1.6x
1.5x
1.0x
1.5x
2.0x
2.5x
3.0x
3.5x
4.0x
FY14 FY15 FY16 Q1FY17*
Net Debt / Op. EBITDA
* Annualised
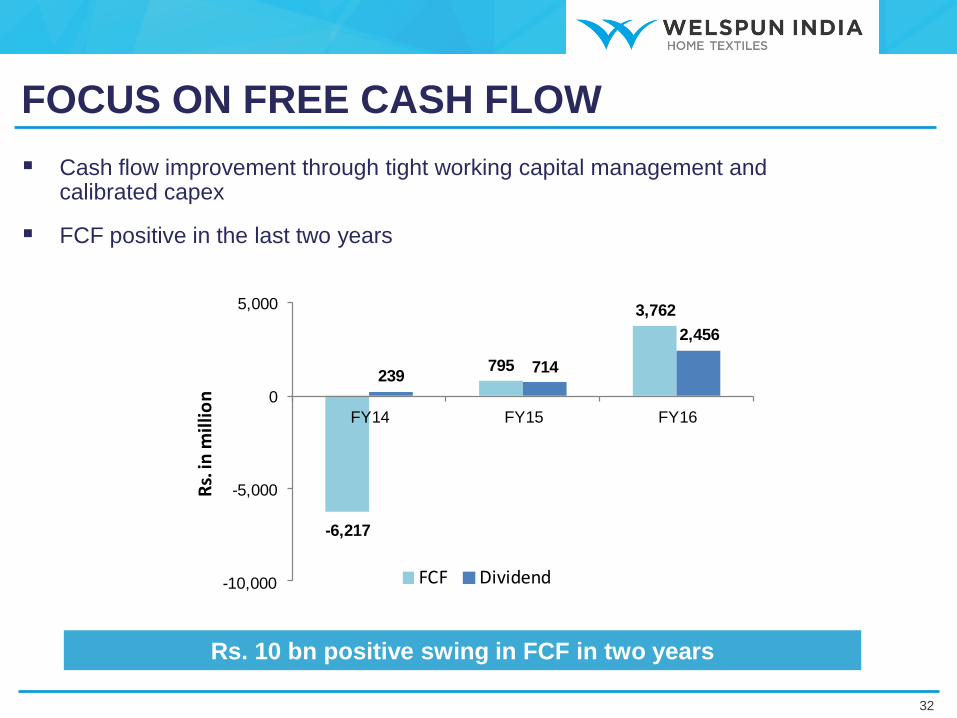
Cash flow improvement through tight working capital management and calibrated capex
FCF positive in the last two years
-6,217
795
3,762
239714
2,456
-10,000
-5,000
0
5,000
FY14 FY15 FY16
Rs.
in m
illi
on
FCF Dividend
FOCUS ON FREE CASH FLOW
Rs. 10 bn positive swing in FCF in two years
32
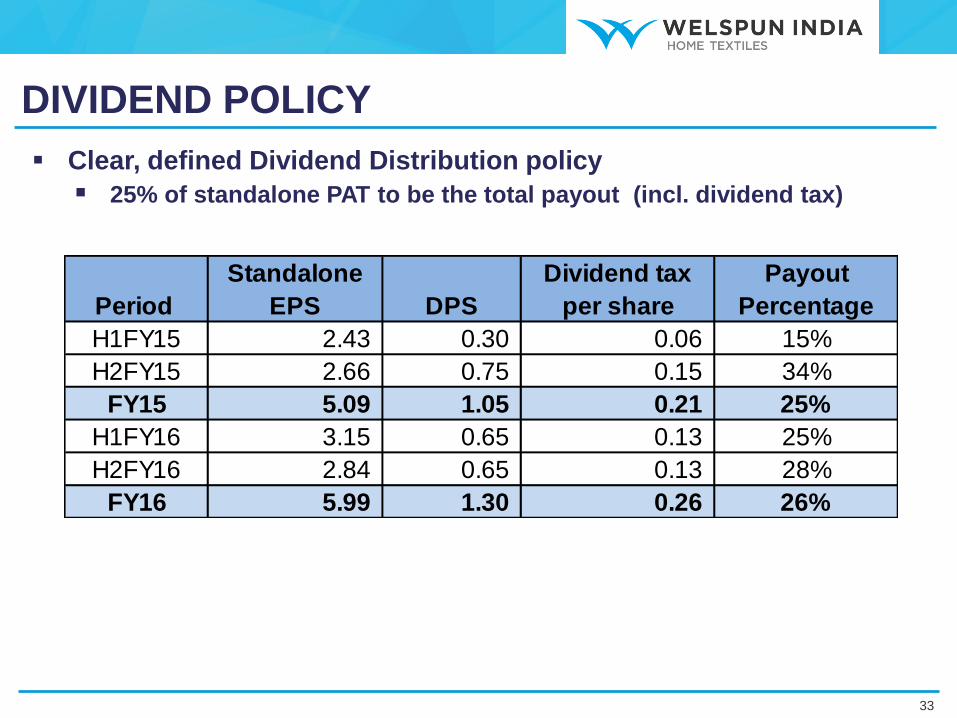
Clear, defined Dividend Distribution policy
25% of standalone PAT to be the total payout (incl. dividend tax)
DIVIDEND POLICY
33
Period
Standalone
EPS DPS
Dividend tax
per share
Payout
Percentage
H1FY15 2.43 0.30 0.06 15%
H2FY15 2.66 0.75 0.15 34%
FY15 5.09 1.05 0.21 25%
H1FY16 3.15 0.65 0.13 25%
H2FY16 2.84 0.65 0.13 28%
FY16 5.99 1.30 0.26 26%
(Rs. Million)
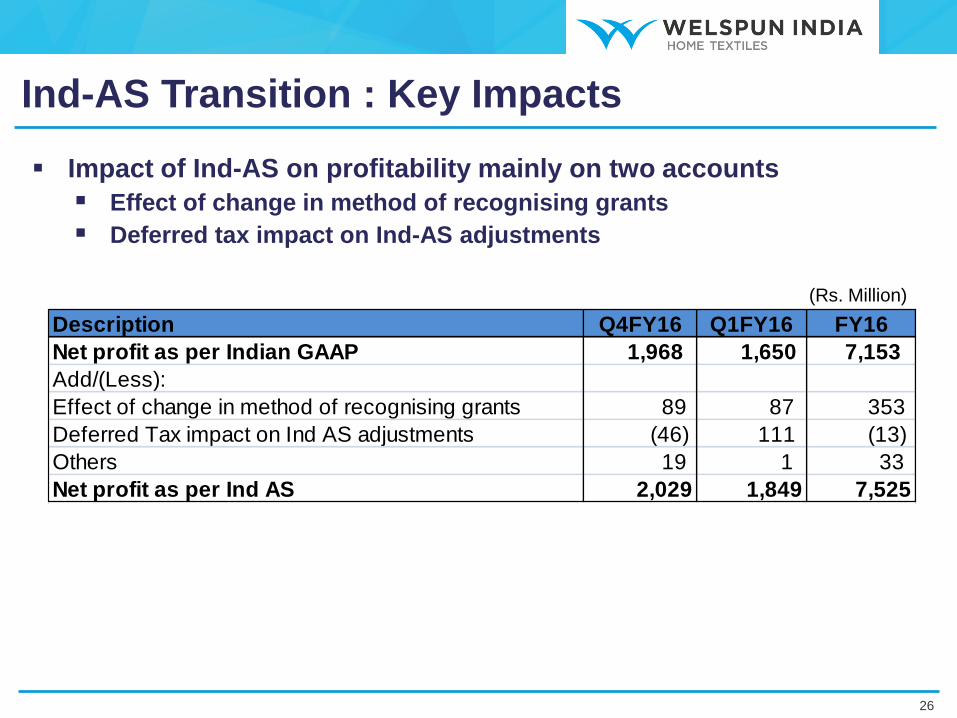
Ind-AS Transition : Key Impacts
26
Description Q4FY16 Q1FY16 FY16
Net profit as per Indian GAAP 1,968 1,650 7,153
Add/(Less):
Effect of change in method of recognising grants 89 87 353
Deferred Tax impact on Ind AS adjustments (46) 111 (13)
Others 19 1 33
Net profit as per Ind AS 2,029 1,849 7,525
Impact of Ind-AS on profitability mainly on two accounts
Effect of change in method of recognising grants
Deferred tax impact on Ind-AS adjustments

WAY FORWARD
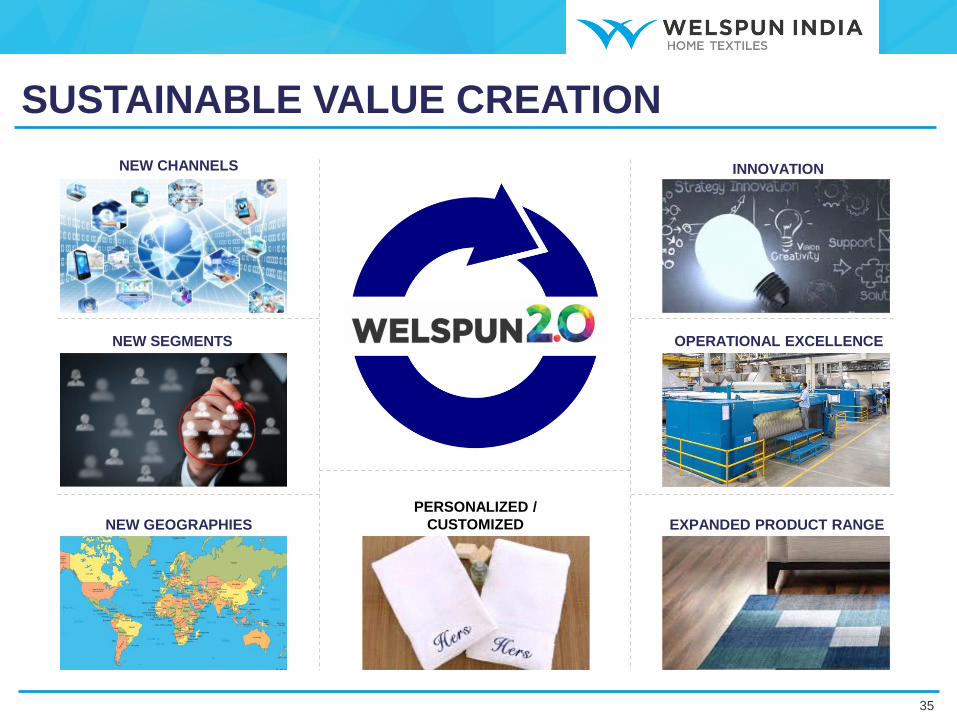
INNOVATION
OPERATIONAL EXCELLENCE
EXPANDED PRODUCT RANGE
PERSONALIZED /
CUSTOMIZED NEW GEOGRAPHIES
NEW SEGMENTS
NEW CHANNELS
SUSTAINABLE VALUE CREATION
35
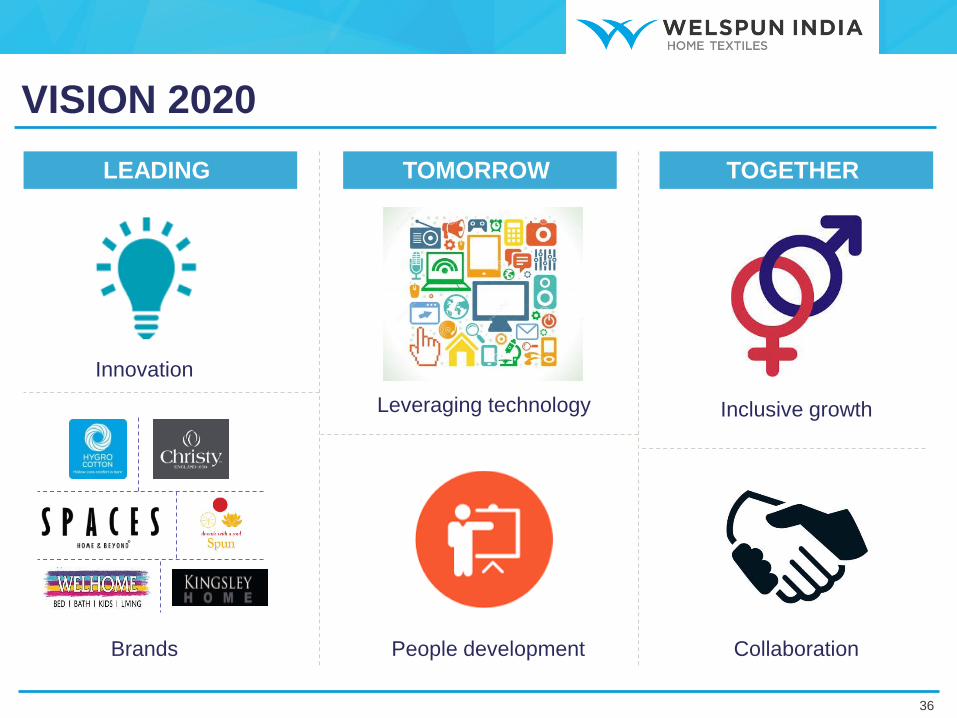
Brands
Leveraging technology Inclusive growth
Collaboration People development
VISION 2020
Innovation
LEADING TOMORROW TOGETHER
36

Revenue Net Debt
Innovative/Branded
Share of Revenue
Share of
Domestic Revenue Women
employees
$2 BN NIL
50% 20% 20%
VISION 2020
37
THANK YOU
For further details, please contact:
Altaf Jiwani
Director (Finance) & CFO - Welspun India Limited
Email: [email protected]
Harish Venkateswaran
Sr. General Manager - Group Finance and Strategy
Email: [email protected]


