38
Investor Presentation STS Group AG Personal & third party confidential www.sts.group Slide / 1 STS Group © 2019 Investor Presentation STS Group AG September 2019
Investor Presentation STS Group AG
Pers
onal
& th
ird p
arty
conf
iden
tial
www.sts.group Slide / 1STS Group © 2019
Investor PresentationSTS Group AGSeptember 2019
Investor Presentation STS Group AG
Pers
onal
& th
ird p
arty
conf
iden
tial
www.sts.group Slide / 2STS Group © 2019
We are the preferred global acoustics and plastics solutionprovider for transportation systemswhen it comes to design, comfortand efficiency!
Investor Presentation STS Group AG
Pers
onal
& th
ird p
arty
conf
iden
tial
www.sts.group Slide / 3STS Group © 2019
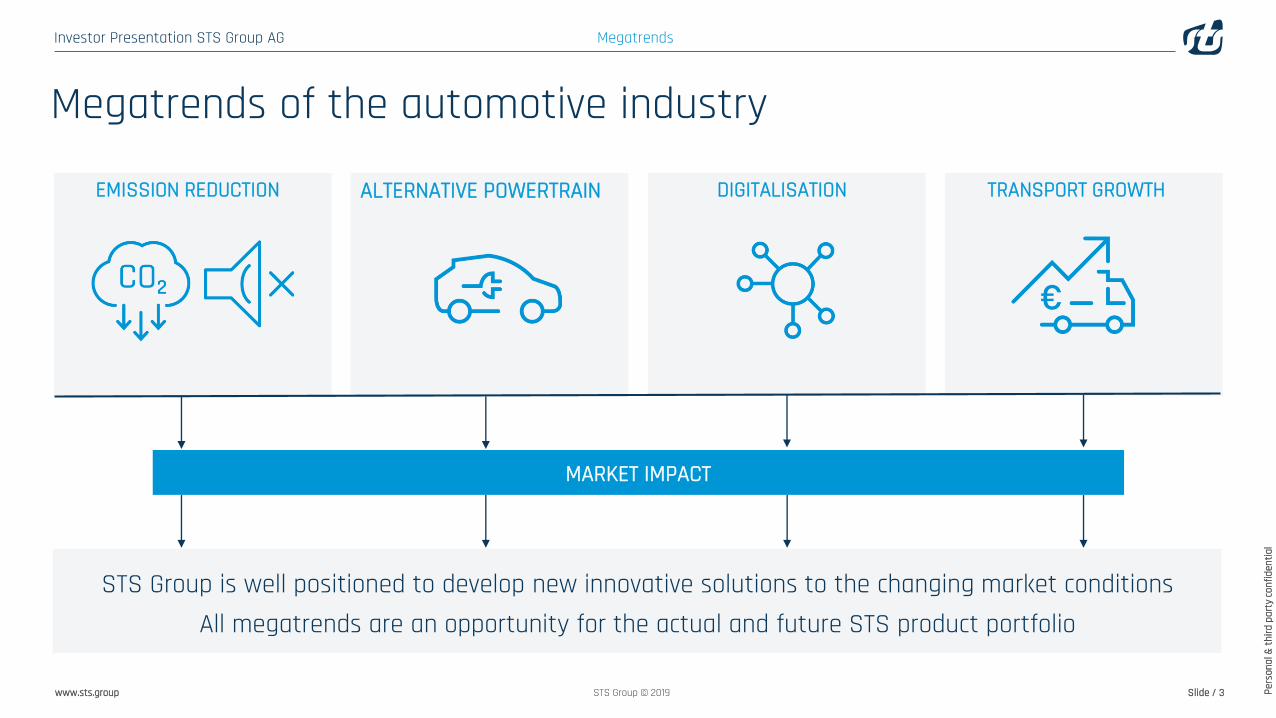
Megatrends of the automotive industry
EMISSION REDUCTION
Megatrends
ALTERNATIVE POWERTRAIN DIGITALISATION TRANSPORT GROWTH
MARKET IMPACT
STS Group is well positioned to develop new innovative solutions to the changing market conditionsAll megatrends are an opportunity for the actual and future STS product portfolio

Investor Presentation STS Group AG
Pers
onal
& th
ird p
arty
conf
iden
tial
www.sts.group Slide / 4STS Group © 2019
Megatrend – Emission Reduction
MEGATREND MARKET IMPACT − New regulations for emission
reduction in Europe (EURO6) and China (CHINA6)
− Noise reduction (passive acoustics of the vehicle)
WHAT CAN STS DO?− Reduce total weight of the vehicle
with lightweight solutions, by replacing metal with plastics
− Improve Aerodynamics of vehicles− Noise reduction through acoustic
insulation
PRODUCT SOLUTIONS (examples)− Entire exterior trim solutions for
commercial vehicles (e.g. modules for roof, spoiler, front and side panels)
− Complete engine cover and outer wheel arches
Megatrends
Investor Presentation STS Group AG
Pers
onal
& th
ird p
arty
conf
iden
tial
www.sts.group Slide / 5STS Group © 2019
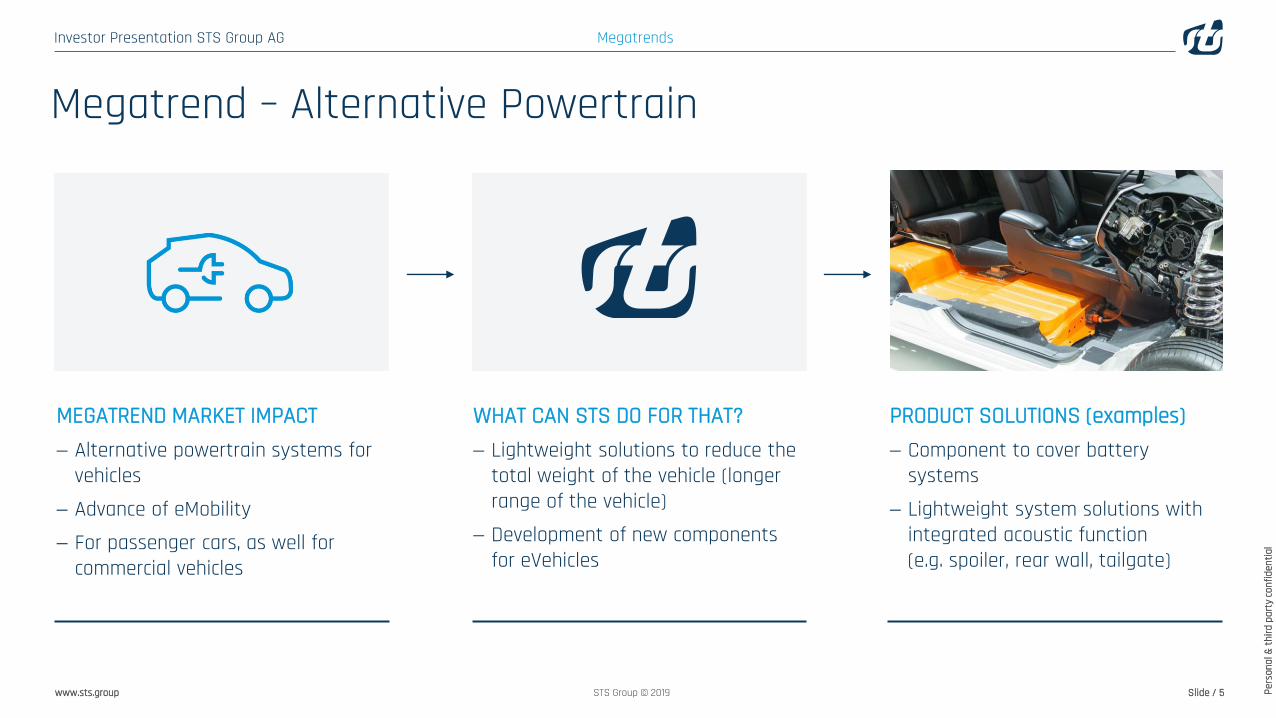
Megatrend – Alternative Powertrain
MEGATREND MARKET IMPACT − Alternative powertrain systems for
vehicles− Advance of eMobility− For passenger cars, as well for
commercial vehicles
WHAT CAN STS DO FOR THAT?− Lightweight solutions to reduce the
total weight of the vehicle (longer range of the vehicle)
− Development of new components for eVehicles
PRODUCT SOLUTIONS (examples)− Component to cover battery
systems− Lightweight system solutions with
integrated acoustic function (e.g. spoiler, rear wall, tailgate)
Megatrends
Investor Presentation STS Group AG
Pers
onal
& th
ird p
arty
conf
iden
tial
www.sts.group Slide / 6STS Group © 2019
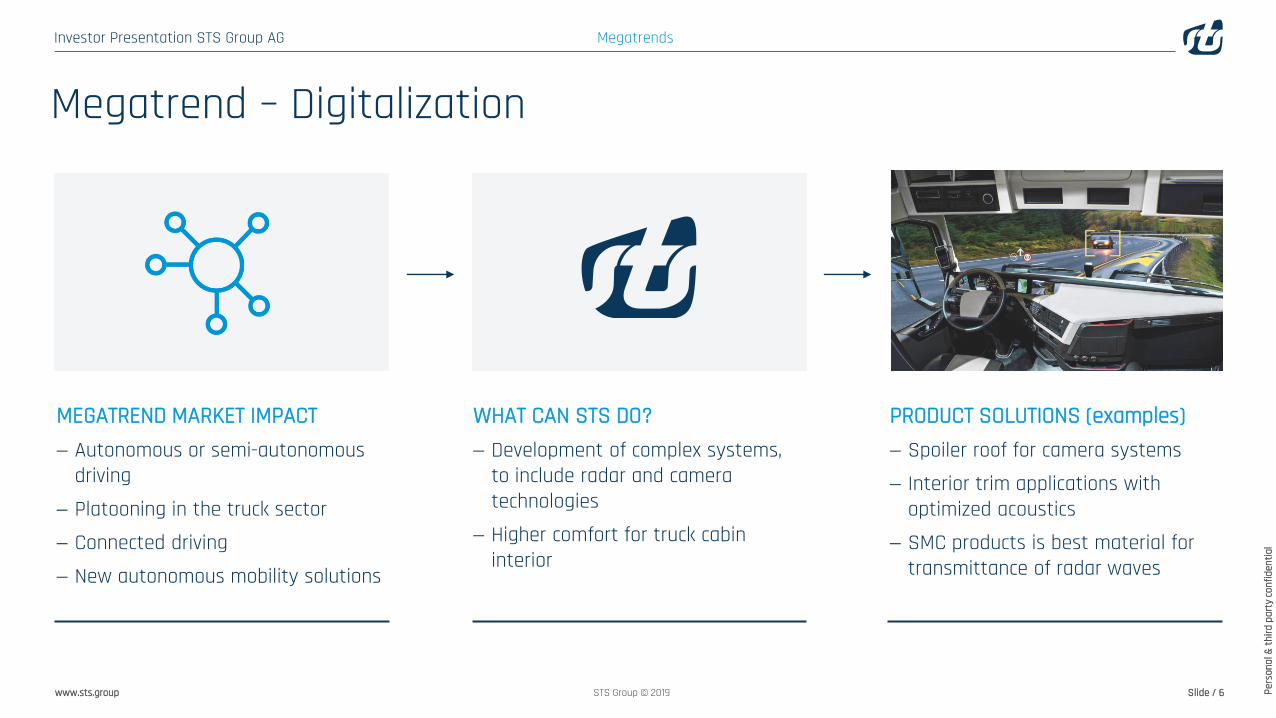
Megatrend – Digitalization
MEGATREND MARKET IMPACT − Autonomous or semi-autonomous
driving− Platooning in the truck sector − Connected driving− New autonomous mobility solutions
WHAT CAN STS DO?− Development of complex systems,
to include radar and camera technologies
− Higher comfort for truck cabininterior
PRODUCT SOLUTIONS (examples)− Spoiler roof for camera systems− Interior trim applications with
optimized acoustics− SMC products is best material for
transmittance of radar waves
Megatrends
Investor Presentation STS Group AG
Pers
onal
& th
ird p
arty
conf
iden
tial
www.sts.group Slide / 7STS Group © 2019
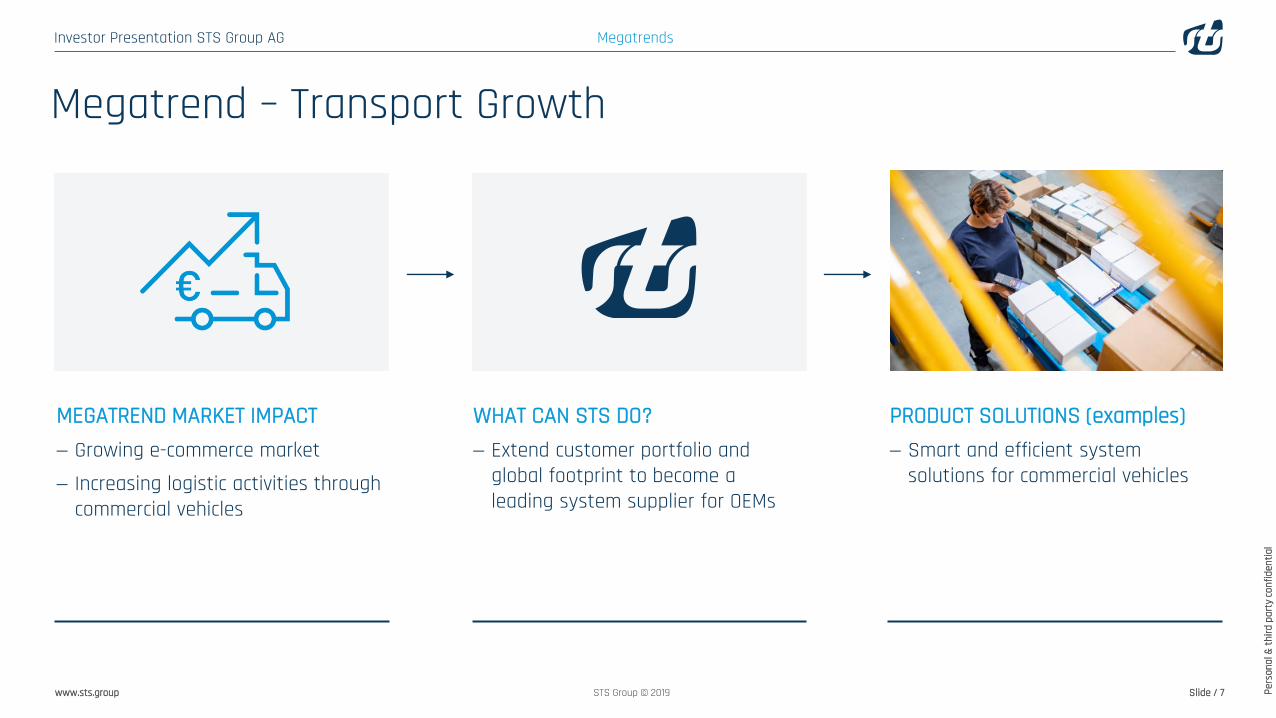
Megatrend – Transport Growth
MEGATREND MARKET IMPACT − Growing e-commerce market− Increasing logistic activities through
commercial vehicles
WHAT CAN STS DO?− Extend customer portfolio and
global footprint to become a leading system supplier for OEMs
PRODUCT SOLUTIONS (examples)− Smart and efficient system
solutions for commercial vehicles
Megatrends
Investor Presentation STS Group AG
Pers
onal
& th
ird p
arty
conf
iden
tial
www.sts.group Slide / 8STS Group © 2019
STS Groupat a glance
Investor Presentation STS Group AG
Pers
onal
& th
ird p
arty
conf
iden
tial
www.sts.group Slide / 9STS Group © 2019
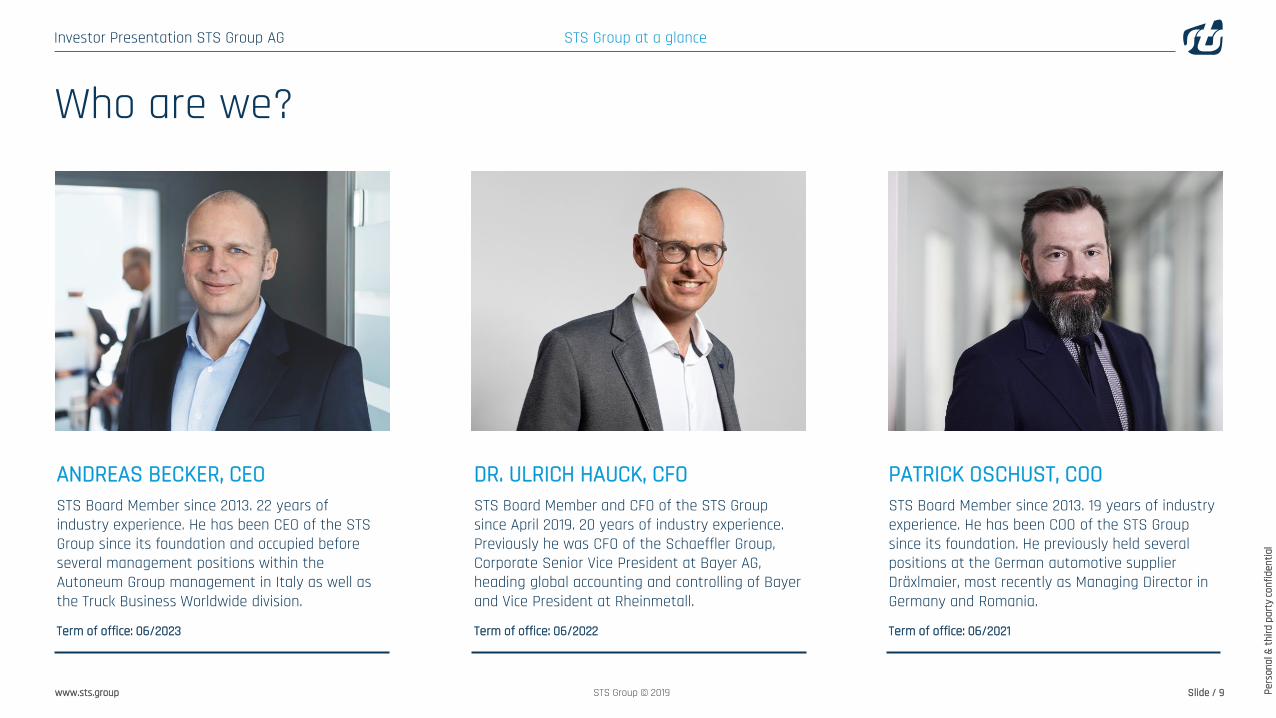
Who are we?
ANDREAS BECKER, CEOSTS Board Member since 2013. 22 years of industry experience. He has been CEO of the STS Group since its foundation and occupied before several management positions within the Autoneum Group management in Italy as well as the Truck Business Worldwide division.
Term of office: 06/2023
DR. ULRICH HAUCK, CFOSTS Board Member and CFO of the STS Group since April 2019. 20 years of industry experience. Previously he was CFO of the Schaeffler Group, Corporate Senior Vice President at Bayer AG, heading global accounting and controlling of Bayer and Vice President at Rheinmetall.
Term of office: 06/2022
PATRICK OSCHUST, COOSTS Board Member since 2013. 19 years of industry experience. He has been COO of the STS Group since its foundation. He previously held several positions at the German automotive supplier Dräxlmaier, most recently as Managing Director in Germany and Romania.
Term of office: 06/2021
STS Group at a glance
Investor Presentation STS Group AG
Pers
onal
& th
ird p
arty
conf
iden
tial
www.sts.group Slide / 10STS Group © 2019
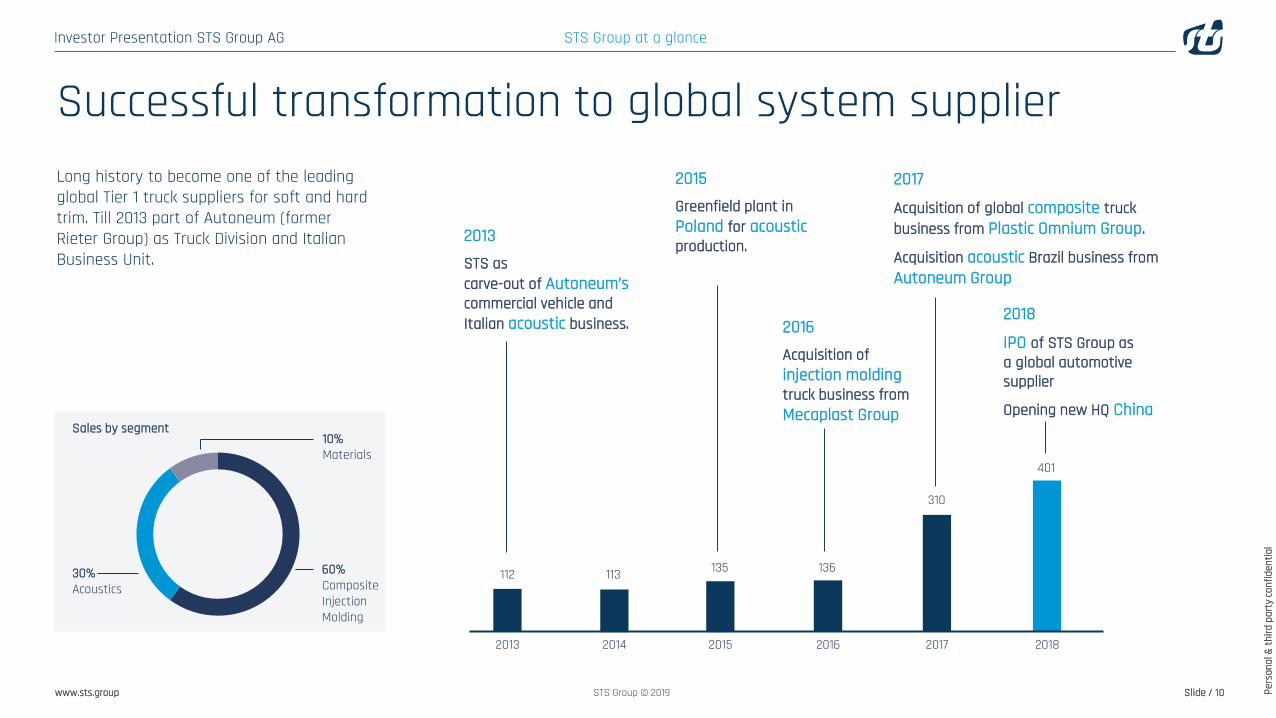
2018201520142013 2016 2017
112 113 135 136
310
401
2013STS as carve-out of Autoneum’s commercial vehicle and Italian acoustic business.
2015Greenfield plant in Poland for acousticproduction.
2016Acquisition of injection moldingtruck business from Mecaplast Group
2017
Acquisition of global composite truck business from Plastic Omnium Group.
Acquisition acoustic Brazil business from Autoneum Group
2018
IPO of STS Group as a global automotive supplier
Opening new HQ China
Long history to become one of the leading global Tier 1 truck suppliers for soft and hard trim. Till 2013 part of Autoneum (former Rieter Group) as Truck Division and Italian Business Unit.
STS Group at a glance
Successful transformation to global system supplier
10%Materials
Sales by segment
60%CompositeInjectionMolding
30%Acoustics
Investor Presentation STS Group AG
Pers
onal
& th
ird p
arty
conf
iden
tial
www.sts.group Slide / 11STS Group © 2019
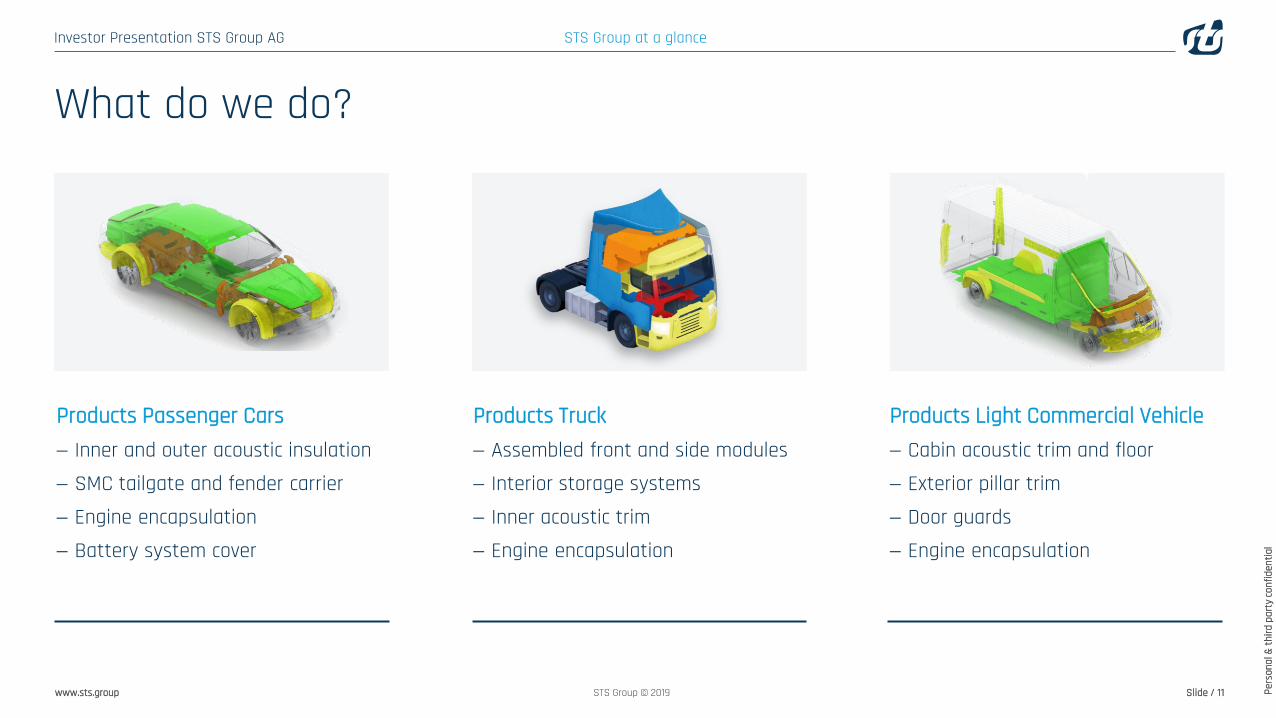
Products Passenger Cars− Inner and outer acoustic insulation− SMC tailgate and fender carrier− Engine encapsulation− Battery system cover
Products Truck− Assembled front and side modules− Interior storage systems− Inner acoustic trim− Engine encapsulation
Products Light Commercial Vehicle− Cabin acoustic trim and floor− Exterior pillar trim− Door guards− Engine encapsulation
What do we do?
STS Group at a glance
Investor Presentation STS Group AG
Pers
onal
& th
ird p
arty
conf
iden
tial
www.sts.group Slide / 12STS Group © 2019
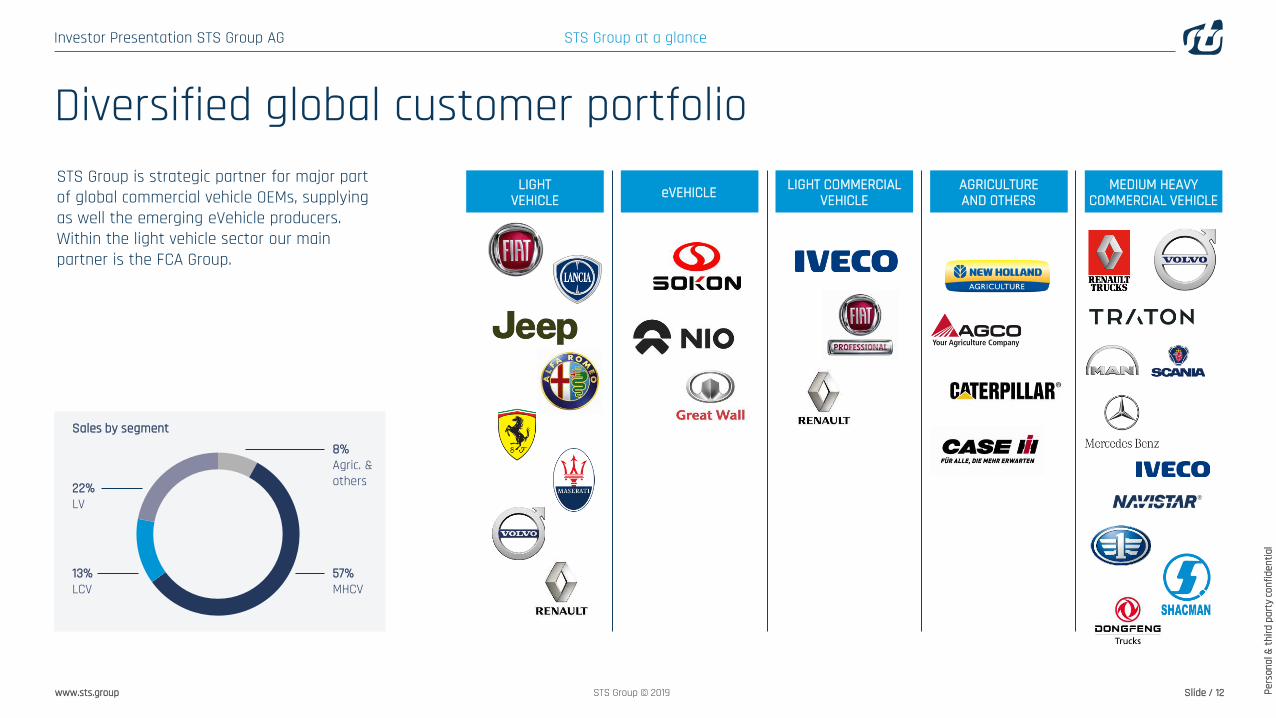
STS Group is strategic partner for major part of global commercial vehicle OEMs, supplying as well the emerging eVehicle producers. Within the light vehicle sector our main partner is the FCA Group.
8%Agric. & others
57%MHCV
13%LCV
22%LV
Sales by segment
LIGHTVEHICLE
LIGHT COMMERCIALVEHICLE
AGRICULTUREAND OTHERS
MEDIUM HEAVYCOMMERCIAL VEHICLEeVEHICLE
STS Group at a glance
Diversified global customer portfolio
Investor Presentation STS Group AG
Pers
onal
& th
ird p
arty
conf
iden
tial
www.sts.group Slide / 13STS Group © 2019
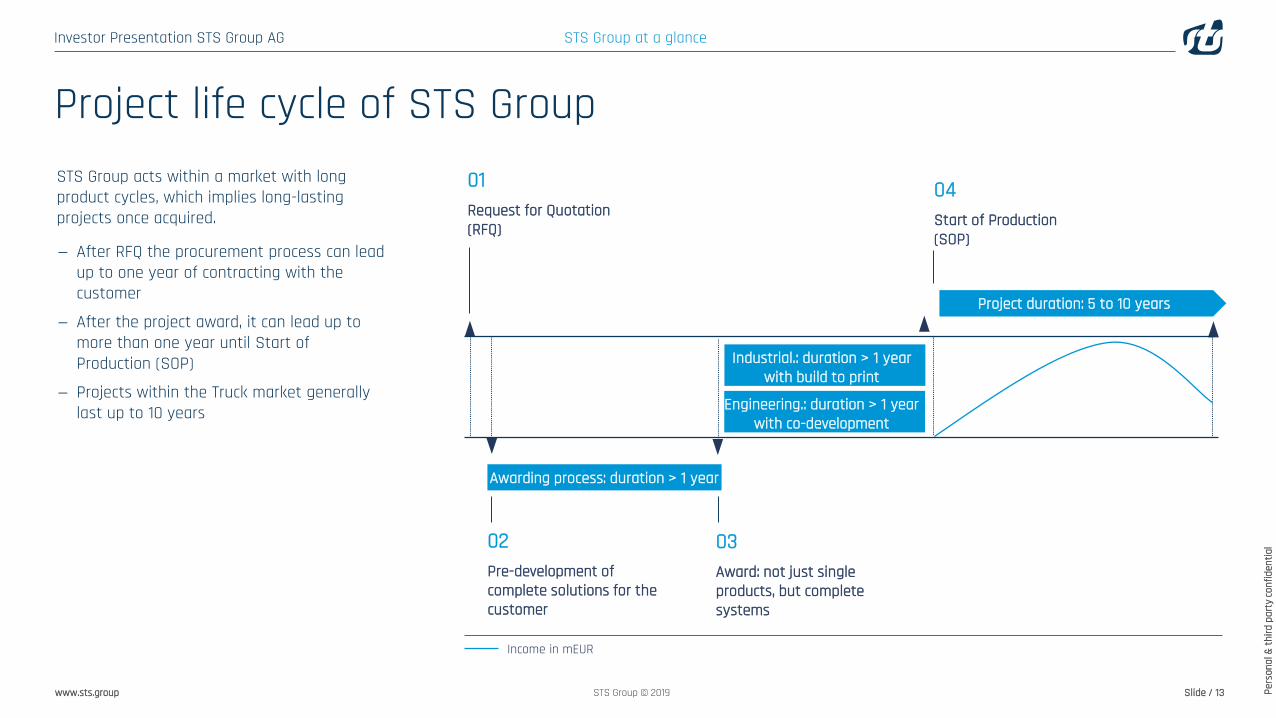
Project life cycle of STS Group01Request for Quotation (RFQ)
04Start of Production (SOP)
Project duration: 5 to 10 years
STS Group acts within a market with long product cycles, which implies long-lasting projects once acquired.
− After RFQ the procurement process can lead up to one year of contracting with the customer
− After the project award, it can lead up to more than one year until Start of Production (SOP)
− Projects within the Truck market generally last up to 10 years
02Pre-development of complete solutions for the customer
03Award: not just single products, but complete systems
Awarding process: duration > 1 year year
Income in mEUR
STS Group at a glance
Industrial.: duration > 1 year with build to print
Engineering.: duration > 1 year with co-development
Investor Presentation STS Group AG
Pers
onal
& th
ird p
arty
conf
iden
tial
www.sts.group Slide / 14STS Group © 2019
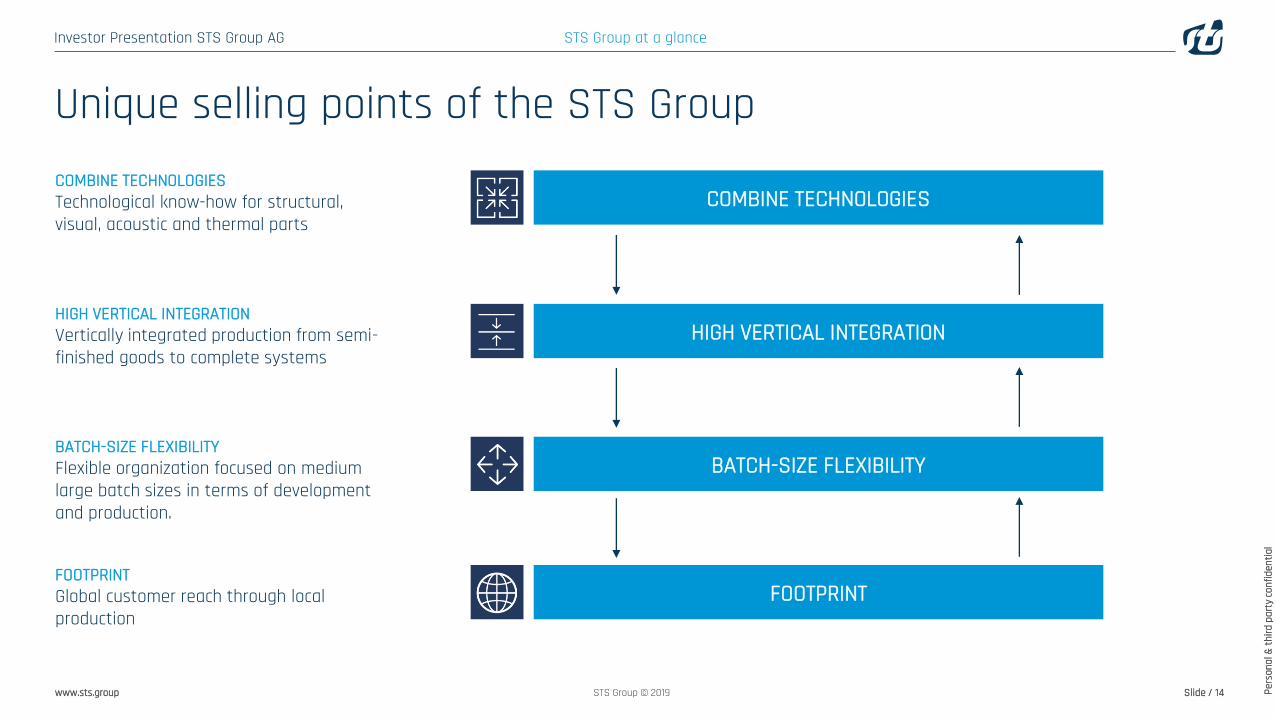
Unique selling points of the STS GroupCOMBINE TECHNOLOGIESTechnological know-how for structural, visual, acoustic and thermal parts
HIGH VERTICAL INTEGRATION
COMBINE TECHNOLOGIES
BATCH-SIZE FLEXIBILITY
FOOTPRINT
STS Group at a glance
HIGH VERTICAL INTEGRATIONVertically integrated production from semi-finished goods to complete systems
BATCH-SIZE FLEXIBILITYFlexible organization focused on medium large batch sizes in terms of development and production.
FOOTPRINTGlobal customer reach through local production
Investor Presentation STS Group AG
Pers
onal
& th
ird p
arty
conf
iden
tial
www.sts.group Slide / 15STS Group © 2019
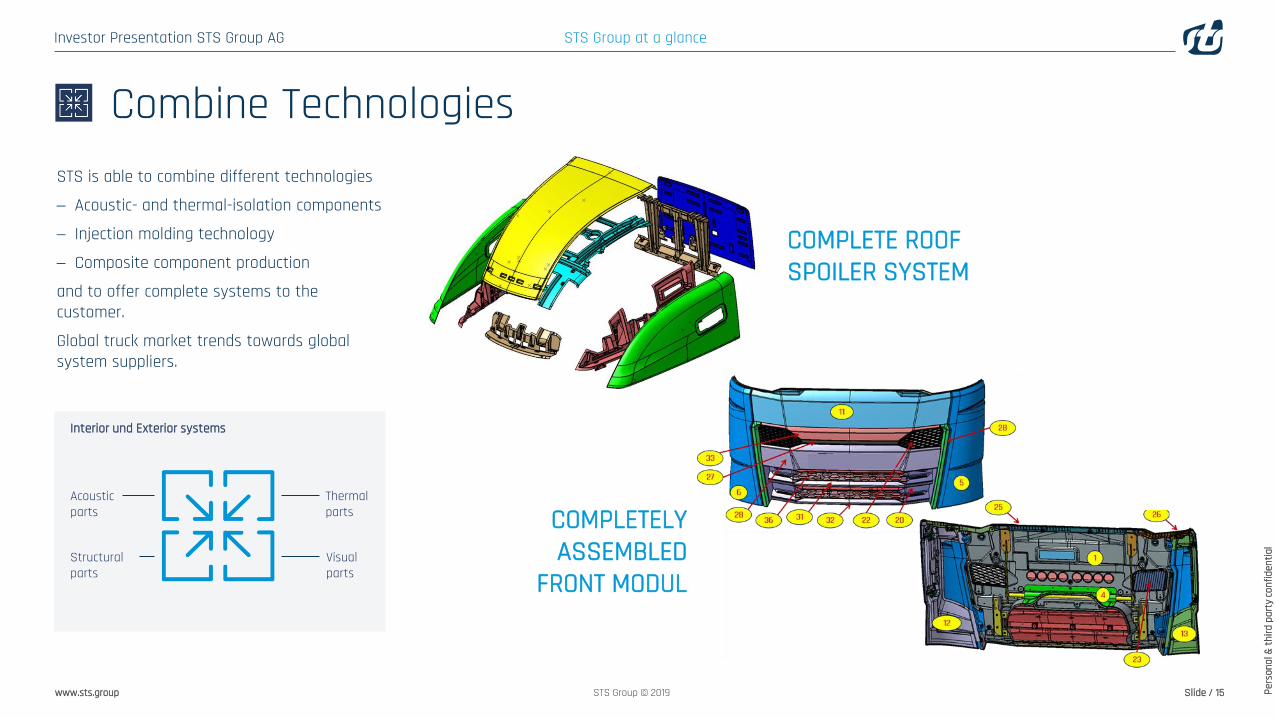
Combine TechnologiesSTS is able to combine different technologies
− Acoustic- and thermal-isolation components
− Injection molding technology
− Composite component production
and to offer complete systems to the customer.
Global truck market trends towards global system suppliers.
Interior und Exterior systems
Acoustic parts
Structuralparts
Thermalparts
Visualparts
STS Group at a glance
COMPLETE ROOF SPOILER SYSTEM
COMPLETELY ASSEMBLED
FRONT MODUL

Investor Presentation STS Group AG
Pers
onal
& th
ird p
arty
conf
iden
tial
www.sts.group Slide / 16STS Group © 2019
Injection moldingFelt thermoforming, PU foaming, Textile Lamination Composite thermocompression: SMC, BMC, AMC
Vertical Integration
STS Group at a glance
SEMI FINISH
− Fabric− Resins
RAW MATERIAL
− Cotton, polyester, polyamide, glass wool
− Phenolic, polyester, thermoplastic
− Binder
MOLDING
− Mold design− Prototyping− Process control
FINISHING
− Cutting− Textile lamination− PVC lamination− Assembly and control
SEMI FINISH
− Glass fiber− Resins
RAW MATERIAL
− Resin paste− Glass fiber reinforcement
and compression− Maturation
MOLDING
− Mold design− Prototyping− Process control− In Mold Coating (IMC)
FINISHING
− Deburring, machining− Painting and gluing− Assembly− Quality control
− Pellets(PP, PC, ABS, PA, POM)
RAW MATERIAL
MOLDING
FINISHING
− Deburring, machining− Painting and gluing− Assembly− Quality control
− Mold design− Prototyping− Process control
Investor Presentation STS Group AG
Pers
onal
& th
ird p
arty
conf
iden
tial
www.sts.group Slide / 17STS Group © 2019
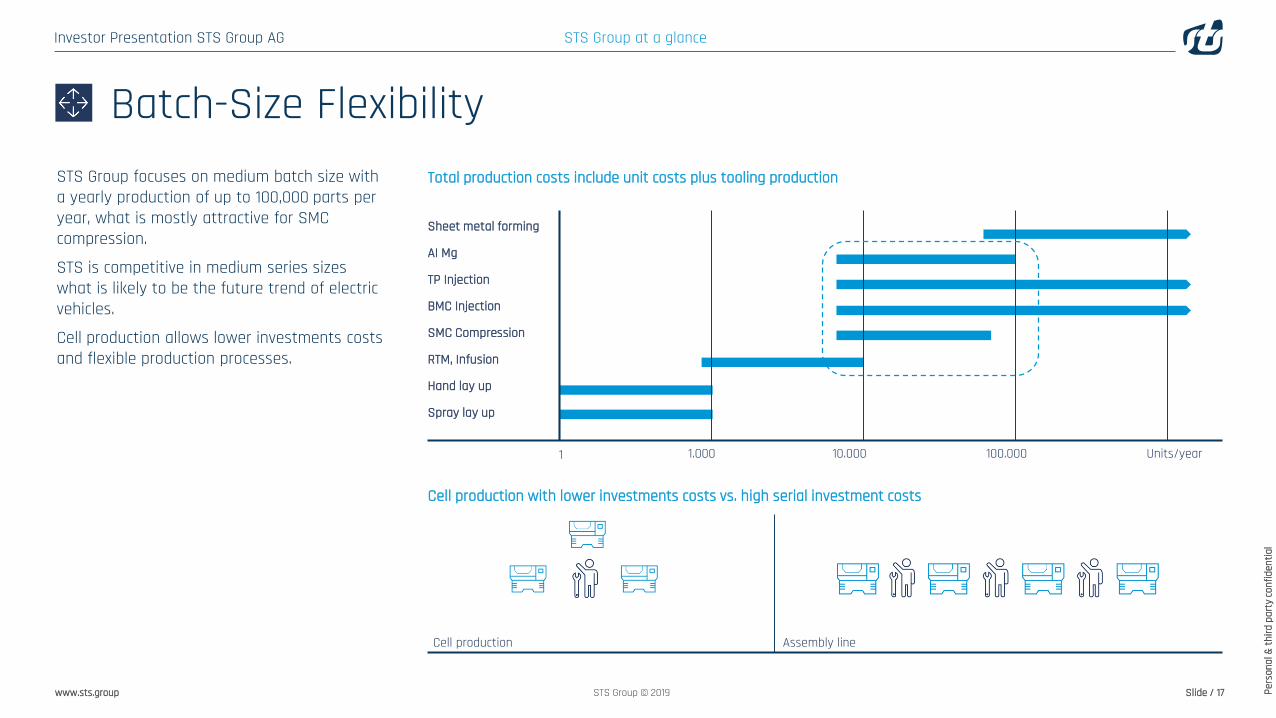
STS Group focuses on medium batch size with a yearly production of up to 100,000 parts per year, what is mostly attractive for SMC compression.
STS is competitive in medium series sizes what is likely to be the future trend of electric vehicles.
Cell production allows lower investments costs and flexible production processes.
Batch-Size Flexibility
STS Group at a glance
Total production costs include unit costs plus tooling production
Cell production with lower investments costs vs. high serial investment costs
100.0001 1.000 10.000 Units/year
Sheet metal forming
AI Mg
TP Injection
BMC Injection
SMC Compression
RTM, Infusion
Hand lay up
Spray lay up
Cell production Assembly line
Investor Presentation STS Group AG
Pers
onal
& th
ird p
arty
conf
iden
tial
www.sts.group Slide / 18STS Group © 2019
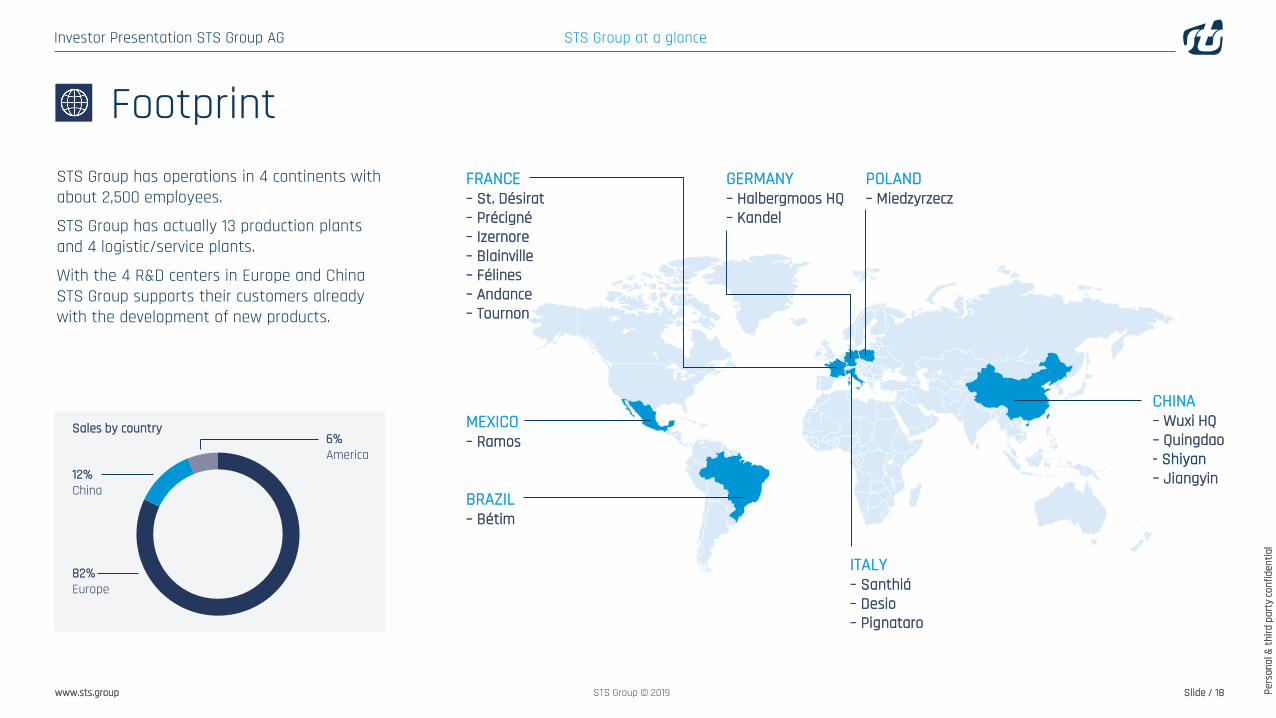
STS Group has operations in 4 continents with about 2,500 employees.
STS Group has actually 13 production plants and 4 logistic/service plants.
With the 4 R&D centers in Europe and China STS Group supports their customers already with the development of new products.
6%America
82%Europe
12%China
Sales by country
BRAZIL– Bétim
MEXICO– Ramos
FRANCE– St. Désirat– Précigné– Izernore– Blainville– Félines– Andance– Tournon
ITALY– Santhiá– Desio– Pignataro
POLAND– Miedzyrzecz
GERMANY– Halbergmoos HQ– Kandel
CHINA– Wuxi HQ– Quingdao- Shiyan– Jiangyin
Footprint
STS Group at a glance
Investor Presentation STS Group AG
Pers
onal
& th
ird p
arty
conf
iden
tial
www.sts.group Slide / 19STS Group © 2019
STS Group Strategy
Investor Presentation STS Group AG
Pers
onal
& th
ird p
arty
conf
iden
tial
www.sts.group Slide / 20STS Group © 2019
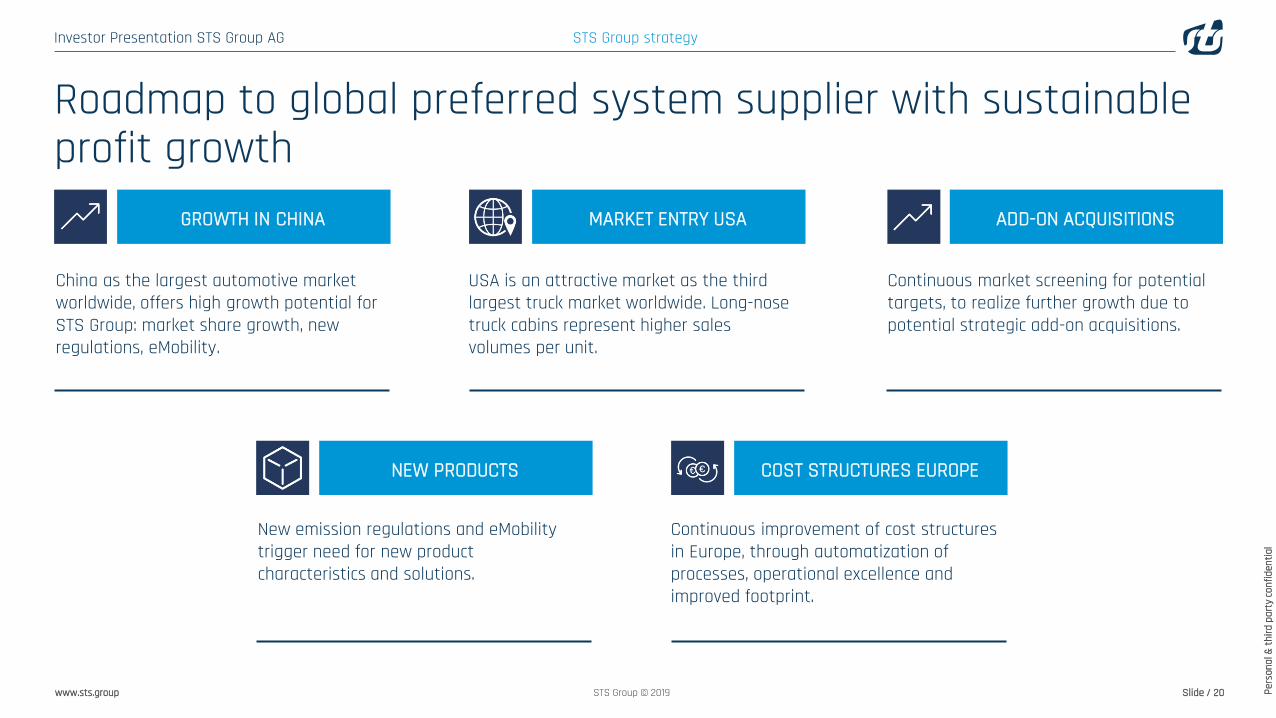
Roadmap to global preferred system supplier with sustainable profit growth
GROWTH IN CHINA MARKET ENTRY USA ADD-ON ACQUISITIONS
NEW PRODUCTS COST STRUCTURES EUROPE
China as the largest automotive market worldwide, offers high growth potential for STS Group: market share growth, new regulations, eMobility.
USA is an attractive market as the third largest truck market worldwide. Long-nose truck cabins represent higher sales volumes per unit.
Continuous market screening for potential targets, to realize further growth due to potential strategic add-on acquisitions.
New emission regulations and eMobilitytrigger need for new product characteristics and solutions.
Continuous improvement of cost structures in Europe, through automatization of processes, operational excellence and improved footprint.
STS Group strategy
Investor Presentation STS Group AG
Pers
onal
& th
ird p
arty
conf
iden
tial
www.sts.group Slide / 21STS Group © 2019
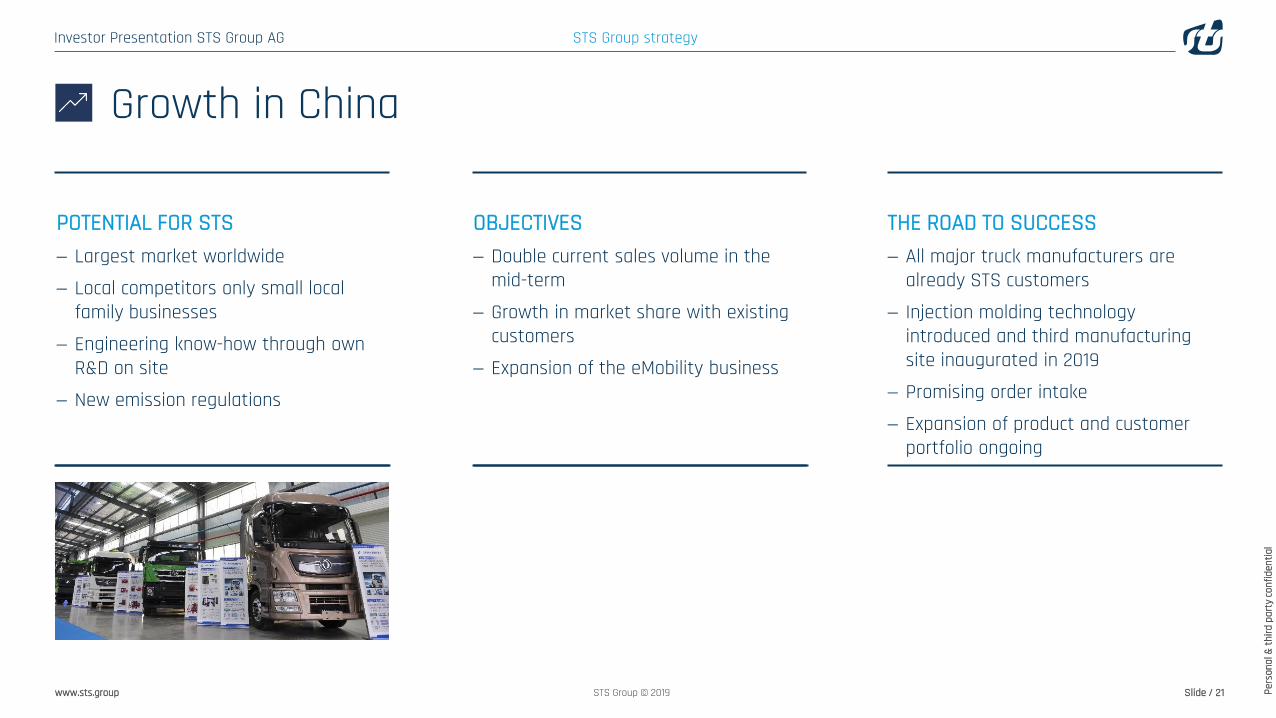
POTENTIAL FOR STS− Largest market worldwide
− Local competitors only small local family businesses
− Engineering know-how through own R&D on site
− New emission regulations
OBJECTIVES− Double current sales volume in the
mid-term
− Growth in market share with existing customers
− Expansion of the eMobility business
THE ROAD TO SUCCESS− All major truck manufacturers are
already STS customers
− Injection molding technology introduced and third manufacturing site inaugurated in 2019
− Promising order intake
− Expansion of product and customerportfolio ongoing
Growth in China
STS Group strategy
Investor Presentation STS Group AG
Pers
onal
& th
ird p
arty
conf
iden
tial
www.sts.group Slide / 22STS Group © 2019
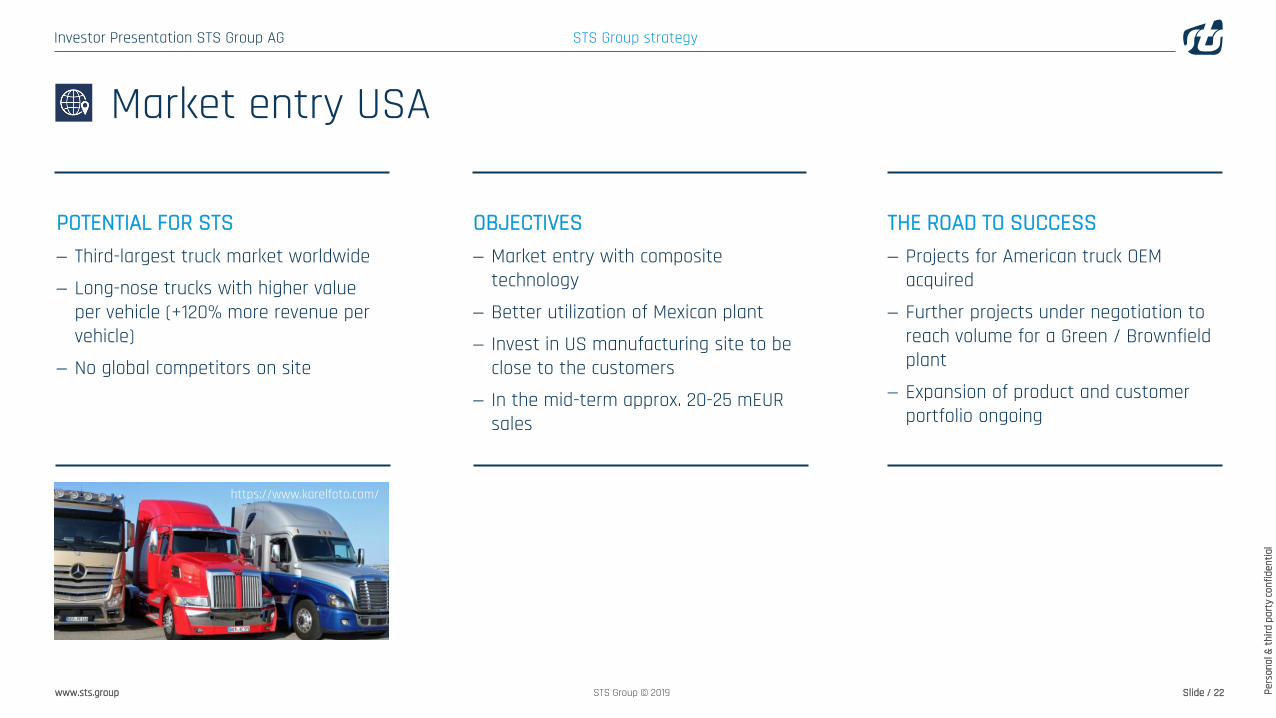
POTENTIAL FOR STS− Third-largest truck market worldwide
− Long-nose trucks with higher value per vehicle (+120% more revenue per vehicle)
− No global competitors on site
Market entry USA
OBJECTIVES− Market entry with composite
technology
− Better utilization of Mexican plant
− Invest in US manufacturing site to be close to the customers
− In the mid-term approx. 20-25 mEUR sales
THE ROAD TO SUCCESS− Projects for American truck OEM
acquired
− Further projects under negotiation to reach volume for a Green / Brownfield plant
− Expansion of product and customer portfolio ongoing
STS Group strategy
https://www.karelfoto.com/
Investor Presentation STS Group AG
Pers
onal
& th
ird p
arty
conf
iden
tial
www.sts.group Slide / 23STS Group © 2019
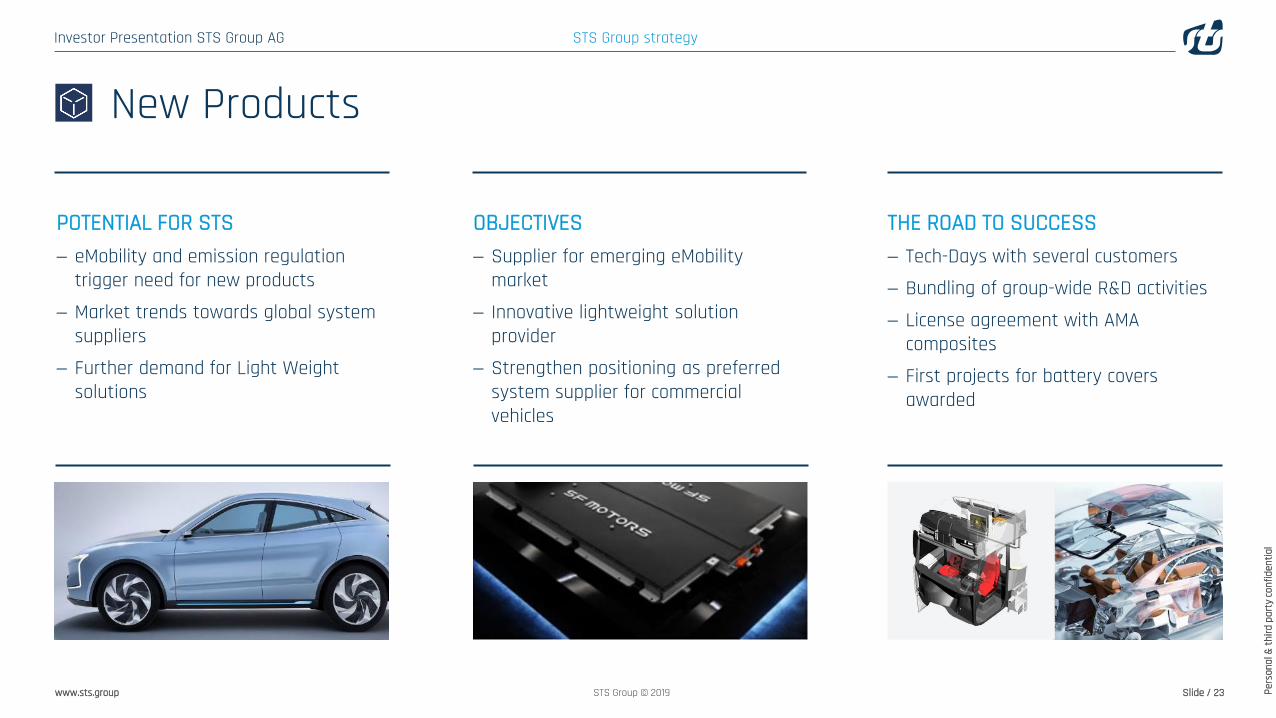
POTENTIAL FOR STS− eMobility and emission regulation
trigger need for new products
− Market trends towards global system suppliers
− Further demand for Light Weight solutions
OBJECTIVES− Supplier for emerging eMobility
market
− Innovative lightweight solution provider
− Strengthen positioning as preferred system supplier for commercial vehicles
THE ROAD TO SUCCESS− Tech-Days with several customers
− Bundling of group-wide R&D activities
− License agreement with AMA composites
− First projects for battery covers awarded
New Products
STS Group strategy
Investor Presentation STS Group AG
Pers
onal
& th
ird p
arty
conf
iden
tial
www.sts.group Slide / 24STS Group © 2019
Business & Financial Highlights H1 2019
Investor Presentation STS Group AG
Pers
onal
& th
ird p
arty
conf
iden
tial
www.sts.group Slide / 25STS Group © 2019
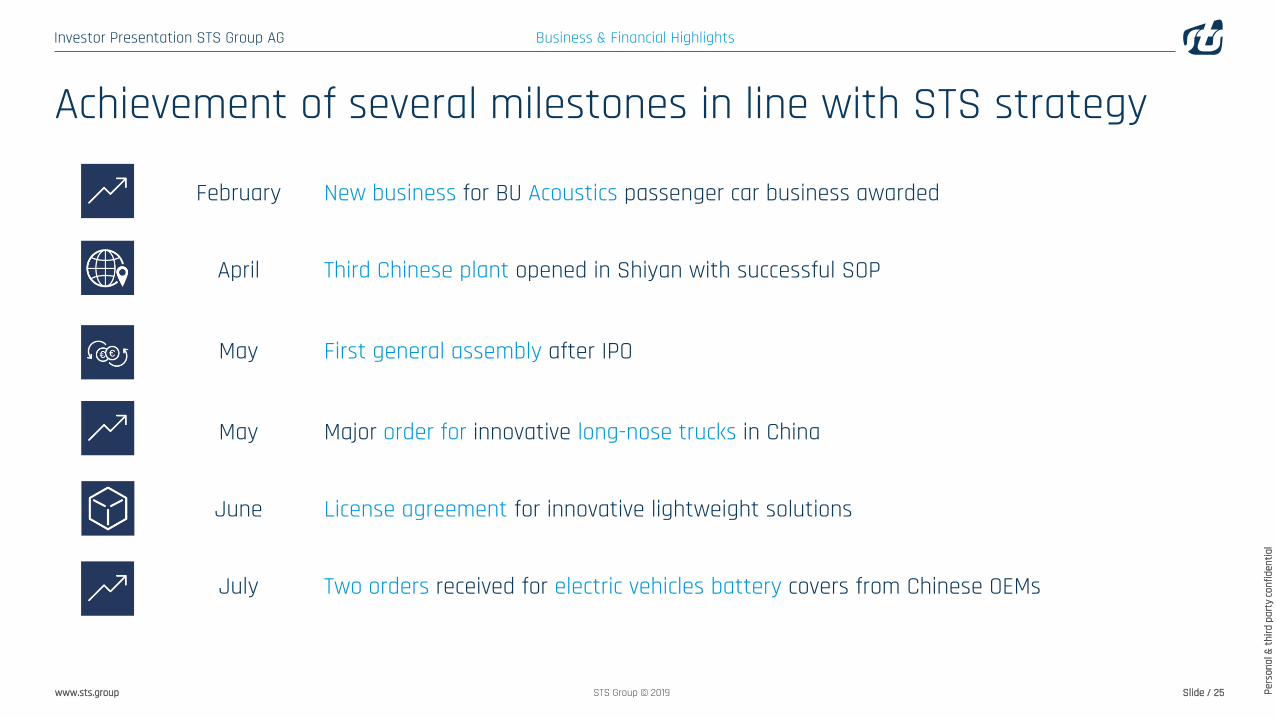
Achievement of several milestones in line with STS strategy
February New business for BU Acoustics passenger car business awarded
April Third Chinese plant opened in Shiyan with successful SOP
May First general assembly after IPO
May Major order for innovative long-nose trucks in China
June License agreement for innovative lightweight solutions
July Two orders received for electric vehicles battery covers from Chinese OEMs
Business & Financial Highlights
Investor Presentation STS Group AG
Pers
onal
& th
ird p
arty
conf
iden
tial
www.sts.group Slide / 26STS Group © 2019
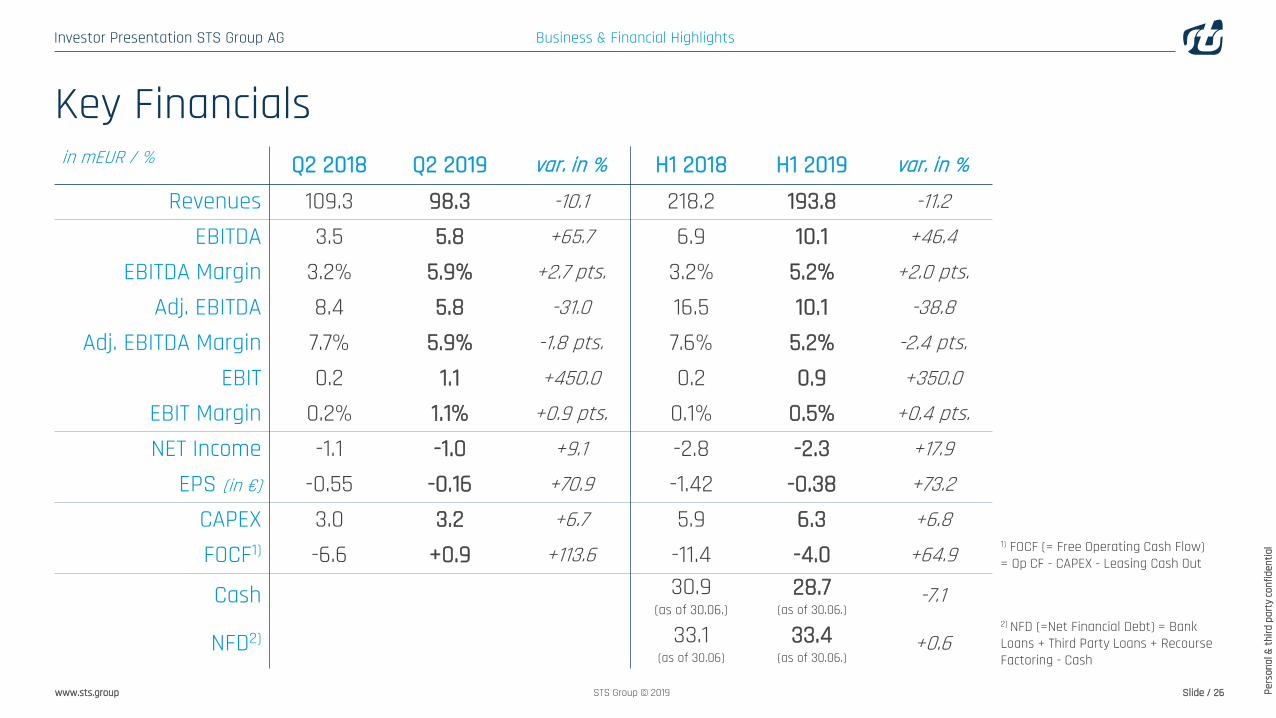
in mEUR / % Q2 2018 Q2 2019 var. in % H1 2018 H1 2019 var. in %
Revenues 109.3 98.3 -10.1 218.2 193.8 -11.2
EBITDA 3.5 5.8 +65.7 6.9 10.1 +46.4
EBITDA Margin 3.2% 5.9% +2.7 pts. 3.2% 5.2% +2.0 pts.
Adj. EBITDA 8.4 5.8 -31.0 16.5 10.1 -38.8
Adj. EBITDA Margin 7.7% 5.9% -1.8 pts. 7.6% 5.2% -2.4 pts.
EBIT 0.2 1.1 +450.0 0.2 0.9 +350.0
EBIT Margin 0.2% 1.1% +0.9 pts. 0.1% 0.5% +0.4 pts.
NET Income -1.1 -1.0 +9.1 -2.8 -2.3 +17.9
EPS (in €) -0.55 -0.16 +70.9 -1.42 -0.38 +73.2
CAPEX 3.0 3.2 +6.7 5.9 6.3 +6.8
FOCF1) -6.6 +0.9 +113.6 -11.4 -4.0 +64.91) FOCF (= Free Operating Cash Flow) = Op CF - CAPEX - Leasing Cash Out
Cash 30.9 (as of 30.06.)
28.7(as of 30.06.)
-7.1
NFD2) 33.1(as of 30.06)
33.4(as of 30.06.)
+0.62) NFD (=Net Financial Debt) = Bank Loans + Third Party Loans + Recourse Factoring - Cash
Business & Financial Highlights
Key Financials
Investor Presentation STS Group AG
Pers
onal
& th
ird p
arty
conf
iden
tial
www.sts.group Slide / 27STS Group © 2019
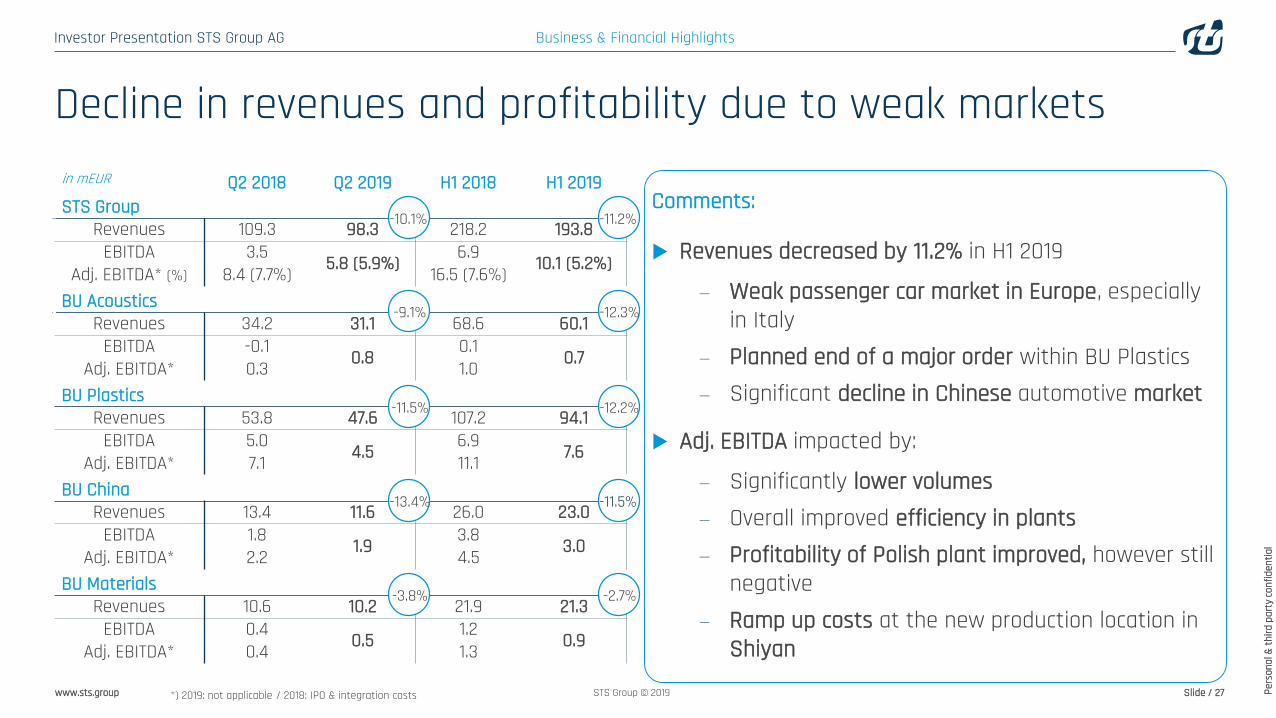
Comments:
Revenues decreased by 11.2% in H1 2019
− Weak passenger car market in Europe, especially in Italy
− Planned end of a major order within BU Plastics− Significant decline in Chinese automotive market
Adj. EBITDA impacted by:
− Significantly lower volumes− Overall improved efficiency in plants− Profitability of Polish plant improved, however still
negative− Ramp up costs at the new production location in
Shiyan
in mEUR Q2 2018 Q2 2019 H1 2018 H1 2019STS Group
Revenues 109.3 98.3 218.2 193.8EBITDA 3.5 5.8 (5.9%) 6.9 10.1 (5.2%)Adj. EBITDA* (%) 8.4 (7.7%) 16.5 (7.6%)
BU AcousticsRevenues 34.2 31.1 68.6 60.1
EBITDA -0.1 0.8 0.1 0.7Adj. EBITDA* 0.3 1.0BU Plastics
Revenues 53.8 47.6 107.2 94.1EBITDA 5.0 4.5 6.9 7.6Adj. EBITDA* 7.1 11.1
BU ChinaRevenues 13.4 11.6 26.0 23.0
EBITDA 1.8 1.9 3.8 3.0Adj. EBITDA* 2.2 4.5BU Materials
Revenues 10.6 10.2 21.9 21.3EBITDA 0.4 0.5 1.2 0.9Adj. EBITDA* 0.4 1.3
-10.1%
-9.1%
-11.5%
-13.4%
-3.8%
-11.2%
-12.3%
-12.2%
-11.5%
-2.7%
*) 2019: not applicable / 2018: IPO & integration costs
Business & Financial Highlights
Decline in revenues and profitability due to weak markets
Investor Presentation STS Group AG
Pers
onal
& th
ird p
arty
conf
iden
tial
www.sts.group Slide / 29STS Group © 2019
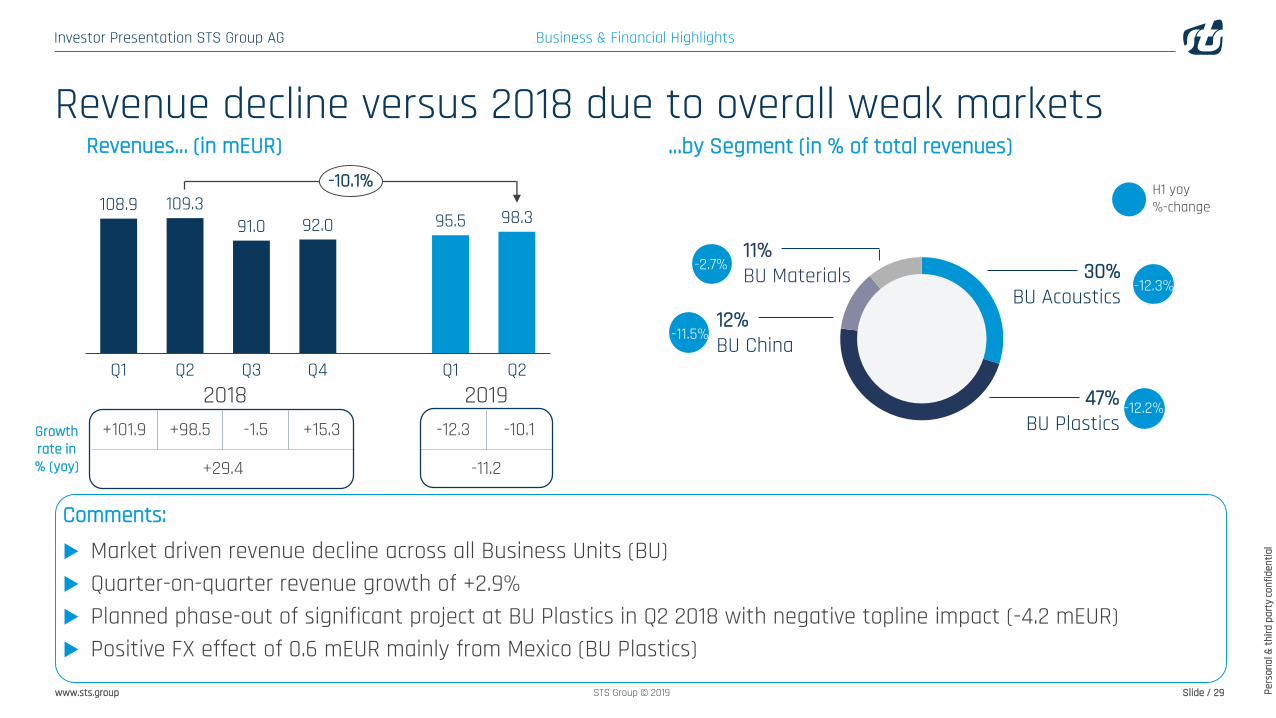
Growth rate in % (yoy)
+101.9 +98.5 -1.5 +15.3 -12.3 -10.1
+29.4 -11.2
Comments:
Market driven revenue decline across all Business Units (BU) Quarter-on-quarter revenue growth of +2.9% Planned phase-out of significant project at BU Plastics in Q2 2018 with negative topline impact (-4.2 mEUR) Positive FX effect of 0.6 mEUR mainly from Mexico (BU Plastics)
Q3 Q4
92.0
Q1 Q2 Q2Q1
108.9 109.391.0 95.5 98.3
-10.1%
2018 2019
Revenues… (in mEUR) …by Segment (in % of total revenues)
30%BU Acoustics
12%BU China
11%BU Materials
47%BU Plastics
H1 yoy%-change
-12.3%
-12.2%
-11.5%
-2.7%
Business & Financial Highlights
Revenue decline versus 2018 due to overall weak markets
Investor Presentation STS Group AG
Pers
onal
& th
ird p
arty
conf
iden
tial
www.sts.group Slide / 30STS Group © 2019
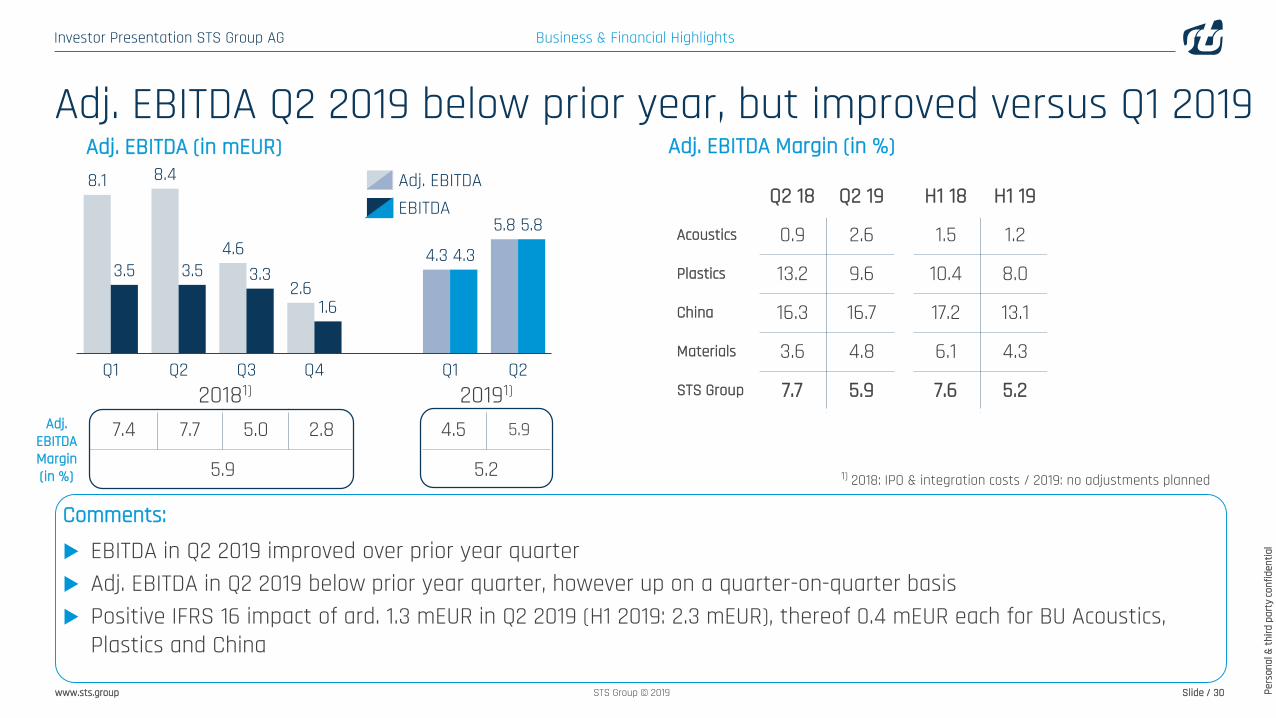
Q2 18 Q2 19 H1 18 H1 19
Acoustics 0.9 2.6 1.5 1.2
Plastics 13.2 9.6 10.4 8.0
China 16.3 16.7 17.2 13.1
Materials 3.6 4.8 6.1 4.3
STS Group 7.7 5.9 7.6 5.2
8.1
3.5
Q3Q1 Q2 Q1Q4 Q2
8.4
3.5
5.84.6
3.32.6
1.6
4.3 4.3
5.8
Adj. EBITDA (in mEUR)Adj. EBITDAEBITDA
20181) 20191)
Adj. EBITDAMargin (in %)
7.4 7.7 5.0 2.8 4.5 5.9
5.9 5.2 1) 2018: IPO & integration costs / 2019: no adjustments planned
Adj. EBITDA Margin (in %)
Comments:
EBITDA in Q2 2019 improved over prior year quarter Adj. EBITDA in Q2 2019 below prior year quarter, however up on a quarter-on-quarter basis Positive IFRS 16 impact of ard. 1.3 mEUR in Q2 2019 (H1 2019: 2.3 mEUR), thereof 0.4 mEUR each for BU Acoustics,
Plastics and China
Business & Financial Highlights
Adj. EBITDA Q2 2019 below prior year, but improved versus Q1 2019
Investor Presentation STS Group AG
Pers
onal
& th
ird p
arty
conf
iden
tial
www.sts.group Slide / 31STS Group © 2019
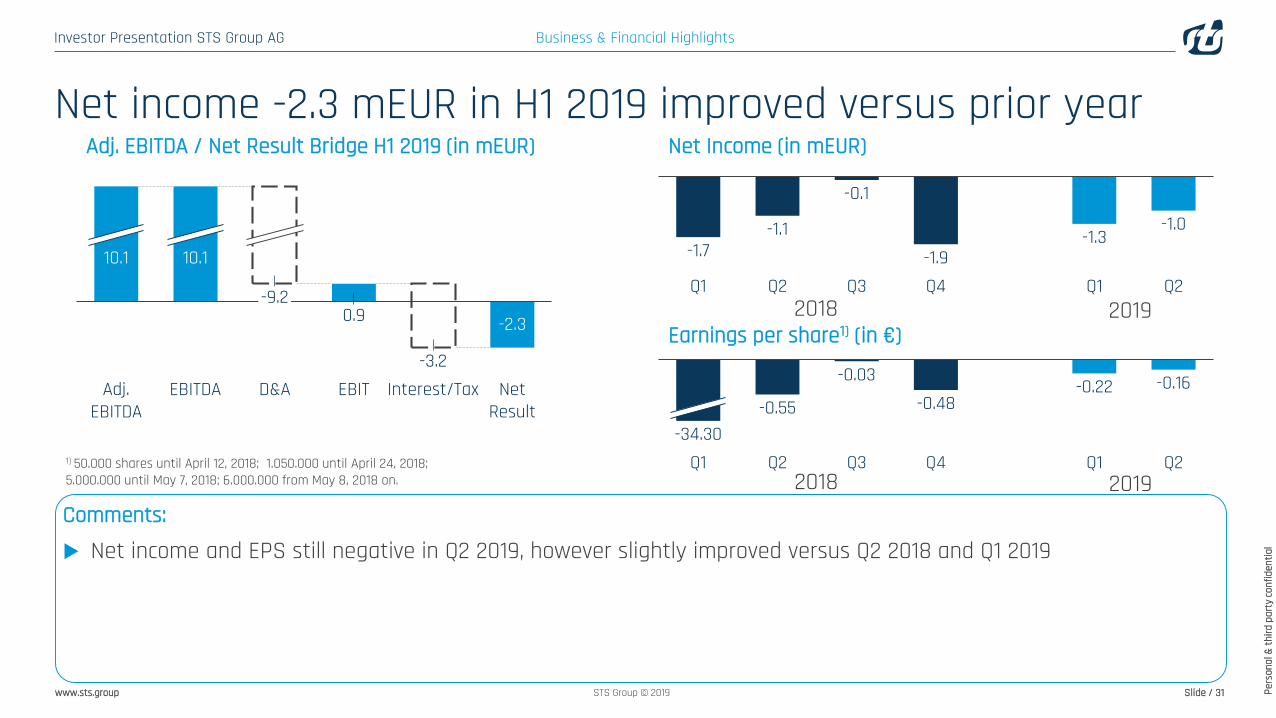
EBITAdj. EBITDA
10.1
0.9
10.1
Interest/TaxEBITDA
-9.2
D&A-3.2
-2.3
Net Result
-0.16
Q3
-0.03
Q4Q1 Q2 Q1 Q2-34.30
-0.55 -0.48-0.22
Earnings per share1) (in €)2018
Q2Q1
-1.7
Q3Q2 Q1Q4
-1.1
-0.1
-1.9-1.3
-1.0
2019
Adj. EBITDA / Net Result Bridge H1 2019 (in mEUR) Net Income (in mEUR)
2018 20191) 50.000 shares until April 12, 2018; 1.050.000 until April 24, 2018;5.000.000 until May 7, 2018; 6.000.000 from May 8, 2018 on.
Comments:
Net income and EPS still negative in Q2 2019, however slightly improved versus Q2 2018 and Q1 2019
Business & Financial Highlights
Net income -2.3 mEUR in H1 2019 improved versus prior year

Investor Presentation STS Group AG
Pers
onal
& th
ird p
arty
conf
iden
tial
www.sts.group Slide / 32STS Group © 2019
Q2Q1 Q3-6.6
Q4 Q2Q1
-4.8
2.4 3.6
-4.9
0.9
2018 2019
1) Cashflow from Operations – CAPEX - Lease cash outs
Oper. CF -1.8 -3.6 +6.2 +6.3 -0.8 +5.3-CAPEX -2.9 -3.0 -3.7 -2.5 -3.1 -3.2-Lease Cash out -0.1 0.0 -0.1 -0.2 -1.0 -1.2=FOCF -4.8 -6.6 2.4 3.6 -4.9 0.9
CAPEX (in mEUR)
Q1 Q1Q4
3.1
Q2 Q2Q3
2.9 3.03.7
2.53.2
+6.7%
2018 2019
in % ofRevenues
2.6 2.7 4.1 2.7 3.3 3.2
3.0 3.2
Free Operating Cash Flow1) (in mEUR)
in mEUR
Comments:
CAPEX in Q2 with 3.2 mEUR or 3.2% of revenues above prior year (previous year quarter 3.0 mEUR, 2.7%) Free Operating Cash Flow in Q2 2019 (+0.9 mEUR) significantly improved versus prior year (-6.6 mEUR) mainly due to
positive working capital development in Q2 2019
Business & Financial Highlights
Free Operating Cash Flow improved versus Q2 2018
Investor Presentation STS Group AG
Pers
onal
& th
ird p
arty
conf
iden
tial
www.sts.group Slide / 33STS Group © 2019
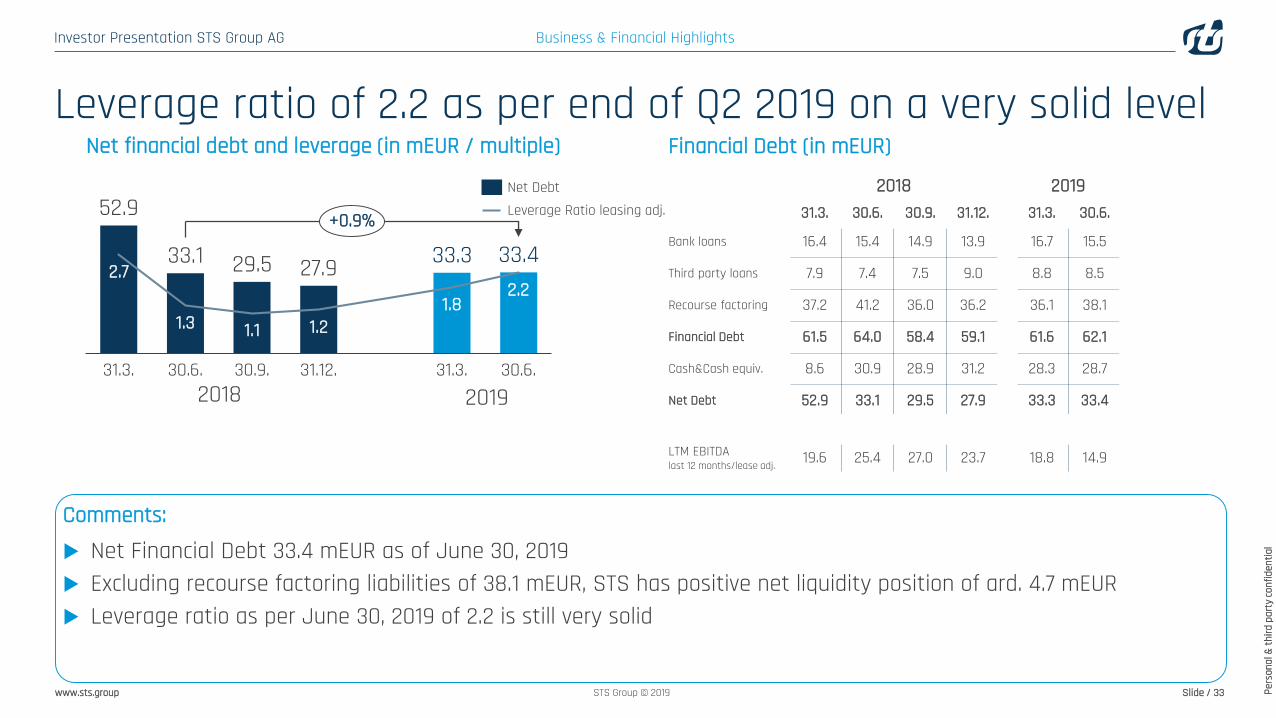
2018 2019
2018 201931.3. 30.6. 30.9. 31.12. 31.3. 30.6.
Bank loans 16.4 15.4 14.9 13.9 16.7 15.5
Third party loans 7.9 7.4 7.5 9.0 8.8 8.5
Recourse factoring 37.2 41.2 36.0 36.2 36.1 38.1
Financial Debt 61.5 64.0 58.4 59.1 61.6 62.1
Cash&Cash equiv. 8.6 30.9 28.9 31.2 28.3 28.7
Net Debt 52.9 33.1 29.5 27.9 33.3 33.4
LTM EBITDAlast 12 months/lease adj. 19.6 25.4 27.0 23.7 18.8 14.9
Net financial debt and leverage (in mEUR / multiple)
2.7
1.1
31.3. 30.9.
2.2
1.3
30.6.
1.2
31.12.
1.8
31.3. 30.6.
29.5
52.9
33.1 27.9 33.3 33.4+0.9%
Net DebtLeverage Ratio leasing adj.
Financial Debt (in mEUR)
Comments:
Net Financial Debt 33.4 mEUR as of June 30, 2019 Excluding recourse factoring liabilities of 38.1 mEUR, STS has positive net liquidity position of ard. 4.7 mEUR Leverage ratio as per June 30, 2019 of 2.2 is still very solid
Business & Financial Highlights
Leverage ratio of 2.2 as per end of Q2 2019 on a very solid level
Investor Presentation STS Group AG
Pers
onal
& th
ird p
arty
conf
iden
tial
www.sts.group Slide / 34STS Group © 2019
Guidance & Capital Market
Investor Presentation STS Group AG
Pers
onal
& th
ird p
arty
conf
iden
tial
www.sts.group Slide / 35STS Group © 2019
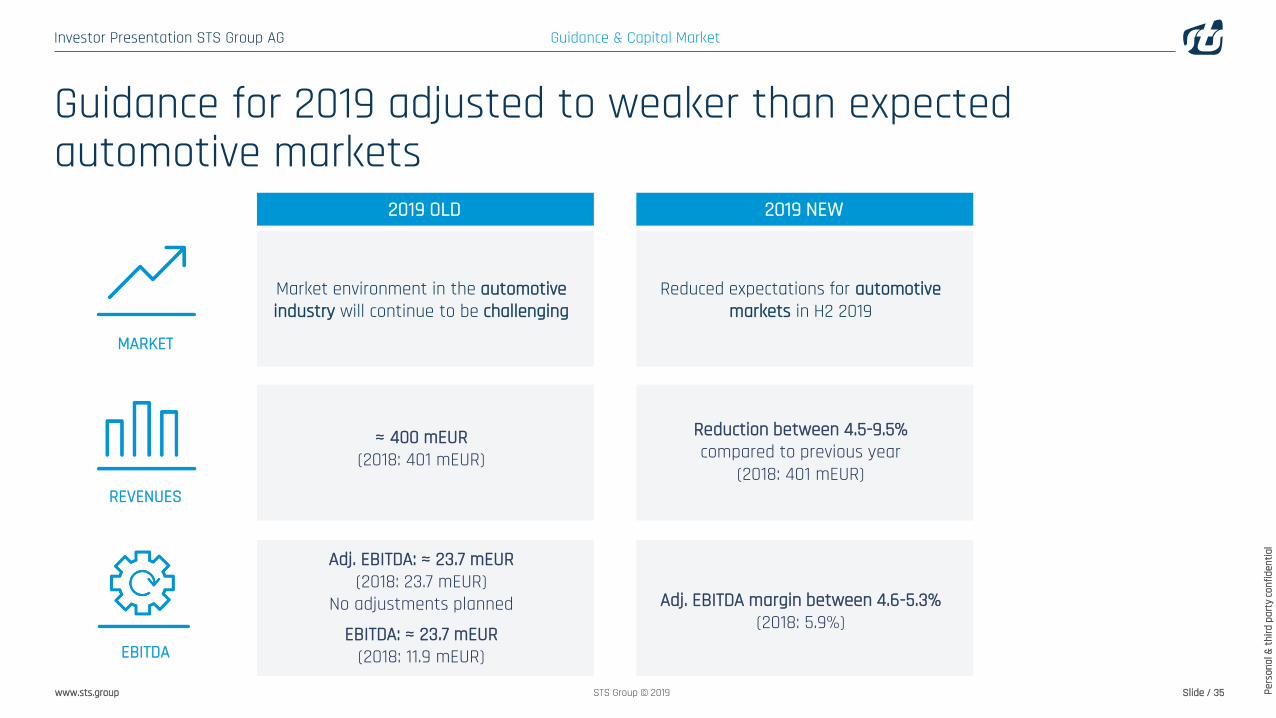
Guidance for 2019 adjusted to weaker than expected automotive markets
Guidance & Capital Market
MARKET
REVENUES
EBITDA
Market environment in the automotiveindustry will continue to be challenging
≈ 400 mEUR(2018: 401 mEUR)
Adj. EBITDA: ≈ 23.7 mEUR(2018: 23.7 mEUR)
No adjustments planned
EBITDA: ≈ 23.7 mEUR(2018: 11.9 mEUR)
2019 OLD
Reduced expectations for automotivemarkets in H2 2019
Reduction between 4.5-9.5%compared to previous year
(2018: 401 mEUR)
Adj. EBITDA margin between 4.6-5.3%(2018: 5.9%)
2019 NEW
Investor Presentation STS Group AG
Pers
onal
& th
ird p
arty
conf
iden
tial
www.sts.group Slide / 36STS Group © 2019
0
5
10
15
20
25
30
10
20
30
40
50
60
70
80
90
Jun 18 Jul 18 Jul 18 Aug 18 Sep 18 Oct 18 Nov 18 Dec 18 Jan 19 Feb 19 Mar 19 Apr 19 May 19 Jun 19 Jul 19 Aug 19
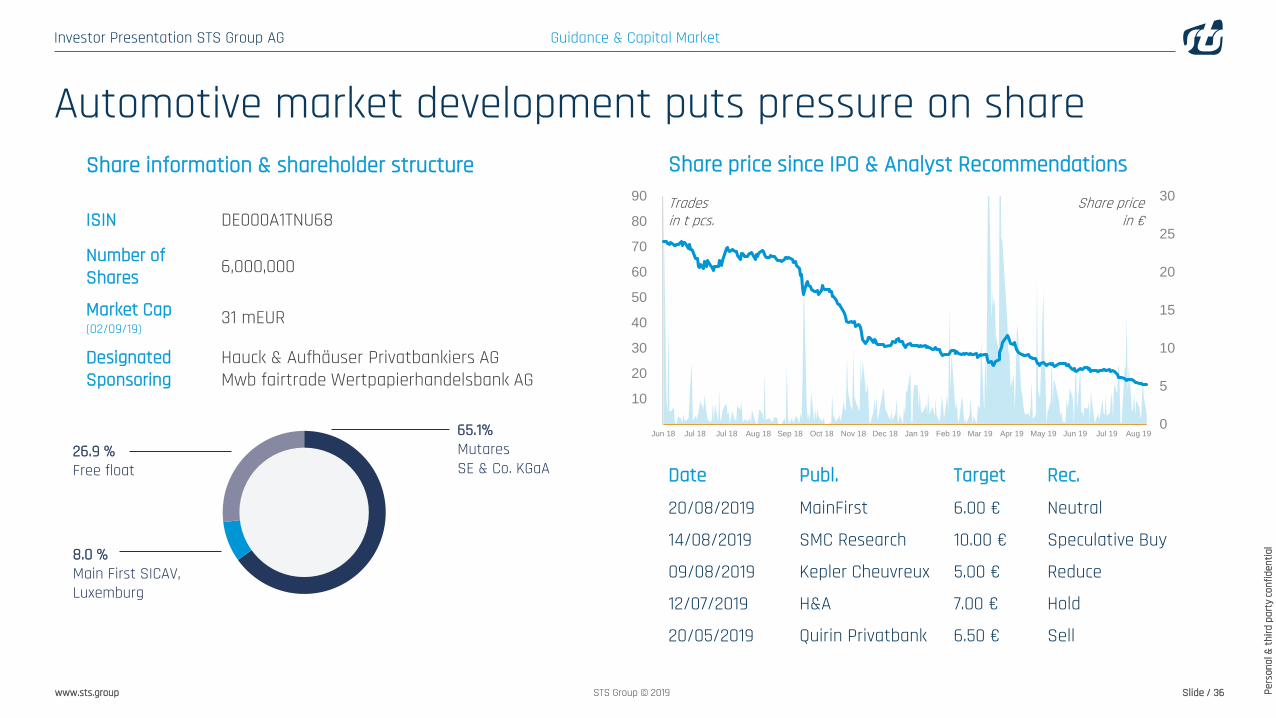
Automotive market development puts pressure on share
Share price in €
Trades in t pcs.
Date Publ. Target Rec.
20/08/2019 MainFirst 6.00 € Neutral
14/08/2019 SMC Research 10.00 € Speculative Buy
09/08/2019 Kepler Cheuvreux 5.00 € Reduce
12/07/2019 H&A 7.00 € Hold
20/05/2019 Quirin Privatbank 6.50 € Sell
ISIN DE000A1TNU68
Number ofShares 6,000,000
Market Cap (02/09/19)
31 mEUR
Designated Sponsoring
Hauck & Aufhäuser Privatbankiers AGMwb fairtrade Wertpapierhandelsbank AG
Guidance & Capital Market
Share price since IPO & Analyst RecommendationsShare information & shareholder structure
65.1%MutaresSE & Co. KGaA
8.0 %Main First SICAV, Luxemburg
26.9 %Free float
Investor Presentation STS Group AG
Pers
onal
& th
ird p
arty
conf
iden
tial
www.sts.group Slide / 37STS Group © 2019
Guidance & Capital Market
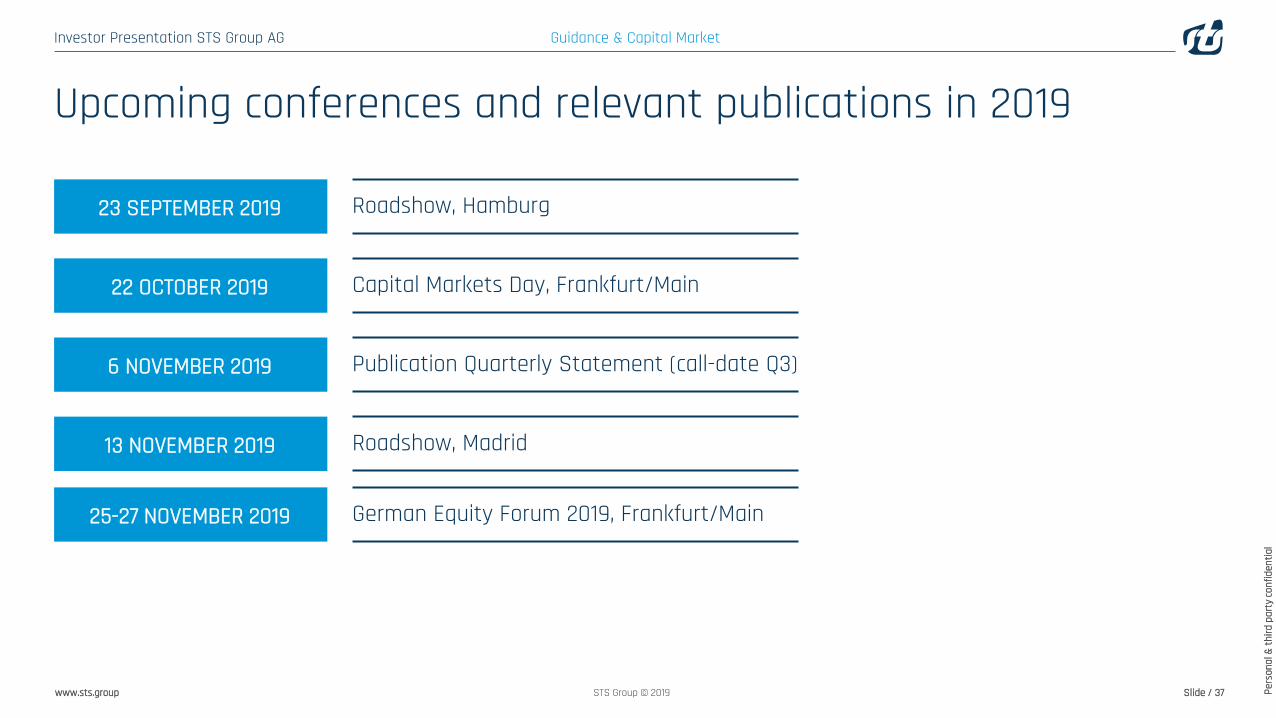
22 OCTOBER 2019 Capital Markets Day, Frankfurt/Main
6 NOVEMBER 2019 Publication Quarterly Statement (call-date Q3)
13 NOVEMBER 2019 Roadshow, Madrid
23 SEPTEMBER 2019 Roadshow, Hamburg
Upcoming conferences and relevant publications in 2019
25-27 NOVEMBER 2019 German Equity Forum 2019, Frankfurt/Main
Investor Presentation STS Group AG
Pers
onal
& th
ird p
arty
conf
iden
tial
www.sts.group Slide / 38STS Group © 2019
DisclaimerThis presentation may contain forward-looking statements that are subject to risks and uncertainties, including those pertaining to the anticipated benefitsto be realized from the proposals described herein. Forward-looking statements may include, in particular, statements about future events, future financialperformance, plans, strategies, expectations, prospects, competitive environment, regulation and supply and demand. STS Group AG has based theseforward-looking statements on its current views and expectations and on certain assumptions of which many are beyond STS Group AG’s control. Actualfinancial performance could differ materially from that projected in forward-looking statements due to the inherent uncertainty of estimates, forecasts andprojections, and financial performance may be better or worse than anticipated. Given these uncertainties, readers should not put undue reliance on anyforward-looking statements. The information contained in this presentation is subject to change without notice and STS Group AG does not undertake anyduty to update the forward-looking statements, and the estimates and assumptions associated with them, except to the extent required by applicable lawsand regulations.
This presentation includes references to non-IFRS financial measures, including, but not limited to: FOCF, EBITDA, Adjusted EBITDA, EBITDA Margin, AdjustedEBITDA Margin, EBIT, EBIT margin, capital expenditure as percentage of revenue, other operating income, net financial debt, and net working capital. We haveprovided these measures and other information in this presentation because we believe they provide investors with additional information to assess ourperformance. Our use of these supplemental financial measures may vary from others in our industry and should not be considered in isolation or as analternative to our results as reported under IFRS.
Due to rounding, numbers presented throughout this and other documents may not add up precisely to the totals provided and percentages may notprecisely reflect the absolute figures.
Investor Presentation STS Group AG
Pers
onal
& th
ird p
arty
conf
iden
tial
www.sts.group Slide / 39STS Group © 2019
Thank you for your attention!Contact us
Stefan HummelHead of Investor [email protected]+49 81 12 44 94 12


