25
Investor Presentation Third Quarter 2016

Investor Presentation
Third Quarter 2016
Safe Harbor Slide
Safe Harbor Statement
This presentation contains forward-looking statements that involve risks and uncertainties, including statements regarding
MobileIron's revenue and other GAAP and non-GAAP financial metrics for the company's third quarter in 2015 and other
statements regarding trends in the company's business, including statements regarding MobileIron's GAAP and non-GAAP
revenue and operating expense targets, growth in our customer base, increased customer adoption, and expected benefits
from new product offerings and MobileIron’s partner ecosystem. There are a significant number of factors that could cause
actual results to differ materially from statements made in this presentation, including MobileIron's limited operating history,
quarterly fluctuations in MobileIron's operating results, MobileIron's need to develop new solutions and enhancements to
compete in rapidly evolving markets, product defects, competitive pressures, customer adoption, changes by operating
system providers and mobile device manufacturers, MobileIron's inability to manage growth, the quality of MobileIron
support, MobileIron's reliance on channel partners and development of partner ecosystem.
Additional information on potential factors that could affect MobileIron's financial results is included in the company's SEC
filings, including its most recent Form 10-K and Form 10-Q. MobileIron does not assume any obligation to update the
forward-looking statements provided to reflect events that occur or circumstances that exist after the date on which they
were made.
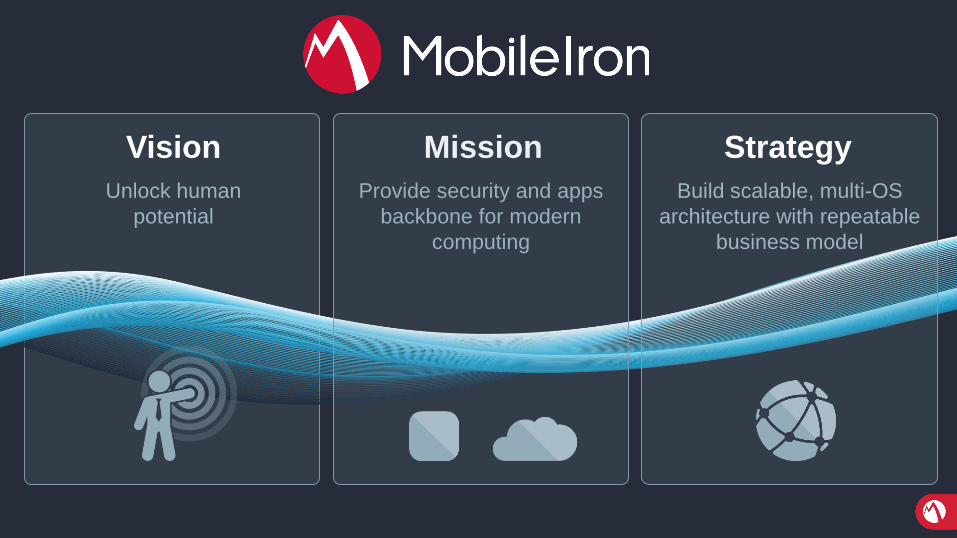
Vision
Unlock human
potential
Mission
Provide security and apps
backbone for modern
computing
Strategy
Build scalable, multi-OS
architecture with repeatable
business model

Large Secular Trend of Enterprise Security & Mobility
Leadership Positionin the Magic Quadrant
Rapidly Growing Base with over 10 million Cumulative
seats and 12,000 Cumulative
Customers since 2009
High Organic GrowthRecurring Revenue
Growth >30% YoY
Sales Leverage
& Reach through Global Channels
Strong ecosystem100+ OS, device, security,
cloud, network, apps ISVs
Accelerating
Business Modelwith Compelling
Economics & Path
to Profitability
Data as of fourth quarter 2015
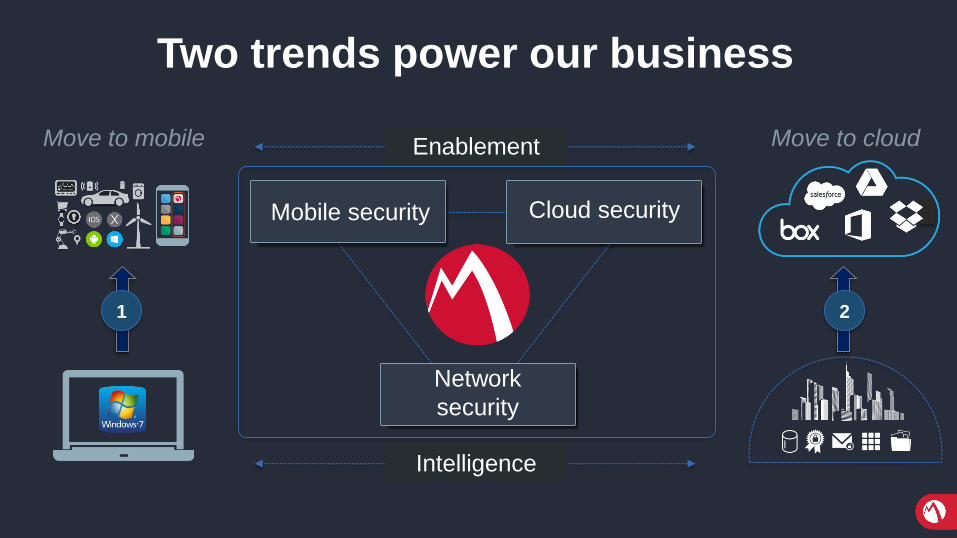
Enablement
Mobile security Cloud security
Network
security
Intelligence
1
Move to mobile
2
Move to cloud
Two trends power our business

Old: Perimeter Model
Enterprise Boundary Collapsing
System image
Anti-malware agentsPerimeter
Firewall
Device VPN
VDI
Mobile & Cloud Model
Salesforce Office365 Workday SAP Oracle
Concur Google Drive box Dropbox
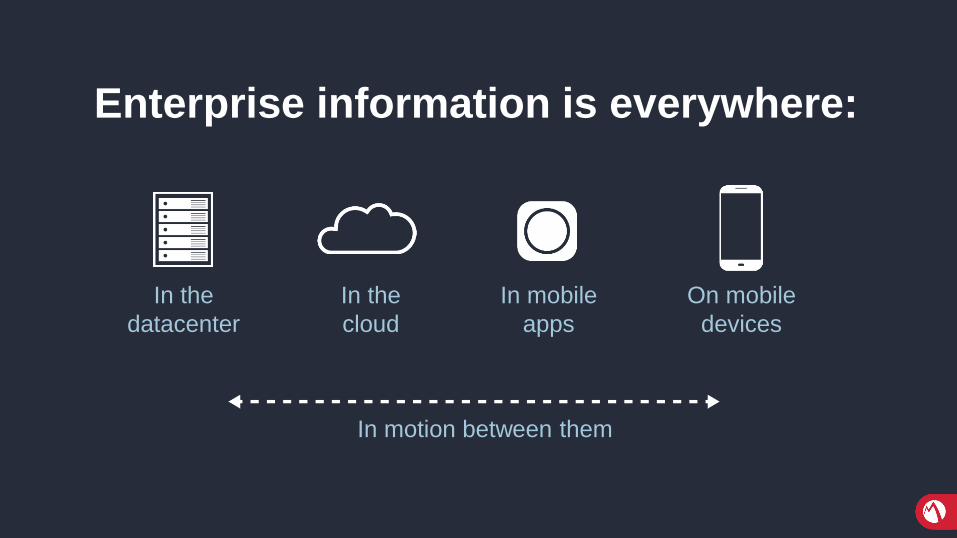
Enterprise information is everywhere:
In the
datacenter
In the
cloud
In mobile
apps
On mobile
devices
In motion between them
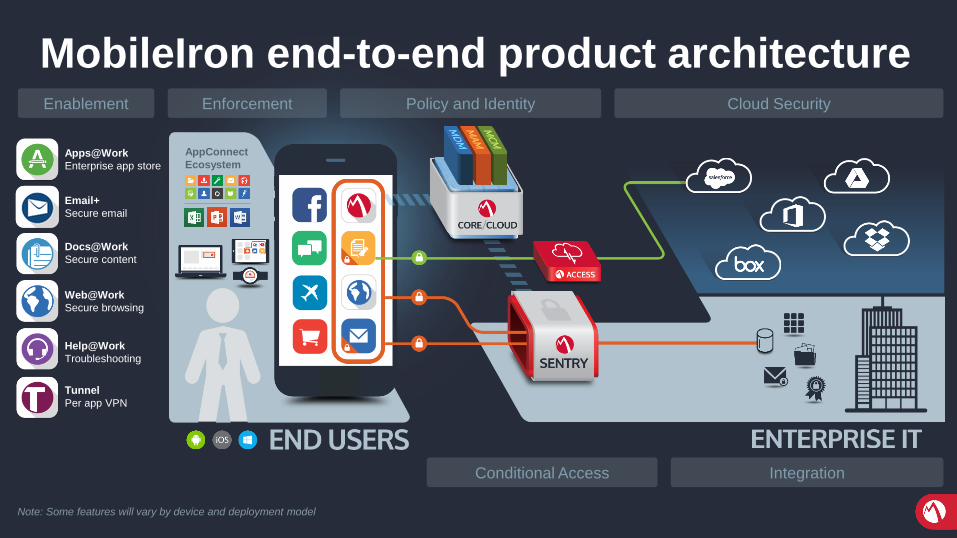
Apps@Work
Enterprise app store
Docs@Work
Secure content
Web@Work
Secure browsing
Help@Work
Troubleshooting
Tunnel
Per app VPN
Email+
Secure email
Note: Some features will vary by device and deployment model
AppConnect
Ecosystem
Conditional Access Integration
Policy and Identity Cloud SecurityEnablement Enforcement
MobileIron end-to-end product architecture
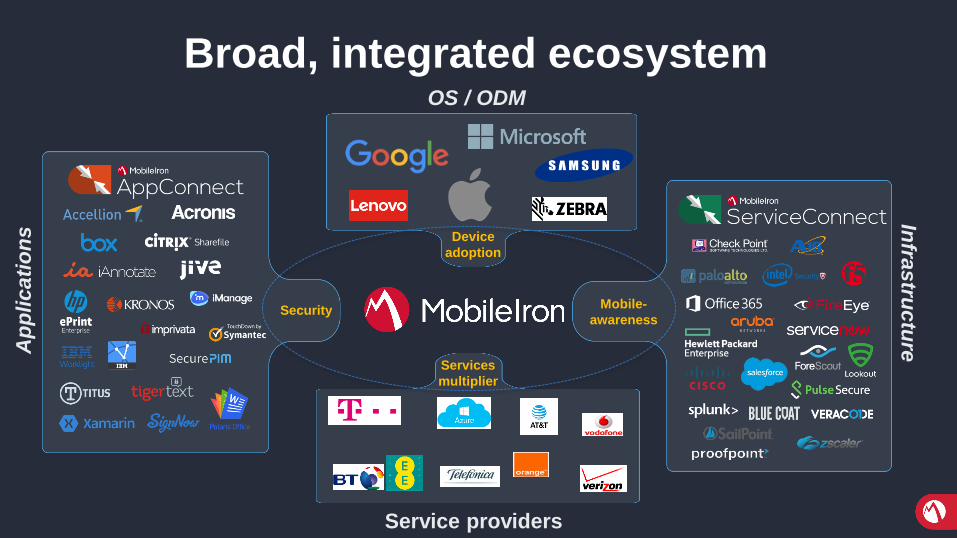
OS / ODM
Device
adoption
Service providers
Services
multiplier
Security
Ap
plica
tio
ns
Mobile-
awareness
Infra
stru
ctu
reBroad, integrated ecosystem
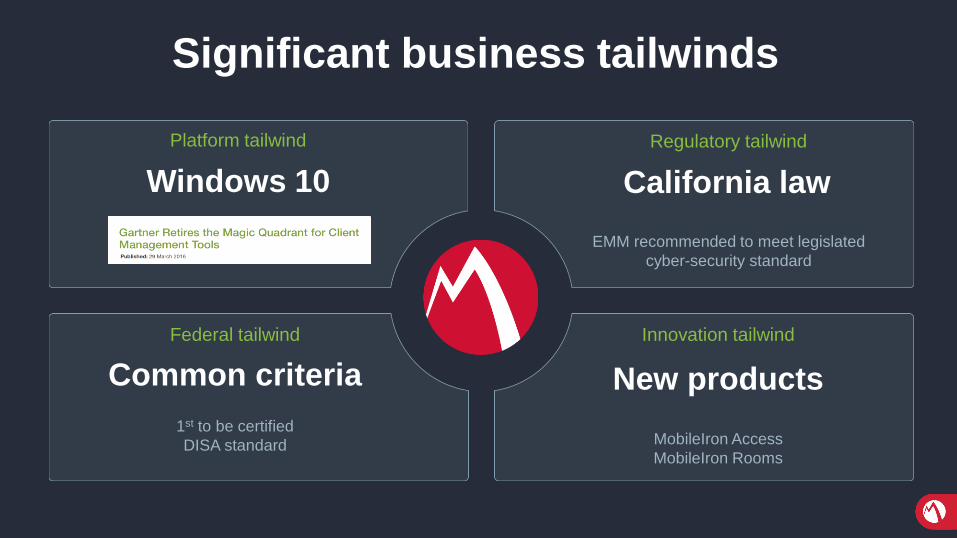
California law
EMM recommended to meet legislated
cyber-security standard
Regulatory tailwind
Common criteria
1st to be certified
DISA standard
Federal tailwind
Windows 10
Platform tailwind
New products
Innovation tailwind
MobileIron Access
MobileIron Rooms
Significant business tailwinds
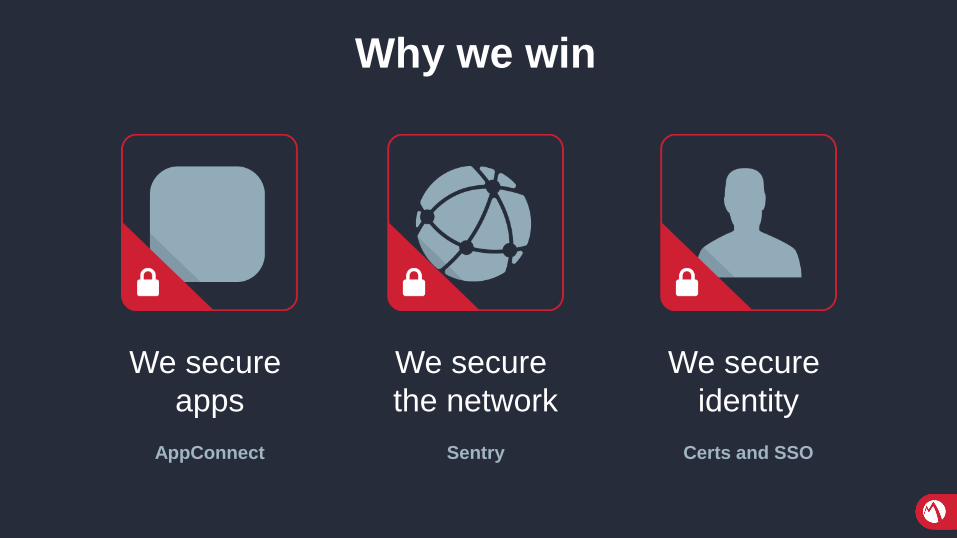
Why we win
We secure
apps
AppConnect
We secure
the network
Sentry
We secure
identity
Certs and SSO
Routes to market
Operators
VARs

Financial Overview
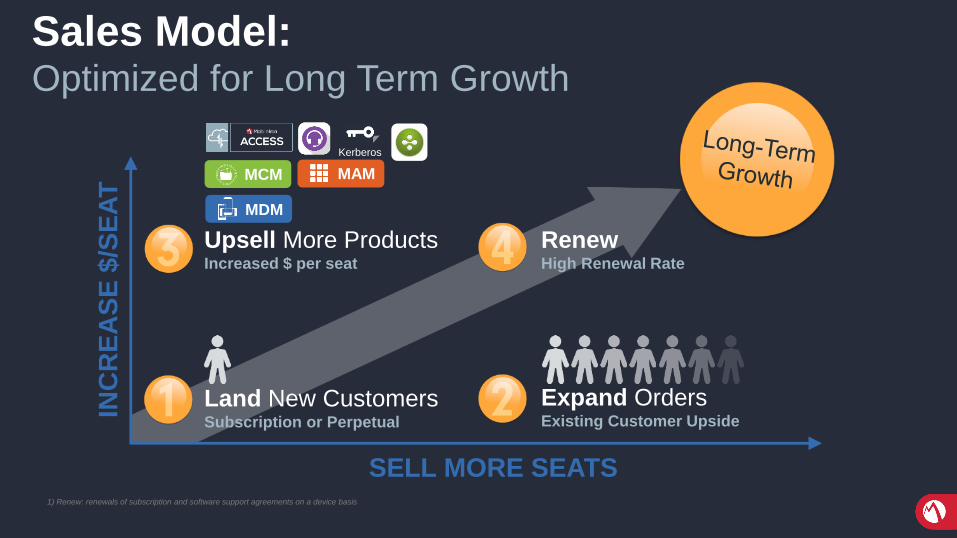
Sales Model: Optimized for Long Term Growth
SELL MORE SEATS
INC
RE
AS
E $
/SE
AT
1) Renew: renewals of subscription and software support agreements on a device basis
Upsell More ProductsIncreased $ per seat
Land New CustomersSubscription or Perpetual
Expand OrdersExisting Customer Upside
RenewHigh Renewal Rate
MCM MAM
MDM
Kerberos
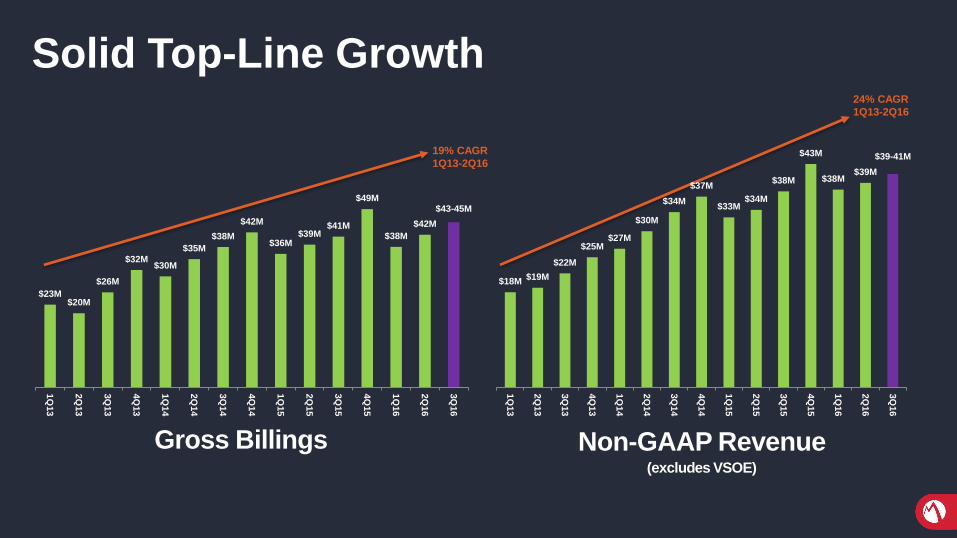
Solid Top-Line Growth
Non-GAAP Revenue(excludes VSOE)
Gross Billings
19% CAGR
1Q13-2Q16
24% CAGR
1Q13-2Q16
$18M$19M
$22M
$25M$27M
$30M
$34M
$37M
$33M$34M
$38M
$43M
$38M$39M
$39-41M
1Q
13
2Q
13
3Q
13
4Q
13
1Q
14
2Q
14
3Q
14
4Q
14
1Q
15
2Q
15
3Q
15
4Q
15
1Q
16
2Q
16
3Q
16
$23M$20M
$26M
$32M$30M
$35M
$38M
$42M
$36M$39M
$41M
$49M
$38M
$42M
$43-45M
1Q
13
2Q
13
3Q
13
4Q
13
1Q
14
2Q
14
3Q
14
4Q
14
1Q
15
2Q
15
3Q
15
4Q
15
1Q
16
2Q
16
3Q
16
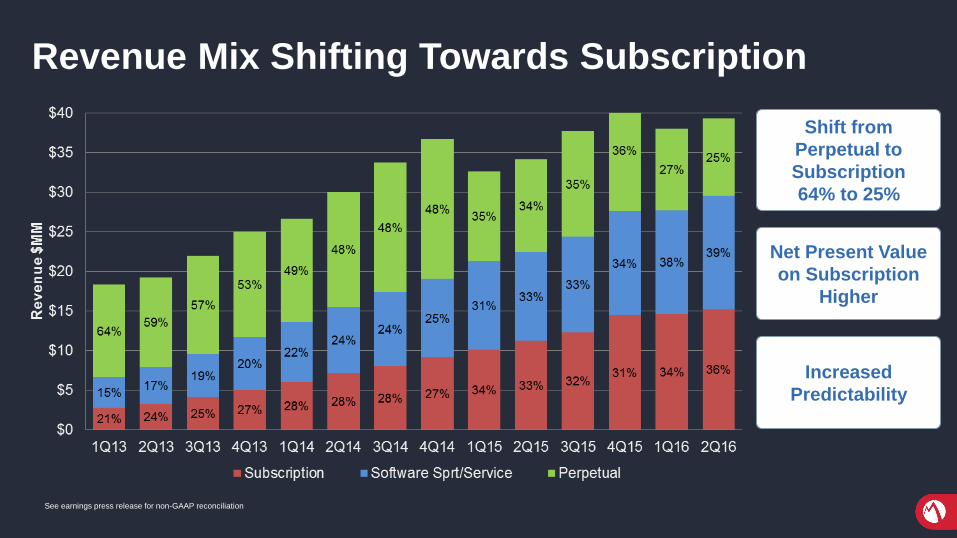
Revenue Mix Shifting Towards Subscription
See earnings press release for non-GAAP reconciliation
Shift from
Perpetual to
Subscription
64% to 25%
Net Present Value
on Subscription
Higher
Increased
Predictability
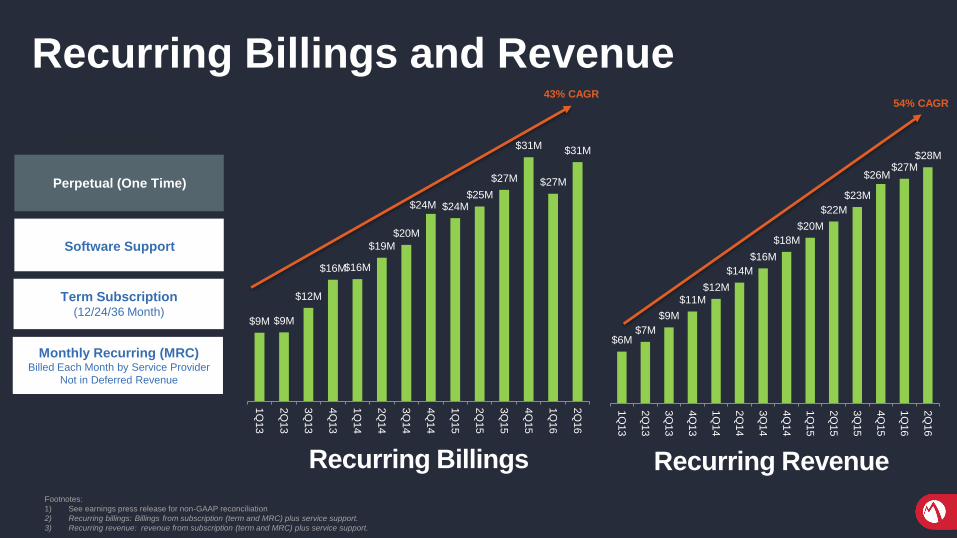
$6M$7M
$9M
$11M
$12M
$14M
$16M
$18M
$20M
$22M
$23M
$26M$27M
$28M
1Q
13
2Q
13
3Q
13
4Q
13
1Q
14
2Q
14
3Q
14
4Q
14
1Q
15
2Q
15
3Q
15
4Q
15
1Q
16
2Q
16
$9M $9M
$12M
$16M$16M
$19M
$20M
$24M $24M$25M
$27M
$31M
$27M
$31M
1Q
13
2Q
13
3Q
13
4Q
13
1Q
14
2Q
14
3Q
14
4Q
14
1Q
15
2Q
15
3Q
15
4Q
15
1Q
16
2Q
16
Recurring Billings and Revenue
Recurring Billings Recurring Revenue
Billings Model
Perpetual (One Time)
Software Support
Term Subscription(12/24/36 Month)
Monthly Recurring (MRC)Billed Each Month by Service Provider
Not in Deferred Revenue
Footnotes:
1) See earnings press release for non-GAAP reconciliation
2) Recurring billings: Billings from subscription (term and MRC) plus service support.
3) Recurring revenue: revenue from subscription (term and MRC) plus service support.
43% CAGR54% CAGR
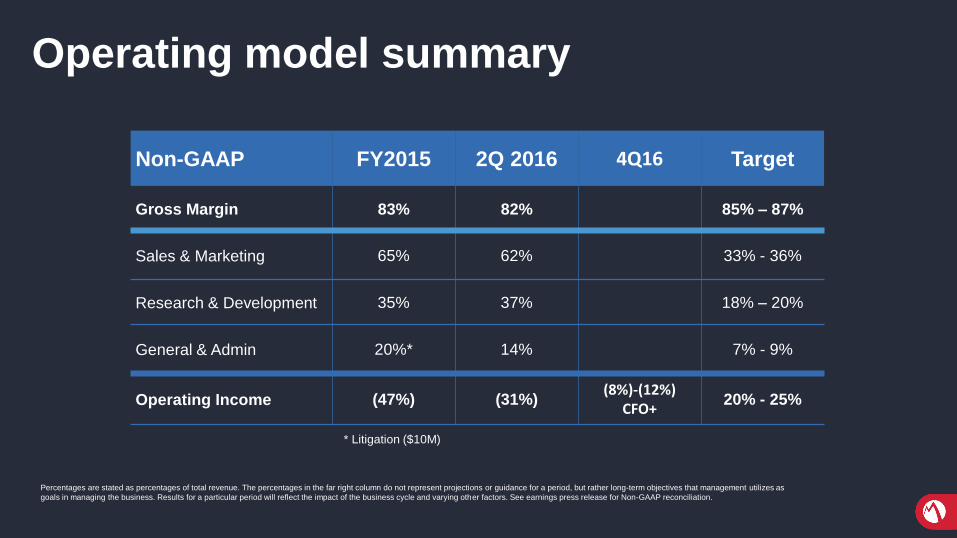
Operating model summary
Non-GAAP FY2015 2Q 2016 4Q16 Target
Gross Margin 83% 82% 85% – 87%
Sales & Marketing 65% 62% 33% - 36%
Research & Development 35% 37% 18% – 20%
General & Admin 20%* 14% 7% - 9%
Operating Income (47%) (31%)(8%)-(12%)
CFO+20% - 25%
Percentages are stated as percentages of total revenue. The percentages in the far right column do not represent projections or guidance for a period, but rather long-term objectives that management utilizes as
goals in managing the business. Results for a particular period will reflect the impact of the business cycle and varying other factors. See earnings press release for Non-GAAP reconciliation.
* Litigation ($10M)

MobileIron Confidential
Quarterly GAAP to
Non-GAAP Reconciliations
21 MobileIron ConfidentialMobileIron Confidential
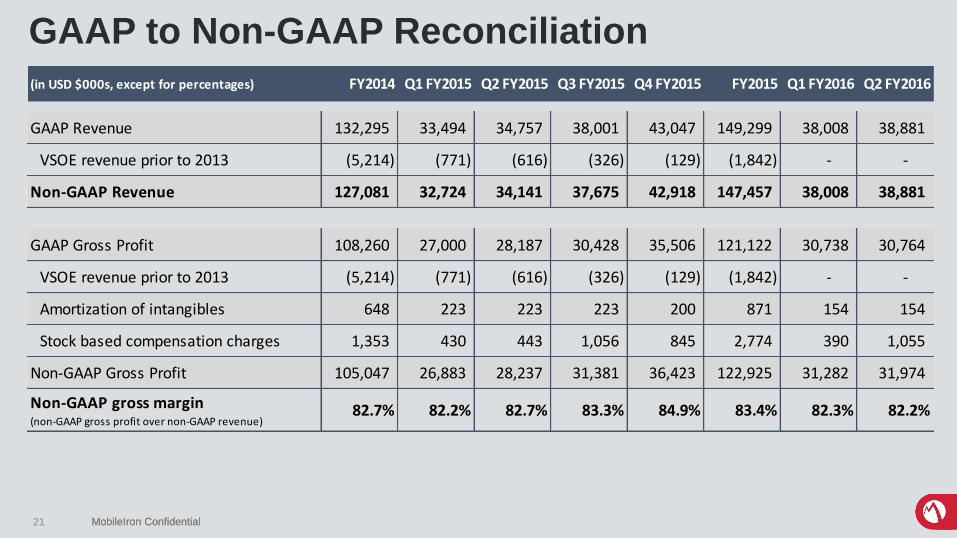
GAAP to Non-GAAP Reconciliation
(in USD $000s, except for percentages) FY2014 Q1 FY2015 Q2 FY2015 Q3 FY2015 Q4 FY2015 FY2015 Q1 FY2016 Q2 FY2016
GAAP Revenue 132,295 33,494 34,757 38,001 43,047 149,299 38,008 38,881
VSOE revenue prior to 2013 (5,214) (771) (616) (326) (129) (1,842) - -
Non-GAAP Revenue 127,081 32,724 34,141 37,675 42,918 147,457 38,008 38,881
GAAP Gross Profit 108,260 27,000 28,187 30,428 35,506 121,122 30,738 30,764
VSOE revenue prior to 2013 (5,214) (771) (616) (326) (129) (1,842) - -
Amortization of intangibles 648 223 223 223 200 871 154 154
Stock based compensation charges 1,353 430 443 1,056 845 2,774 390 1,055
Non-GAAP Gross Profit 105,047 26,883 28,237 31,381 36,423 122,925 31,282 31,974
Non-GAAP gross margin(non-GAAP gross profit over non-GAAP revenue)
82.7% 82.2% 82.7% 83.3% 84.9% 83.4% 82.3% 82.2%
22 MobileIron Confidential
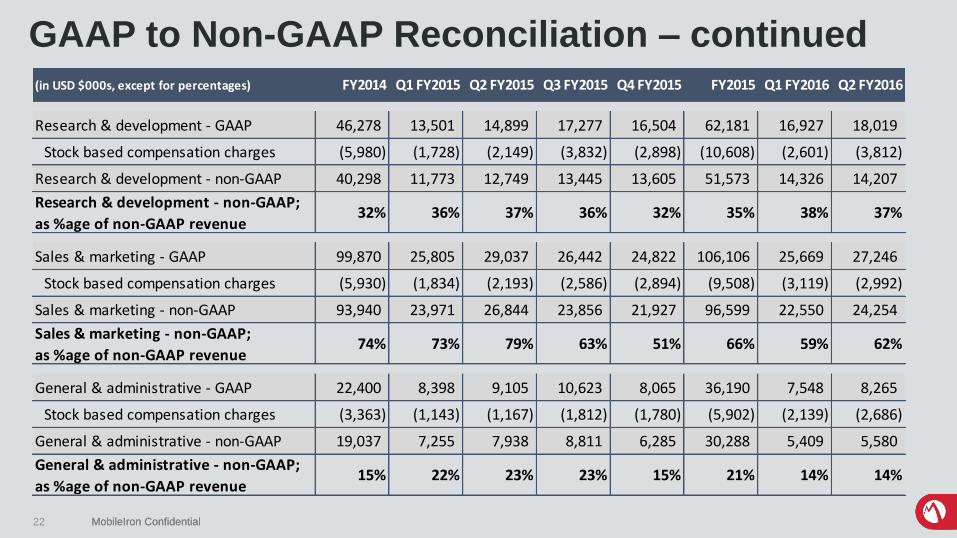
GAAP to Non-GAAP Reconciliation – continued
MobileIron Confidential
(in USD $000s, except for percentages) FY2014 Q1 FY2015 Q2 FY2015 Q3 FY2015 Q4 FY2015 FY2015 Q1 FY2016 Q2 FY2016
Research & development - GAAP 46,278 13,501 14,899 17,277 16,504 62,181 16,927 18,019
Stock based compensation charges (5,980) (1,728) (2,149) (3,832) (2,898) (10,608) (2,601) (3,812)
Research & development - non-GAAP 40,298 11,773 12,749 13,445 13,605 51,573 14,326 14,207
Research & development - non-GAAP;
as %age of non-GAAP revenue32% 36% 37% 36% 32% 35% 38% 37%
Sales & marketing - GAAP 99,870 25,805 29,037 26,442 24,822 106,106 25,669 27,246
Stock based compensation charges (5,930) (1,834) (2,193) (2,586) (2,894) (9,508) (3,119) (2,992)
Sales & marketing - non-GAAP 93,940 23,971 26,844 23,856 21,927 96,599 22,550 24,254
Sales & marketing - non-GAAP;
as %age of non-GAAP revenue74% 73% 79% 63% 51% 66% 59% 62%
General & administrative - GAAP 22,400 8,398 9,105 10,623 8,065 36,190 7,548 8,265
Stock based compensation charges (3,363) (1,143) (1,167) (1,812) (1,780) (5,902) (2,139) (2,686)
General & administrative - non-GAAP 19,037 7,255 7,938 8,811 6,285 30,288 5,409 5,580
General & administrative - non-GAAP;
as %age of non-GAAP revenue15% 22% 23% 23% 15% 21% 14% 14%
23 MobileIron ConfidentialMobileIron Confidential
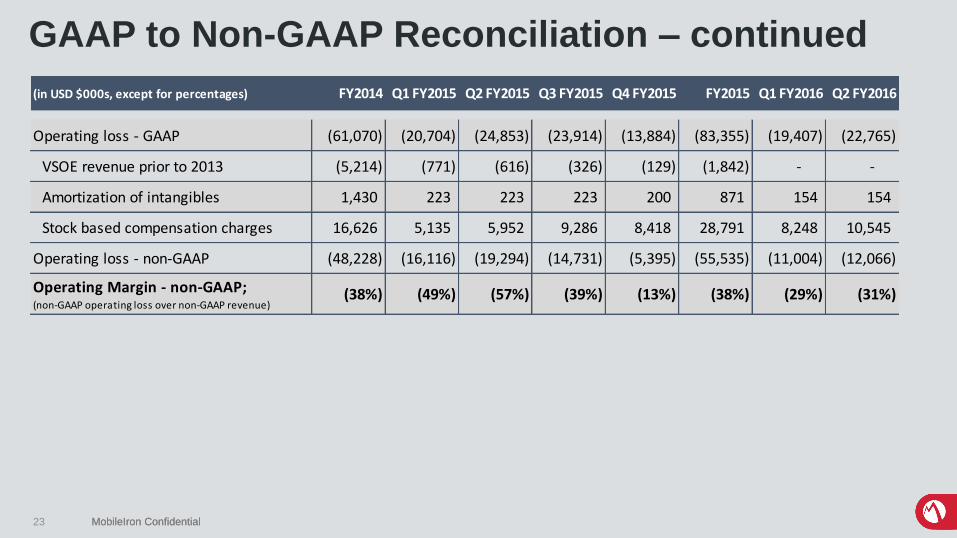
GAAP to Non-GAAP Reconciliation – continued
(in USD $000s, except for percentages) FY2014 Q1 FY2015 Q2 FY2015 Q3 FY2015 Q4 FY2015 FY2015 Q1 FY2016 Q2 FY2016
Operating loss - GAAP (61,070) (20,704) (24,853) (23,914) (13,884) (83,355) (19,407) (22,765)
VSOE revenue prior to 2013 (5,214) (771) (616) (326) (129) (1,842) - -
Amortization of intangibles 1,430 223 223 223 200 871 154 154
Stock based compensation charges 16,626 5,135 5,952 9,286 8,418 28,791 8,248 10,545
Operating loss - non-GAAP (48,228) (16,116) (19,294) (14,731) (5,395) (55,535) (11,004) (12,066)
Operating Margin - non-GAAP;(non-GAAP operating loss over non-GAAP revenue)
(38%) (49%) (57%) (39%) (13%) (38%) (29%) (31%)
24 MobileIron ConfidentialMobileIron Confidential
GAAP to Non-GAAP Reconciliation
Explanation of Non-GAAP Measures
To supplement our financial results presented on a GAAP basis, we use the non-GAAP measures indicated in the tables, which exclude stock-based compensation, the
amortization of intangible assets, and perpetual revenue recognized from licenses delivered prior to 2013, that we believe are helpful in understanding our past financial
performance and our future results. Our non-GAAP financial measures are not meant to be considered in isolation or as a substitute for comparable GAAP measures and
should be read only in conjunction with our consolidated financial statements prepared in accordance with GAAP. Our management regularly uses our supplemental non-
GAAP financial measures internally to understand, manage and evaluate our business and make operating decisions. These non-GAAP measures are among the primary
factors management uses in planning for and forecasting future periods. Compensation of our executives is based in part on the performance of our business based on
these non-GAAP measures. Our non-GAAP financial measures reflect adjustments based on the following items:
Perpetual license revenue recognized from licenses delivered prior to 2013 We have excluded the effect of perpetual license revenue recognized from licenses delivered
prior to 2013 from revenue gross profit, gross margin, operating loss, and operating margin. Because we had not established vendor specific objective evidence, or VSOE,
of fair value of software support and services prior to January 1, 2013, we recognized perpetual license revenue ratably over the term of the related software support
agreement. Upon establishing VSOE on January 1, 2013, we began to recognize perpetual license revenue upon delivery assuming all other revenue recognition criteria
are met. As a result, our perpetual license revenue includes amounts related to licenses delivered in previous years. Revenue from these perpetual licenses delivered prior
to 2013 has declined over each quarter since the quarter ended March 31, 2013 and will continue to decline sequentially until it is fully amortized. We evaluate our
business performance excluding revenue from these perpetual licenses delivered prior to 2013 as we believe that the inclusion of this revenue makes it difficult to compare
periods and understand growth in our business.
Stock-based compensation expenses: We have excluded the effect of stock-based compensation expenses from our non-GAAP cost of revenue, operating expenses and
net income measures. Although stock-based compensation is a key incentive offered to our employees, and we believe such compensation contributed to the revenues
earned during the periods presented and also believe it will contribute to the generation of future period revenues, we continue to evaluate our business performance
excluding stock-based compensation expenses. Stock-based compensation expenses will recur in future periods.
Amortization of intangible assets: We have excluded the effect of amortization of intangible assets from our non-GAAP cost of revenue, operating expenses and net
income measures. Amortization of intangible assets is inconsistent in amount and frequency and is significantly affected by the timing and size of our acquisitions.
Investors should note that the use of intangible assets contributed to our revenues earned during the periods presented and will contribute to our future period revenues as
well. Amortization of intangible assets will recur in future periods.