1 INVESTOR PROTECTION REGULATION AND INFORMATION IN CAPITAL MARKETS CHRISTOPHER VON KOCH SVEN-OLOF YRJÖ COLLIN MICAEL JÖNSSON OLA NILSSON School of Business and Economics Linnæus University SE-351 95 Växjö Sweden Tel: + 46 772 28 80 00 Fax: +46 470 832 17
Transcript
1
INVESTOR PROTECTION REGULATION AND INFORMATION IN CAPITAL MARKETS
CHRISTOPHER VON KOCH
SVEN-OLOF YRJÖ COLLIN
MICAEL JÖNSSON
OLA NILSSON
School of Business and Economics
Linnæus University
SE-351 95 Växjö
Sweden
Tel: + 46 772 28 80 00
Fax: +46 470 832 17
2
INVESTOR PROTECTION REGULATION AND INFORMATION IN
CAPITAL MARKETS
ABSTRACT
An investor regulation hypothesis has been suggested by La Porta et al (1998), and a huge
literature following them, claiming that investor protection regulation influence capital
markets. We propose a development of this hypothesis through 1). applying a more advanced
measurement of investor protection regulation and 2.) using a model that creates proxies of
which information the financial analysts are using and the character of this information. We
test the hypothesis on a sample of 13788 observations, from 25 countries, covering the period
from 1995 to 2005. We conclude that A.) the hypothesis concerning information usage cannot
be rejected, i.e., regulation influences the information environment actors in their usage of
information in a curvilinear way, which we explain using the leverage hypothesis, that with
low levels of regulation, improvement in common information can be used in order to
improve the interpretation of private information; B.) the hypothesis concerning information
quality has to be falsified, i.e., regulation does not appear to influence the quality of
information.
KEY WORDS: Investor protection regulation, capital market, information, financial analysts
3
1. Introduction
Investor protection activities and regulations influence the informational environment for
analysts and investors, as well as influencing incentives of information gathering and usage.
In this paper we argue that the level of investor protection influence how financial analysts are
including information in their products, i.e., their predictions, and it influence the precision of
the information they use. We test this idea on a sample of financial analysts from 18 different
countries that have experienced different levels of investor protection. We use an index of
investor protection, SPI, which is a more advanced index that those commonly used. The
information usage variables are proxies, derived from a recently created model, termed the
BKLS model.
We join the huge literature concerning the investor protection thesis. It was initiated by
La Porta, Lopez-de-Silanes, Shleifer and Vishny (1998) [hencefort LLSV], claiming that the
function and structure of capital markets are correlated to investor protection through
legislation and its basis in legal origin. While the common way of observing the investor
protection regulation environment is to observe legal family origin, we concur the opinion
that the legal origin family concept is too broad and eventually also misleading (Armour,
Deakin, Mollica & Siems, 2009). Instead, we will use a Shareholder Protection Index (SPI)
that makes it possible to observe the regulative environment in more detail, using more factors
of regulation, with higher variance in coding and over several years, thus being able to
observe the dynamics of regulation.
One consequence of investor protection regulation can be observed through studying the
financial analysts and their actions. Financial analysts can be treated as sophisticated users of
accounting information (see Schipper, 1991; Revsine, 2004), a means to reduce information
asymmetry between the corporation and the investors (Krshnaswami and Subramaniam, 1999)
and a mean of creating new information. Financial analysts can be considered to be both
producers of information and informational intermediaries in the capital market. They can be
assumed to be influenced by factors of the informational environment belonging to the
market. Thus, one mean of exploring the investor protection thesis is to observe financial
analysts and their work.
Traditionally, financial analysts are studied through the outcome of their work, i.e., their
predictions. We will use a recent conceptual development that makes it possible to observe
through proxies how the analysts are using information from the information environment.
Barron, Kim, Lim and Stevens (1998) developed a model where proxies using data about
4
financial analysts and their predictions could indicate the relative amount of common and
private information used, and the precision of private and common information. Thus, we will
get proxies of analyst’s usage of information.
We will therefore explore the investor protection thesis through deriving hypotheses
based on arguments concerning how the institutional environment, observed as SPI, influence
the information environment and how the financial analyst is dealing with this environment in
terms of usage of common and private information in its forecast activities. By using this
approach we can get indications on whether results showing more accurate earnings forecast
in strong investor protection countries could be explained by A.) higher quality of the
information, both public and private as well as total and/or B.) access to more public
(common) than private information in these countries
The hypotheses will be tested on a sample of observations from 25 countries from the
period of 1995 to 2010.
The result indicates that on low levels of investor protection, common information is
used to improve the understanding of private information, thus increasing the relative part of
private information in financial analyst’s outcomes. With increasing levels of regulation, this
leverage effect of common information on private information appears to vanish and the
increase in regulation will induce improvement of common information which will imply
relatively more common information used by the analysts. Thus, a curvilinear relationship
between investor regulation and information usage of common information. The precision of
information do not appear to be correlated with investor regulation. We reach two
conclusions. The investor regulation hypothesis concerning information usage cannot be
rejected, i.e., regulation influences the information environment actors in their usage of
information. The investor regulation hypothesis concerning information quality has to be
falsified, i.e., regulation does not appear to influence the quality of information.
Our contribution is that we indicate through empirical testing that regulation appears to
influence information usage but not information precision. We advance the empirical
repertoire by using a shareholder index (Armour, Deakin, Mollica & Siems, 2009), which is
more advanced than the traditional in use, and we apply the model of information
environment suggested by Barron, Kim, Lim and Stevens (1998). And finally, we propose, in
line with development by Kim & Verrecchia (1997) and Barron, Byard & Kim (2002), a
leverage hypothesis which suggest the complimentarily of common and private information
during certain conditions.
5
The paper continues with a review of studies concerning the investor protection thesis
and with our derivation of hypotheses. The method follows, where we present the variables
and the sample, and present SPI in more detail and the measurements of private and common
information. The analyses present our results from the 25 country study. The paper ends with
conclusions and limitations.
2. Theory 2.1 Theoretical perspective
The paper is joining the large literature concerning the investor protection thesis. It was
initiated by La Porta, Lopez-de-Silanes, Shleifer and Vishny (1998) [hencefort LLSV],
claiming that the function and structure of capital markets are correlated to investor protection
through legislation and its basis in legal origin. The literature has hitherto suggested a
differentiation of countries based on their legal origin family. Recently, attention has been
directed on one part of the capital market and its functional logic, that of financial analysts’
performance and/or the importance of the analyst. An important reason for relating investor
protection and financial analysts is the role investor protection is assumed to play in shaping
the informational environment of the market. In this context, financial analysts are treated as
sophisticated users of accounting information (see Schipper, 1991; Revsine, 2004) and a
means to reduce information asymmetry between the corporation and the investors
(Krshnaswami and Subramaniam, 1999). To put it simply, financial analysts are considered to
be informational intermediaries in the capital market, and can be assumed to be influenced by
factors that influence the informational environment belonging to the market. Thus, financial
analysts and their work can be included in the investor protection thesis.
Studies have found correlation between investor protection, observed as legal proxies
mainly LLSV, and performance of analysts (c.f. Chang et al., 2000; Ashbaugh and Pincus,
2001; Hope, 2003a, 2003b; Barniv et al., 2005; Barniv and Myring, 2006; DeFond and Hung,
2007; Sun, 2009). Financial analysts are dependent on the informational environment, which
is presumably influenced by investor protection, for example it has been claimed that strong
investor protection could be an important determinant of high-quality financial statements and
greater financial transparency (Ball et al., 2000; Bushman et al., 2004; Daske et al., 2008;
Francis and Wang, 2008; La Porta, Lopez-de-Silanes, Shleifer, & Vishny, 1998, 2000, 2006;
Leuz et al., 2003; Nabar & Boonlert-U-Thai, 2007). Reported earnings could be more useful
to analysts in stronger rather than weaker investor protection environment (e.g., Alford et al.,
6
2003; Ali et al., 2003; Ball et al., 2000; Hung, 2000; Leuz et al., 2003; Hail and Leuz, 2006).
Earnings predictions will be more easy to make accurate because of more extensive use of
accrual-basis accounting (matching principle) and⁄or reduced earnings management (Leuz et
al., 2003; Sun, 2009). A ideal representation of the LLSV version of the investor protection
thesis is Chang et al. (2000), that found analysts’ forecasts more accurate and forecast
dispersion lower in common-law countries due to common-law countries is assumed to have
more effective corporate governance mechanisms, including stronger investor protection laws.
Another indicator of the relationship is the substitution effect, where strengthened investor
protection makes analysts’ services less valuable to investors, thus leading to a reduction in
the number of analysts (Knyazeva, 2007; Sun, 2009).
The legal origin version of the investor protection thesis has been complemented by the
compliance thesis, stating that compliance with rules and regulations should reduce analysts’
uncertainty about financial reports and, in turn, make the task of forecasting earnings
relatively easier (Bhat et al.,2006).
Recently, the legal origin version of the investor protection thesis has been called into
question. It is claimed that legal origin is a much too general and partly misleading concept of
Research Programme at the Centre for Business Research, University of Cambridge, UK (see
Armour et al. 2009, Lele and Siems 2007) has created Shareholder Protection Indexes (SPI).
This represent an empirical development, including more specific observations, more factors,
more fine grained coding, and with observations over several years. They find that investor
protection regulation is dynamic, i.e., it is changing over time, and that it is not correlated
with the general ‘legal origin’-variable. Some empirical studies indicate that the assumed
correlations between SPI and market characteristics do not exist.
The development of the investor protection thesis through SPI represents an empirical
development. What SPI offer us is a more advanced empirical proxy of investor protection,
thus making the evaluation of the investor protection thesis more rigorous.
Our contention is that the quantity and the quality of information produced in an
economic environment is influenced by both formal and informal institutions, influencing the
level of investor protection. The formal institutions are the regulations through legal tradition
and legislation (La Porta, Lopez-de-Silanes, Shleifer & Vishny, 1998), self-imposed codes,
such as corporate governance codes (Bhat, Hope & Kang, 2006) and financial accounting
regulations such as IFRS (Barth, Landsman & Lang, 2008; Byard, Li & Yu, 2011; Preiato,
Brown & Tarca, 2012). These formal institutions can be assumed to mainly influence the
7
quality and quantity of disclosed information from the corporation. The informal institutions
will presumably influence both the disclosed and the private information available in the
environment. It has been found that informal institutions such as ownership structure (Baik,
Kang & Morton, 2010; Dargenidou, McLeay & Raonic, 2007; Haw, Ho, Hu & Wu, 2010),
culture (Hope, 2003a), legal enforcement (Byard, Li & Yu, 2011; Hope, 2003b), usage of the
dominant audit firms (Fan & Wong, 2005) and other corporate governance mechanisms, such
as committee independence (Bhat, Hope & Kang, 2006) influence the information
environment and thereby influence the financial analysts and the outcome of the financial
analysts activities.
The institutions influence upon financial analysts has been observed through the
outcome of their work, i.e.., their predictions measured as forecast accuracy, standard
deviation of forecasts and forecast bias. Overall, it has been assumed that increased investor
protection will increase the quality of the financial analyst’s service, and decrease the demand
of their service. Recently an development have occurred where the forecast data from analysts
are being used in order to create proxies of how analysts use private and common information
in their forecasts (Barron, Kim, Lim & Stevens, 1998; Barron, Byard & Kim, 2002; Barron,
Byard & Yu, 2008) [hencefort BKLS]. This represent an advancement, even if it is a proxy,
since we then come closer to an understanding of how the investor protection institutional
environment influence the information environment and how the analyst is reacting on this
change in its collection and usage of information.
The BKLS approach has been shown to be a useful tool to examine analyst information
environment during very different circumstances. It has been used when studying IFRS
(Byard et al., 2011, Kim & Shi, 2012), earnings surprise (Barron et al., 2008), corporate
disclosure (Byard and Shaw, 2003), intangible assets (Barron et al., 2002) and others (Barrron
et al., 1999; Botosan and Harris, 2000; Botosan et al., 2004; Botosan and Plumlee, 2007;
Liang, 2003; Venkataraman, 2000).
We will therefore explore the investor protection thesis through deriving hypotheses
based on arguments concerning how the institutional environment, observed as SPI, influence
the information environment and how the financial analyst is dealing with this environment in
terms of usage of common and private information in its forecast activities.
8
2.2 Hypotheses derivation
We will here argue for two hypotheses creating certain relationships between investor
protection and analyst’s usage of common information and private information, and the
precision of the two kinds of information.
2.2.1 Investor protection and relative amount of private information used by analysts
Institutional milieus where investor protection is low are characterized by high informational
uncertainty, weak regulation and weak enforcement. In these milieus financial analysts are not
mainly intermediaries of information, implying that they transform information through
interpreting common information supplied by the corporations. They can be assumed to create
their own channels of information in order to be more sure about the quality of the
information (Kim & Shi, 2012). In this environment, financial analysts are more of
information providers than financial intermediaries (Lang and Lundholm, 1996). Thus, we
believe that at lower levels of investor protection environment, the share of private
information used by the analysts are rather high.
With increasing level of investor protection, the information submitted from the
corporation increase in quality, making it more reliable. This will induce more effort to
interpret the common information, thus reducing the relative amount of private information in
the predictions. We therefore believe that with increasing levels of investor protection, the
relative use of common information will rise.
This would give a positive correlation between investor protection and usage of
common information. There are, however, two other factors that can change this positive
correlation. One is the hypothesis of leverage of common information on private information.
Kim & Verrecchia (1997) and Barron, Byard & Kim (2002) has claimed that private and
common information could be complements, where common information can be used in order
to leverage private information. With increasing trust and reliability of common information,
the private information can be more reliably interpreted, and thus be included in the forecast.
At present stage of theoretical development, it is unclear if the leverage will be most
influential on low levels of investor protection, or on high levels. Thus, the leverage thesis
will create a curvilinear relationship, but the shape of it is still unclear.
There is also the competitive hypothesis, claiming that at a certain level, the reliability
and amount of common information is so large that analysts cannot create a competitive
advantage by relaying mainly on interpreting common information. The negative correlation
that has been found between investor protection and number of analysts (Knyazeva, 2007;
9
Sun, 2009) is an indication of the relevance of the competitive hypothesis. This hypothesis
will reduce the positive slope of the relationship. But as with the leverage hypothesis, we do
not have a developed theory that can create a prediction when this effect will start, thus the
influence on the relationship is uncertain.
We therefore hypothesise:
H1. There will be a positive correlation (curvilinear correlation) between investor protection
and analyst’s relative usage of common information
2.2 Investor protection and precision in private and common information
The reliability and the quantity of information can be assumed to come with an increase in
investor protection regulations. Thus, the precision of common information, supplied by the
corporations, will increase with an increase in investor protection. Since financial analyst can
be assumed to be financial information intermediaries, especially on higher levels of investor
protection, they will improve in their service during increase in SPI. This implies that the
precision of their information will improve. For example, it has been found that the
implementation of IFRS, which presumably implies both higher quality and larger quantity of
information (Leuz & Wysocki, 2008), has had the effect of more precise private and common
information (Byard et al., 2011, Kim & Shi, 2012). With reference to the leverage hypothesis,
as suggested by Kim & Verrecchia (1997) and Barron, Byard & Kim (2002), where private
information will be improved by improvement of common information, it could be predicted
that private information will increase at least as much in precision as common information.
Indeed, private information and its precision could be expected to improve even more due to
higher competition among financial analysts, when investor protection increases due to lower
demand of their products. To put it simple, the competitive advantage will be based on private
information, not common information.
We therefore hypothesise:
H2. There will be a positive correlation between SPI and precision of common and private
information
3. Study Design
We will here present how we observe the dependent variables of common and private
information through the BKLS-model. We then present the independent variable, the SPI-
10
index and how it has been calculated. Then we present our control variables and describe our
sample and analytical methods.
3.1 Calculation of Analyst Information Environment Variables
The BKLS approach is based on the assumption that there are N financial analysts issuing
earnings forecasts for a firm and that the forecast is based on a mix of common and private
information. The common information is information all analysts have available and private
information is the individual analyst’s available information beyond this.
3.1.1 Measure the quality of information
The quality of information is referred to the inverse of the variance, i.e. the precision of the
information. The logic behind BKLS way of measuring the quality is that forecast dispersion
and the error in the mean forecast are functions of the quality of public information, the
quality of private information, and the number of analysts. By reversing these functions it is
possible to infer public and private information quality dispersion, error in the mean forecast,
and the number of forecasts and this will make it possible to assess the quality of public and
private information by following equations:
, ,
h = the quality (precision) of public information s = the quality (precision) of private information SE = the expected squared error in the mean forecast D = the expected sample variance (or dispersion) in forecasts N = the number of forecasts In the models is the quality of common information denoted as h and the quality of the private
as s. There is also an opportunity to measure the quality of total information by these two
equations. This is made by summarize h and s.
3.1.2 Measure the mix of information
The BKLS approach also reveals a way of measuring the mix of public and private
information used. This is a measure relevant when analysing if and how the information
environment differs or changes. The logic behind this is based on the idea that forecast error
11
relates in different ways to common and uniquely private information of error in individual
analysts´ forecasts. Common information is obtained or inferred from official firm and
management disclosure while private information is obtained by analysts’ own information
gathering and processing. Barron et al. (2008) argue that the incremental usefulness of an
individual analyst forecast to investors is not determined simple by the amount of new private
information it supply but rather the amount of new private information it supply relative to the
amount of information supplied by all forecasts. Therefore the usefulness of each individual
analyst´s forecast is the proportion of private relative to total information. The BKLS can,
under certain assumptions, express this relation (p) in terms of observable characteristics of
analysts´ forecasts:
(1)
Where:
N = the number of forecasts;
D = the dispersion in analyst´s forecast, which is the sample variance of the analysts´
Individual forecasts (Fi) around the mean forecast
SE = the squared error in the mean forecast, calculated as the difference between the mean forecast (F) and the actual earnings (A), squared, i.e., (A-F)2
V = BKLS Uncertainty, the average squared error in individual forecasts, is measured as the mean squared difference between analysts´ individual forecast (Fi) and actual reporting
earnings (A), i.e. /N
Under certain assumption the BKLS Consensus (p) holds. The first necessary
assumption is that forecasts are unbiased, on average. Otherwise, a systemic bias in analyst
forecasts will artificially inflate common error in forecasts (Barron et al., 2008). Thus making
it appear as if analyst forecast contains more common – relative to total – information. The
other assumption is there is no earning management to meet or beat the mean forecast. Such
earning management will deflate the common error in forecasts, making it appear as if
analyst´ forecast contains less common – relative to total – information. Earlier research using
BKLS model show that these two assumption hold.
12
3.2 SPI (Shareholder Protection Index)
When it comes to studies focusing on the impact of investor protection, however, we
find both a need and a possibility for improvement. One common denominator in most of
earlier studies is the use of either the “Legal Enforcement” or the antidirector rights (LLSV)
index from La Porta et al. (1998) as a proxy for the level of investor protection in a given
country. In some instances this is also the basis for categorizing countries into strong investor
protection countries or weak investor protection countries.
Compared with previous, more well-known investor protection indexes such as the
Legal Enforcement and the LLSV, the SPI makes it possible to do time-series analyses of
investor protection and thereby study investor protection changes in a more structured manner
than before. The index was developed by the Corporate Governance Research Programme at
the Centre for Business Research, University of Cambridge, UK (see Armour et al., 2009,
Lele and Siems, 2007). Investor protection variables are chosen and defined in a way that
aims to remedy several shortcomings of the LLSV. The differences concern notably the
sources of the SPI. Armour et al. (2009) include not only positive law, but also rules
stemming from self-regulation, such as corporate governance and takeover codes, where they
are binding for (listed) companies. The SPI also differs from the LLSV in that it is not based
on binary variables, but allows for intermediary scores between 0 and 1 where appropriate.
Moreover, the SPI, unlike the LLSV, is sensitive to “default rules” in the sense of rules that
apply in certain circumstances depending on the involved actors’ choices. Such laws,
although not strictly binding, are not necessarily coded 0. The index also explicitly
acknowledges the importance of coding for functionally equivalent instruments in different
countries. Finally, the SPI is constructed as a longitudinal measure for quantifying the legal
SPI of a given country for each year. (For details see Armour et al., 2009:8ff and Lele and
Siems, 2007.)
3.3 Control variables
In this study we use five control variables selected on the basis of prior research showing that
particular factors influence the accuracy of analysts’ forecasts (Lang and Lundholm, 1996).
These variables are: market value (MV), trading volume (VOL), earnings surprise
(SURPRISE), loss (LOSS), and standard deviation of return on equity (STDROE).
MV: Market value is measured as the company’s market value at the beginning of the
fiscal year. Size should reflect information availability and therefore be positively
13
related to forecast accuracy. Brennan and Hughes (1991) found empirical evidence
of an association between firm size and the number of analysts following a firm, and
Lang and Lundholm (1993) found that firm size and performance variability are
likely correlated with disclosure policy.
VOL: Trading volume. Trading volume refers to the company’s daily trading volume in
the first month of the fiscal year. It is also a control for size because it could be more
relevant than market value to the number of analysts following a firm (analysts often
get paid indirectly through the trading activity.)
N: Number of analysts. It is the number of analysts following the company and providing
annual earnings forecasts.
SURPRISE: Earnings surprise. It is the variation in a firm’s results from one year to
another and is calculated as the absolute value of the year’s earnings per share,
minus the previous year’s earnings per share, scaled by the share price at the
beginning of the fiscal year. According to Lang and Lundholm (1996), earnings
surprise controls for the fact that forecast characteristics are likely to be affected by
major events such as a firm's introduction of a new product. In such circumstances
realized earnings are most apt to deviate from expected earnings, and there are likely
to be significant revisions in analysts’ forecasts.
LOSS: It is a dummy variable that takes the value 1 if the company reported a loss and 0
otherwise. Hope (2003a) suggests that earnings per share are much harder to predict
for firms with negative earnings.
STDROE: Standard deviation of return on equity, which is measured as the company’s
return on equity over the previous three years. King et al. (1990) found that the
number of analysts following a firm is likely to be positively correlated with return
because it is easier to predict future earnings for firms that are performing well.
3.4 Sample and Descriptive Statistics
Corporate Governance Research Programme at the Centre for Business Research, University
of Cambridge has calculated investor protection (SPI) indices of 10 indicators to code for a
wider sample (25 countries) for the period 1995-2005. Therefore we use this time period and
these countries in our sample. The forecast data for analysts were obtained from the
Institutional Brokers' Estimate System (I/B/E/S) database. Analysts, however, make forecasts
for only some of the firms listed on these 25 countries stock exchanges. Our sample includes
14
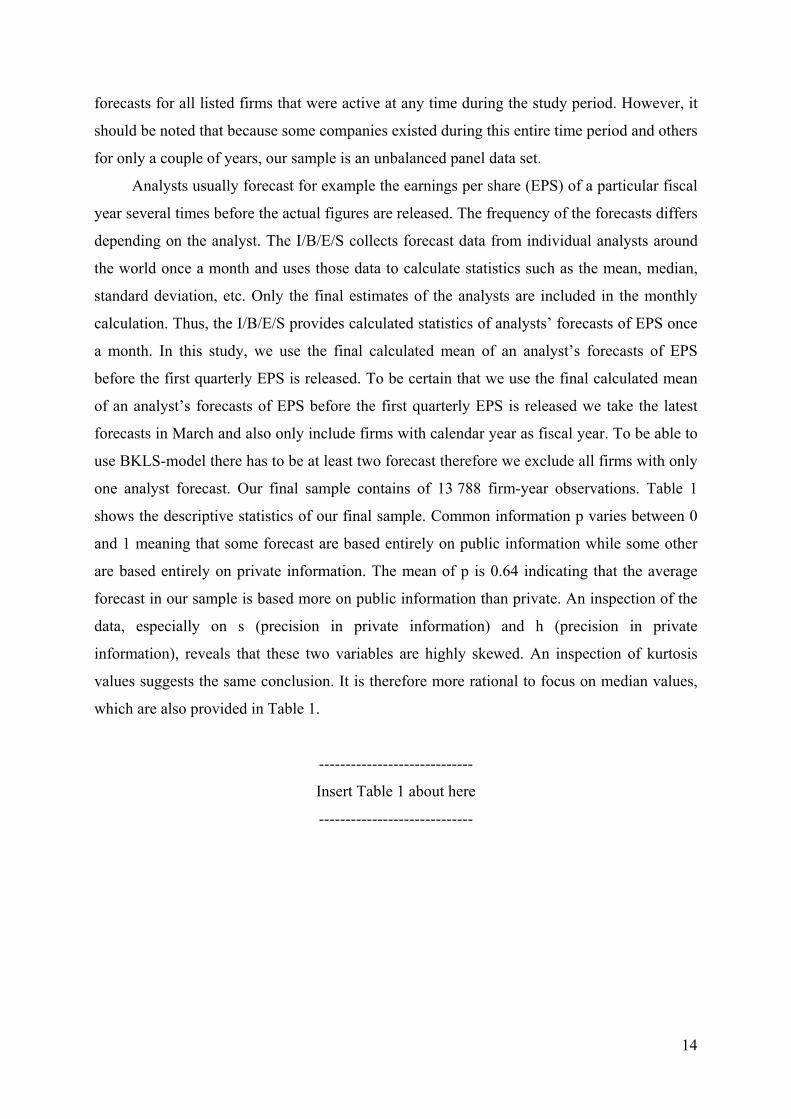
forecasts for all listed firms that were active at any time during the study period. However, it
should be noted that because some companies existed during this entire time period and others
for only a couple of years, our sample is an unbalanced panel data set.
Analysts usually forecast for example the earnings per share (EPS) of a particular fiscal
year several times before the actual figures are released. The frequency of the forecasts differs
depending on the analyst. The I/B/E/S collects forecast data from individual analysts around
the world once a month and uses those data to calculate statistics such as the mean, median,
standard deviation, etc. Only the final estimates of the analysts are included in the monthly
calculation. Thus, the I/B/E/S provides calculated statistics of analysts’ forecasts of EPS once
a month. In this study, we use the final calculated mean of an analyst’s forecasts of EPS
before the first quarterly EPS is released. To be certain that we use the final calculated mean
of an analyst’s forecasts of EPS before the first quarterly EPS is released we take the latest
forecasts in March and also only include firms with calendar year as fiscal year. To be able to
use BKLS-model there has to be at least two forecast therefore we exclude all firms with only
one analyst forecast. Our final sample contains of 13 788 firm-year observations. Table 1
shows the descriptive statistics of our final sample. Common information p varies between 0
and 1 meaning that some forecast are based entirely on public information while some other
are based entirely on private information. The mean of p is 0.64 indicating that the average
forecast in our sample is based more on public information than private. An inspection of the
data, especially on s (precision in private information) and h (precision in private
information), reveals that these two variables are highly skewed. An inspection of kurtosis
values suggests the same conclusion. It is therefore more rational to focus on median values,
which are also provided in Table 1.
-----------------------------
Insert Table 1 about here
-----------------------------
15
3.5 Models and estimation techniques
The models we will estimate are the following:
Model 1:
ititanalystsofumberititit
itititPIitPIitQ
εββββ
ββββαθ+++++
++++=
NROE dev Stdsurprise EarningssProfit/Los
volumeTradingueMarket valS2S1)s h, p,(
8765
432
Model 2:
ititanalystsofumberititit
itititPIitQ
εββββ
βββαθ+++++
+++=
N7ROE dev Std6surprise Earnings5sProfit/Los4
volumeTrading3ueMarket val2S1)s h, p,(
Model 1 tests our hypotheses 1. There will be a positive correlation (curvilinear correlation)
between investor protection and analyst’s relative usage of common information and Model 2
is used to test our second hypotheses: H2. There will be a positive correlation between SPI
and precision of common and private information. Each of the models is tested on our three
dependent variables p, s and h.
Because of the skewness in our dependent variables, ordinary least squares (OLS)
regression models, fixed and random effects models, and other regression models yielding
estimates that predict the conditional mean of the dependent variable risk the obtainment of
biased estimation results. We therefore use a median regression model, the quantile regression
estimation technique (Koenker and Baset, 1978). This is a regression model that does not
produce estimates that predict the mean, which makes it robust against our type of problem.
Another benefit of median regression models is their lack of sensitivity to outliers, which
allows for the use of all observations in estimations. The quantile regression model is a
technique for estimating the θth quantile (i.e., percentile) of a variable (in this case, the
dependent variables p, s and h), conditional on the values of the predictor variables. This
method allows us to estimate the effect of the variable SPI in various percentiles of the
distribution of the variables p, s and h, not only at their respective means. In other words,
quantile regression enables us to estimate the effect of a changing SPI on the size of θth
quantile forecast errors and dispersions while mitigating the effects of skewness produced by
the many smaller forecast errors and dispersions. In this study, we estimate quantile
regression models predicting the 25th, 50th (i.e., the median) and 75th percentile for the full
sample. Thus, when predicting the 25th percentile, we study the effect of SPI on only the
largest p, s and h. In addition to statistical arguments, theoretical arguments justify the use of
16
this procedure. Small forecast errors and small forecast dispersions are likely to be random
and independent of poor-quality financial reporting. Hence, one could argue that whatever
steps are taken to introduce improvements, it is most likely not possible to eliminate small
errors.
4. Empirical results
4.1 Univariate results
Table 2 shows the correlations between the variables. Investor protection (SPI) correlates
positively with share of common information (p) and negatively with the precision of private
information (s) with the both correlations significant at the 0.001 level, while there exist no
significant correlation between SPI and the precision of public information (h). These results
indicate that strengthen investor protection increase the relative amount of public information
in analysts` forecast whiles the precision in analyst private information decline. Surprisingly,
there is no positive correlation between SPI and h as excepted. The control variables correlate
as expected with h and s. The precision in both private (s) and public information (h) increase
with size as measured as market value (MV) and trading volume (VO). Size should reflect
information availability and therefore be positively related to precision. As expected both s
and h are also positively correlated to the number of analysts (N). The precision naturally
increase with the number of analyst following. Also, as expected, s and h correlates negatively
and highly significantly with the volatility in profitability (STDROE), unprofitable firms
(LOSS) and firms with high variations in earnings (SURPRISE). For example, it is much
more difficult for an analyst to forecast future performance of loss making firms and firms
with high variations in EPS. Also the control variables correlate mainly as expected in relation
to p. The size variables correlate negatively with p indicating that analyst increase the private
information contents when forecasting larger firms due to higher competition among analysts
for these firms. On the other hand, when there is more uncertainty (volatility in profitability,
unprofitable firms and high variations in earnings) results in a positive correlation with p
meaning that then analyst rely more on public information.
-----------------------------
Insert Table 2 about here
-----------------------------
17
4.2 Multivariate test
We run two set of different regressions – one to test Model 1 (with squared SPI) and one to
test Model 2 (without squared SPI). Model 1 tests our hypotheses 1. There will be a positive
correlation (curvilinear correlation) between investor protection and analyst’s relative usage
of common information and Model 2 is used to test our second hypotheses: H2. There will be
a positive correlation between SPI and precision of common and private information. Each of
the models is tested on our three dependent variables p, s and h. We also run regressions on
h+s as dependent variable.
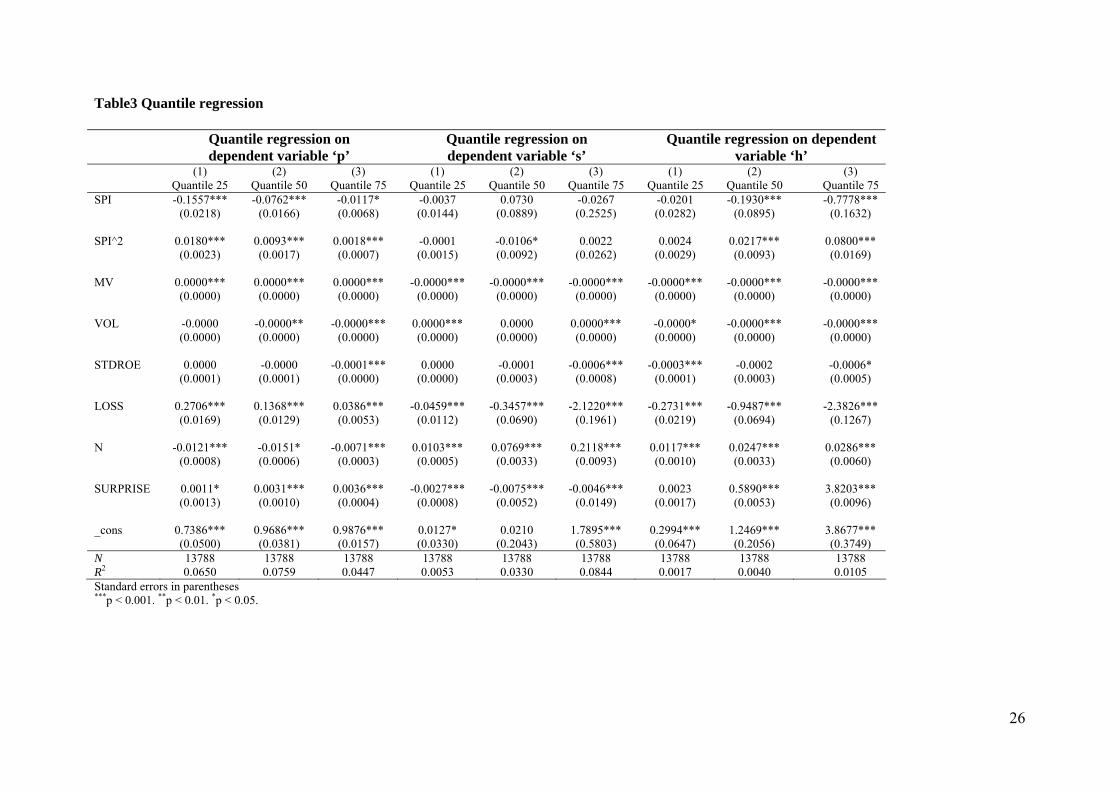
Due to lack of space we only show the regressions results from Model 1 in Table 3.
First we note the low explanatory power when predicting the 25th percentile as well as the 50th
percentile and the 75th percentile (Pseudo R2 from 0.002-0.08). Further, the coefficients for
SPI in Table 3 are significant with p as the dependent variable and shifting signs with squared
SPI indicating a curvilinear correlation. This could be interpreted as at some stage, strengthen
investor protection makes analysts moves from relative more private information towards
relative more public information used in their forecasts. These results support our first
hypotheses that there will be a positive correlation (curvilinear correlation) between investor
protection and analyst’s relative usage of common information. The control variables in the
regression with dependent variable p indicate that when analysts forecasts firms with higher
market value (MV), unprofitable firm (LOSS) and firms with earnings surprises (SURPRISE)
they use relative more public information. On the other hand when analysts forecasts firms
with high trading volume (VO) they use relative more private information and when there is
more competition among analysts, more analysts following a firm (N), relative more private
information is used.
-----------------------------
Insert Table 3 about here
-----------------------------
Moving to the regressions with s (the precision of private information) we find no
significance with either SPI or squared SPI, indicating that investor protection doesn’t affect
the precision of private information contrary to our hypotheses 2. Also hypotheses 2 predicted
a positive relation between SPI and h (precision of common information) is not supported
from the results shown in Table 3 in the regressions with h as dependent variable. However,
there is some indication that it might be a curvilinear relationship between investor protection
and the precision of common information since the coefficients move from negative to
18
positive with squared SPI. Notably in the control variables in the regressions with s and h as
dependent variables is that the number of analyst has an important impact on both the
precision of private as well as common information.
5. Conclusions
Our contention was that the information environment is influenced by level of investor
protection and that it will influence financial analysts work as providers and intermediaries of
information. We hypothesized that with increasing shareholder protection; the relative amount
of common information used by analysts will increase, or be related in a non-linear fashion.
We also hypothesized that the precision of information will increase. We used a rather new
index of shareholder protection (SPI), being superior to the traditional indexes since it is more
detailed, using more factors of regulation, with higher variance in coding and over several
years. From the model by Barron, Kim, Lim and Stevens (1998) we created the proxies of
information use and precision. Our model was tested on a sample of 13788 observations from
25 countries during 10 years.
We find support for our first hypothesis of the relative increase of common information
with increase in investor protection. However, our squared SPI-term indicated that the
positive correlation is dominating on the higher levels of investor protection. On the low
levels there appear to be a slight negative correlation. The optimum, where the differential
coefficient reach zero, is 8.65 for quantile 25% and 6.50 for quantile 75%. This supports the
leverage hypothesis we derived from Kim & Verrecchia (1997) and Barron, Byard & Kim
(2002), claiming that on certain levels of protection, there is a leverage of common
information on private information. It appears that improvement in information environment
can be used in order to improve the quality of the private information and increase its relative
usage. Since the curve reaches a bottom and then increase, it could be the case that leverage of
common information on private information will be less with improvement of information
environment. Our conclusion is that the investor regulation hypothesis concerning information
usage cannot be rejected, i.e., regulation influences the information environment actors in
their usage of information.
Precision of private and common information was not correlated with investor
protection. Only when using a squared SPI-term, we found a slight U-formed correlation
between SPI and precision of common information. The level of significance was, however,
of the magnitude that it has probably no economic significance. This would lend the
19
conclusion that precision of information is independent on investor protection regulation.
Other factors influence the precision. Thus, our conclusion is that the investor regulation
hypothesis concerning information quality has to be falsified, i.e., regulation does not
influence the quality of information.
These conclusions have to be tempered due to severe limitations in our study. As
indicated, the dependent variables are based on a model that assume that forecasts are
unbiased, on average, and that there is no earnings management to meet or beat the mean
forecast. It could be the case, especially for the second assumption, that this assumption is not
met, especially in the mid range of the SPI index, i.e., that earnings management is of no
importance at very low levels of regulation, since there is no trust at all in the financial
accounting, and at very high levels of regulation, as indeed has been found. Earnings
management could be most influential at the mid range of regulation.
Another limitation in our test, as well as in other studies, is the inherent complexity in
the investor protection thesis. Due to the perspective of coevolution (Armour, Deakin, Mollica
& Siems, 2009) it can be claimed that there is a mutual influence of formal and informal
institutions, with the effect that legal regulation is partly an endogenous variable, and not, as
we have treated it, an exogenous factor.
We have used a non-traditional measurement of investor protection regulation, and it
could be claimed that our non-significant results are due to this index. Our contention is the
opposite. This index represents an improvement compared to the traditional indexes, as
indeed some recent studies have showed (Armour et al., 2009). The limitation of this index is
that it has been constructed only to 2005, thus we have no opportunity to study the effect of
IFRS as implemented regulation.
The final limitation is the question of timing. When does regulation create the
information environment that influences the analysts? Is it momentarily, as we have assumed
in this study since we do not lag our variables, or is it with a time lag, and if so, with what
time lag? Here we can only use an empirical, inductive approach, using an arbitrary lag in
order to look for significance, since we do not have a good theory making predictions about
time lags. Since SPI is a dynamic index, capable of observing changes, we realize that certain
environments, during certain times, change considerable, while others change very slowly. It
could be the case that, independently of actual level of regulation, rapid changes of regulation
creates so much uncertainty, that the actors of the information environment acts differently
compared to environments with low level of regulative change.
20
Our main contention is that the development of SPI and of BKLS makes it possible for
us to challenge old interpretations of results and old conceptions of the capital markets and
their functions, thereby advancing a more solid knowledge of capital markets. Our paper is
but a small contribution in this exploration.
21
REFERENCES
Alford, A., Jones, J., Leftwich, R., & Zmijewski, M. (1993). The relative informativeness of accounting disclosures in different countries. Journal of Accounting Research, Vol. 31 (Supplement):, 183-223.
Ali, A., Hwang, L., & Trombley, M. (2003). Residual-income-based valuation predicts future stock returns: Evidence on mispricing vs. risk explanations. The Accounting Review, Vol. 78(No.2), 377-97.
Armour, J. J., Deakin, S. S., Mollica, V. V., & Siems, M. M. (2009). Law and Financial Development: What We Are Learning from Time-Series Evidence. Brigham Young University Law Review, (6), 1435-1500.
Ashbaugh, H., & Pincus, M. (2001). Domestic accounting standards, international accounting standards,and the predictability of earnings. Journal of Accounting Research, Vol. 39( No. 3), 417-434.
Baik, B., Kang, J.K. & Morton, R. (2010) Why are analysts less likely to follow firms with high managerial ownership?,Journal of Accounting, Auditing & Finance, 25(2):171-200
Ball, R., Kothari, S., & Robin, A. (2000). “The effect of international institutional factors on properties of accounting earnings. Journal of Accounting and Economics, Vol. 29, 1-51.
Barniv, R., & Myring, M. (2006). An international analysis of historical and forecasted earnings in accounting-based valuation models. Journal of Business Finance and Accounting, Vol. 33: , 1087-1109.
Barniv, R., Myring, M., & Thomas, W. (2005). The Association between the Legal and Financial Reporting Environments and Forecast Performance of Individual Analysts. Contemporary Accounting Research, Vol. 22(No. 4), pp 727-758.
Barron, O. E., Byard, D. & Kim, O. (2002). Changes in analysts’ information around earnings announcements. The Accounting Review , 77:821-846.
Barron, O. E., Byard, D. & Yu, Y. (2008) Earnings surprises that motivate analysts to reduce average forecast error, The Accounting Review, 83(2): 303-325
Barron, O. E., Kim, O., Lim, S. & Stevens, D. (1998) Using analysts’ forecasts to measure properties of analysts’ information environments. The Accounting Review 73:421-433.
Barron, O., Kile, C., & O’Keefe., T. (1999). MD&A quality as measured by the SEC. Contemporary Accounting Research(16), 75–110.
Barth, M. E., Landsman, W. R. and Lang, M. H. (2008), International accounting standards and accounting quality, Journal of Accounting Research 46:467-498.
Bhat, G., Hope, O., & Kang, T. (2006, Dec). Does corporate governance transparency affect the accuracy of analyst forecasts? Accounting & Finance, Vol. 46(Issue 5,), p715-732.
Bhat, G., Hope, O.-K. & Kang, T. (2006) Does corporate governance transparency affect the accuracy of analyst forecasts?, Accounting and Finance, 46: 715-732
Botosan, C., & Harris, M. (2000). The cross-sectional determinants of disclosure timeliness: An examination of quarterly segment disclosure. Journal of Accounting Research(38), 524–554.
Botosan, C., & Plumlee, M. (2007). Are Information Attributes Priced. Working paper, The University of Utah.
22
Botosan, C., Plumlee, M., & Xie, Y. (2004). The role of information precision in determining the cost of equity capital. Review of Accounting Studies(9), 233-59.
Bushman, R., Piotroski, J., & Smith. (2004). What Determines Corporate Transparency? Journal of Accounting Research, Vol. 42, p207-252.
Byard, D., & Shaw, K. (u.d.). Corporate disclosure quality and properties of analysts’ information environment. Journal of Accounting, Auditing and Finance, 3(18), 355–378.
Byard, D., Li, Y. & Yu, Y. (2011) The effect of mandatory IFRS adoption on financial analysts’ information environment, Journal of Accounting Research, 49(1)69-96.
Chang, J., Khanna, T., & Palepu, K. (2000). Analyst Activity around the World. Harvard Business Strategy Unit, working paper, No 01-061 January.
Dargenidou, C., McLeay, S. & Raonic, I. (2007) Ownership, investor protection and earnings expectations, Journal of Business Finance & Accounting, 34(1): 247-268.
Daske, H., Hail, L., Leuz, C., & Verdi, R. (2008). Mandatory IFRS Reporting around the world: Early Evidence on the Economic Consequnces. Journal of Accounting Research, 5(46), 1085-1142.
DeFond, M., Hung, M., & Trezevant, R. (2007). “Investor protection and the information content of annual earnings announcements: International evidence. Journal of Accounting and Economics, 43 (1), 37-67.
Fan, J. & Wong, T. J. (2005) Do External Auditors Perform a Corporate Governance Role in Emerging Markets? Evidence from East Asia. Journal of Accounting Research 43(March): 35–72.
Francis, J., & Wang, D. (2008). The joint effect of investor protection and big 4 audits on earnings quality around the world. Contemporary Accounting Research, 25((1)), 1–39.
Hail, L., & Leuz, C. (2006). International differences in the cost of equity capital: Do legal institutions and securities regulation matter? Journal of Accounting Research , 44 (3), 485-531.
Haw, I.-M., Ho, S. S. M., Hu, B. & Wu, W. (2010) Analysts’ forecast properties, concentrated ownership and legal institutions, Journal of Accounting, Auditing & Finance,25(2):235-259.
Hope, O. K. (2003a). Firm-level disclosures and the relative roles of culture and legal origin. Journal of International Financial Management and Accounting, 14, 218−248.
Hope, O. K. (2003b). Disclosure practices, enforcement of accounting standards, and analysts' forecast accuracy: An international study. Journal of Accounting Research, 41, 235−272.
Horton, J., Serafeim, G. and Serafeim, I. (2012), Does Mandatory IFRS Adoption Improve the Information Environment?. Contemporary Accounting Research. doi: 10.1111/j.1911-3846.2012.01159.x
Hung, M. (2000). Accounting standards and value relevance of earnings: An international analysis. Journal of Accounting and Economics, 30(3), 401-420.
Jeong-Bon, K., & Haina, S. (2012). Voluntary IFRS Adoption, Analyst Coverage, and Information Quality: International Evidence. Journal Of International Accounting Research, 11(1), 45-76. doi:10.2308/jiar-10216
23
Kim, J.-B., and H. Shi. (2012) Voluntary IFRS adoption, analyst coverage, and information quality:
Kim, O., & Verrecchia, R. (1997). Pre-announcement and event-period private information. Journal of Accounting and Economics, 3(24 ), 395-419.
Knyazeva, D. (2007). Corporate Governance, Analyst Following, and Firm Behavior. Working paper, New York University.
Koenker, R., & Basset, G. (1978). Regression quantiles. Econometrica(46), 33-50.
Krishnaswami, S., & Subramaniam, V. (1999). Information Asymmetry, Valuation, and the Corporate Spin-off Decision. Journal of Financial Economics, 53, 73–112.
La Porta, R., Lopez-de-Silanes, F., & Shleifer, A. (2006). What works in securities laws? Journal of Finance, 61(1), 1–32.
La Porta, R., Lopez-de-Silanes, F., Shleifer, A., & Vishny, R. (2000). Investor protection and corporate governance. Journal of Financial Economics, 58(1-2), 3–27.
La Porta, R., Lopez-de-Silanes, F., Shleifer, A., & Vishny, R. (Dec 1998). Law and finance. Journal of Political Economy, vol. 106,(Issue 6,), p1113-1155.
Lang, M. H., and R. J. Lundholm, (1993) Cross-Sectional Determinants of Analyst Ratings of Corporate Disclosures, Journal of Accounting Research, 31, 246-271.
Lang, M. H., and R. J. Lundholm, (1996) Corporate Disclosure Policy and Analyst Behavior. The Accounting Review, 71, 467–492.
Lele, P., and M. Siems, (2007) Shareholder protection: a leximetric approach, Journal of Corporate Law Studies, 7, 17-50.
Leuz, C., & Wysocki, P. (2008). Economic consequences of financial reporting and disclosure regulation: A review and suggestions for future research. Working paper, The University of Chicago and MIT Sloan School of Management.
Leuz, C., Nanda, D., & Wysocki, P. (2003). Investor protection and earnings management: an international comparison. Journal of Financial Economics, 69, 505–527.
Liang, L. (2003). Post-earnings announcement drift and market participants’ information processing biases. Review of Accounting Studies, 2/3(8), 321–345.
Nabar, S., & Boonlert-U-Thai, K. (2007). Earnings management, investor protection, and natural culture. Journal of International Accounting Research, 6(2), 35–54.
Preiato, J. P., Brown, P. R. & Tarca, A. (2012) Mandatory Adoption of IFRS and Analysts’ Forecasts: How Much Does Enforcement Matter? UNSW Australian School of Business Research Paper No. 2009 ACCT 01.
Revsine, L., Collins, D. W., & Johnson, W. B. (2004). Financial Reporting and Analysis, 2nd edn (Prentice Hall, Upper Saddle River, NJ).
Schipper, K. (1991). Analysts’ Forecasts. Accounting Horizons, 4(December), 105–121.
Sun, J. (2009). Governance Role of Analyst Coverage and Investor Protection. Financial Analysts Journal, 65(Number 6), 1-13.
Venkataraman, R. (2000). The Impact of SFAS 131 on Financial Analysts’ Information Environment. Working paper, The Pennsylvania State University.
24
Table 1. Descriptive statistics
Variable Obs Mean Median Std. Dev. Min Max p 13788 .64 .75 .326 0 1 s 13788 2.97 .45 7.210 0 317.70 h 13788 23.22 .93 823.919 0 69000 SPI 13788 5.46 5.75 1.645 1.5 7.375 MV 13788 28082.56 901.63 194927.8 .04 7799999 VOL 13788 96654.51 1980.00 3061678 0 275000000STDROE 13788 10.36 3.64 87.720 .1 8141.32 LOSS 13788 .15 0.00 .359 0 1 N 13788 9.98 8.00 7.642 2 49 SURPRISE 13788 .37 0.03 4.661 0 457.76