15
Investor Relations 2Q 2016 0
Investor Relations 2Q 2016
0
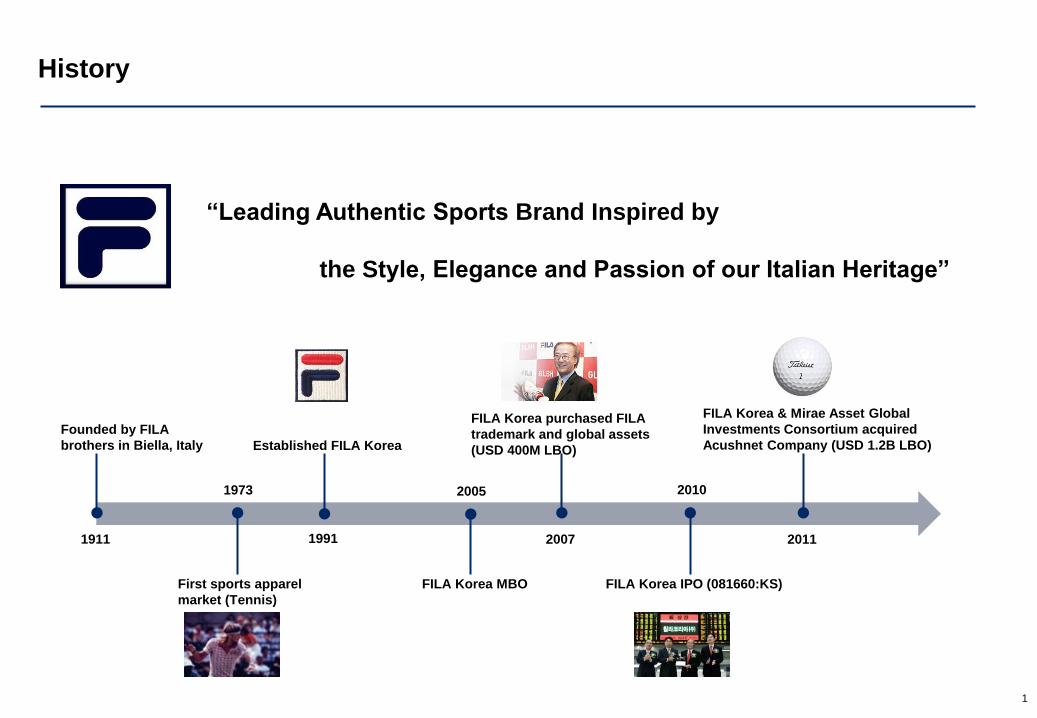
History
1
“Leading Authentic Sports Brand Inspired by
the Style, Elegance and Passion of our Italian Heritage”
Founded by FILA
brothers in Biella, Italy
1911
1973
1991
2005
2007
2010
2011
First sports apparel
market (Tennis)
Established FILA Korea
FILA Korea MBO
FILA Korea purchased FILA
trademark and global assets
(USD 400M LBO)
FILA Korea IPO (081660:KS)
FILA Korea & Mirae Asset Global
Investments Consortium acquired
Acushnet Company (USD 1.2B LBO)
2
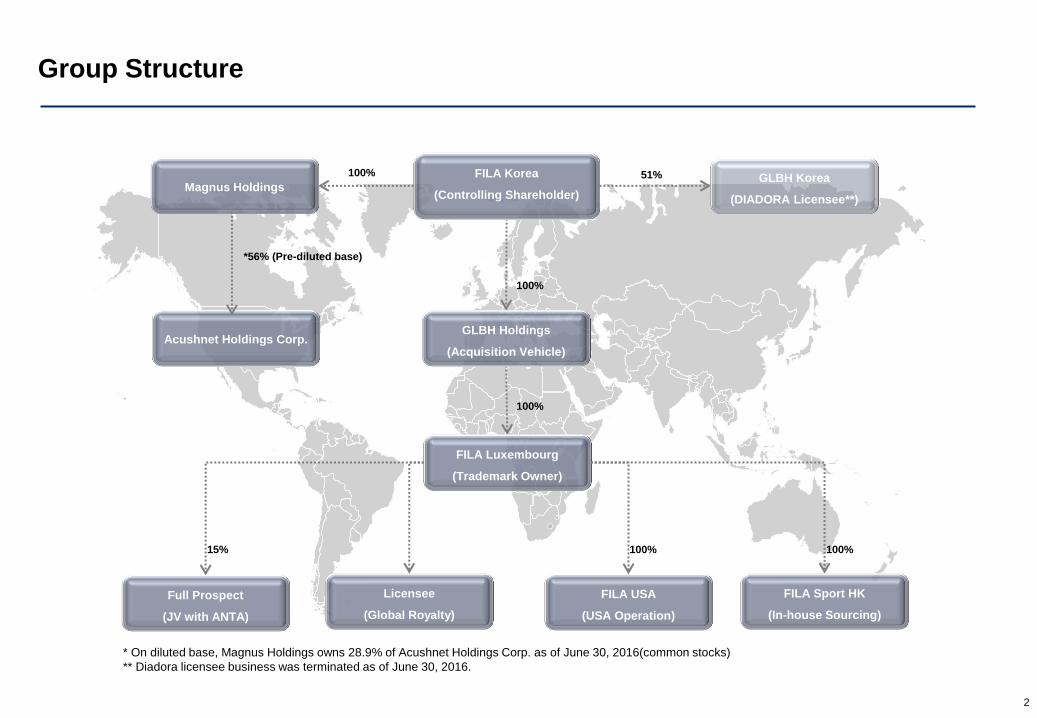
100% 100%
100%
100%
15%
100%
GLBH Holdings
(Acquisition Vehicle)
FILA Luxembourg
(Trademark Owner)
FILA Korea
(Controlling Shareholder)
Acushnet Holdings Corp.
Full Prospect
(JV with ANTA)
FILA Sport HK
(In-house Sourcing)
FILA USA
(USA Operation)
Licensee
(Global Royalty)
Group Structure
Magnus Holdings
*56% (Pre-diluted base)
* On diluted base, Magnus Holdings owns 28.9% of Acushnet Holdings Corp. as of June 30, 2016(common stocks)
** Diadora licensee business was terminated as of June 30, 2016.
51% GLBH Korea
(DIADORA Licensee**)

FILA USA
FILA Licensee
FILA China
FILA Korea
FILA Group Business Overview
North America (Canada, U.S.A., Mexico)
Footwear based wholesale distributor
Despite the competitive market condition, FILA USA continued to grow
both the revenue and operating profit on a dollar basis since its turnaround in 2010
Apparel and footwear based retail distributor
Total number of stores: 650 (as of June 30, 2016)
Multi-brand: FILA, FILA GOLF, FILA KIDS, FILA Underwear
FILA brand renewal began in early 2016 by overhauling its product,
distribution and marketing with a new management team
Joint venture with ANTA Sports from 2009.
Offering premium sports & lifestyle products in China, Hong Kong, and Macau
Contributes 3% of its revenue as Design Service Fee to FILA
Fast growth in revenue since its launching year (CAGR 43%: 2009-2015)
Total 32 licensees in EMEA, North America, Latin America and Asia
Royalty: 6%~7% of its annual wholesale revenue
Stable contribution by each regional licensees
Direct
Indirect
3
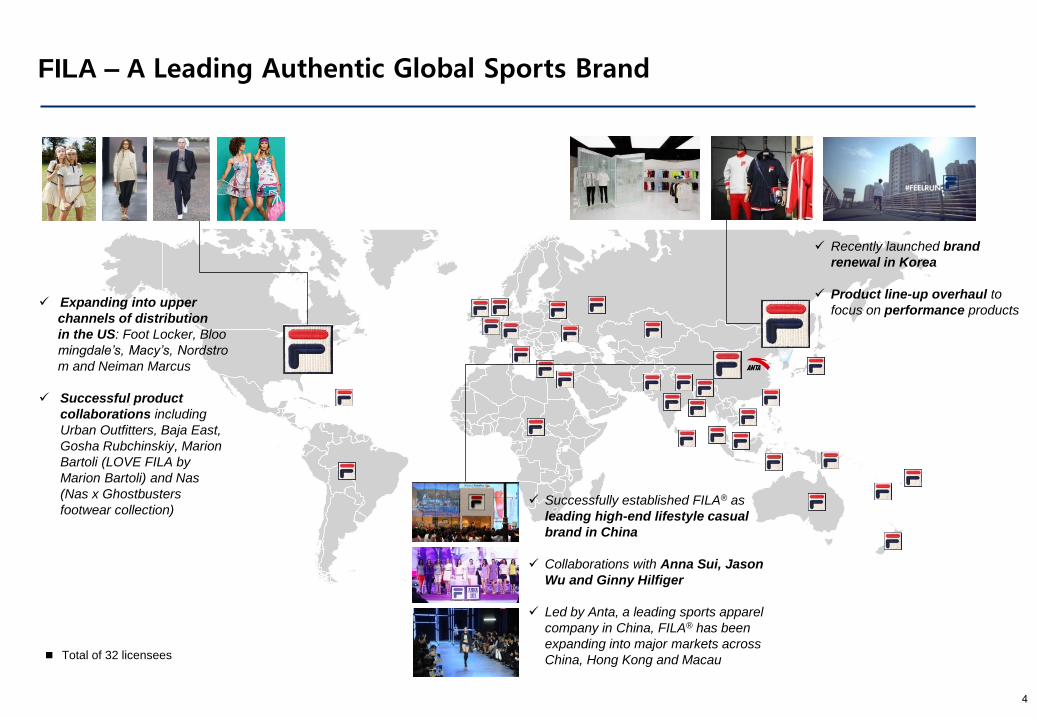
Recently launched brand
renewal in Korea
Product line-up overhaul to
focus on performance products Expanding into upper
channels of distribution
in the US: Foot Locker, Bloo
mingdale’s, Macy’s, Nordstro
m and Neiman Marcus
Successful product
collaborations including
Urban Outfitters, Baja East,
Gosha Rubchinskiy, Marion
Bartoli (LOVE FILA by
Marion Bartoli) and Nas
(Nas x Ghostbusters
footwear collection) Successfully established FILA® as
leading high-end lifestyle casual
brand in China
Collaborations with Anna Sui, Jason
Wu and Ginny Hilfiger
Led by Anta, a leading sports apparel
company in China, FILA® has been
expanding into major markets across
China, Hong Kong and Macau Total of 32 licensees
4
FILA – A Leading Authentic Global Sports Brand

2Q Revenue Breakdown / OPM (Consol.)
(KRW M)
Stable Growth by Diversified Portfolio
5
FILA maintains stable revenue growth driven by U.S. wholesale business and royalty contributions
YTD Revenue Breakdown / OPM (Consol.)
(KRW M)
50% 43% 40%
36%
40% 43%
14% 17% 17%
14.7% 12.7%
8.2%
1H 2014 1H 2015 1H 2016
FILA Korea FILA USA Royalty & Others OPM
195,419 200,698 209,229 394,683 415,870 377,431
56% 50%
41%
33% 36%
43%
12% 14% 16%
14.6% 12.6% 11.9%
2Q 2014 2Q 2015 2Q 2016
FILA Korea FILA USA Royalty & Others OPM
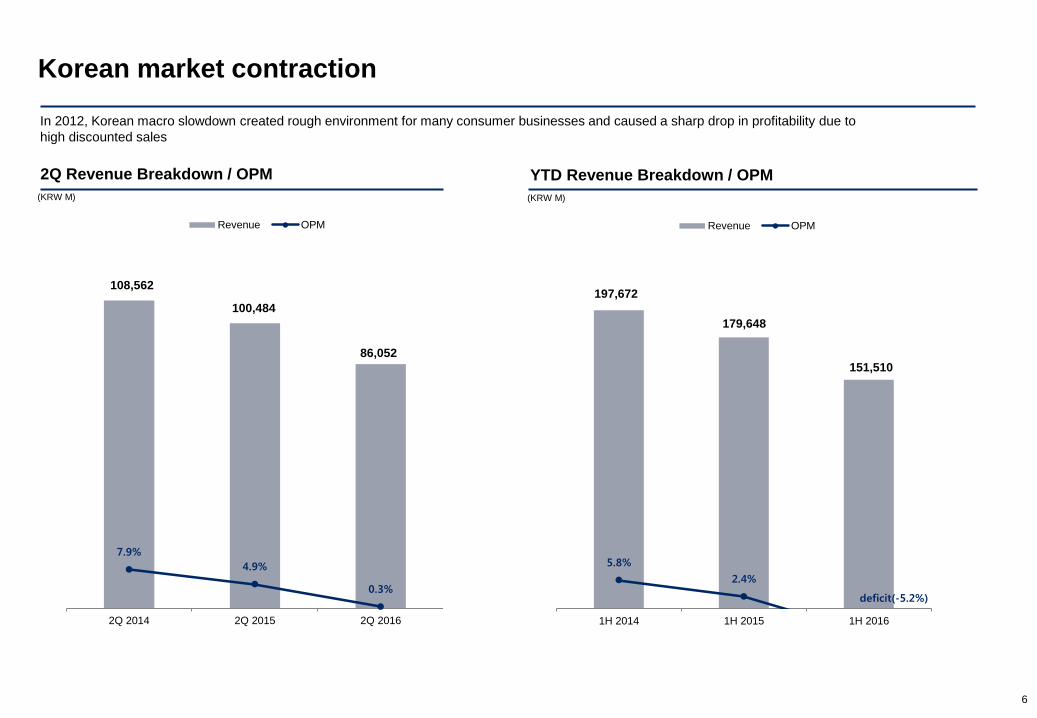
Korean market contraction
6
In 2012, Korean macro slowdown created rough environment for many consumer businesses and caused a sharp drop in profitability due to
high discounted sales
2Q Revenue Breakdown / OPM
YTD Revenue Breakdown / OPM
(KRW M) (KRW M)
108,562
100,484
86,052
7.9%
4.9%
0.3%
2Q 2014 2Q 2015 2Q 2016
Revenue OPM
197,672
179,648
151,510
5.8%
2.4%
1H 2014 1H 2015 1H 2016
Revenue OPM
deficit(-5.2%)

F I L A U S A USA operation improvement
7
Despite of the competitive market conditions in the US, Fila USA continued to grow both the revenue and operating profit on a dollar basis.
2Q Revenue Breakdown / OPM
YTD Revenue Breakdown / OPM
(USD K) (USD K)
63,942
71,310
90,427
5.9% 6.0% 7.5%
2Q 2014 2Q 2015 2Q 2016
Revenue OPM
141,937
166,267 161,863
8.7% 7.9% 7.0%
1H 2014 1H 2015 1H 2016
Revenue OPM
8
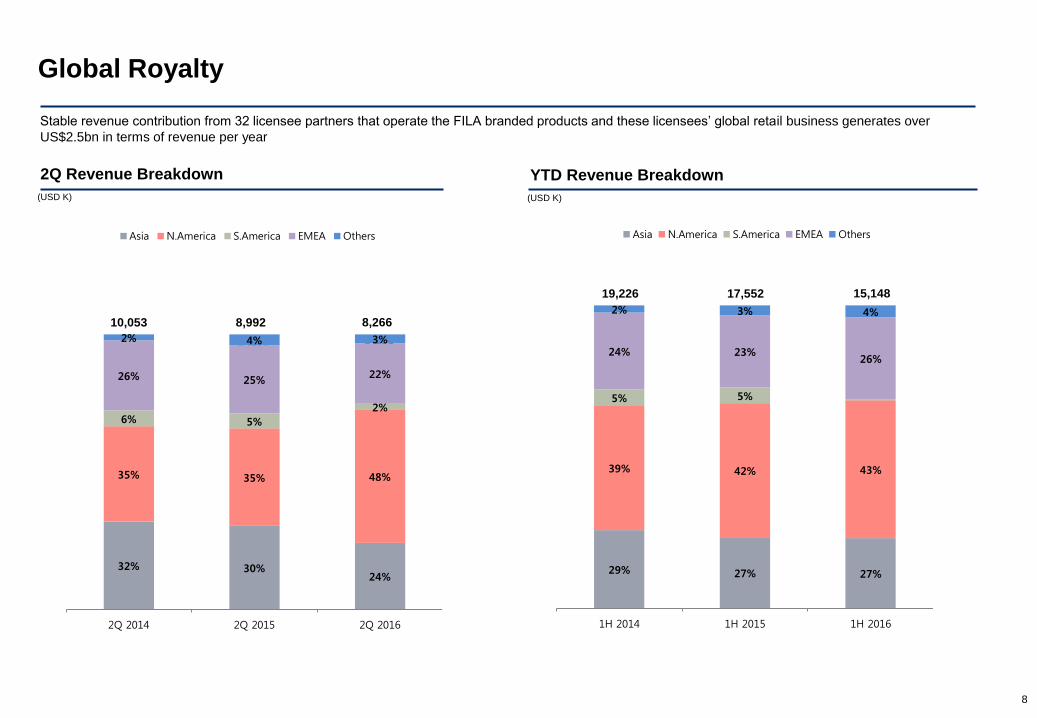
Global Royalty
Stable revenue contribution from 32 licensee partners that operate the FILA branded products and these licensees’ global retail business generates over
US$2.5bn in terms of revenue per year
10,053 8,992 8,266
2Q Revenue Breakdown YTD Revenue Breakdown
(USD K) (USD K)
29% 27% 27%
39% 42% 43%
5% 5%
24% 23% 26%
2% 3% 4%
1H 2014 1H 2015 1H 2016
Asia N.America S.America EMEA Others
19,226 17,552 15,148
32% 30% 24%
35% 35% 48%
6% 5%
2%
26% 25% 22%
2% 4% 3%
2Q 2014 2Q 2015 2Q 2016
Asia N.America S.America EMEA Others
10,053 8,992 8,266
9
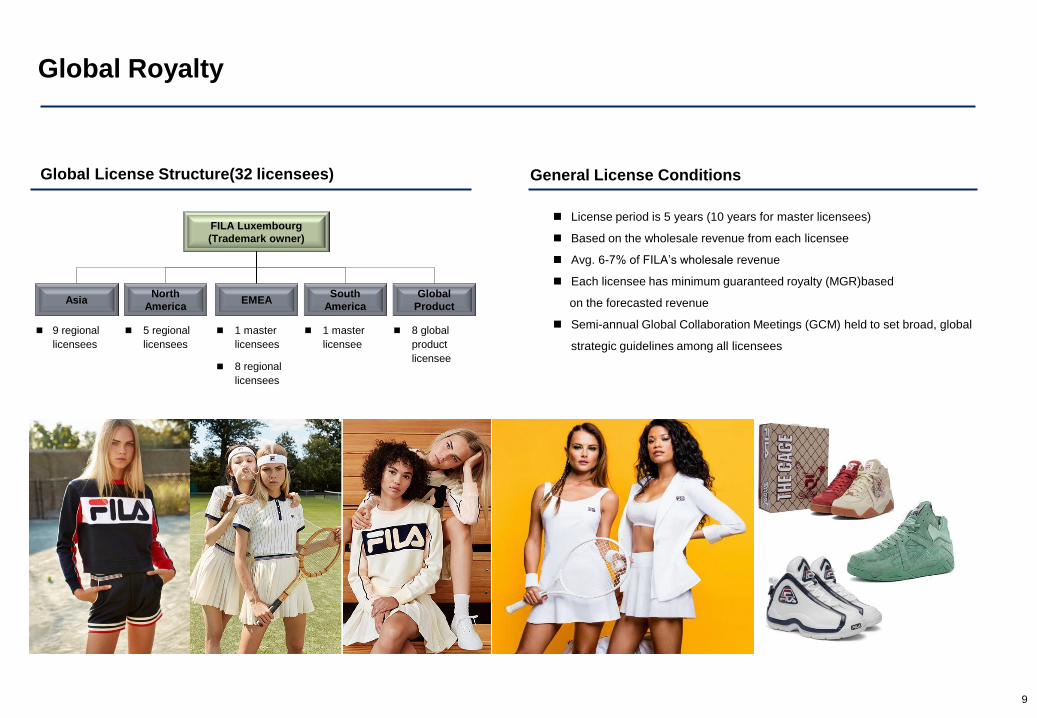
Global License Structure(32 licensees)
Global Royalty
License period is 5 years (10 years for master licensees)
Based on the wholesale revenue from each licensee
Avg. 6-7% of FILA’s wholesale revenue
Each licensee has minimum guaranteed royalty (MGR)based
on the forecasted revenue
Semi-annual Global Collaboration Meetings (GCM) held to set broad, global
strategic guidelines among all licensees
FILA Luxembourg
(Trademark owner)
EMEA South
America Asia
Global
Product
9 regional
licensees
5 regional
licensees
1 master
licensee
8 global
product
licensee
North
America
1 master
licensees
8 regional
licensees
General License Conditions

10
Acushnet Company (Titleist & FootJoy)
1,477,066
1,537,610
1,502,958
8.1% 6.8% 8.3%
FY 2013 FY 2014 FY 2015
Revenue OPM
FILA and Mirae Asset Investment Consortium acquired Acushnet Company in 2011 (USD 1.225B)
2Q Revenue Breakdown FY Revenue Breakdown
(USD K) (USD K)
455,721 446,576 442,796
13.0% 14.6% 13.2%
2Q 2014 2Q 2015 1Q 2016
Revenue OPM

11
Appendix
2Q 2016 FY 2015 FY 2014
Assets 1,026,384 978,932 1,043,405
Current Assets 459,251 413,786 371,767
Cash and cash equivalents 96,029 46,938 60,093
Trade and other receivables 124,117 131,500 108,196
Inventories 225,505 222,208 185,846
Other current assets 13,600 13,140 17,632
Non-current Assets 567,133 565,146 671,638
Property and equipment 48,665 44,531 39,523
Intangible assets 395,099 396,637 381,498
Other non-current assets 123,370 123,978 250,617
Liabilities 529,151 499,830 475,018
Current Liabilities 278,606 271,629 197,260
Trade and other payables 101,927 105,402 92,292
Borrowings 159,718 146,037 86,486
Other current liabilities 16,961 20,190 18,482
Non-current Liabilities 250,546 228,200 277,758
Borrowings 120,153 92,572 206,747
Bonds 75,073 75,363 -
Other non-current liabilities 55,320 60,265 71,011
Total Equity 497,233 479,102 568,387
Consolidated Balance Sheet (K-IFRS) (KRW M)

12
Appendix
Consolidated Profit & Loss Summary
FILA Korea Profit & Loss Summary
(KRW M)
(KRW M)
1Q 2014 2Q 2014 3Q 2014 4Q 2014 FY 2014 1Q 2015 2Q 2015 3Q 2015 4Q 2015 FY 2015 1Q 2016 2Q 2016 YTD 2016
Revenue 199,264 195,419 189,347 213,446 797,476 215,172 200,698 196,383 203,497 815,750 168,202 209,229 377,431
Gross Profit 95,693 100,454 85,714 95,135 376,996 96,541 97,871 86,219 88,247 368,878 71,985 99,263 171,248
G.P.(%) 48.00% 51.40% 45.30% 44.60% 47.30% 44.90% 48.80% 43.90% 43.40% 45.20% 42.80% 47.44% 45.37%
Operating Profit 29,603 28,564 20,864 14,518 93,549 27,657 25,200 19,158 8,546 80,562 6,305 24,807 31,112
O.P.(%) 14.90% 14.60% 11.00% 6.80% 11.70% 12.90% 12.60% 9.80% 4.20% 9.90% 3.75% 11.86% 8.24%
Net Income 20,827 29,457 21,390 -12,168 57,590 -30,609 -31,692 -17,884 -53,144 -133,328 7,340 16,009 23,349
1Q 2014 2Q 2014 3Q 2014 4Q 2014 FY 2014 1Q 2015 2Q 2015 3Q 2015 4Q 2015 FY 2015 1Q 2016 2Q 2016 YTD 2016
Revenue 89,110 108,562 87,587 112,231 397,490 79,164 100,484 76,485 90,672 346,805 65,458 86,052 151,510
Gross Profit 50,919 64,918 47,317 57,516 220,669 45,078 58,391 42,080 47,142 192,692 31,459 50,553 82,012
G.P.(%) 57.10% 59.80% 54.00% 51.20% 55.50% 56.90% 58.10% 55.00% 52.00% 55.60% 48.06% 58.75% 54.13%
Operating Profit 2,899 8,605 1,696 -1,345 11,853 -550 4,937 -1,670 -6,738 -4,020 -8,057 229 -7,828
O.P.(%) 3.30% 7.90% 1.90% N/A 3.00% N/A 4.90% N/A N/A N/A N/A 0.27% N/A
Net Income 2,590 2,954 2,505 1,556 9,603 -577 3,759 213 -3,826 -430 -7,523 3,547 -3,976

13
Appendix
Note
* FILA USA results for 2Q 2013 reflect the reversal of an accrual of $2.7mn made in 2007 for potential customs duties, penalties and interest.
FILA USA Profit & Loss Summary
Global Royalty Summary
(USD K)
(USD K)
1Q 2014 2Q 2014 3Q 2014 4Q 2014 FY 2014 1Q 2015 2Q 2015 3Q 2015 4Q 2015 FY 2015 1Q 2016 2Q 2016 YTD 2016
Revenue 77,995 63,942 70,855 66,439 279,231 94,957 71,310 75,984 78,739 320,990 71,436 90,427 161,863
Gross Profit 26,336 18,379 20,916 16,851 82,482 29,892 20,054 22,618 21,842 94,406 22,529 28,951 51,480
G.P.(%) 33.80% 28.70% 29.50% 25.40% 29.50% 31.50% 28.10% 29.80% 27.70% 29.40% 31.54% 32.02% 31.80%
Operating Profit 8,537 3,796 4,173 719 17,225 8,833 4,299 4,130 2,682 19,944 4,495 6,804 11,299
O.P.(%) 10.90% 5.90% 5.90% 1.10% 6.20% 9.30% 6.00% 5.40% 3.40% 6.20% 6.29% 7.52% 6.98%
Net Income 4,851 1,991 2,163 -223 8,782 5,164 2,375 1,945 1,406 10,890 2,409 3,924 6,333
1Q 2014 2Q 2014 3Q 2014 4Q 2014 FY 2014 1Q 2015 2Q 2015 3Q 2015 4Q 2015 FY 2015 1Q 2016 2Q 2016 YTD 2016
FILA Korea 1,862 2,433 1,967 2,371 8,634 1,508 1,898 1,386 1,616 6,408 1,148 1,540 2,688
FILA Subsidiary 4,871 2,390 2,645 1,161 11,070 5,417 2,638 3,176 1,558 12,927 2,465 6,828 9,293
Asia 2,315 2,244 2,314 2,513 9,384 2,110 2,133 2,027 3,206 9,478 2,118 2,128 4,246
North America 2,195 2,821 2,586 2,905 10,506 2,170 2,223 2,749 2,303 9,427 1,279 544 1,823
South America 664 863 855 812 3,194 707 739 587 678 2,710 -224 330 106
EMEA 3,642 3,799 3,901 3,406 14,751 3,227 3,363 3,553 3,504 13,645 3,243 3,354 6,597
Category 353 325 242 306 1,226 344 534 322 282 1,483 466 493 959
15,902 14,875 14,510 13,474 58,765 15,483 13,528 13,800 13,147 56,078 10,495 15,217 25,712
Total
(Adjusted) 9,169 10,053 9,898 9,941 39,061 8,558 8,992 9,219 9,973 36,743 6,882 8,266 15,148
Disclaimer
14
This document has been prepared for presentation, illustration and discussion purpose only and is not legally binding. Whilst complied from sources FILA Korea believes to
be accurate, no representation, warranty, assurance or inducement express or implied as to the accuracy, completeness or adequacy of freedom from defect of any kind is
made, and the division, group or subsidiary or affiliate of FILA Korea which produced this document shall not be liable to the recipient or controlling shareholders of the
recipient resulting from its use. Nothing herein contains shall be construed as granting the recipient whether directly or indirectly or by implication, any license or right, under
any copy right or intellectual property rights to use the information herein. FILA Korea accepts no liability for any loss or damage of any kind resulting out of the unauthorized
use of this document. Investment involves risk. Past performance figures are not indicative of future performance. Please carefully read through the documents and seek
independent professional advice before you make any investment decision.


