80
INVESTOR RELATIONS FACTBOOK February 2017 © 2017 Software AG. All rights reserved.
INVESTOR RELATIONS FACTBOOK
February 2017
© 2017 Software AG. All rights reserved.
2 |
This presentation includes forward-looking statements based on the beliefs of Software AG management.
Such statements reflect current views of Software AG with respect to future events
and results and are subject to risks and uncertainties. Actual results may vary materially from those
projected here, due to factors including changes in general economic and business conditions, changes in
currency exchange, the introduction of competing products, lack of market acceptance
of new products, services or technologies and changes in business strategy. Software AG does not intend
or assume any obligation to update these forward-looking statements.
This presentation constitutes neither an offer nor recommendation to subscribe or buy in any other way
securities of Software AG or any of the companies that are members of the Group at present or in the
future, nor does it form part of such an offer and it should not be understood as such. This presentation
does not constitute an offer of sale of securities in the United States of America. Securities may not be
offered or sold in the United States of America without registration or exemption from registration in
accordance with the U.S. Securities‘ Act of 1933 in its currently valid form.
The Gartner Report(s) described herein, (the "Gartner Report(s)") represent(s) research opinion or viewpoints published, as part of a syndicated
subscription service, by Gartner, Inc. ("Gartner"), and are not representations of fact. Each Gartner Report speaks as of its original publication date
(and not as of the date of this Prospectus) and the opinions expressed in the Gartner Report(s) are subject to change without notice.
© 2017 Software AG. All rights reserved.
SAFE-HARBOR-STATEMENT
3 |
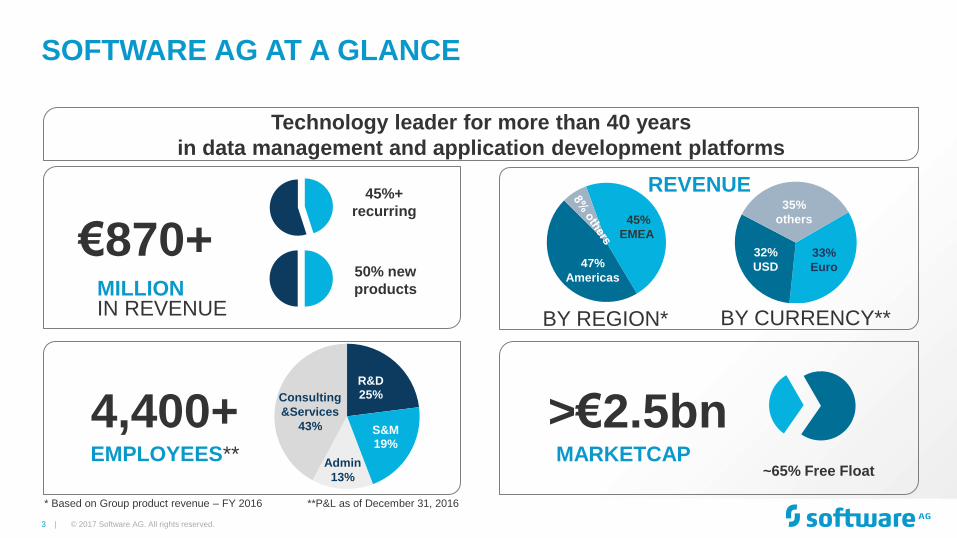
SOFTWARE AG AT A GLANCE
Technology leader for more than 40 years
in data management and application development platforms
>€2.5bn MARKETCAP
~65% Free Float
€870+ MILLION IN REVENUE
45%+
recurring
50% new
products
4,400+ EMPLOYEES**
R&D 25%
S&M 19%
Consulting
&Services
43%
Admin
13%
© 2017 Software AG. All rights reserved.
47%
Americas
45%
EMEA
REVENUE
33%
Euro
32%
USD
35%
others
BY REGION* BY CURRENCY**
* Based on Group product revenue – FY 2016 **P&L as of December 31, 2016
4 | © 2017 Software AG. All rights reserved.
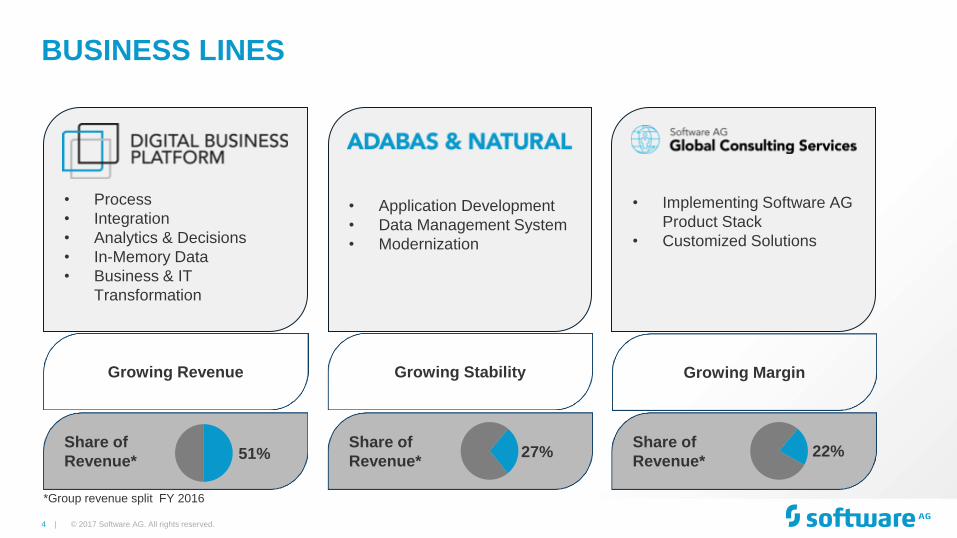
BUSINESS LINES
• Implementing Software AG
Product Stack
• Customized Solutions
• Application Development
• Data Management System
• Modernization
• Process
• Integration
• Analytics & Decisions
• In-Memory Data
• Business & IT
Transformation
Share of
Revenue*
Share of
Revenue*
Share of
Revenue* 51% 27% 22%
*Group revenue split FY 2016
Growing Stability Growing Revenue Growing Margin
5 |
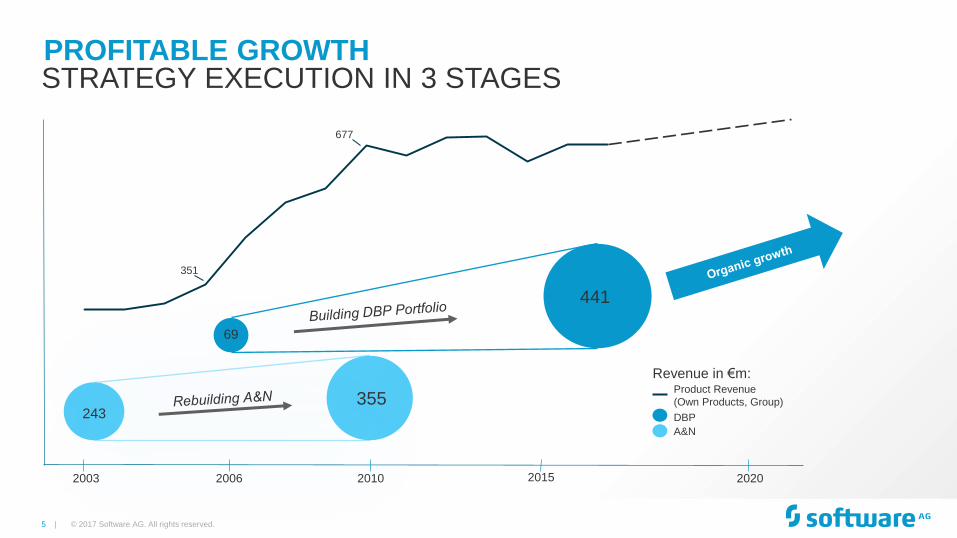
PROFITABLE GROWTH
© 2017 Software AG. All rights reserved.
STRATEGY EXECUTION IN 3 STAGES
243 355
441
2003 2010 2006 2015 2020
Revenue in €m: Product Revenue
(Own Products, Group)
DBP
A&N
69
677
351
6 |
INDEX
© 2017 Software AG. All rights reserved.
Key Investment Indicators 1. 7
Business Model, Characteristics & GTM 2. 21
Markets, Positioning & Competition 3. 28
Digital Business Platform - Core Capabilities 4. 37
Customers References & Use Cases 5. 44
Financials 6. 57
Shares & Ownership 7. 73
7 |
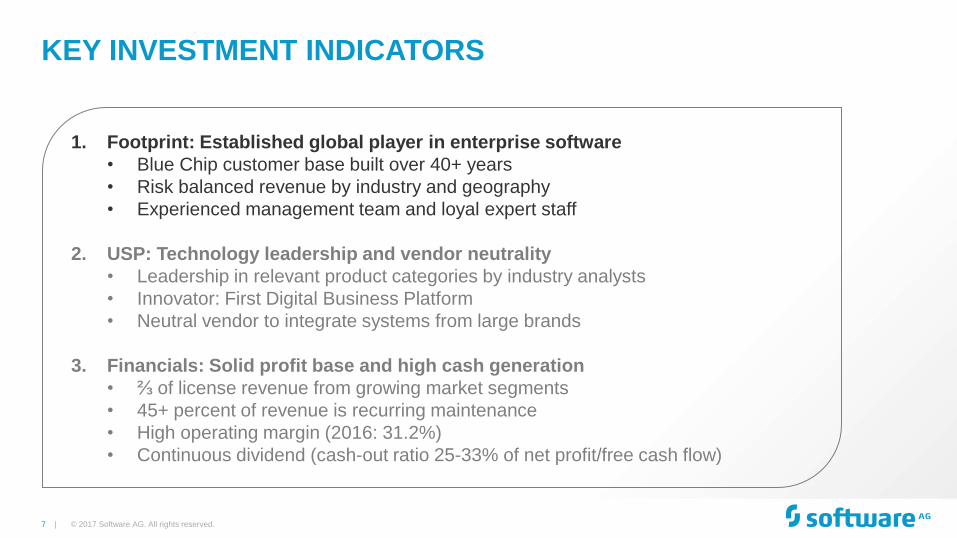
KEY INVESTMENT INDICATORS
© 2017 Software AG. All rights reserved.
1. Footprint: Established global player in enterprise software
• Blue Chip customer base built over 40+ years
• Risk balanced revenue by industry and geography
• Experienced management team and loyal expert staff
2. USP: Technology leadership and vendor neutrality
• Leadership in relevant product categories by industry analysts
• Innovator: First Digital Business Platform
• Neutral vendor to integrate systems from large brands
3. Financials: Solid profit base and high cash generation
• ⅔ of license revenue from growing market segments
• 45+ percent of revenue is recurring maintenance
• High operating margin (2016: 31.2%)
• Continuous dividend (cash-out ratio 25-33% of net profit/free cash flow)
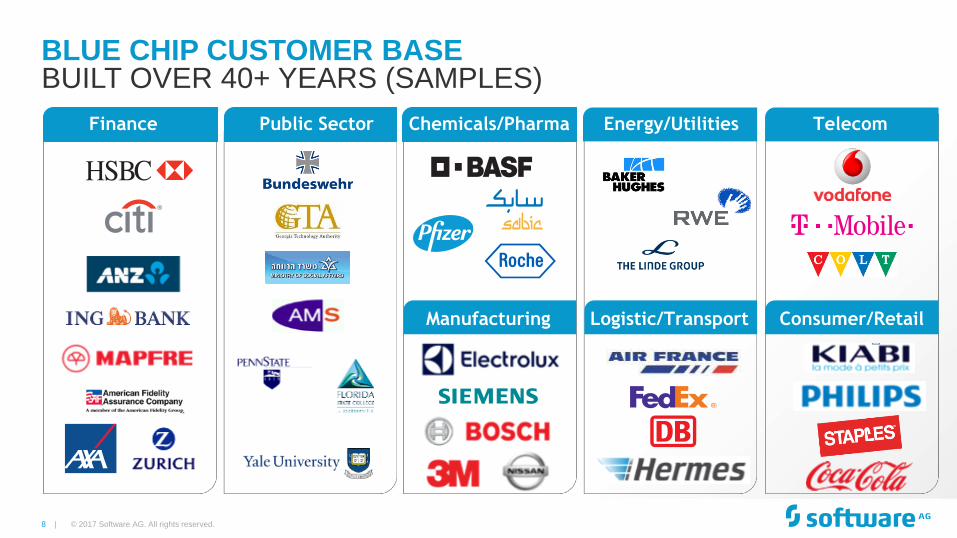
8 |
Public Sector Telecom Chemicals/Pharma Energy/Utilities
Manufacturing Logistic/Transport Consumer/Retail
Finance
BLUE CHIP CUSTOMER BASE BUILT OVER 40+ YEARS (SAMPLES)
© 2017 Software AG. All rights reserved.
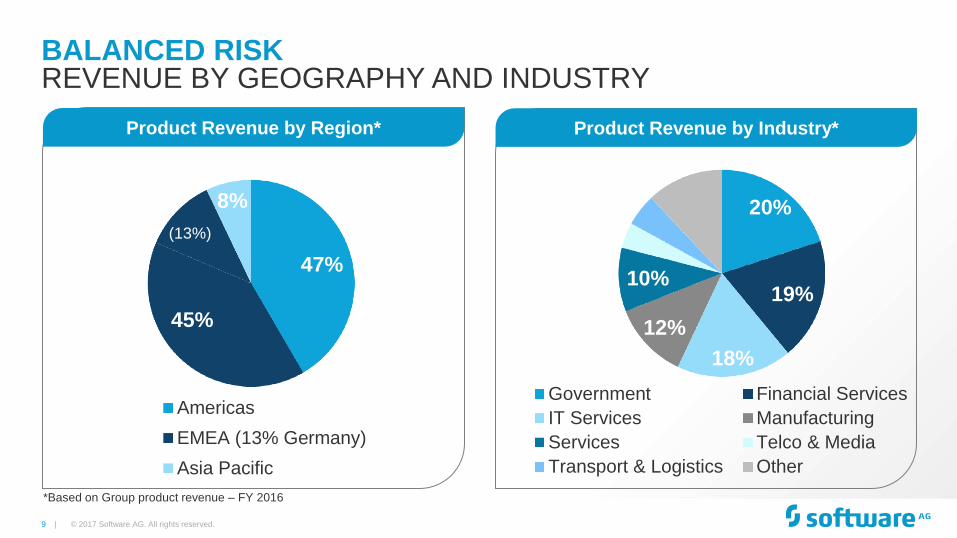
9 |
20%
19%
18%
12%
10%
Government Financial Services
IT Services Manufacturing
Services Telco & Media
Transport & Logistics Other
BALANCED RISK
© 2017 Software AG. All rights reserved.
REVENUE BY GEOGRAPHY AND INDUSTRY
Product Revenue by Region* Product Revenue by Industry*
47%
45%
(13%)
8%
Americas
EMEA (13% Germany)
Asia Pacific
*Based on Group product revenue – FY 2016
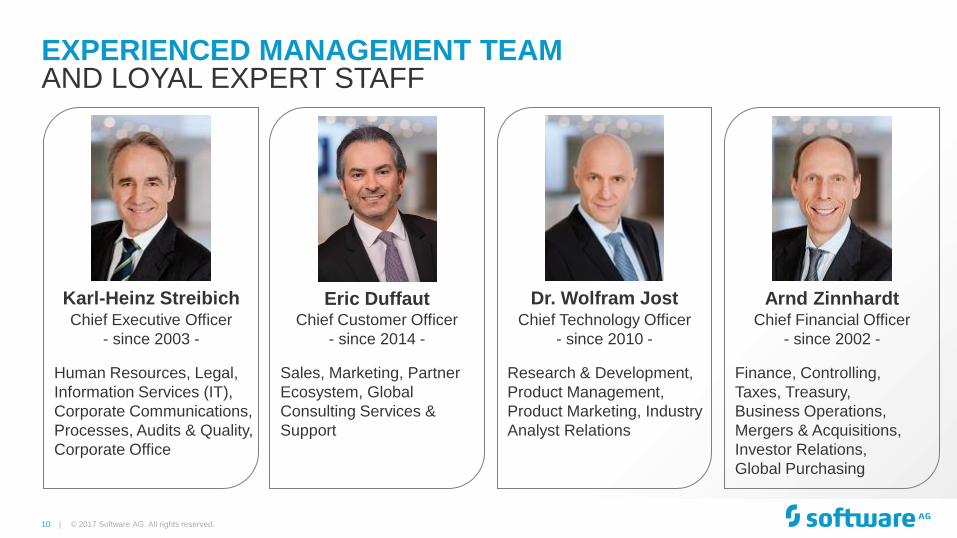
10 |
EXPERIENCED MANAGEMENT TEAM AND LOYAL EXPERT STAFF
Karl-Heinz Streibich Eric Duffaut Dr. Wolfram Jost Arnd Zinnhardt Chief Executive Officer
- since 2003 -
Chief Customer Officer
- since 2014 -
Chief Technology Officer
- since 2010 -
Chief Financial Officer
- since 2002 -
Human Resources, Legal,
Information Services (IT),
Corporate Communications,
Processes, Audits & Quality,
Corporate Office
Sales, Marketing, Partner
Ecosystem, Global
Consulting Services &
Support
Research & Development,
Product Management,
Product Marketing, Industry
Analyst Relations
Finance, Controlling,
Taxes, Treasury,
Business Operations,
Mergers & Acquisitions,
Investor Relations,
Global Purchasing
© 2017 Software AG. All rights reserved.
11 |
KEY INVESTMENT INDICATORS
1. Footprint: Established global player in enterprise software
• Blue Chip customer base built over 40+ years
• Risk balanced revenue by industry and geography
• Experienced management team and loyal expert staff
2. USP: Technology leadership and vendor neutrality
• Leadership in relevant product categories by industry analysts
• Innovator: First Digital Business Platform
• Neutral vendor to integrate systems from large brands
3. Financials: Solid profit base and high cash generation
• ⅔ of license revenue from growing market segments
• 45+ percent of revenue is recurring maintenance
• High operating margin (2016: 31.2%)
• Continuous dividend (cash-out ratio 25-33% of net profit/free cash flow)
© 2017 Software AG. All rights reserved.
12 |
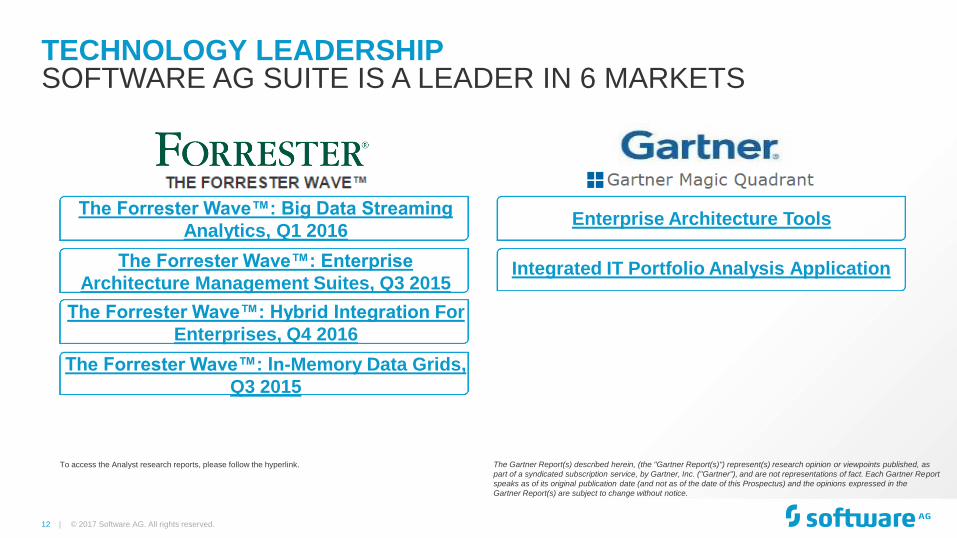
TECHNOLOGY LEADERSHIP
© 2017 Software AG. All rights reserved.
SOFTWARE AG SUITE IS A LEADER IN 6 MARKETS
The Gartner Report(s) described herein, (the "Gartner Report(s)") represent(s) research opinion or viewpoints published, as
part of a syndicated subscription service, by Gartner, Inc. ("Gartner"), and are not representations of fact. Each Gartner Report
speaks as of its original publication date (and not as of the date of this Prospectus) and the opinions expressed in the
Gartner Report(s) are subject to change without notice.
To access the Analyst research reports, please follow the hyperlink.
The Forrester Wave™: In-Memory Data Grids,
Q3 2015
The Forrester Wave™: Hybrid Integration For
Enterprises, Q4 2016
The Forrester Wave™: Enterprise
Architecture Management Suites, Q3 2015
The Forrester Wave™: Big Data Streaming
Analytics, Q1 2016 Enterprise Architecture Tools
Integrated IT Portfolio Analysis Application
13 |
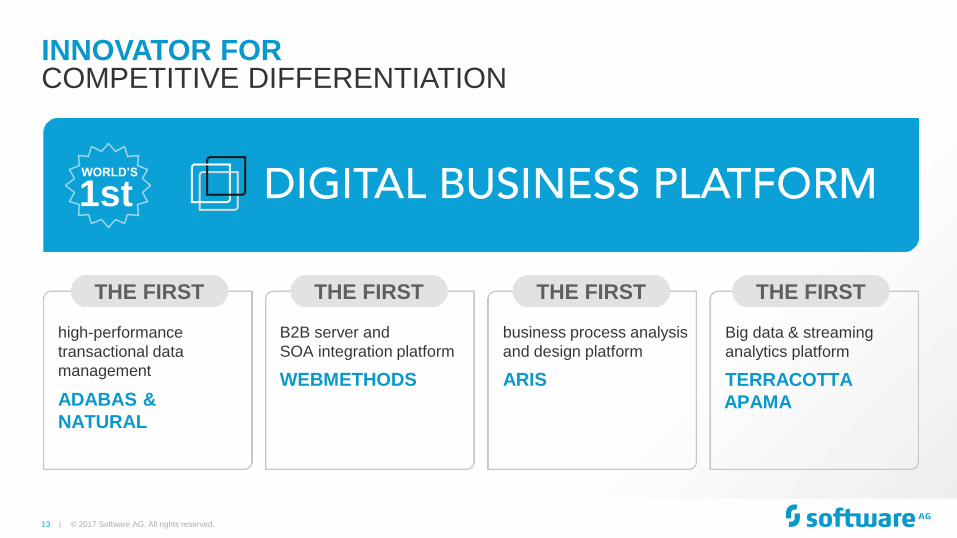
INNOVATOR FOR
© 2017 Software AG. All rights reserved.
COMPETITIVE DIFFERENTIATION
WORLD’S
1st
high-performance
transactional data
management
ADABAS &
NATURAL
B2B server and
SOA integration platform
WEBMETHODS
business process analysis
and design platform
ARIS
Big data & streaming
analytics platform
TERRACOTTA
APAMA
THE FIRST THE FIRST THE FIRST THE FIRST
14 | © 2017 Software AG. All rights reserved.
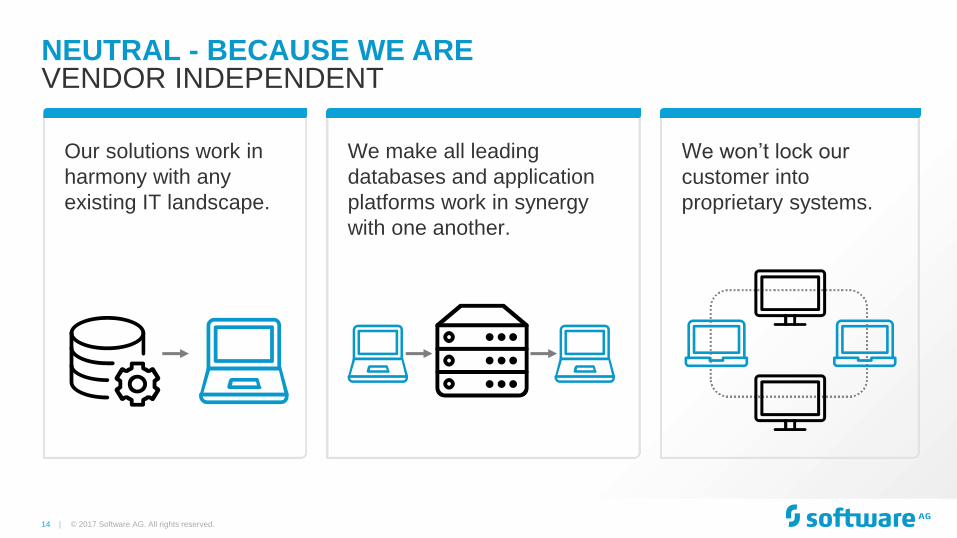
Our solutions work in
harmony with any
existing IT landscape.
We make all leading
databases and application
platforms work in synergy
with one another.
We won’t lock our
customer into
proprietary systems.
NEUTRAL - BECAUSE WE ARE VENDOR INDEPENDENT
15 |
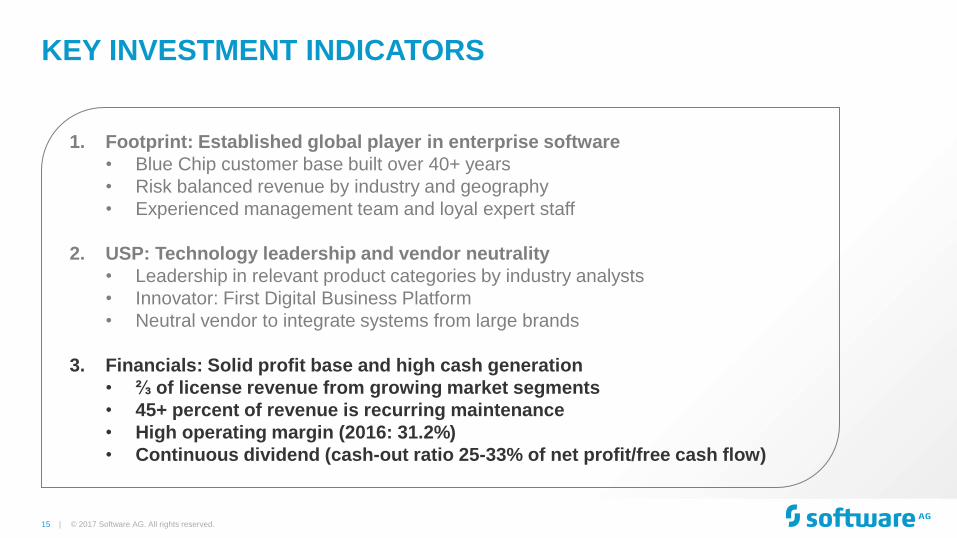
KEY INVESTMENT INDICATORS
© 2017 Software AG. All rights reserved.
1. Footprint: Established global player in enterprise software
• Blue Chip customer base built over 40+ years
• Risk balanced revenue by industry and geography
• Experienced management team and loyal expert staff
2. USP: Technology leadership and vendor neutrality
• Leadership in relevant product categories by industry analysts
• Innovator: First Digital Business Platform
• Neutral vendor to integrate systems from large brands
3. Financials: Solid profit base and high cash generation
• ⅔ of license revenue from growing market segments
• 45+ percent of revenue is recurring maintenance
• High operating margin (2016: 31.2%)
• Continuous dividend (cash-out ratio 25-33% of net profit/free cash flow)
16 |
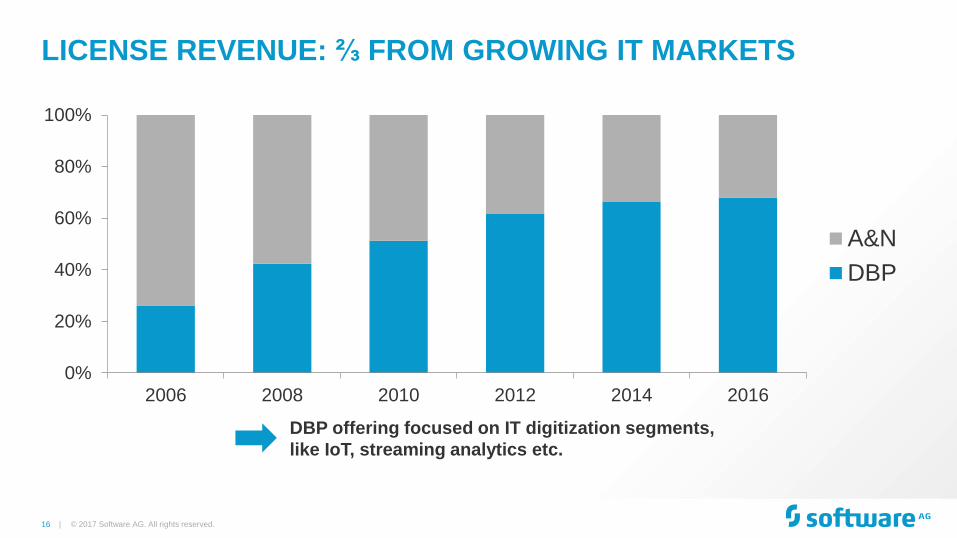
LICENSE REVENUE: ⅔ FROM GROWING IT MARKETS
© 2017 Software AG. All rights reserved.
0%
20%
40%
60%
80%
100%
2006 2008 2010 2012 2014 2016
A&N
DBP
DBP offering focused on IT digitization segments,
like IoT, streaming analytics etc.
17 |
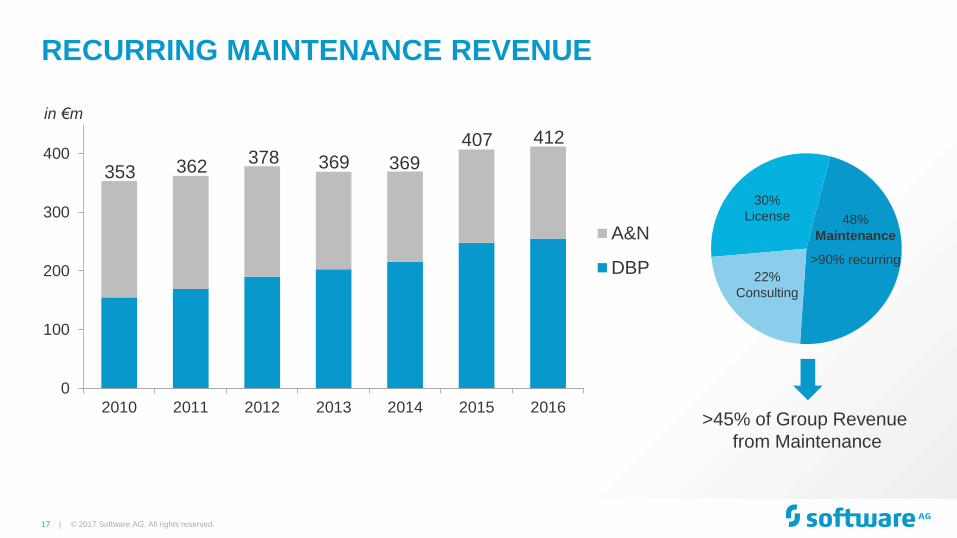
RECURRING MAINTENANCE REVENUE
© 2017 Software AG. All rights reserved.
0
100
200
300
400
2010 2011 2012 2013 2014 2015 2016
A&N
DBP
353 362 378 369 369
407
>45% of Group Revenue
from Maintenance
in €m
48%
Maintenance
>90% recurring
30%
License
22%
Consulting
412
18 |
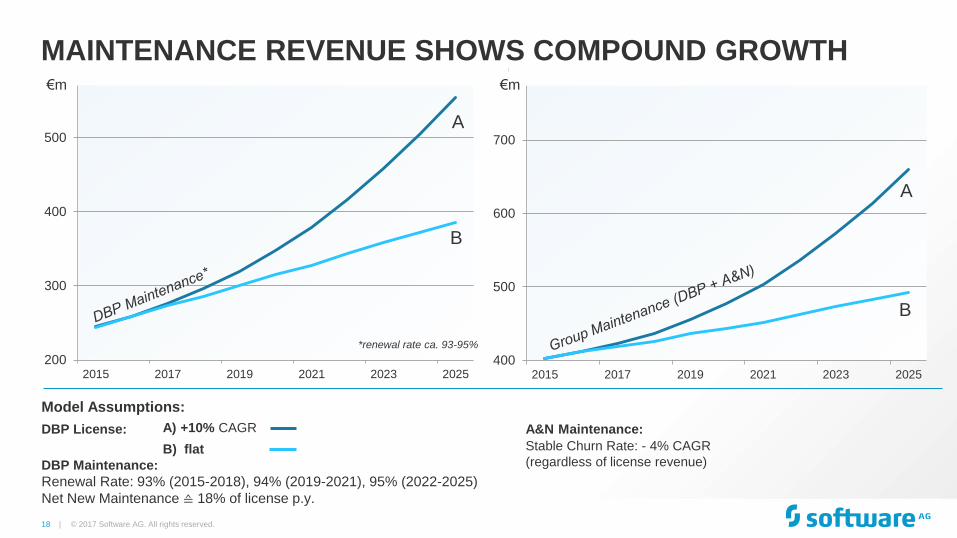
200
300
400
500
600
2015 2017 2019 2021 2023 2025
*renewal rate ca. 93-95%
400
500
600
700
800
2015 2017 2019 2021 2023 2025
© 2017 Software AG. All rights reserved.
A) +10% CAGR
B) flat
€m
€m
€m
MAINTENANCE REVENUE SHOWS COMPOUND GROWTH
DBP Maintenance:
Renewal Rate: 93% (2015-2018), 94% (2019-2021), 95% (2022-2025)
Net New Maintenance ≙ 18% of license p.y.
Stable Churn Rate: - 4% CAGR
(regardless of license revenue)
DBP License:
A
A
B
B
Model Assumptions:
A&N Maintenance:
19 |
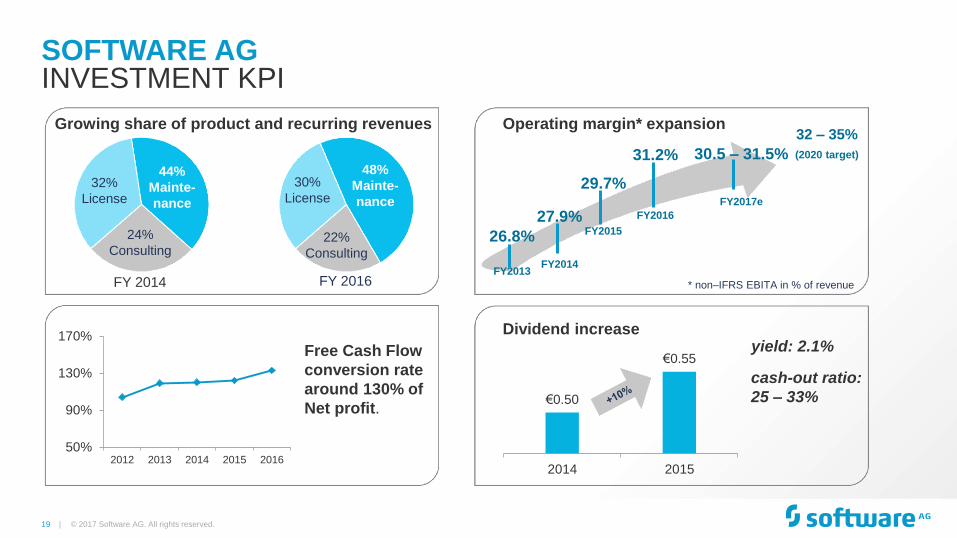
31.2%
FY2016
29.7%
FY2015 26.8%
FY2013
27.9%
FY2014
SOFTWARE AG INVESTMENT KPI
44%
Mainte-
nance
32%
License
24%
Consulting
Growing share of product and recurring revenues
€0.50
€0.55
2014 2015
Dividend increase
Free Cash Flow
conversion rate
around 130% of
Net profit.
50%
90%
130%
170%
2012 2013 2014 2015 2016
yield: 2.1%
Operating margin* expansion
FY 2014 * non–IFRS EBITA in % of revenue FY 2016
48%
Mainte-
nance
30%
License
22%
Consulting
© 2017 Software AG. All rights reserved.
32 – 35%
(2020 target)
cash-out ratio:
25 – 33%
30.5 – 31.5%
FY2017e
20 |
INDEX
© 2017 Software AG. All rights reserved.
Key Value Investment Indicators 1. 7
Business Model, Characteristics & GTM 2. 21
Markets, Positioning & Competition 3. 28
Digital Business Platform - Core Capabilities 4. 37
Customers References & Use Cases 5. 44
Financials 6. 57
Shares & Ownership 7. 73
21 |
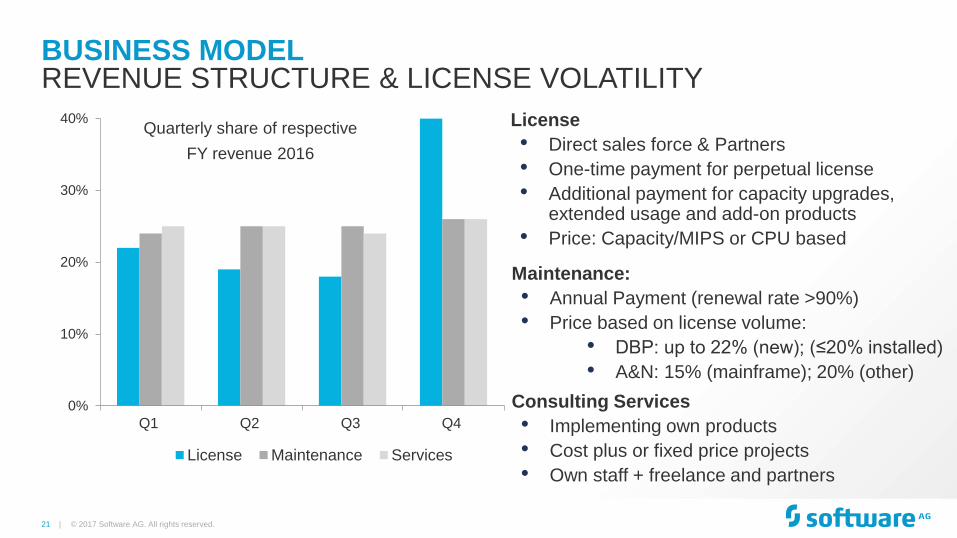
BUSINESS MODEL
© 2017 Software AG. All rights reserved.
REVENUE STRUCTURE & LICENSE VOLATILITY
License
• Direct sales force & Partners
• One-time payment for perpetual license
• Additional payment for capacity upgrades, extended usage and add-on products
• Price: Capacity/MIPS or CPU based
Maintenance:
• Annual Payment (renewal rate >90%)
• Price based on license volume:
• DBP: up to 22% (new); (≤20% installed)
• A&N: 15% (mainframe); 20% (other)
Consulting Services
• Implementing own products
• Cost plus or fixed price projects
• Own staff + freelance and partners
0%
10%
20%
30%
40%
Q1 Q2 Q3 Q4
License Maintenance Services
Quarterly share of respective
FY revenue 2016
22 |
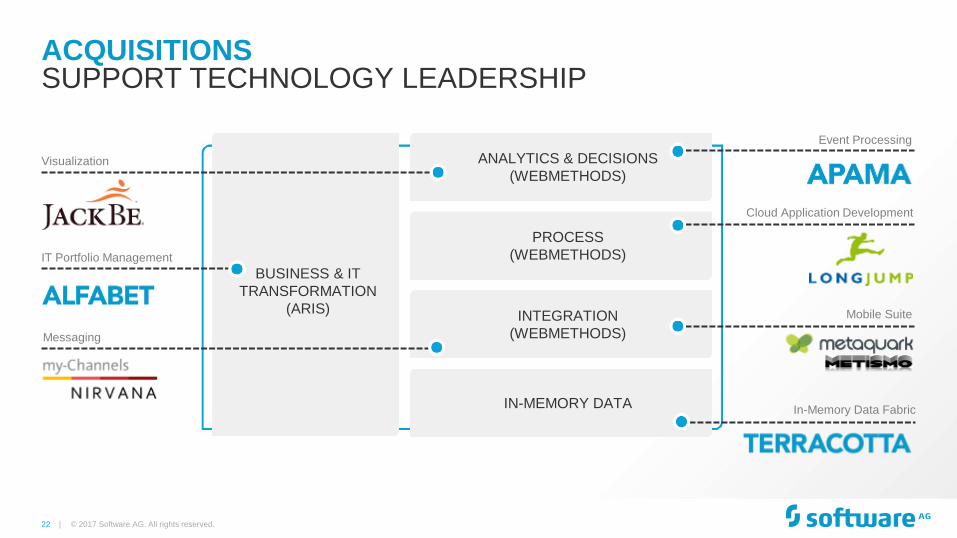
ACQUISITIONS
© 2017 Software AG. All rights reserved.
SUPPORT TECHNOLOGY LEADERSHIP
BUSINESS & IT
TRANSFORMATION
(ARIS)
ANALYTICS & DECISIONS
(WEBMETHODS)
PROCESS
(WEBMETHODS)
INTEGRATION
(WEBMETHODS)
IN-MEMORY DATA
Event Processing
IT Portfolio Management
Visualization
Cloud Application Development
Messaging
Mobile Suite
In-Memory Data Fabric
23 |
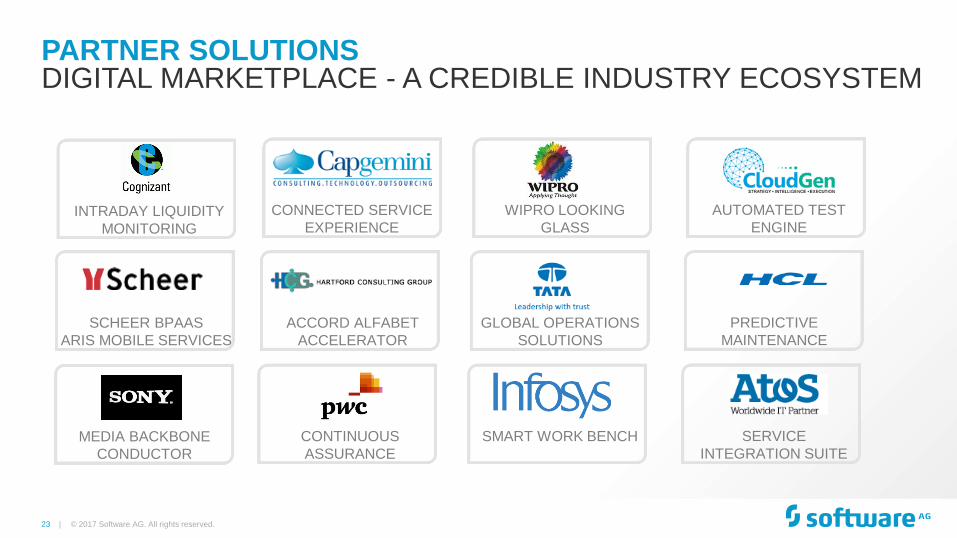
PARTNER SOLUTIONS DIGITAL MARKETPLACE - A CREDIBLE INDUSTRY ECOSYSTEM
MEDIA BACKBONE
CONDUCTOR
SCHEER BPAAS
ARIS MOBILE SERVICES
INTRADAY LIQUIDITY
MONITORING
CONNECTED SERVICE
EXPERIENCE
ACCORD ALFABET
ACCELERATOR
CONTINUOUS
ASSURANCE
WIPRO LOOKING
GLASS
GLOBAL OPERATIONS
SOLUTIONS
SMART WORK BENCH
AUTOMATED TEST
ENGINE
PREDICTIVE
MAINTENANCE
SERVICE
INTEGRATION SUITE
© 2017 Software AG. All rights reserved.
24 |
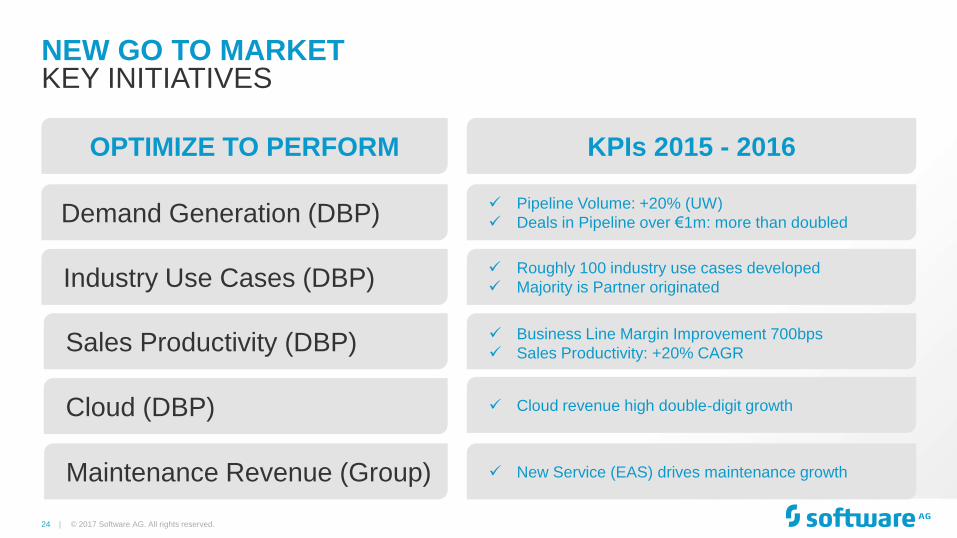
NEW GO TO MARKET KEY INITIATIVES
Pipeline Volume: +20% (UW)
Deals in Pipeline over €1m: more than doubled
New Service (EAS) drives maintenance growth
KPIs 2015 - 2016
Demand Generation (DBP)
Industry Use Cases (DBP)
Maintenance Revenue (Group)
Sales Productivity (DBP)
OPTIMIZE TO PERFORM
© 2017 Software AG. All rights reserved.
Cloud (DBP)
Business Line Margin Improvement 700bps
Sales Productivity: +20% CAGR
Cloud revenue high double-digit growth
Roughly 100 industry use cases developed
Majority is Partner originated
25 |
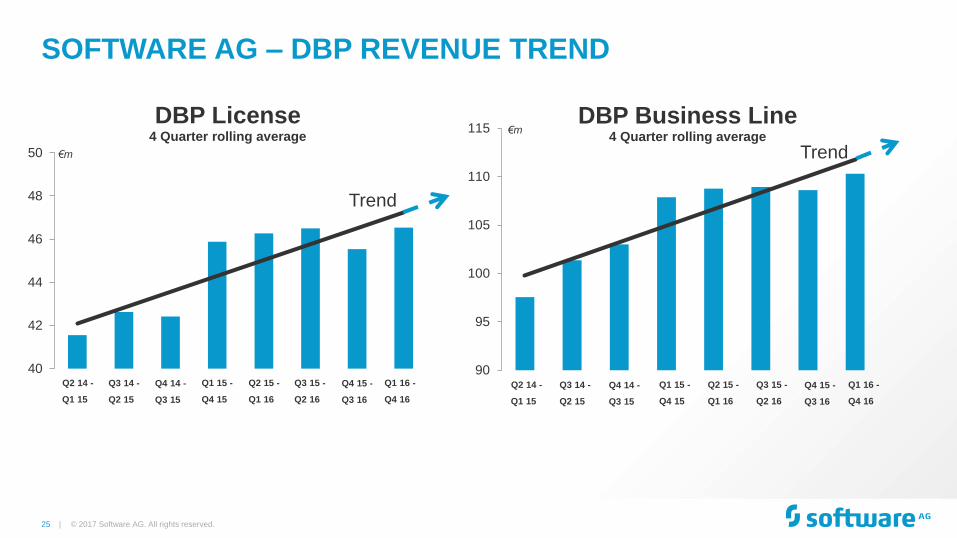
90
95
100
105
110
115DBP Business Line
4 Quarter rolling average
SOFTWARE AG – DBP REVENUE TREND
© 2017 Software AG. All rights reserved.
€m
40
42
44
46
48
50
DBP License 4 Quarter rolling average
Trend
€m
Q2 14 -
Q1 15
Q3 14 -
Q2 15
Q4 14 -
Q3 15
Q1 15 -
Q4 15
Q2 15 -
Q1 16
Q3 15 -
Q2 16
Q4 15 -
Q3 16
Q1 16 -
Q4 16
Trend
Q2 14 -
Q1 15
Q3 14 -
Q2 15
Q4 14 -
Q3 15
Q1 15 -
Q4 15
Q2 15 -
Q1 16
Q3 15 -
Q2 16
Q4 15 -
Q3 16
Q1 16 -
Q4 16
26 |
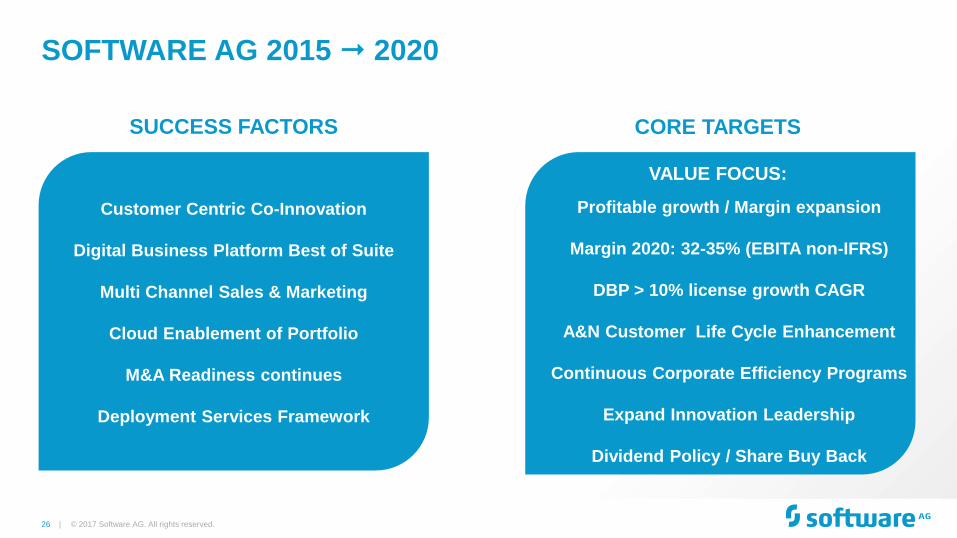
SOFTWARE AG 2015 2020
© 2017 Software AG. All rights reserved.
SUCCESS FACTORS
Customer Centric Co-Innovation
Digital Business Platform Best of Suite
Multi Channel Sales & Marketing
Cloud Enablement of Portfolio
M&A Readiness continues
Deployment Services Framework
CORE TARGETS
Profitable growth / Margin expansion
Margin 2020: 32-35% (EBITA non-IFRS)
DBP > 10% license growth CAGR
A&N Customer Life Cycle Enhancement
Continuous Corporate Efficiency Programs
Expand Innovation Leadership
Dividend Policy / Share Buy Back
VALUE FOCUS:
27 |
INDEX
© 2017 Software AG. All rights reserved.
Key Value Investment Indicators 1. 7
Business Model, Characteristics & GTM 2. 21
Markets, Positioning & Competition 3. 28
Digital Business Platform - Core Capabilities 4. 37
Customers References & Use Cases 5. 44
Financials 6. 57
Shares & Ownership 7. 73
28 |
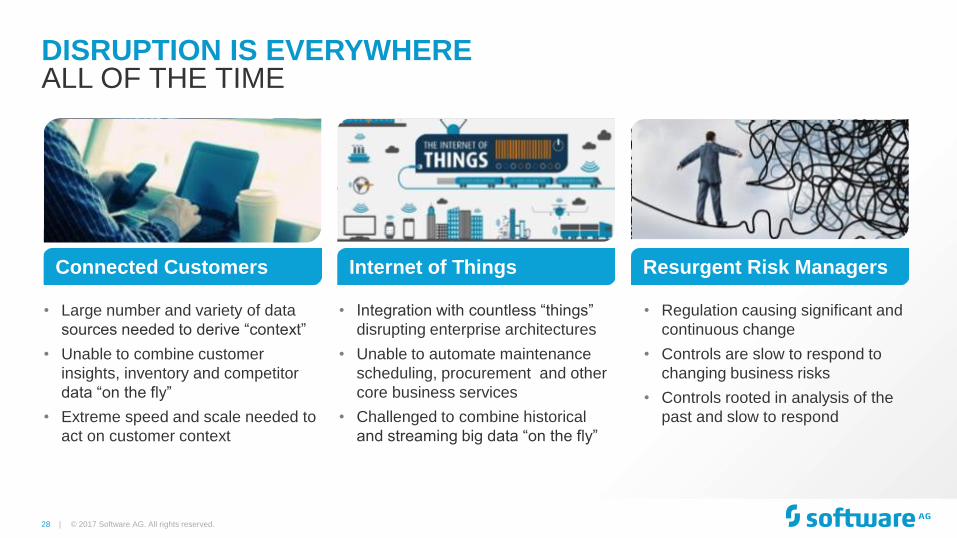
DISRUPTION IS EVERYWHERE ALL OF THE TIME
Resurgent Risk Managers Connected Customers Internet of Things
• Regulation causing significant and
continuous change
• Controls are slow to respond to
changing business risks
• Controls rooted in analysis of the
past and slow to respond
• Large number and variety of data
sources needed to derive “context”
• Unable to combine customer
insights, inventory and competitor
data “on the fly”
• Extreme speed and scale needed to
act on customer context
• Integration with countless “things”
disrupting enterprise architectures
• Unable to automate maintenance
scheduling, procurement and other
core business services
• Challenged to combine historical
and streaming big data “on the fly”
© 2017 Software AG. All rights reserved.
29 | © 2017 Software AG. All rights reserved.
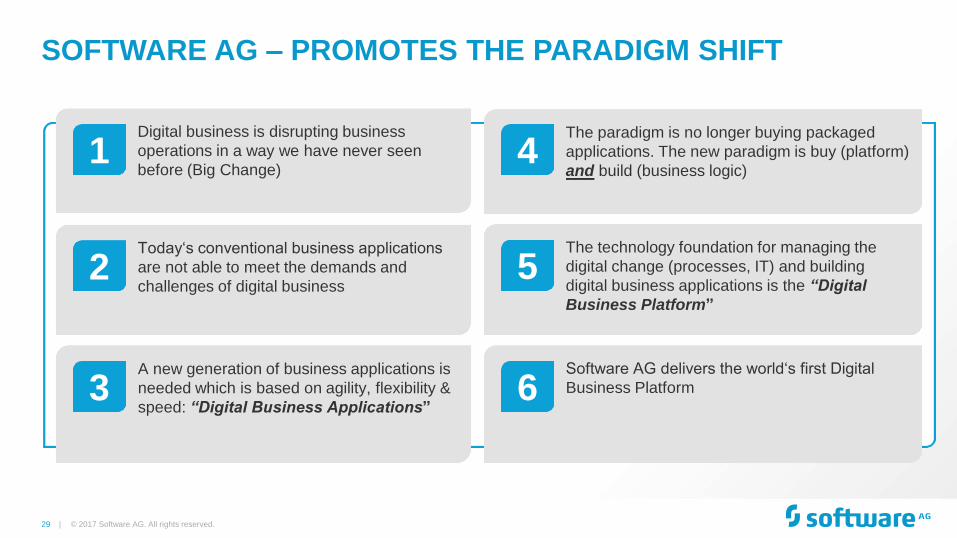
Digital business is disrupting business
operations in a way we have never seen
before (Big Change)
1
Today‘s conventional business applications
are not able to meet the demands and
challenges of digital business 2
A new generation of business applications is
needed which is based on agility, flexibility &
speed: “Digital Business Applications”
3
The technology foundation for managing the
digital change (processes, IT) and building
digital business applications is the “Digital
Business Platform”
5
The paradigm is no longer buying packaged
applications. The new paradigm is buy (platform)
and build (business logic) 4
Software AG delivers the world‘s first Digital
Business Platform 6
SOFTWARE AG – PROMOTES THE PARADIGM SHIFT
30 |
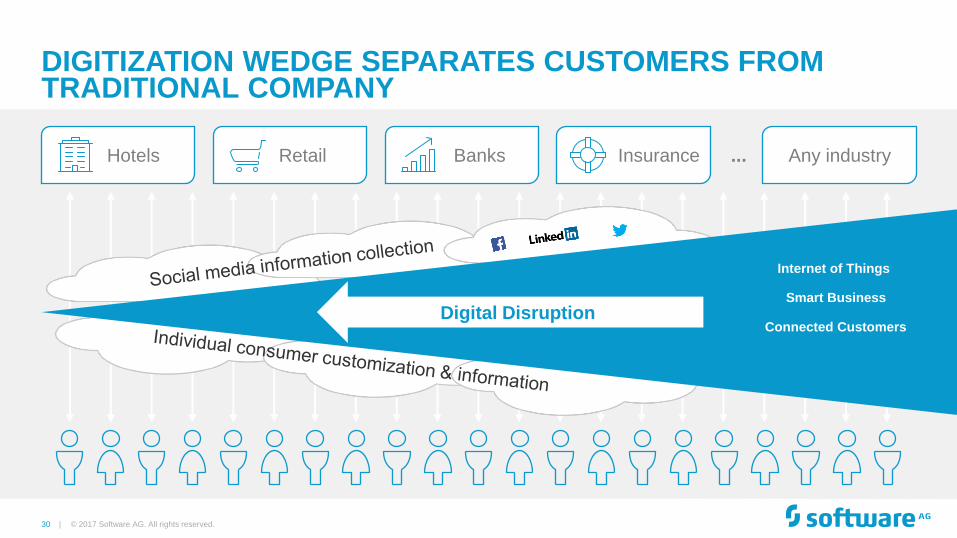
DIGITIZATION WEDGE SEPARATES CUSTOMERS FROM TRADITIONAL COMPANY
DIGITAL DISRUPTION
Any industry ... Retail Hotels Banks Insurance
© 2017 Software AG. All rights reserved.
Digital Disruption
Internet of Things
Smart Business
Connected Customers
31 |
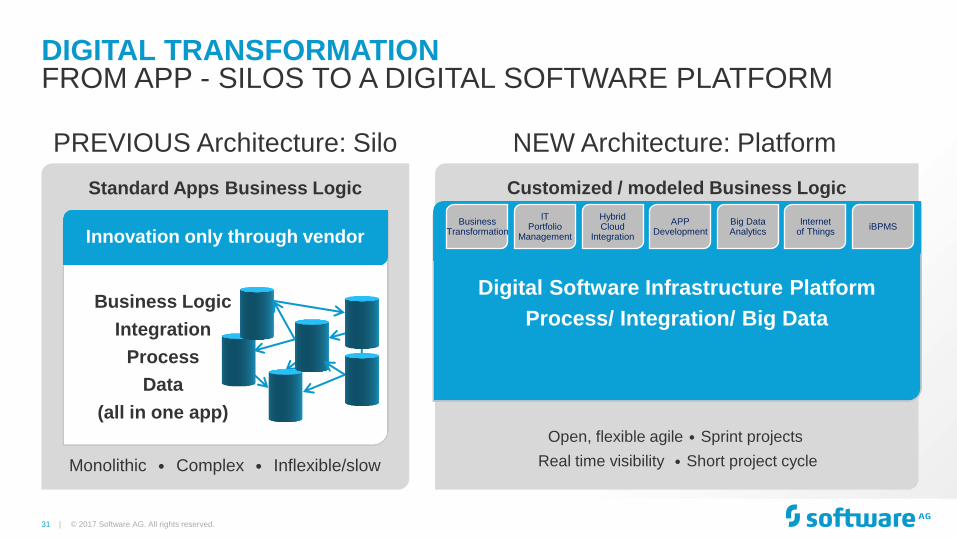
Customized / modeled Business Logic Standard Apps Business Logic
DIGITAL TRANSFORMATION
Innovation only through vendor
Open, flexible agile • Sprint projects
Real time visibility • Short project cycle
PREVIOUS Architecture: Silo NEW Architecture: Platform
Monolithic • Complex • Inflexible/slow
Business Logic
Integration
Process
Data
(all in one app)
FROM APP - SILOS TO A DIGITAL SOFTWARE PLATFORM
Business Transformation
IT Portfolio
Management
Hybrid Cloud
Integration
APP Development
Big Data Analytics
Internet of Things
iBPMS
Digital Software Infrastructure Platform
Process/ Integration/ Big Data
© 2017 Software AG. All rights reserved.
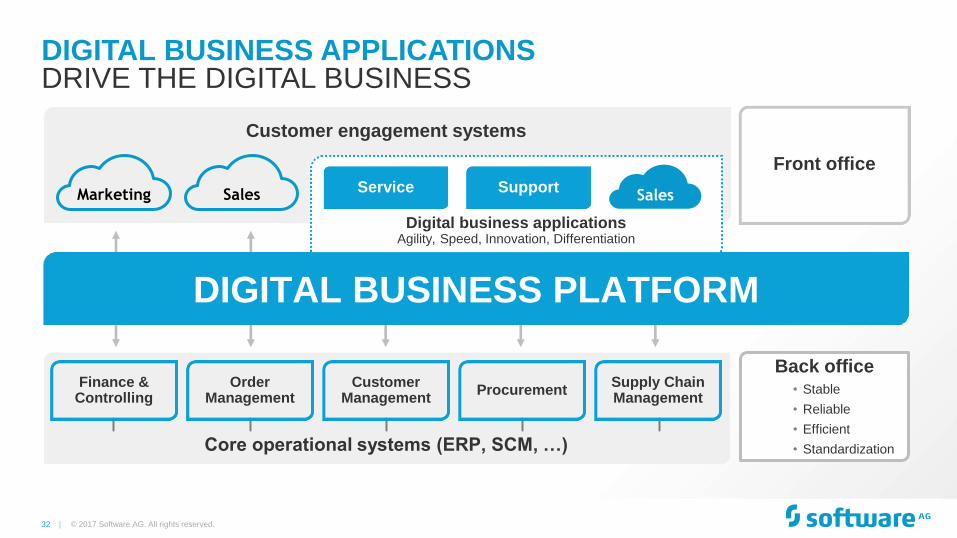
32 |
Front office
Customer engagement systems
DIGITAL BUSINESS PLATFORM
Core operational systems (ERP, SCM, …)
Finance & Controlling
Order Management
Customer Management
Procurement Supply Chain Management
Digital business applications Agility, Speed, Innovation, Differentiation
Sales Service Support
DIGITAL BUSINESS PLATFORM
Marketing
Sales
Back office • Stable
• Reliable
• Efficient
• Standardization
DIGITAL BUSINESS APPLICATIONS
© 2017 Software AG. All rights reserved.
DRIVE THE DIGITAL BUSINESS
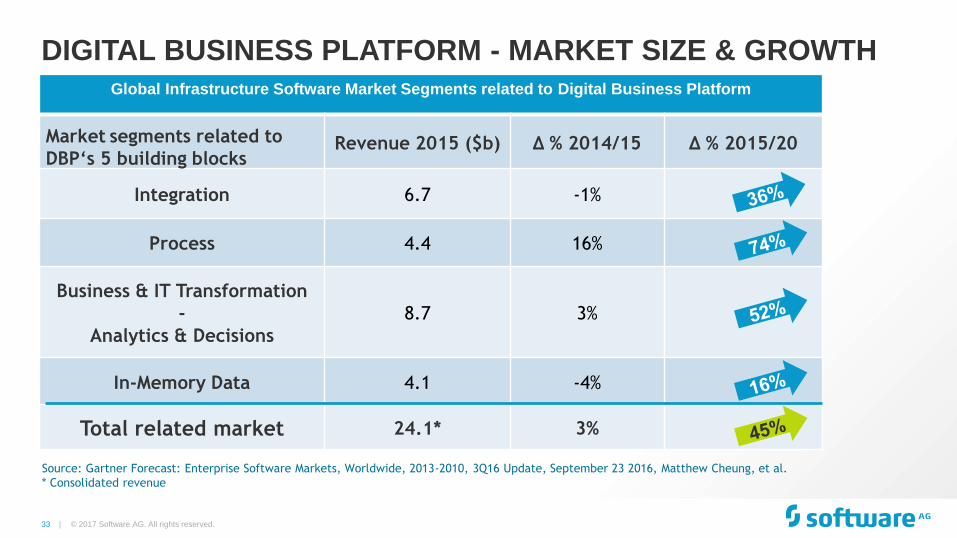
33 | © 2017 Software AG. All rights reserved.
Global Infrastructure Software Market Segments related to Digital Business Platform
Market segments related to
DBP‘s 5 building blocks Revenue 2015 ($b) Δ % 2014/15 Δ % 2015/20
Integration 6.7 -1%
Process 4.4 16%
Business & IT Transformation
-
Analytics & Decisions
8.7 3%
In-Memory Data 4.1 -4%
Total related market 24.1* 3%
Source: Gartner Forecast: Enterprise Software Markets, Worldwide, 2013-2010, 3Q16 Update, September 23 2016, Matthew Cheung, et al.
* Consolidated revenue
DIGITAL BUSINESS PLATFORM - MARKET SIZE & GROWTH
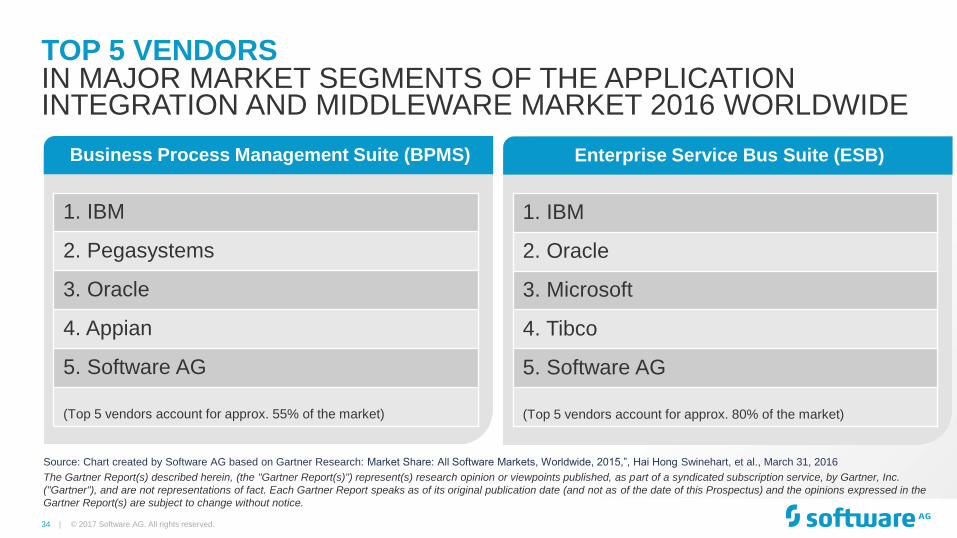
34 |
TOP 5 VENDORS
© 2017 Software AG. All rights reserved.
IN MAJOR MARKET SEGMENTS OF THE APPLICATION INTEGRATION AND MIDDLEWARE MARKET 2016 WORLDWIDE
Business Process Management Suite (BPMS)
1. IBM
2. Pegasystems
3. Oracle
4. Appian
5. Software AG
(Top 5 vendors account for approx. 55% of the market)
Enterprise Service Bus Suite (ESB)
1. IBM
2. Oracle
3. Microsoft
4. Tibco
5. Software AG
(Top 5 vendors account for approx. 80% of the market)
Source: Chart created by Software AG based on Gartner Research: Market Share: All Software Markets, Worldwide, 2015,”, Hai Hong Swinehart, et al., March 31, 2016
The Gartner Report(s) described herein, (the "Gartner Report(s)") represent(s) research opinion or viewpoints published, as part of a syndicated subscription service, by Gartner, Inc.
("Gartner"), and are not representations of fact. Each Gartner Report speaks as of its original publication date (and not as of the date of this Prospectus) and the opinions expressed in the
Gartner Report(s) are subject to change without notice.
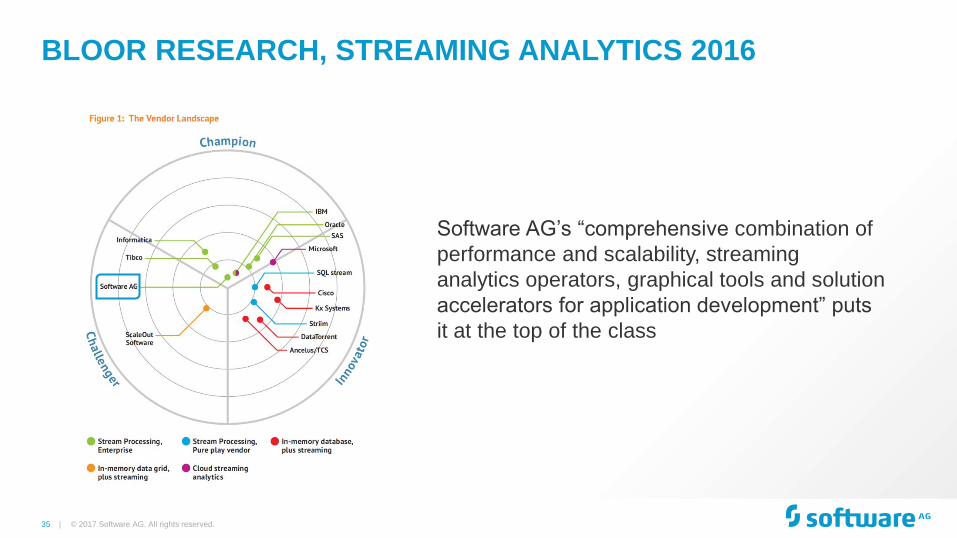
35 |
BLOOR RESEARCH, STREAMING ANALYTICS 2016
© 2017 Software AG. All rights reserved.
Software AG’s “comprehensive combination of
performance and scalability, streaming
analytics operators, graphical tools and solution
accelerators for application development” puts
it at the top of the class
36 |
INDEX
© 2017 Software AG. All rights reserved.
Key Value Investment Indicators 1. 7
Business Model, Characteristics & GTM 2. 21
Markets, Positioning & Competition 3. 28
Digital Business Platform - Core Capabilities 4. 37
Customers References & Use Cases 5. 44
Financials 6. 57
Shares & Ownership 7. 73
37 |
© 2017 Software AG. All rights reserved.
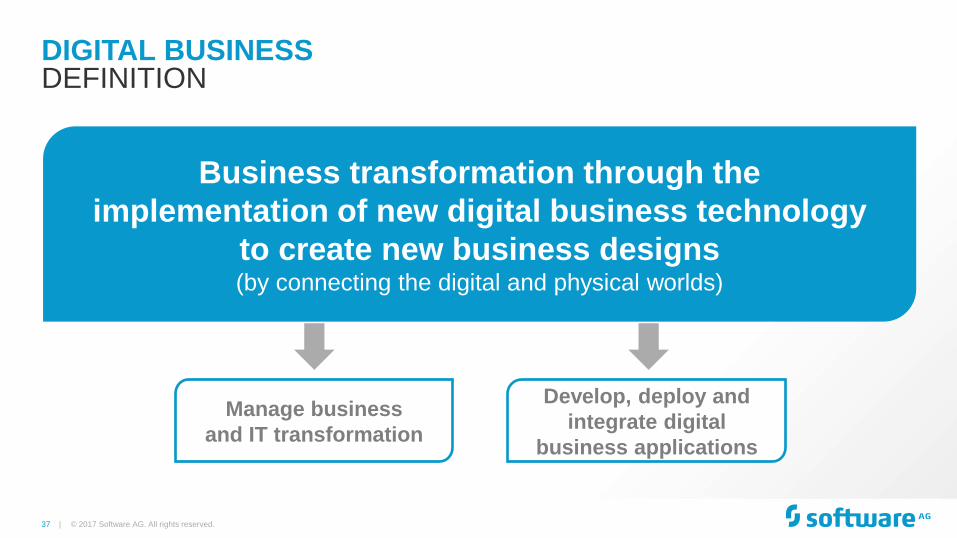
DIGITAL BUSINESS DEFINITION
Business transformation through the
implementation of new digital business technology
to create new business designs (by connecting the digital and physical worlds)
Manage business
and IT transformation
Develop, deploy and
integrate digital
business applications
38 |
© 2017 Software AG. All rights reserved.
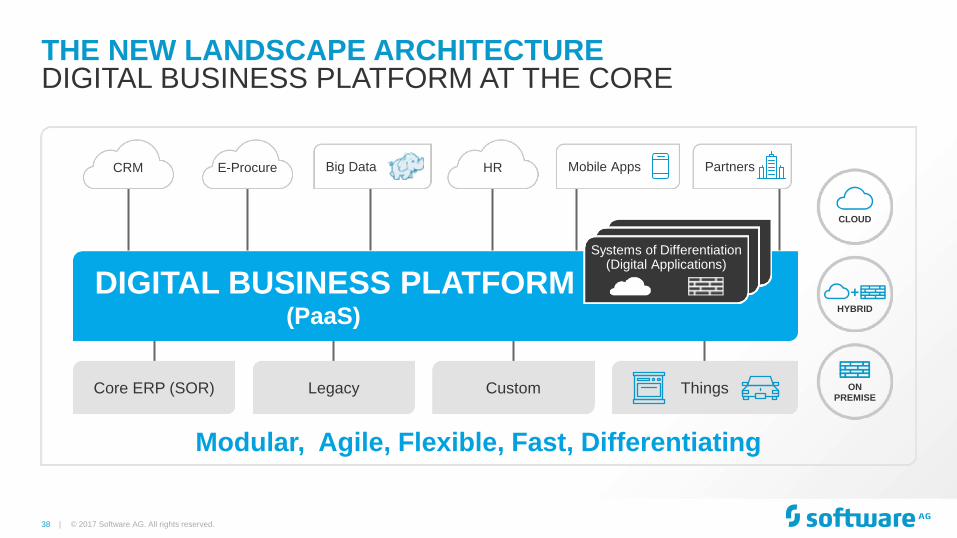
Core ERP (SOR) Legacy Custom Things
E-Procure CRM HR
THE NEW LANDSCAPE ARCHITECTURE DIGITAL BUSINESS PLATFORM AT THE CORE
DIGITAL BUSINESS PLATFORM (PaaS)
+ HYBRID
CLOUD
ON PREMISE
Systems of Differentiation (Digital Applications)
Big Data Mobile Apps Partners
Modular, Agile, Flexible, Fast, Differentiating

39 |
DIGITAL BUSINESS PLATFORM 5 BUILDING BLOCKS
ANALYTICS & DECISIONS
Enabling faster and better decisions
PROCESS
Combining people, business and things
INTEGRATION
Connecting multiple endpoints
IN-MEMORY DATA
Providing performance and scale
BUSINESS & IT
TRANSFORMATION
Manage and govern
the change
+ HYBRID
CLOUD
ON PREMISE
© 2017 Software AG. All rights reserved.
40 |
© 2017 Software AG. All rights reserved.
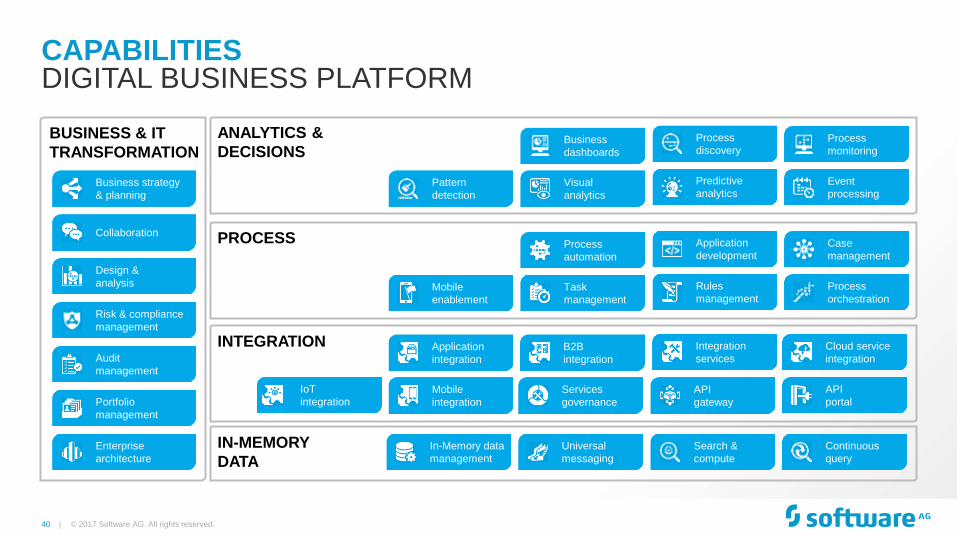
DIGITAL BUSINESS PLATFORM CAPABILITIES
Business strategy
& planning
Collaboration
Design &
analysis
Risk & compliance
management
Audit
management
Portfolio
management
Enterprise
architecture
BUSINESS & IT
TRANSFORMATION
PROCESS
IoT
integration
INTEGRATION
Pattern
detection
Mobile
enablement
Application
integration
Mobile
integration
In-Memory data
management
Visual
analytics
Business
dashboards
Process
automation
Task
management
B2B
integration
Services
governance
Universal
messaging
Predictive
analytics
Process
discovery
Application
development
Rules
management
API
gateway
Integration
services
Search &
compute
Event
processing
Process
monitoring
Case
management
Process
orchestration
API
portal
Cloud service
integration
Continuous
query
IN-MEMORY
DATA
ANALYTICS &
DECISIONS
41 |
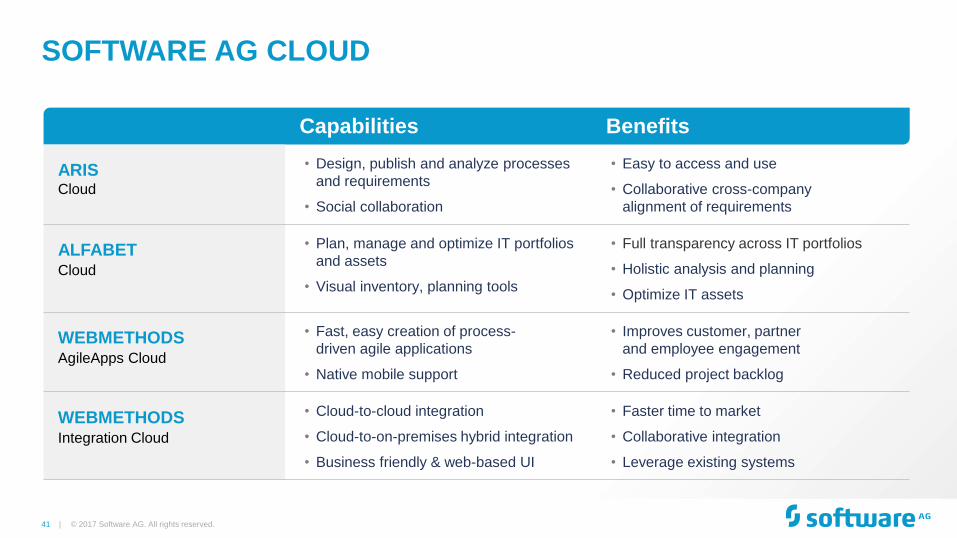
SOFTWARE AG CLOUD
Capabilities Benefits
ARIS Cloud
• Design, publish and analyze processes
and requirements
• Social collaboration
• Easy to access and use
• Collaborative cross-company
alignment of requirements
ALFABET Cloud
• Plan, manage and optimize IT portfolios
and assets
• Visual inventory, planning tools
• Full transparency across IT portfolios
• Holistic analysis and planning
• Optimize IT assets
WEBMETHODS AgileApps Cloud
• Fast, easy creation of process-
driven agile applications
• Native mobile support
• Improves customer, partner
and employee engagement
• Reduced project backlog
WEBMETHODS Integration Cloud
• Cloud-to-cloud integration
• Cloud-to-on-premises hybrid integration
• Business friendly & web-based UI
• Faster time to market
• Collaborative integration
• Leverage existing systems
© 2017 Software AG. All rights reserved.
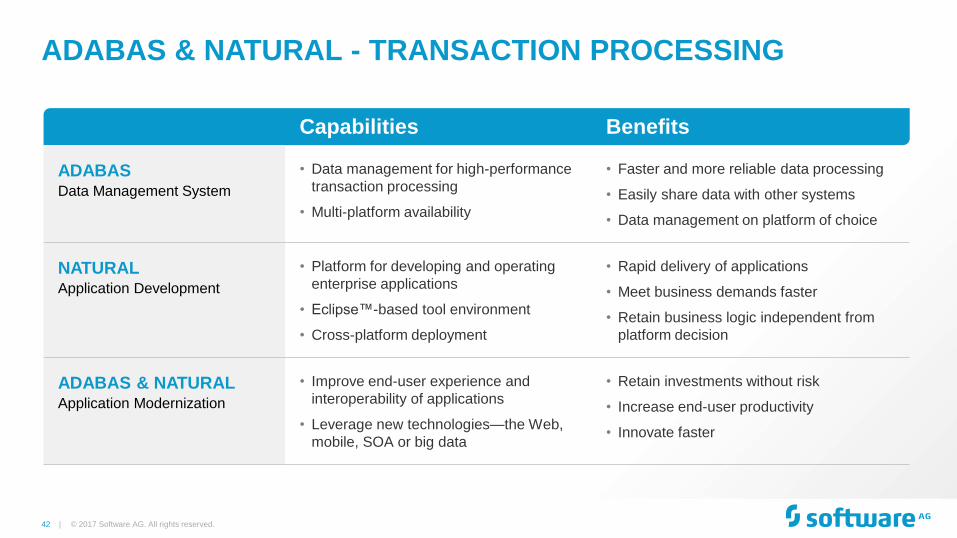
42 |
Capabilities Benefits
ADABAS Data Management System
• Data management for high-performance
transaction processing
• Multi-platform availability
• Faster and more reliable data processing
• Easily share data with other systems
• Data management on platform of choice
NATURAL Application Development
• Platform for developing and operating
enterprise applications
• Eclipse™-based tool environment
• Cross-platform deployment
• Rapid delivery of applications
• Meet business demands faster
• Retain business logic independent from
platform decision
ADABAS & NATURAL Application Modernization
• Improve end-user experience and
interoperability of applications
• Leverage new technologies—the Web,
mobile, SOA or big data
• Retain investments without risk
• Increase end-user productivity
• Innovate faster
ADABAS & NATURAL - TRANSACTION PROCESSING
© 2017 Software AG. All rights reserved.
43 |
INDEX
© 2017 Software AG. All rights reserved.
Key Value Investment Indicators 1. 7
Business Model, Characteristics & GTM 2. 21
Markets, Positioning & Competition 3. 28
Digital Business Platform - Core Capabilities 4. 37
Customers References & Use Cases 5. 44
Financials 6. 57
Shares & Ownership 7. 73
44 |
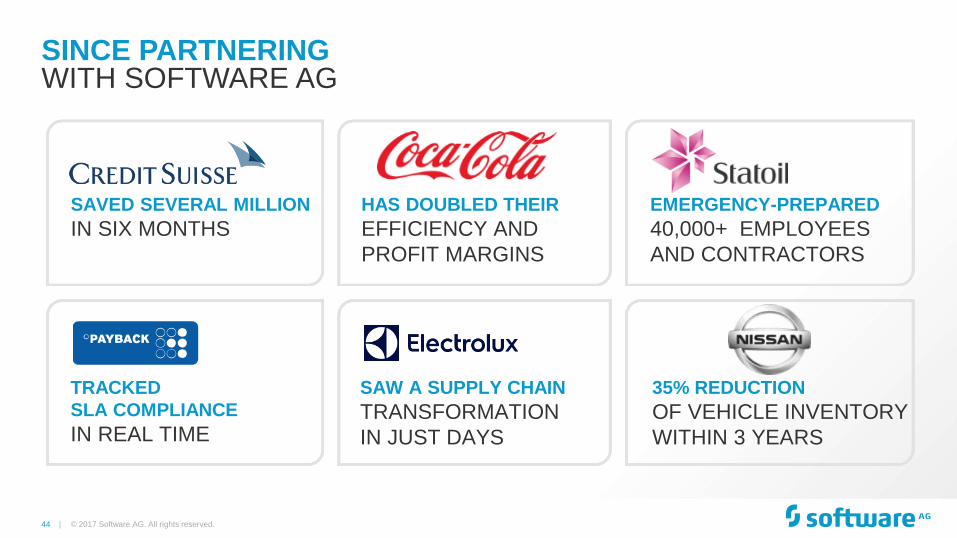
SINCE PARTNERING WITH SOFTWARE AG
SAVED SEVERAL MILLION
IN SIX MONTHS
HAS DOUBLED THEIR
EFFICIENCY AND
PROFIT MARGINS
EMERGENCY-PREPARED
40,000+ EMPLOYEES
AND CONTRACTORS
TRACKED
SLA COMPLIANCE
IN REAL TIME
SAW A SUPPLY CHAIN
TRANSFORMATION
IN JUST DAYS
35% REDUCTION
OF VEHICLE INVENTORY
WITHIN 3 YEARS
© 2017 Software AG. All rights reserved.
45 |
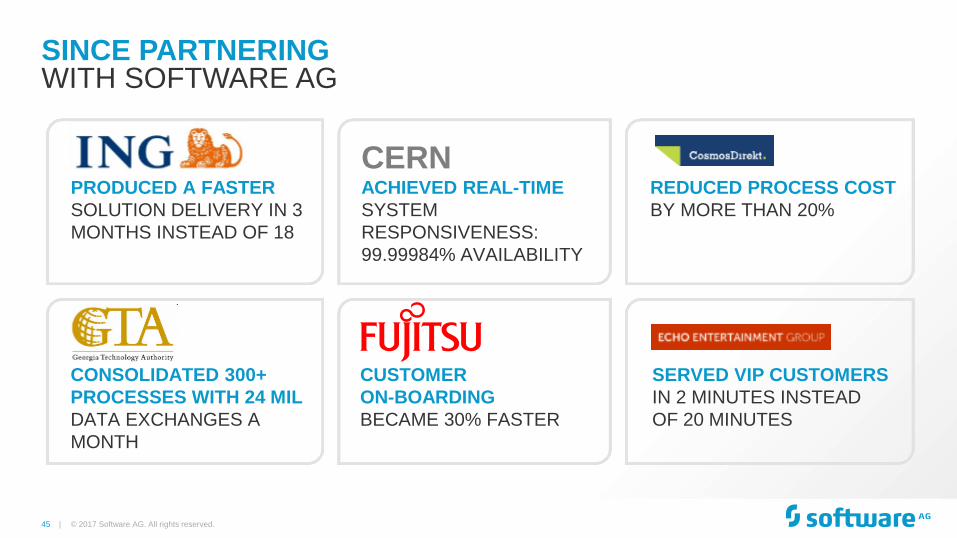
SINCE PARTNERING WITH SOFTWARE AG
PRODUCED A FASTER
SOLUTION DELIVERY IN 3
MONTHS INSTEAD OF 18
ACHIEVED REAL-TIME
SYSTEM
RESPONSIVENESS:
99.99984% AVAILABILITY
CERN REDUCED PROCESS COST
BY MORE THAN 20%
CONSOLIDATED 300+
PROCESSES WITH 24 MIL
DATA EXCHANGES A
MONTH
CUSTOMER
ON-BOARDING
BECAME 30% FASTER
SERVED VIP CUSTOMERS
IN 2 MINUTES INSTEAD
OF 20 MINUTES
© 2017 Software AG. All rights reserved.
46 |
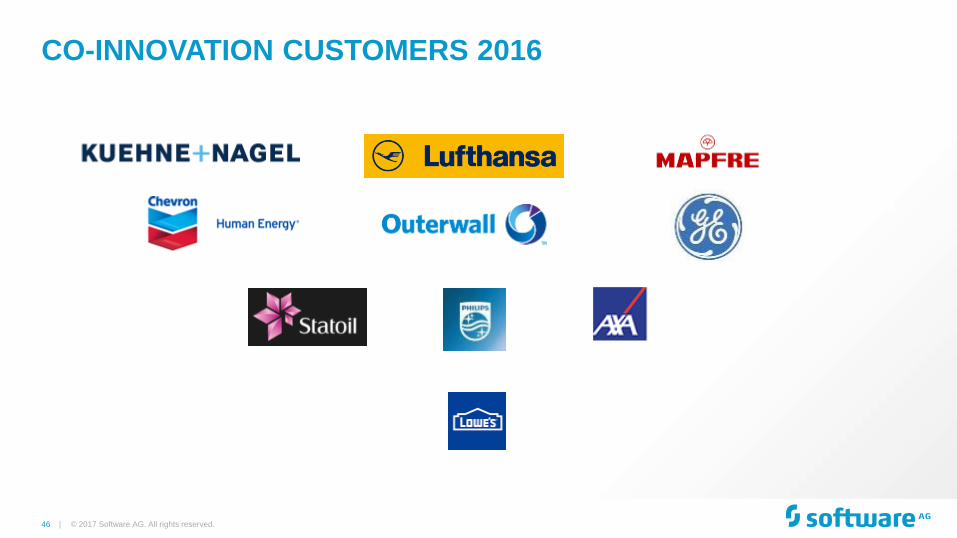
CO-INNOVATION CUSTOMERS 2016
© 2017 Software AG. All rights reserved.
47 |
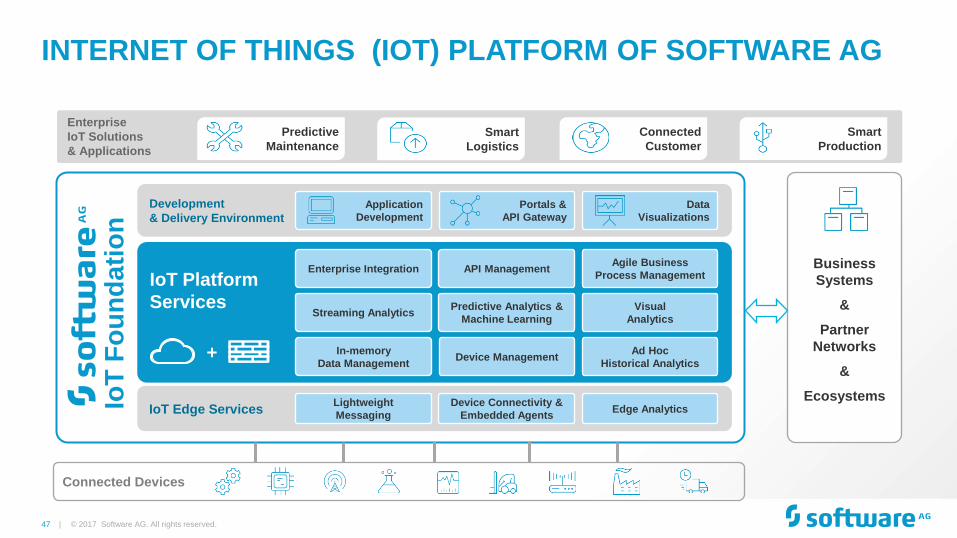
INTERNET OF THINGS (IOT) PLATFORM OF SOFTWARE AG
Connected Devices
Enterprise
IoT Solutions
& Applications
Predictive
Maintenance
Smart
Production
Connected
Customer
Smart
Logistics
Development
& Delivery Environment
Application
Development
Portals &
API Gateway
Data
Visualizations
IoT Edge Services Lightweight
Messaging Edge Analytics
Device Connectivity &
Embedded Agents
© 2017 Software AG. All rights reserved.
Business
Systems
&
Partner
Networks
&
Ecosystems
IoT Platform
Services
Agile Business
Process Management
Predictive Analytics &
Machine Learning Streaming Analytics
In-memory
Data Management
Enterprise Integration
Visual
Analytics
Device Management Ad Hoc
Historical Analytics
API Management
+
IoT
Fo
un
dati
on
48 |
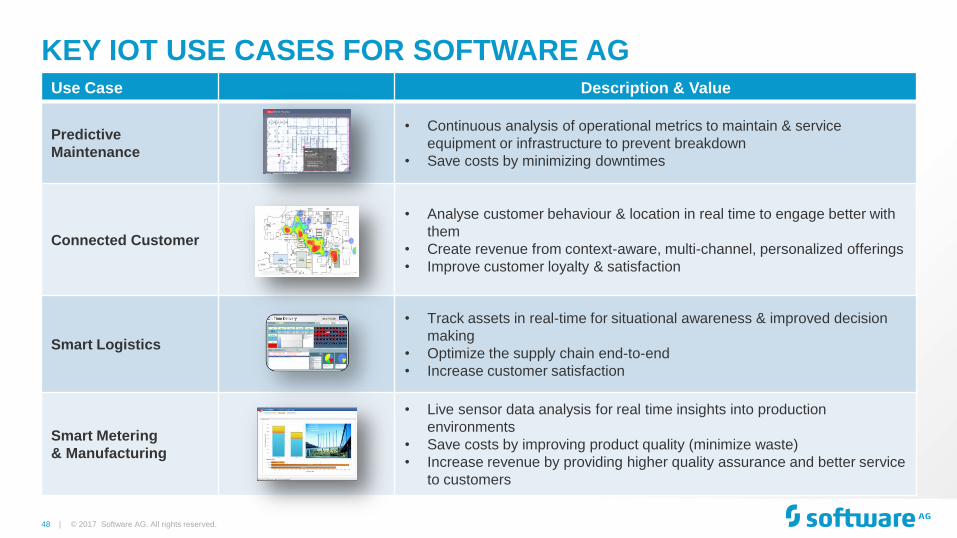
KEY IOT USE CASES FOR SOFTWARE AG Use Case Description & Value
Predictive
Maintenance
• Continuous analysis of operational metrics to maintain & service
equipment or infrastructure to prevent breakdown
• Save costs by minimizing downtimes
Connected Customer
• Analyse customer behaviour & location in real time to engage better with
them
• Create revenue from context-aware, multi-channel, personalized offerings
• Improve customer loyalty & satisfaction
Smart Logistics
• Track assets in real-time for situational awareness & improved decision
making
• Optimize the supply chain end-to-end
• Increase customer satisfaction
Smart Metering
& Manufacturing
• Live sensor data analysis for real time insights into production
environments
• Save costs by improving product quality (minimize waste)
• Increase revenue by providing higher quality assurance and better service
to customers
© 2017 Software AG. All rights reserved.
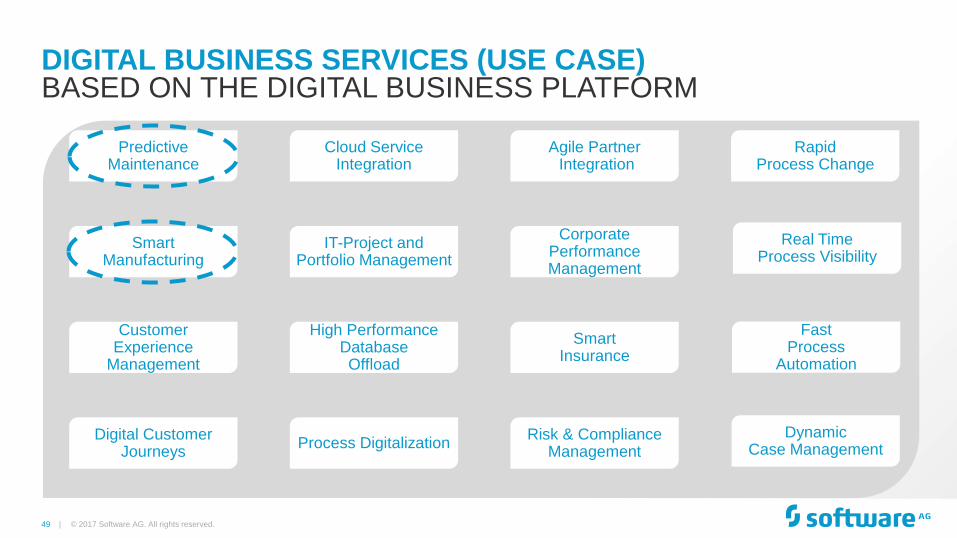
49 |
Predictive Maintenance
Cloud Service Integration
Agile Partner Integration
Rapid Process Change
Smart Manufacturing
IT-Project and Portfolio Management
Corporate Performance Management
Customer Experience
Management
High Performance Database Offload
Smart Insurance
Digital Customer Journeys
Process Digitalization Risk & Compliance
Management
Real Time Process Visibility
Fast Process
Automation
Dynamic Case Management
© 2017 Software AG. All rights reserved.
DIGITAL BUSINESS SERVICES (USE CASE) BASED ON THE DIGITAL BUSINESS PLATFORM
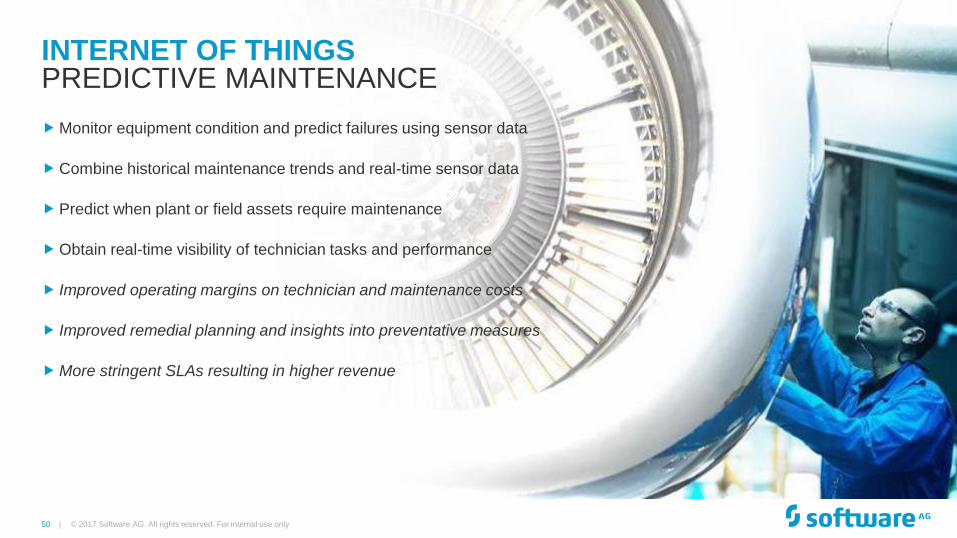
50 |
INTERNET OF THINGS
© 2017 Software AG. All rights reserved. For internal use only
PREDICTIVE MAINTENANCE Monitor equipment condition and predict failures using sensor data
Combine historical maintenance trends and real-time sensor data
Predict when plant or field assets require maintenance
Obtain real-time visibility of technician tasks and performance
Improved operating margins on technician and maintenance costs
Improved remedial planning and insights into preventative measures
More stringent SLAs resulting in higher revenue
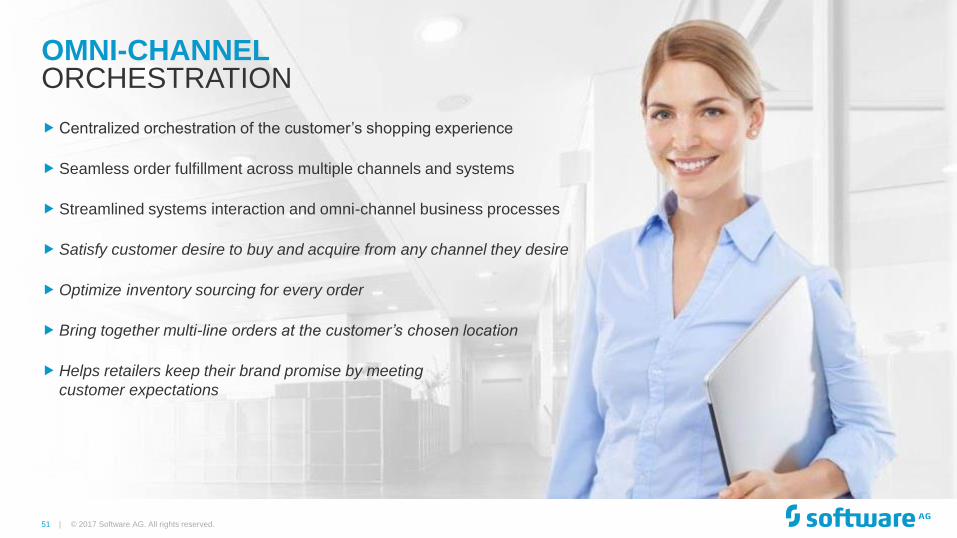
51 |
OMNI-CHANNEL
© 2017 Software AG. All rights reserved.
ORCHESTRATION
Centralized orchestration of the customer’s shopping experience
Seamless order fulfillment across multiple channels and systems
Streamlined systems interaction and omni-channel business processes
Satisfy customer desire to buy and acquire from any channel they desire
Optimize inventory sourcing for every order
Bring together multi-line orders at the customer’s chosen location
Helps retailers keep their brand promise by meeting
customer expectations
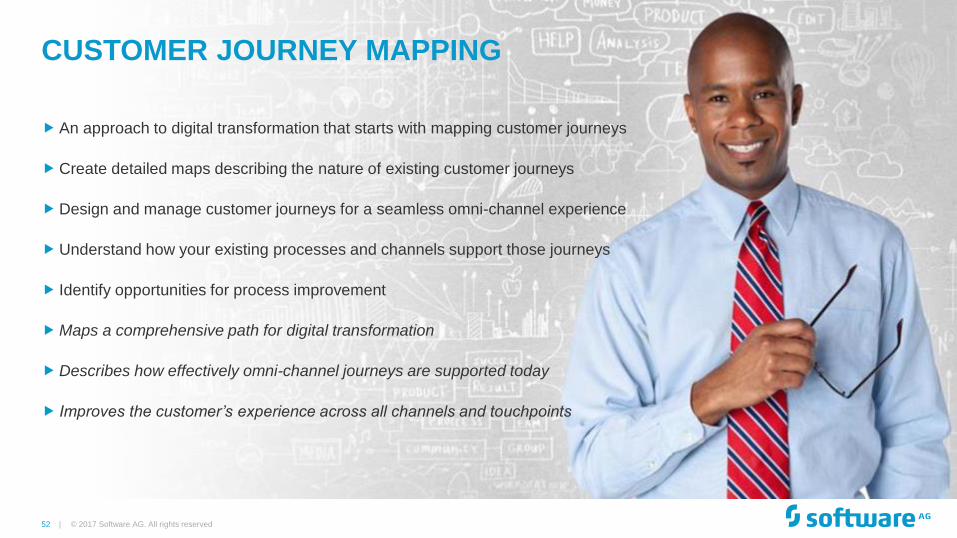
52 |
CUSTOMER JOURNEY MAPPING
© 2017 Software AG. All rights reserved
An approach to digital transformation that starts with mapping customer journeys
Create detailed maps describing the nature of existing customer journeys
Design and manage customer journeys for a seamless omni-channel experience
Understand how your existing processes and channels support those journeys
Identify opportunities for process improvement
Maps a comprehensive path for digital transformation
Describes how effectively omni-channel journeys are supported today
Improves the customer’s experience across all channels and touchpoints
53 |
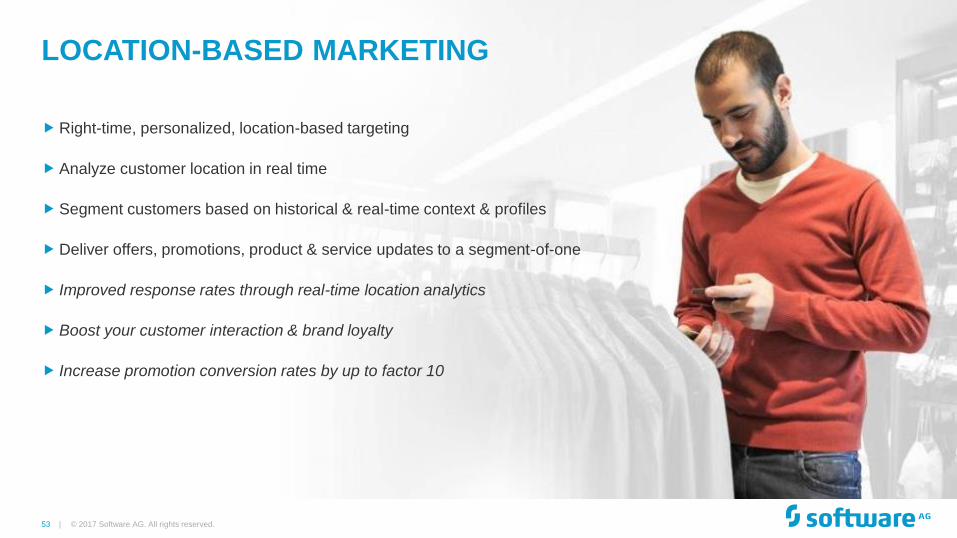
LOCATION-BASED MARKETING
© 2017 Software AG. All rights reserved.
Right-time, personalized, location-based targeting
Analyze customer location in real time
Segment customers based on historical & real-time context & profiles
Deliver offers, promotions, product & service updates to a segment-of-one
Improved response rates through real-time location analytics
Boost your customer interaction & brand loyalty
Increase promotion conversion rates by up to factor 10
54 |
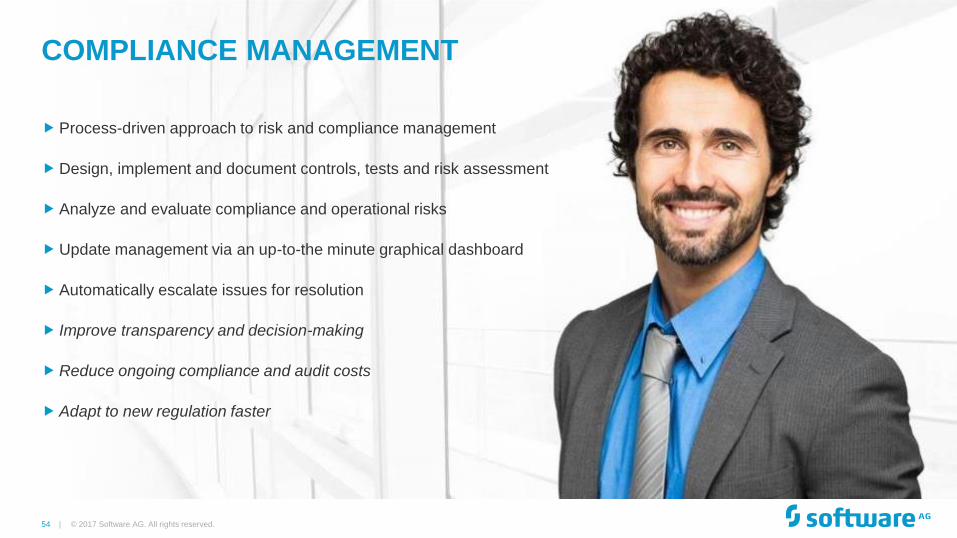
COMPLIANCE MANAGEMENT
© 2017 Software AG. All rights reserved.
Process-driven approach to risk and compliance management
Design, implement and document controls, tests and risk assessment
Analyze and evaluate compliance and operational risks
Update management via an up-to-the minute graphical dashboard
Automatically escalate issues for resolution
Improve transparency and decision-making
Reduce ongoing compliance and audit costs
Adapt to new regulation faster
55 |
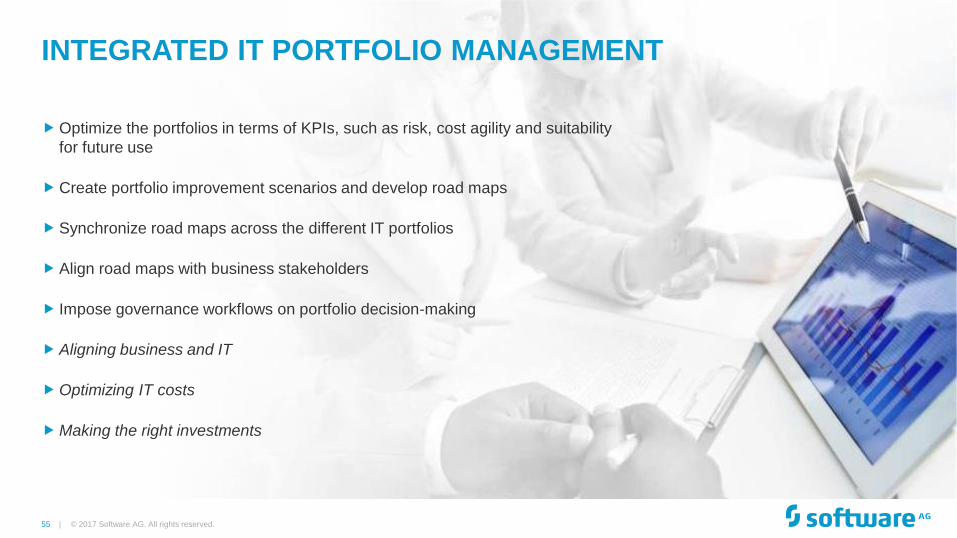
INTEGRATED IT PORTFOLIO MANAGEMENT
© 2017 Software AG. All rights reserved.
Optimize the portfolios in terms of KPIs, such as risk, cost agility and suitability
for future use
Create portfolio improvement scenarios and develop road maps
Synchronize road maps across the different IT portfolios
Align road maps with business stakeholders
Impose governance workflows on portfolio decision-making
Aligning business and IT
Optimizing IT costs
Making the right investments
56 |
INDEX
© 2017 Software AG. All rights reserved.
Key Value Investment Indicators 1. 7
Business Model, Characteristics & GTM 2. 21
Markets, Positioning & Competition 3. 28
Digital Business Platform - Core Capabilities 4. 37
Customers References & Use Cases 5. 44
Financials 6. 57
Shares & Ownership 7. 73
57 |
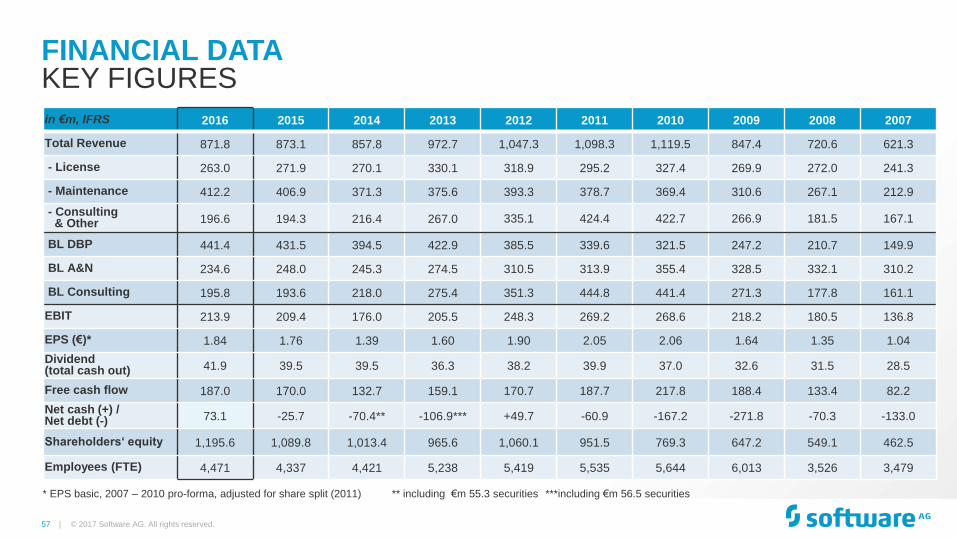
* EPS basic, 2007 – 2010 pro-forma, adjusted for share split (2011) ** including €m 55.3 securities ***including €m 56.5 securities
in €m, IFRS 2016 2015 2014 2013 2012 2011 2010 2009 2008 2007
Total Revenue 871.8 873.1 857.8 972.7 1,047.3 1,098.3 1,119.5 847.4 720.6 621.3
- License 263.0 271.9 270.1 330.1 318.9 295.2 327.4 269.9 272.0 241.3
- Maintenance 412.2 406.9 371.3 375.6 393.3 378.7 369.4 310.6 267.1 212.9
- Consulting & Other 196.6 194.3 216.4 267.0 335.1 424.4 422.7 266.9 181.5 167.1
BL DBP 441.4 431.5 394.5 422.9 385.5 339.6 321.5 247.2 210.7 149.9
BL A&N 234.6 248.0 245.3 274.5 310.5 313.9 355.4 328.5 332.1 310.2
BL Consulting 195.8 193.6 218.0 275.4 351.3 444.8 441.4 271.3 177.8 161.1
EBIT 213.9 209.4 176.0 205.5 248.3 269.2 268.6 218.2 180.5 136.8
EPS (€)* 1.84 1.76 1.39 1.60 1.90 2.05 2.06 1.64 1.35 1.04
Dividend (total cash out) 41.9 39.5 39.5 36.3 38.2 39.9 37.0 32.6 31.5 28.5
Free cash flow 187.0 170.0 132.7 159.1 170.7 187.7 217.8 188.4 133.4 82.2
Net cash (+) / Net debt (-) 73.1 -25.7 -70.4** -106.9*** +49.7 -60.9 -167.2 -271.8 -70.3 -133.0
Shareholders‘ equity 1,195.6 1,089.8 1,013.4 965.6 1,060.1 951.5 769.3 647.2 549.1 462.5
Employees (FTE) 4,471 4,337 4,421 5,238 5,419 5,535 5,644 6,013 3,526 3,479
FINANCIAL DATA
© 2017 Software AG. All rights reserved.
KEY FIGURES
58 |
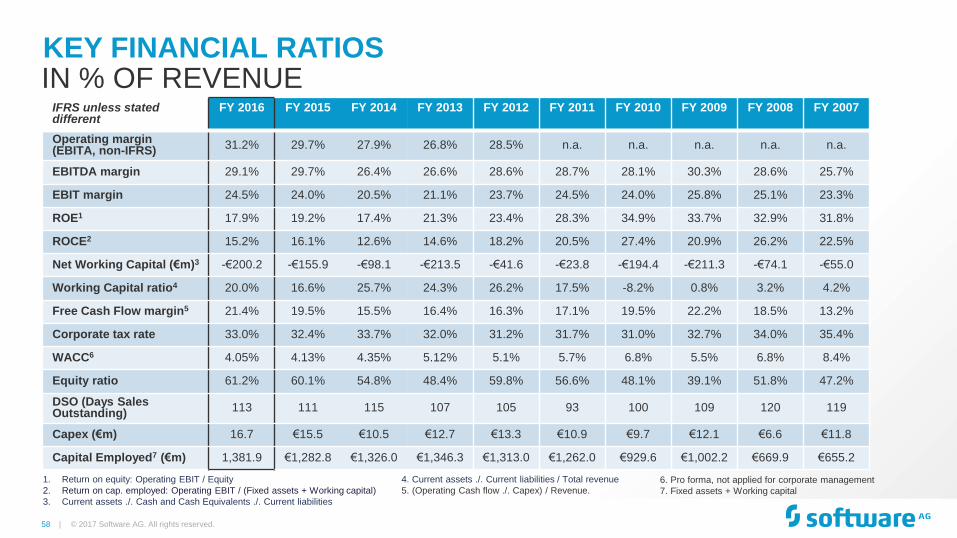
1. Return on equity: Operating EBIT / Equity
2. Return on cap. employed: Operating EBIT / (Fixed assets + Working capital)
3. Current assets ./. Cash and Cash Equivalents ./. Current liabilities
4. Current assets ./. Current liabilities / Total revenue
5. (Operating Cash flow ./. Capex) / Revenue.
IFRS unless stated different
FY 2016 FY 2015 FY 2014 FY 2013 FY 2012 FY 2011 FY 2010 FY 2009 FY 2008 FY 2007
Operating margin (EBITA, non-IFRS)
31.2% 29.7% 27.9% 26.8% 28.5% n.a. n.a. n.a. n.a. n.a.
EBITDA margin 29.1% 29.7% 26.4% 26.6% 28.6% 28.7% 28.1% 30.3% 28.6% 25.7%
EBIT margin 24.5% 24.0% 20.5% 21.1% 23.7% 24.5% 24.0% 25.8% 25.1% 23.3%
ROE1 17.9% 19.2% 17.4% 21.3% 23.4% 28.3% 34.9% 33.7% 32.9% 31.8%
ROCE2 15.2% 16.1% 12.6% 14.6% 18.2% 20.5% 27.4% 20.9% 26.2% 22.5%
Net Working Capital (€m)3 -€200.2 -€155.9 -€98.1 -€213.5 -€41.6 -€23.8 -€194.4 -€211.3 -€74.1 -€55.0
Working Capital ratio4 20.0% 16.6% 25.7% 24.3% 26.2% 17.5% -8.2% 0.8% 3.2% 4.2%
Free Cash Flow margin5 21.4% 19.5% 15.5% 16.4% 16.3% 17.1% 19.5% 22.2% 18.5% 13.2%
Corporate tax rate 33.0% 32.4% 33.7% 32.0% 31.2% 31.7% 31.0% 32.7% 34.0% 35.4%
WACC6 4.05% 4.13% 4.35% 5.12% 5.1% 5.7% 6.8% 5.5% 6.8% 8.4%
Equity ratio 61.2% 60.1% 54.8% 48.4% 59.8% 56.6% 48.1% 39.1% 51.8% 47.2%
DSO (Days Sales Outstanding) 113 111 115 107 105 93 100 109 120 119
Capex (€m) 16.7 €15.5 €10.5 €12.7 €13.3 €10.9 €9.7 €12.1 €6.6 €11.8
Capital Employed7 (€m) 1,381.9 €1,282.8 €1,326.0 €1,346.3 €1,313.0 €1,262.0 €929.6 €1,002.2 €669.9 €655.2
KEY FINANCIAL RATIOS IN % OF REVENUE
6. Pro forma, not applied for corporate management
7. Fixed assets + Working capital
© 2017 Software AG. All rights reserved.
59 |
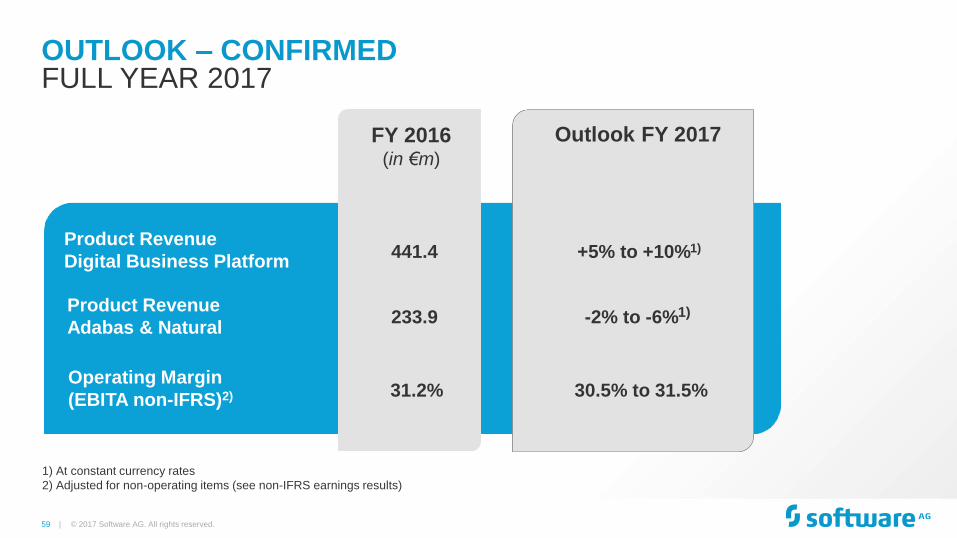
Product Revenue
Digital Business Platform
Product Revenue
Adabas & Natural
Operating Margin
(EBITA non-IFRS)2)
OUTLOOK – CONFIRMED
© 2017 Software AG. All rights reserved.
FULL YEAR 2017
1) At constant currency rates
2) Adjusted for non-operating items (see non-IFRS earnings results)
30.5% to 31.5%
-2% to -6%1)
+5% to +10%1)
Outlook FY 2017 FY 2016 (in €m)
233.9
441.4
31.2%
60 |
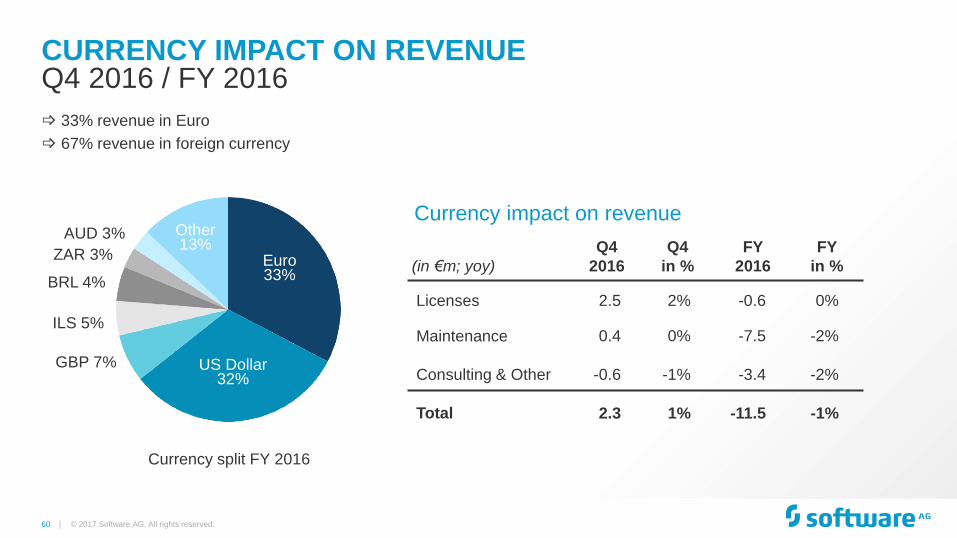
CURRENCY IMPACT ON REVENUE
© 2017 Software AG. All rights reserved.
Q4 2016 / FY 2016
Euro 33%
US Dollar 32%
Other 13%
(in €m; yoy)
Q4
2016
Q4
in %
FY
2016
FY
in %
Licenses 2.5 2% -0.6 0%
Maintenance 0.4 0% -7.5 -2%
Consulting & Other -0.6 -1% -3.4 -2%
Total 2.3 1% -11.5 -1%
Currency impact on revenue
33% revenue in Euro
67% revenue in foreign currency
Currency split FY 2016
Euro 33%
US Dollar 32%
Other 13%
BRL 4%
ZAR 3%
AUD 3%
GBP 7%
ILS 5%
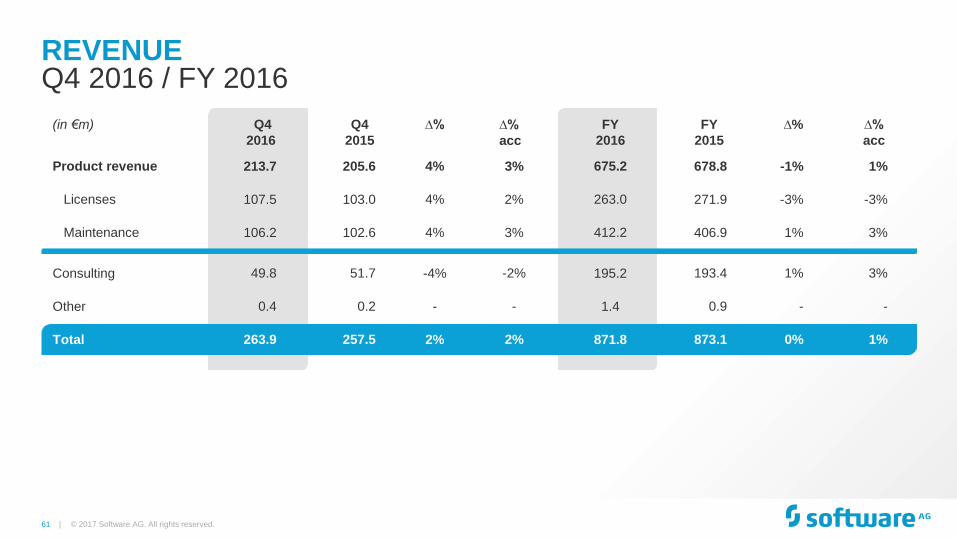
61 |
(in €m) Q4
2016
Q4
2015
∆% ∆%
acc
FY
2016
FY
2015
∆% ∆%
acc
Product revenue 213.7 205.6 4% 3% 675.2 678.8 -1% 1%
Licenses 107.5 103.0 4% 2% 263.0 271.9 -3% -3%
Maintenance 106.2 102.6 4% 3% 412.2 406.9 1% 3%
Consulting 49.8 51.7 -4% -2% 195.2 193.4 1% 3%
Other 0.4 0.2 - - 1.4 0.9 - -
Total 263.9 257.5 2% 2% 871.8 873.1 0% 1%
REVENUE
© 2017 Software AG. All rights reserved.
Q4 2016 / FY 2016
62 |
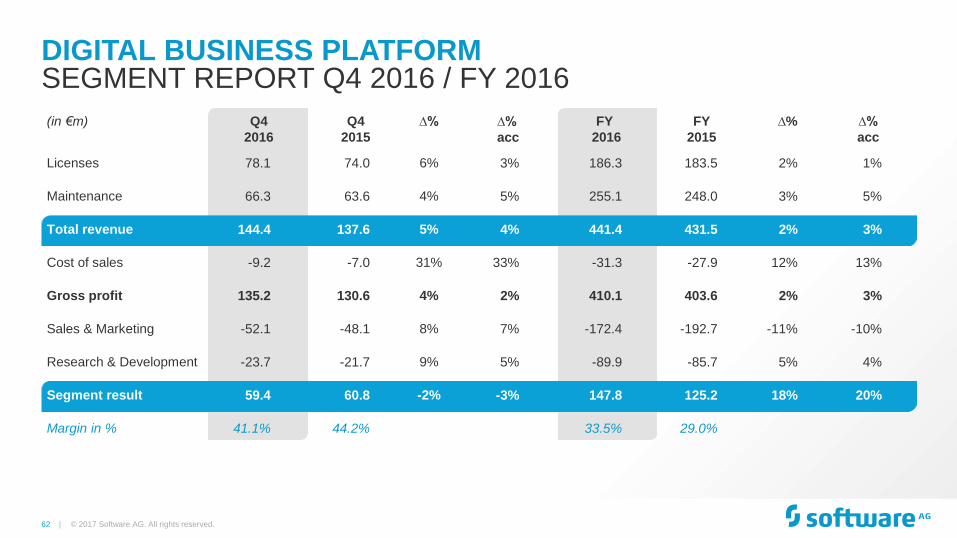
DIGITAL BUSINESS PLATFORM SEGMENT REPORT Q4 2016 / FY 2016
(in €m) Q4
2016
Q4
2015
∆% ∆%
acc
FY
2016
FY
2015
∆% ∆%
acc
Licenses 78.1 74.0 6% 3% 186.3 183.5 2% 1%
Maintenance 66.3 63.6 4% 5% 255.1 248.0 3% 5%
Total revenue 144.4 137.6 5% 4% 441.4 431.5 2% 3%
Cost of sales -9.2 -7.0 31% 33% -31.3 -27.9 12% 13%
Gross profit 135.2 130.6 4% 2% 410.1 403.6 2% 3%
Sales & Marketing -52.1 -48.1 8% 7% -172.4 -192.7 -11% -10%
Research & Development -23.7 -21.7 9% 5% -89.9 -85.7 5% 4%
Segment result 59.4 60.8 -2% -3% 147.8 125.2 18% 20%
Margin in % 41.1% 44.2% 33.5% 29.0%
© 2017 Software AG. All rights reserved.
63 |
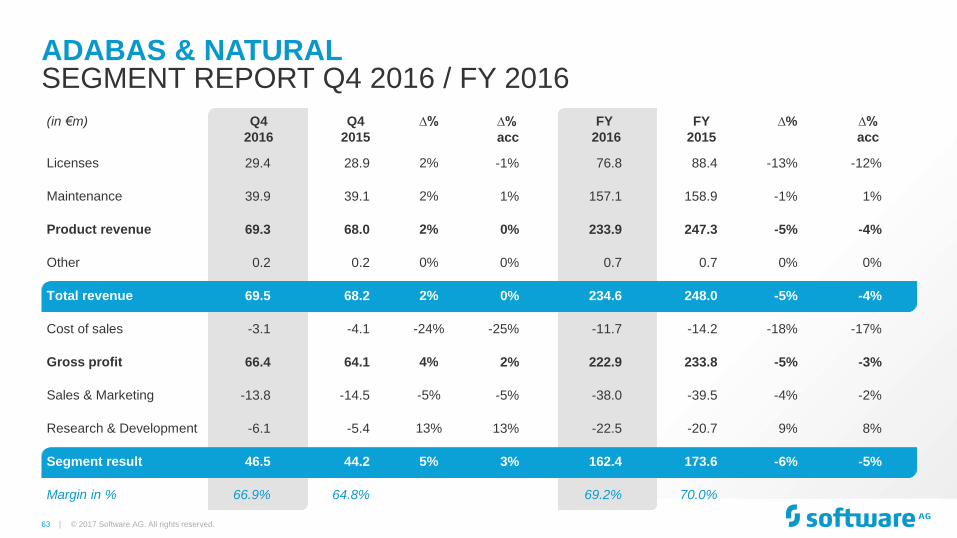
ADABAS & NATURAL SEGMENT REPORT Q4 2016 / FY 2016
© 2017 Software AG. All rights reserved.
(in €m) Q4
2016
Q4
2015
∆% ∆%
acc
FY
2016
FY
2015
∆% ∆%
acc
Licenses 29.4 28.9 2% -1% 76.8 88.4 -13% -12%
Maintenance 39.9 39.1 2% 1% 157.1 158.9 -1% 1%
Product revenue 69.3 68.0 2% 0% 233.9 247.3 -5% -4%
Other 0.2 0.2 0% 0% 0.7 0.7 0% 0%
Total revenue 69.5 68.2 2% 0% 234.6 248.0 -5% -4%
Cost of sales -3.1 -4.1 -24% -25% -11.7 -14.2 -18% -17%
Gross profit 66.4 64.1 4% 2% 222.9 233.8 -5% -3%
Sales & Marketing -13.8 -14.5 -5% -5% -38.0 -39.5 -4% -2%
Research & Development -6.1 -5.4 13% 13% -22.5 -20.7 9% 8%
Segment result 46.5 44.2 5% 3% 162.4 173.6 -6% -5%
Margin in % 66.9% 64.8% 69.2% 70.0%
64 |
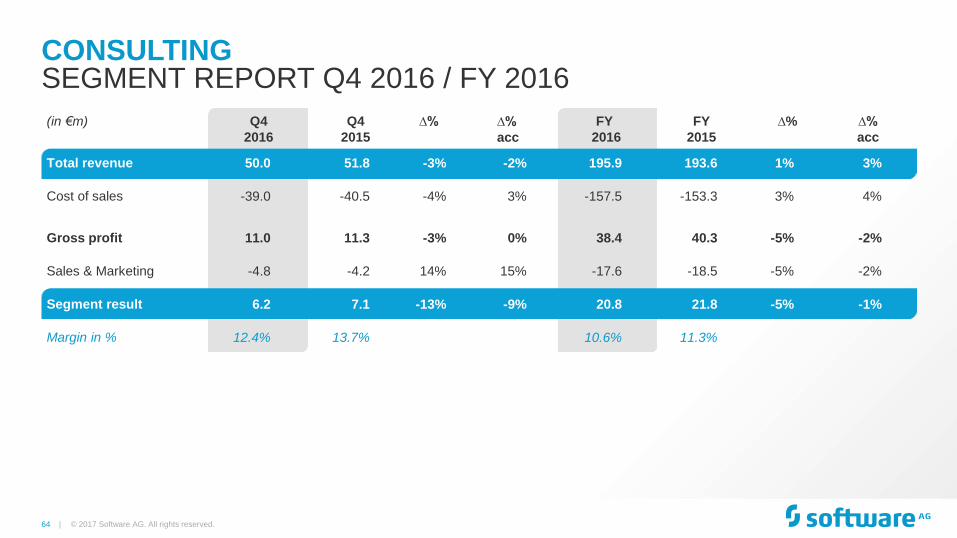
CONSULTING SEGMENT REPORT Q4 2016 / FY 2016
© 2017 Software AG. All rights reserved.
(in €m) Q4
2016
Q4
2015
∆% ∆%
acc
FY
2016
FY
2015
∆% ∆%
acc
Total revenue 50.0 51.8 -3% -2% 195.9 193.6 1% 3%
Cost of sales -39.0 -40.5 -4% 3% -157.5
-153.3 3% 4%
Gross profit 11.0 11.3 -3% 0% 38.4 40.3 -5% -2%
Sales & Marketing -4.8 -4.2 14% 15% -17.6 -18.5 -5% -2%
Segment result 6.2 7.1 -13% -9% 20.8 21.8 -5% -1%
Margin in % 12.4% 13.7% 10.6% 11.3%
65 |
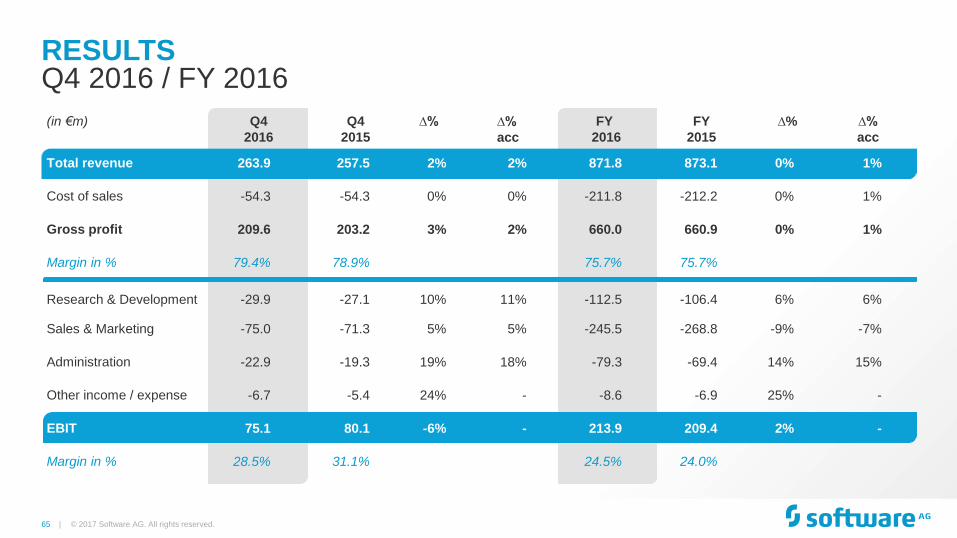
RESULTS Q4 2016 / FY 2016
© 2017 Software AG. All rights reserved.
(in €m) Q4
2016
Q4
2015
∆% ∆%
acc
FY
2016
FY
2015
∆% ∆%
acc
Total revenue 263.9 257.5 2% 2% 871.8 873.1 0% 1%
Cost of sales -54.3 -54.3 0% 0% -211.8 -212.2 0% 1%
Gross profit 209.6 203.2 3% 2% 660.0 660.9 0% 1%
Margin in % 79.4% 78.9% 75.7% 75.7%
Research & Development -29.9 -27.1 10% 11% -112.5 -106.4 6% 6%
Sales & Marketing -75.0 -71.3 5% 5% -245.5 -268.8 -9% -7%
Administration -22.9 -19.3 19% 18% -79.3 -69.4 14% 15%
Other income / expense -6.7 -5.4 24% - -8.6 -6.9 25% -
EBIT 75.1 80.1 -6% - 213.9 209.4 2% -
Margin in % 28.5% 31.1% 24.5% 24.0%
66 |
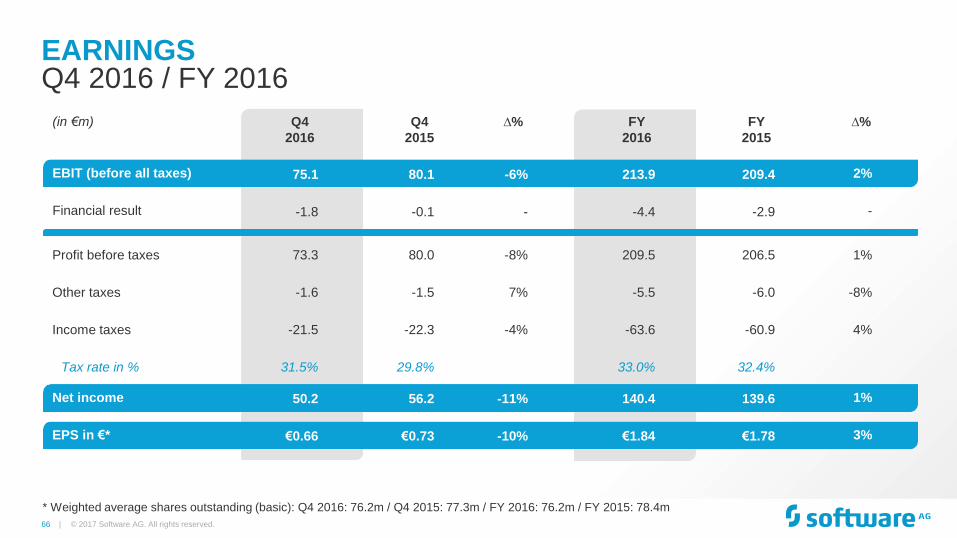
EARNINGS
© 2017 Software AG. All rights reserved.
Q4 2016 / FY 2016
* Weighted average shares outstanding (basic): Q4 2016: 76.2m / Q4 2015: 77.3m / FY 2016: 76.2m / FY 2015: 78.4m
(in €m) Q4
2016
Q4
2015
∆% FY
2016
FY
2015
∆%
EBIT (before all taxes) 75.1 80.1 -6% 213.9 209.4 2%
Financial result -1.8 -0.1 - -4.4 -2.9 -
Profit before taxes 73.3 80.0 -8% 209.5 206.5 1%
Other taxes -1.6 -1.5 7% -5.5 -6.0 -8%
Income taxes -21.5 -22.3 -4% -63.6 -60.9 4%
Tax rate in % 31.5% 29.8% 33.0% 32.4%
Net income 50.2 56.2 -11% 140.4 139.6 1%
EPS in €* €0.66 €0.73 -10% €1.84 €1.78 3%
67 |
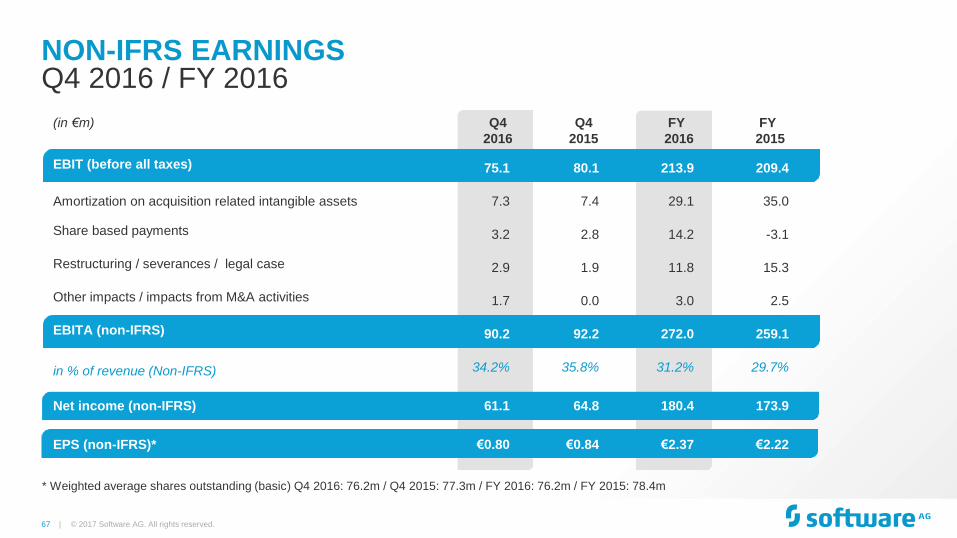
NON-IFRS EARNINGS
© 2017 Software AG. All rights reserved.
Q4 2016 / FY 2016
* Weighted average shares outstanding (basic) Q4 2016: 76.2m / Q4 2015: 77.3m / FY 2016: 76.2m / FY 2015: 78.4m
(in €m) Q4
2016
Q4
2015
FY
2016
FY
2015
EBIT (before all taxes) 75.1 80.1 213.9 209.4
Amortization on acquisition related intangible assets 7.3 7.4 29.1 35.0
Share based payments 3.2 2.8 14.2 -3.1
Restructuring / severances / legal case 2.9 1.9 11.8 15.3
Other impacts / impacts from M&A activities 1.7 0.0 3.0 2.5
EBITA (non-IFRS) 90.2 92.2 272.0 259.1
in % of revenue (Non-IFRS) 34.2% 35.8% 31.2% 29.7%
Net income (non-IFRS) 61.1 64.8 180.4 173.9
EPS (non-IFRS)* €0.80 €0.84 €2.37 €2.22
68 |
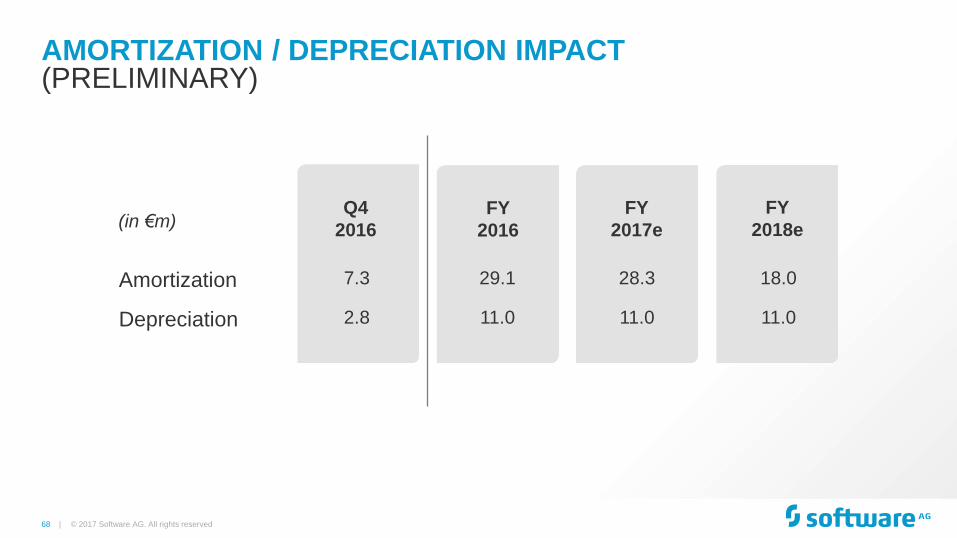
Q4
2016
FY
2016
FY
2017e
Amortization
(in €m)
Depreciation
FY
2018e
AMORTIZATION / DEPRECIATION IMPACT
© 2017 Software AG. All rights reserved
(PRELIMINARY)
29.1
11.0
28.3
11.0
7.3
2.8
18.0
11.0
69 |
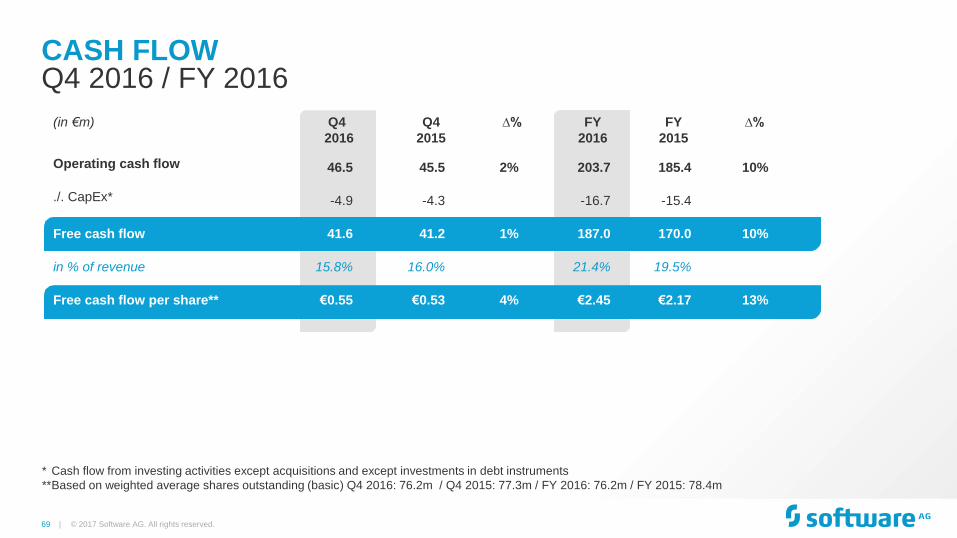
CASH FLOW
© 2017 Software AG. All rights reserved.
Q4 2016 / FY 2016
* Cash flow from investing activities except acquisitions and except investments in debt instruments
** Based on weighted average shares outstanding (basic) Q4 2016: 76.2m / Q4 2015: 77.3m / FY 2016: 76.2m / FY 2015: 78.4m
(in €m) Q4
2016
Q4
2015
∆% FY
2016
FY
2015
∆%
Operating cash flow 46.5 45.5 2% 203.7 185.4 10%
./. CapEx* -4.9 -4.3 -16.7 -15.4
Free cash flow 41.6 41.2 1% 187.0 170.0 10%
in % of revenue 15.8% 16.0% 21.4% 19.5%
Free cash flow per share** €0.55 €0.53 4% €2.45 €2.17 13%
70 |
Dec. 31,
2016
Dec. 31,
2016
Assets Liabilities
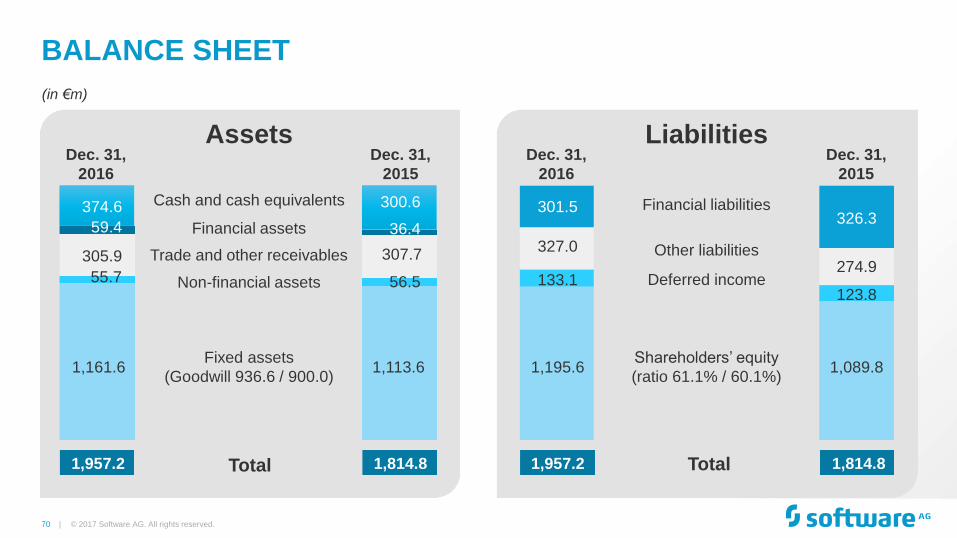
BALANCE SHEET
© 2017 Software AG. All rights reserved.
(in €m)
Dec. 31,
2015
Dec. 31,
2015
Cash and cash equivalents
Financial assets
Trade and other receivables
Fixed assets
(Goodwill 936.6 / 900.0)
Total
Non-financial assets
Financial liabilities
Other liabilities
Deferred income
Shareholders’ equity
(ratio 61.1% / 60.1%)
Total
300.6
307.7
56.5
1,113.6
1,814.8
36.4 326.3
274.9
123.8
1,089.8
1,814.8
374.6
305.9
55.7
1,161.6
1,957.2
59.4
1,957.2
301.5
327.0
133.1
1,195.6
71 |
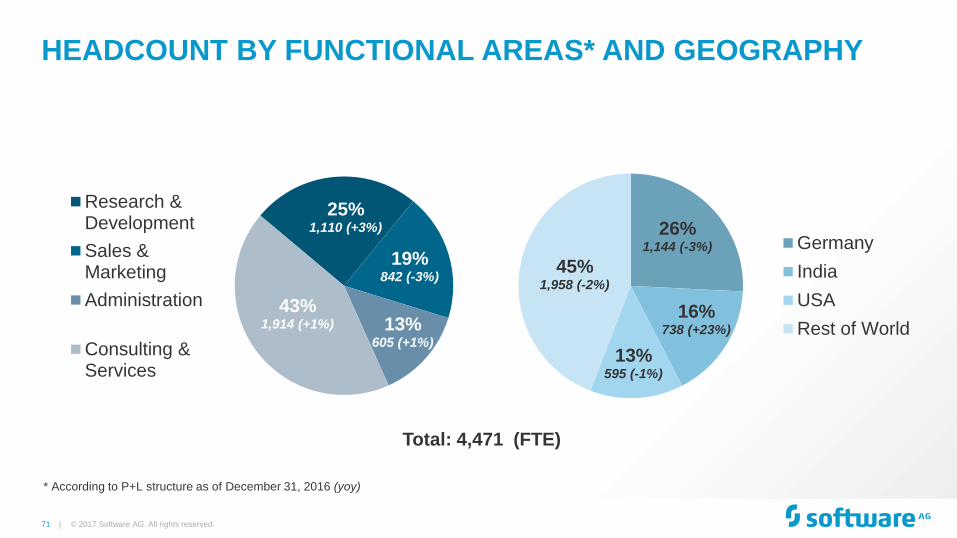
HEADCOUNT BY FUNCTIONAL AREAS* AND GEOGRAPHY
© 2017 Software AG. All rights reserved.
25% 1,110 (+3%)
19% 842 (-3%)
13% 605 (+1%)
43% 1,914 (+1%)
Research &Development
Sales &Marketing
Administration
Consulting &Services
26% 1,144 (-3%)
16% 738 (+23%)
13% 595 (-1%)
45% 1,958 (-2%)
Germany
India
USA
Rest of World
* According to P+L structure as of December 31, 2016 (yoy)
Total: 4,471 (FTE)
72 |
INDEX
© 2017 Software AG. All rights reserved.
Key Value Investment Indicators 1. 7
Business Model, Characteristics & GTM 2. 21
Markets, Positioning & Competition 3. 28
Digital Business Platform - Core Capabilities 4. 37
Customers References & Use Cases 5. 44
Financials 6. 57
Shares & Ownership 7. 73
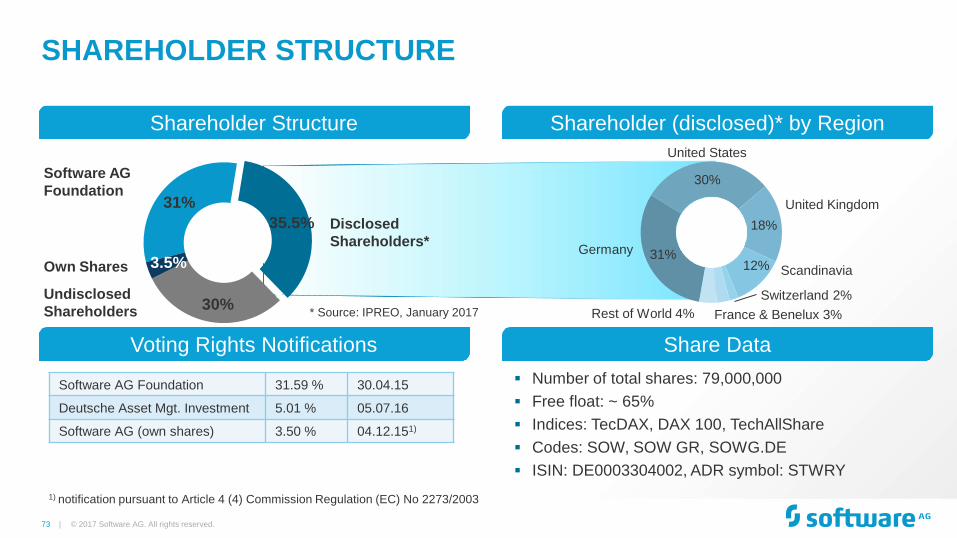
73 |
31%
35.5%
30%
3.5%
SHAREHOLDER STRUCTURE
© 2017 Software AG. All rights reserved.
31%
30%
18%
12%
Number of total shares: 79,000,000
Free float: ~ 65%
Indices: TecDAX, DAX 100, TechAllShare
Codes: SOW, SOW GR, SOWG.DE
ISIN: DE0003304002, ADR symbol: STWRY
Germany
United States
France & Benelux 3%
Scandinavia
United Kingdom
Rest of World 4%
Shareholder Structure
Share Data
Shareholder (disclosed)* by Region
Software AG Foundation 31.59 % 30.04.15
Deutsche Asset Mgt. Investment 5.01 % 05.07.16
Software AG (own shares) 3.50 % 04.12.151)
Voting Rights Notifications
Switzerland 2%
1) notification pursuant to Article 4 (4) Commission Regulation (EC) No 2273/2003
* Source: IPREO, January 2017
Software AG
Foundation
Disclosed
Shareholders*
Undisclosed
Shareholders
Own Shares
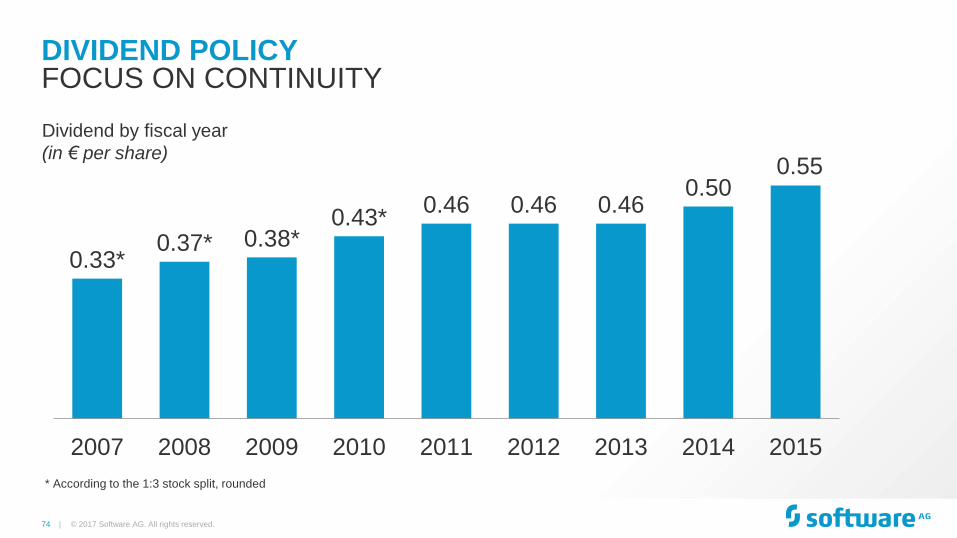
74 |
0.33* 0.37* 0.38*
0.43* 0.46 0.46 0.46
0.50 0.55
2007 2008 2009 2010 2011 2012 2013 2014 2015
DIVIDEND POLICY
© 2017 Software AG. All rights reserved.
FOCUS ON CONTINUITY
Dividend by fiscal year
(in € per share)
* According to the 1:3 stock split, rounded
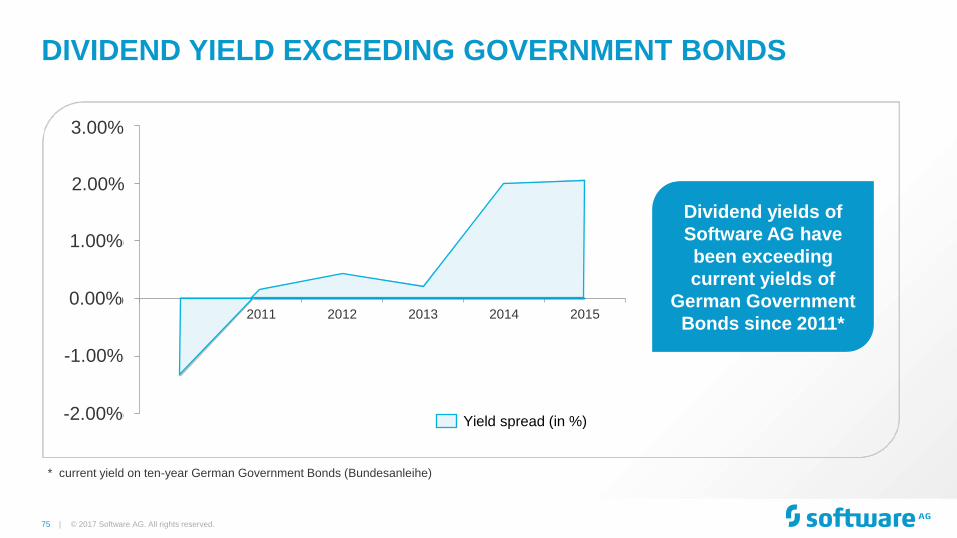
75 |
DIVIDEND YIELD EXCEEDING GOVERNMENT BONDS
© 2017 Software AG. All rights reserved.
-2.00%
-1.00%
0.00%
1.00%
2.00%
3.00%
2010 2011 2012 2013 2014 2015
Yield spread (in %)
* current yield on ten-year German Government Bonds (Bundesanleihe)
Dividend yields of
Software AG have
been exceeding
current yields of
German Government
Bonds since 2011*
3.00%
2.00%
1.00%
0.00%
-1.00%
-2.00%
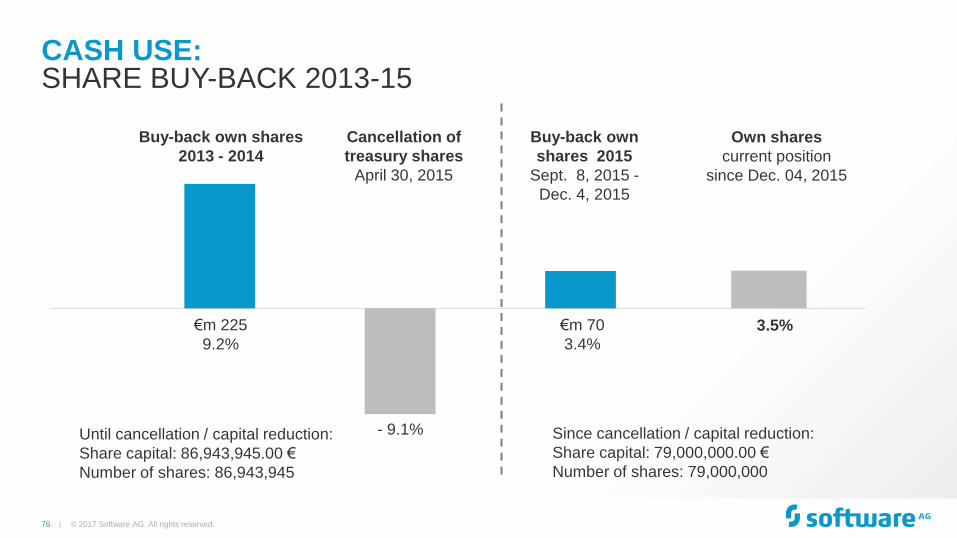
76 |
CASH USE:
© 2017 Software AG. All rights reserved.
SHARE BUY-BACK 2013-15
Buy-back own shares
2013 - 2014
Cancellation of
treasury shares
April 30, 2015
Buy-back own
shares 2015
Sept. 8, 2015 -
Dec. 4, 2015
Until cancellation / capital reduction:
Share capital: 86,943,945.00 €
Number of shares: 86,943,945
€m 225
9.2%
€m 70
3.4%
- 9.1%
Own shares
current position
since Dec. 04, 2015
3.5%
Since cancellation / capital reduction:
Share capital: 79,000,000.00 €
Number of shares: 79,000,000
77 |
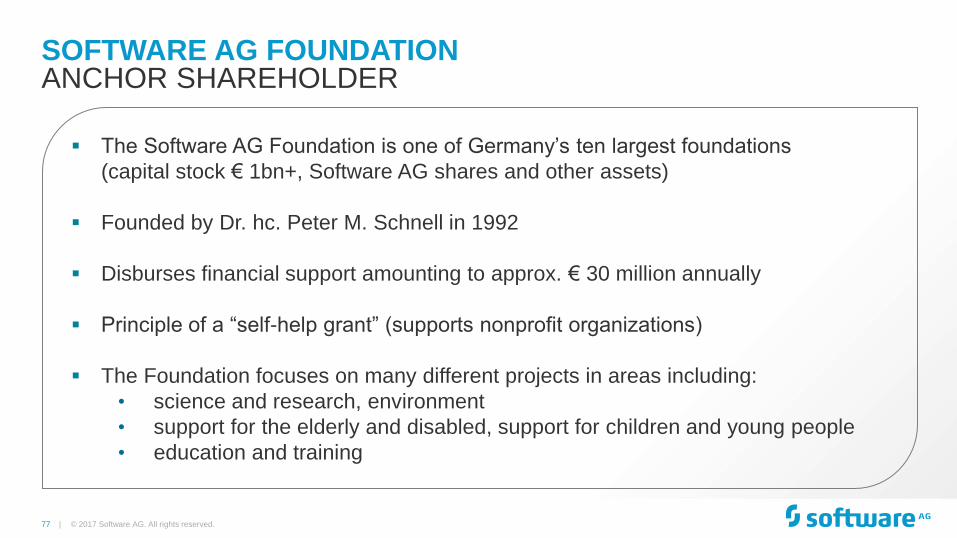
SOFTWARE AG FOUNDATION
© 2017 Software AG. All rights reserved.
ANCHOR SHAREHOLDER
The Software AG Foundation is one of Germany’s ten largest foundations
(capital stock € 1bn+, Software AG shares and other assets)
Founded by Dr. hc. Peter M. Schnell in 1992
Disburses financial support amounting to approx. € 30 million annually
Principle of a “self-help grant” (supports nonprofit organizations)
The Foundation focuses on many different projects in areas including:
• science and research, environment
• support for the elderly and disabled, support for children and young people
• education and training
78 |
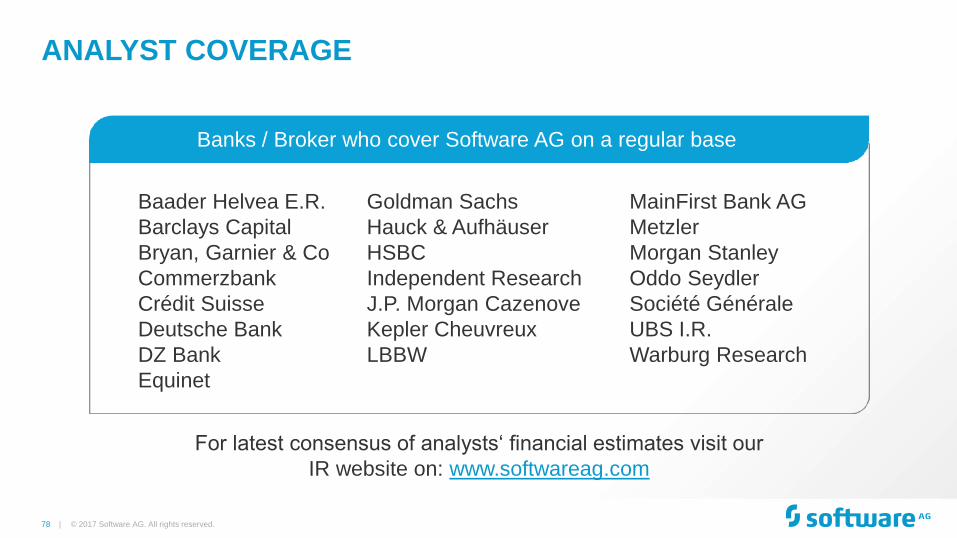
ANALYST COVERAGE
© 2017 Software AG. All rights reserved.
Baader Helvea E.R.
Barclays Capital
Bryan, Garnier & Co
Commerzbank
Crédit Suisse
Deutsche Bank
DZ Bank
Equinet
Goldman Sachs
Hauck & Aufhäuser
HSBC
Independent Research
J.P. Morgan Cazenove
Kepler Cheuvreux
LBBW
MainFirst Bank AG
Metzler
Morgan Stanley
Oddo Seydler
Société Générale
UBS I.R.
Warburg Research
For latest consensus of analysts‘ financial estimates visit our
IR website on: www.softwareag.com
Banks / Broker who cover Software AG on a regular base
79 | © 2017 Software AG. All rights reserved.
Investor Relations
Uhlandstrasse 12
64297 Darmstadt
Germany
phone: +49 (0) 6151 / 92 1900
fax: +49 (0) 6151 / 9234 1900
softwareag.com
e-mail: [email protected]