99
INVESTOR RELATIONS FACTBOOK February 2018 © 2018 Software AG. All rights reserved.
| Date post: | 08-May-2018 |
| Category: |
Documents |
| Upload: | nguyenhuong |
| View: | 224 times |
| Download: | 2 times |

INVESTOR RELATIONS FACTBOOK
February 2018
© 2018 Software AG. All rights reserved.

2 |
This presentation includes forward-looking statements based on the beliefs of Software AG management.
Such statements reflect current views of Software AG with respect to future events
and results and are subject to risks and uncertainties. Actual results may vary materially from those
projected here, due to factors including changes in general economic and business conditions, changes in
currency exchange, the introduction of competing products, lack of market acceptance
of new products, services or technologies and changes in business strategy. Software AG does not intend
or assume any obligation to update these forward-looking statements.
This presentation constitutes neither an offer nor recommendation to subscribe or buy in any other way
securities of Software AG or any of the companies that are members of the Group at present or in the
future, nor does it form part of such an offer and it should not be understood as such. This presentation
does not constitute an offer of sale of securities in the United States of America. Securities may not be
offered or sold in the United States of America without registration or exemption from registration in
accordance with the U.S. Securities‘ Act of 1933 in its currently valid form.
© 2018 Software AG. All rights reserved.
SAFE-HARBOR-STATEMENT

1 |
A DAY IN THE LIFE OF SOFTWARE AG
06.15
© 2018 Software AG. All rights reserved.
2 |
A DAY IN THE LIFE OF SOFTWARE AG
06.59
© 2018 Software AG. All rights reserved.

3 |
A DAY IN THE LIFE OF SOFTWARE AG
07.45
© 2018 Software AG. All rights reserved.

4 |
A DAY IN THE LIFE OF SOFTWARE AG
10.00
© 2018 Software AG. All rights reserved.
5 |
A DAY IN THE LIFE OF SOFTWARE AG
11.15
© 2018 Software AG. All rights reserved.

6 |
A DAY IN THE LIFE OF SOFTWARE AG
13.00
© 2018 Software AG. All rights reserved.

7 |
A DAY IN THE LIFE OF SOFTWARE AG
17.00
© 2018 Software AG. All rights reserved.

8 |
A DAY IN THE LIFE OF SOFTWARE AG
17.30
© 2018 Software AG. All rights reserved.

9 |
A DAY IN THE LIFE OF SOFTWARE AG
18.00
© 2018 Software AG. All rights reserved.

3 |
SOFTWARE AG AT A GLANCE
© 2018 Software AG. All rights reserved.
Technology leader for more than 40 years in data management
and application development platforms
~ €3,3bn MARKETCAP
~ 64% Free Float
€870+ MILLION
IN REVENUE
45%+ recurring
77% product revenue
4,500+ EMPLOYEES**
R&D 26%
S&M 19%
Consulting
&Services
42%
Admin
13%
41%
Americas
51%
EMEA
REVENUE
51%
DBP
26%
A&N
23%
Services
BY REGION* BY BUSINESS LINES*
* Based on Group product revenue – FY 2017 **P&L as of December 31, 2017

4 |
BUSINESS LINES
© 2018 Software AG. All rights reserved.
*Group revenue split FY 2017
Share of
Revenue* 52%
Growing Revenue
• IoT and Industry 4.0 Platforms
• Integration & Automation
• Analytics & Decisions
• In-Memory Data
• Business & IT Transformation
Share of
Revenue*
Growing Stability
• Application Development
• Data Management System
• Modernization
• System Support 2050+
Share of
Revenue*
Growing Margin
• Strategy & Design
• Product Implementation &
Customized Solutions
• Education & Cloud Services
• Global Delivery (on-/offshore)
25% 23%

5 |
Revenue in €m:
EBITDA
DBP Product revenue
A&N Product revenue
PROFITABLE GROWTH
© 2018 Software AG. All rights reserved.
STRATEGY EXECUTION
284 224
455
2006 2017
Adabas & Natural
Extending Lifecycle
69
31.8%
24.7%
Stable core + profitable
(program 2050+)
EBITA, non-IFRS
2012
Operating margin

6 |
INFLECTION POINTS
© 2018 Software AG. All rights reserved.
WHEN DIGITAL BUSINESS PLATFORM TAKES THE LEAD
0%
20%
40%
60%
80%
100%
2010
License Revenue
0%
20%
40%
60%
80%
100% Maintenance Revenue
2012
0%
20%
40%
60%
80%
100% Business Segment Result
Adabas & Natural
Digital Business Platform
2018e

7 |
INDEX
© 2018 Software AG. All rights reserved.
Key Investment Indicators 1. 8
Business Model, Characteristics & GTM 2. 22
Markets, Positioning & Competition 3. 27
Digital Business Platform – Core Capabilities 4. 37
Customers References & Use Cases 6. 58
Financials 7. 64
Shares & Ownership 8. 81
IoT Platform – Offering and Core Capabilities 5. 41

8 |
1. KEY INVESTMENT INDICATORS
© 2018 Software AG. All rights reserved.
9 |
KEY INVESTMENT INDICATORS
© 2018 Software AG. All rights reserved.
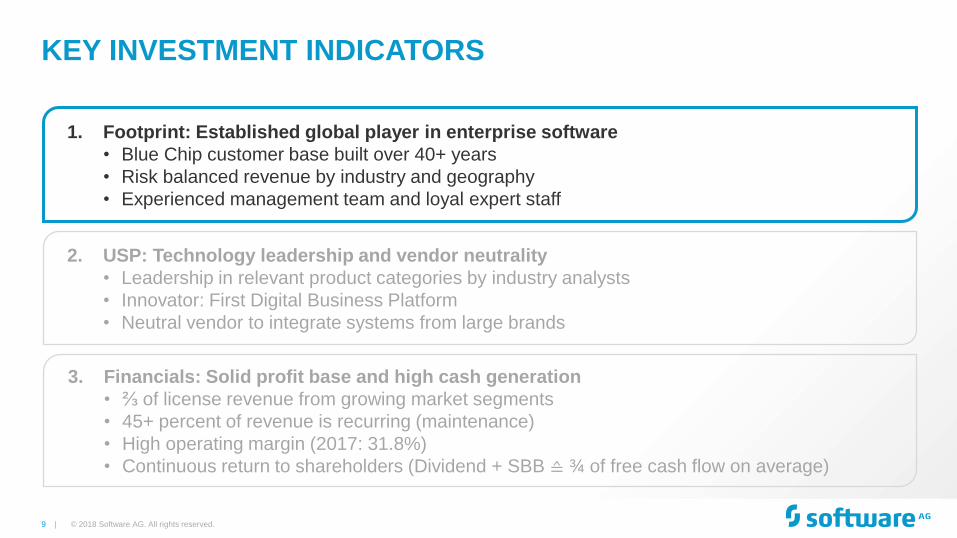
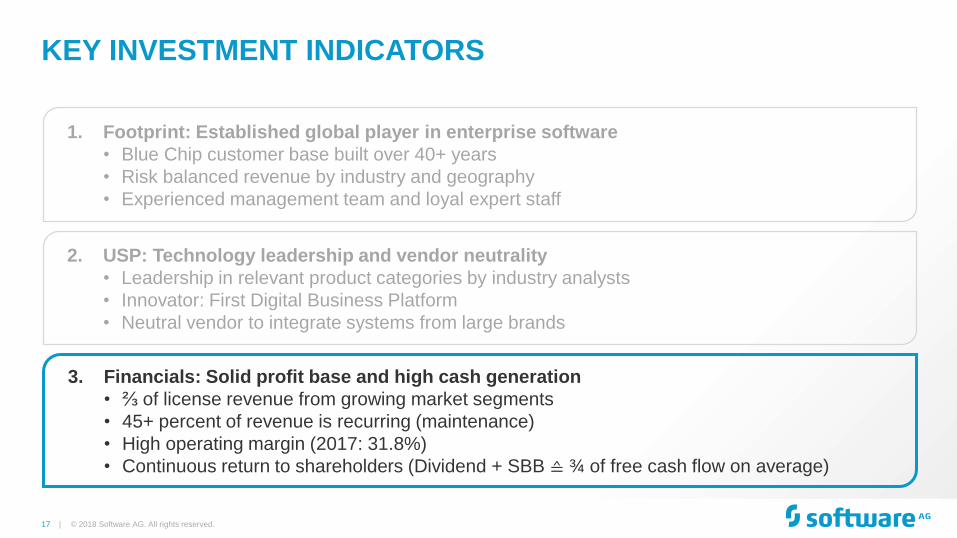
1. Footprint: Established global player in enterprise software
• Blue Chip customer base built over 40+ years
• Risk balanced revenue by industry and geography
• Experienced management team and loyal expert staff
2. USP: Technology leadership and vendor neutrality
• Leadership in relevant product categories by industry analysts
• Innovator: First Digital Business Platform
• Neutral vendor to integrate systems from large brands
3. Financials: Solid profit base and high cash generation
• ⅔ of license revenue from growing market segments
• 45+ percent of revenue is recurring (maintenance)
• High operating margin (2017: 31.8%)
• Continuous return to shareholders (Dividend + SBB ≙ ¾ of free cash flow on average)

10 |
Telecom Chemicals/Pharma Energy/Utilities
Public Sector Logistic/Transport Consumer/Retail
BLUE CHIP CUSTOMER BASE
© 2018 Software AG. All rights reserved.
BUILT OVER 40+ YEARS (SAMPLES)
Chemicals/Pharma IoT Finance
Manufacturing

11 |
20%
19%
18% 12%
10%
Government Financial Services
IT Services Manufacturing
Services Telco & Media
Transport & Logistics Other
BALANCED RISK
© 2018 Software AG. All rights reserved.
REVENUE BY GEOGRAPHY AND INDUSTRY
Product Revenue by Region* Product Revenue by Industry*
41%
51%
(14%)
8%
Americas
EMEA (14% Germany)
Asia Pacific
*Based on Group product revenue – FY 2017
12 |
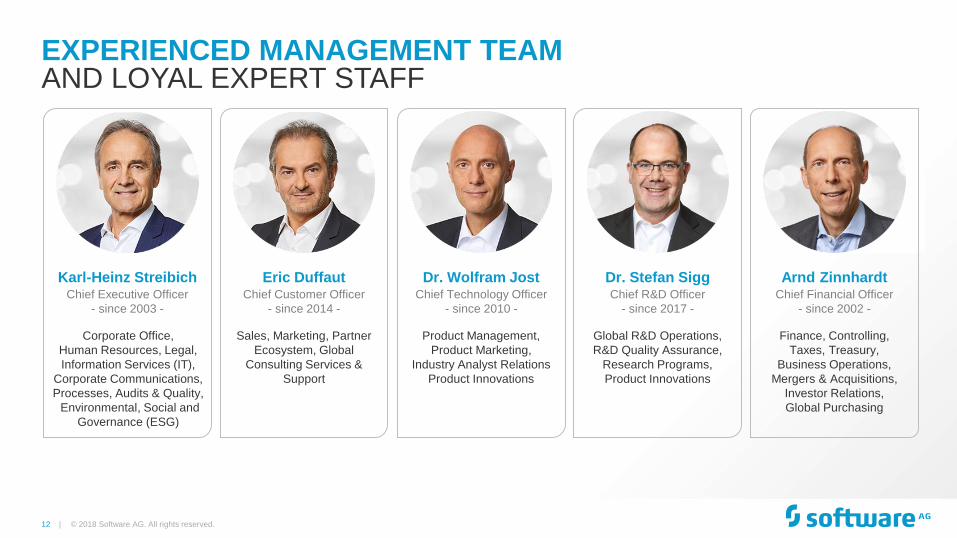
EXPERIENCED MANAGEMENT TEAM
© 2018 Software AG. All rights reserved.
AND LOYAL EXPERT STAFF
Arnd Zinnhardt Chief Financial Officer
- since 2002 -
Finance, Controlling,
Taxes, Treasury,
Business Operations,
Mergers & Acquisitions,
Investor Relations,
Global Purchasing
Dr. Stefan Sigg Chief R&D Officer
- since 2017 -
Global R&D Operations,
R&D Quality Assurance,
Research Programs,
Product Innovations
Dr. Wolfram Jost Chief Technology Officer
- since 2010 -
Product Management,
Product Marketing,
Industry Analyst Relations
Product Innovations
Eric Duffaut Chief Customer Officer
- since 2014 -
Sales, Marketing, Partner
Ecosystem, Global
Consulting Services &
Support
Karl-Heinz Streibich Chief Executive Officer
- since 2003 -
Corporate Office,
Human Resources, Legal,
Information Services (IT),
Corporate Communications,
Processes, Audits & Quality,
Environmental, Social and
Governance (ESG)

13 |
KEY INVESTMENT INDICATORS
© 2018 Software AG. All rights reserved.
1. Footprint: Established global player in enterprise software
• Blue Chip customer base built over 40+ years
• Risk balanced revenue by industry and geography
• Experienced management team and loyal expert staff
2. USP: Technology leadership and vendor neutrality
• Leadership in relevant product categories by industry analysts
• Innovator: First Digital Business Platform
• Neutral vendor to integrate systems from large brands
3. Financials: Solid profit base and high cash generation
• ⅔ of license revenue from growing market segments
• 45+ percent of revenue is recurring (maintenance)
• High operating margin (2017: 31.8%)
• Continuous return to shareholders (Dividend + SBB ≙ ¾ of free cash flow on average)

14 |
TECHNOLOGY LEADERSHIP
© 2018 Software AG. All rights reserved.
SOFTWARE AG IS A LEADER IN 8 MARKETS
* The Gartner document is available upon request from Software AG.
Gartner is a registered trademark and service mark of Gartner, Inc. and/or its affiliates in the U.S. and
internationally, and is used herein with permission. All rights reserved.
Gartner does not endorse any vendor, product or service depicted in its research publications, and does not
advise technology users to select only those vendors with the highest ratings or other designations. Gartner
research publications consist of the opinions of Gartner’s research organization and should not e construed
as statements of fact. Gartner disclaims all warranties, expressed or implied, with respect to this research,
including any warranties of merchantability or fitness for a particular purpose.
All statements in this report attributable to Gartner represent Software AG interpretation of data, research
opinion or viewpoints published as part of a syndicated subscription service by Gartner, Inc., and have not
been reviewed by Gartner. Each Gartner publication speaks as of its original publication date (and not as of
the date of this Presentation/Factbook). The opinions expressed in Gartner publications are not
representations of fact, and are subject to change without notice.
• The Forrester Wave TM: In-Memory Data Grids,
Q3 2015
• The Forrester Wave TM: Hybrid Integration For
Enterprises, Q4 2016,
• The Forrester Wave TM: Enterprise Architecture
Management, Q2 2017
• Enterprise Architecture Tools, May 2017*
Magic Quadrants
• Integrated IT Portfolio Analysis Applications,
November 2017
• The Forrester Wave TM: Digital Process
Automation, Q3 2017
• The Forrester Wave TM: Streaming Analytics,
Q3 2017
• The Forrester Wave TM: Strategic Portfolio
Management, Q3 2017

15 | © 2018 Software AG. All rights reserved.
WORLD’S
1st
high-performance
transactional database
ADABAS &
NATURAL
THE FIRST
B2B server and
SOA integration platform
WEBMETHODS
THE FIRST
business process analysis
and design platform
ARIS
THE FIRST
Big data & streaming
analytics platform
TERRACOTTA
APAMA
THE FIRST
True IoT
cloud platform
CUMULOCITY IoT
THE FIRST
INNOVATOR FOR COMPETITIVE DIFFERENTIATION

16 |
We won’t lock
customers into
proprietary systems.
We make all leading
databases and application
platforms work in synergy
with one another.
NEUTRAL BECAUSE WE ARE
© 2018 Software AG. All rights reserved.
VENDOR INDEPENDENT
Our solutions work in
harmony with the existing
IT landscape.
17 |
KEY INVESTMENT INDICATORS
© 2018 Software AG. All rights reserved.
1. Footprint: Established global player in enterprise software
• Blue Chip customer base built over 40+ years
• Risk balanced revenue by industry and geography
• Experienced management team and loyal expert staff
2. USP: Technology leadership and vendor neutrality
• Leadership in relevant product categories by industry analysts
• Innovator: First Digital Business Platform
• Neutral vendor to integrate systems from large brands
3. Financials: Solid profit base and high cash generation
• ⅔ of license revenue from growing market segments
• 45+ percent of revenue is recurring (maintenance)
• High operating margin (2017: 31.8%)
• Continuous return to shareholders (Dividend + SBB ≙ ¾ of free cash flow on average)

18 |
LICENSE REVENUE: ⅔ FROM GROWING IT MARKETS
© 2018 Software AG. All rights reserved.
0%
20%
40%
60%
80%
100%
2006 2008 2010 2012 2014 2016 2017
A&N
DBP
DBP offering focused on IT digitization segments, like IoT, streaming analytics etc.

19 |
RECURRING MAINTENANCE REVENUE
© 2018 Software AG. All rights reserved.
0
100
200
300
400
2010 2011 2012 2013 2014 2015 2016 2017
A&N
DBP
353 362 378 369 369
407
>45% of Group revenue
from maintenance
in €m
48%
maintenance
>90% recurring
412 422

20 |
200
300
400
500
600
2015 2017 2019 2021 2023 2025
*renewal rate ca. 93-95%
400
500
600
700
800
2015 2017 2019 2021 2023 2025
© 2018 Software AG. All rights reserved.
A) +10% CAGR
B) flat
€m
€m
€m
MAINTENANCE REVENUE SHOWS COMPOUND GROWTH
DBP maintenance:
Renewal rate: 93% (2015-2018), 94% (2019-2021), 95% (2022-2025)
Net new maintenance ≙ 18% of license p.y.
Stable churn rate: - 4% CAGR
(regardless of license revenue)
DBP license growth:
A
A
B
B
Model assumptions:
A&N maintenance:

21 |
31.2%
FY2016
29.7%
FY2015 26.8%
FY2013
27.9%
FY2014
SOFTWARE AG
© 2018 Software AG. All rights reserved.
INVESTMENT KPI
44%
mainte-
nance
32%
license
24%
consulting
Growing share of product and recurring revenues
€0.50
€0.60
2014 2016
Dividend increase
Free Cash Flow
conversion rate
around 115% of
Net profit.
20%
60%
100%
140%
180% yield: 1.7%
Operating margin* expansion
FY 2014 * non–IFRS EBITA in % of revenue FY 2017
48%
mainte-
nance
29%
license
21%
consulting
32 – 35%
(2020 target)
cash-out ratio:
25 – 33%
31.8%
FY2017

22 | © 2018 Software AG. All rights reserved.
2. BUSINESS MODEL, CHARACTERISTICS & GTM

23 |
0%
10%
20%
30%
40%
50%
Q1 Q2 Q3 Q4
License Maintenance Services
BUSINESS MODEL
© 2018 Software AG. All rights reserved.
REVENUE STRUCTURE & LICENSE VOLATILITY
License
• Direct sales force & Partners
• One-time payment for perpetual license
• Additional payment for capacity upgrades, extended usage and add-on products
• Price: Capacity/MIPS or CPU based
Maintenance:
• Annual payment (renewal rate >90%)
• Price based on license volume:
• DBP: up to 22% (new); (≤20% installed)
• A&N: 15% (mainframe); 20% (other)
Consulting Services
• Implementing own products
• Cost plus or fixed price projects
• Own staff + freelance and partners
Ø quarterly share of respective
FY revenue 2014 - 2017

24 |
ACQUISITIONS SUPPORT TECHNOLOGY LEADERSHIP
Integration and BPM Business Process Analysis Big Data (In Memory)
Application PaaS
2007 2008 2009 2010 2011 2012 2013 2016
© 2018 Software AG. All rights reserved.
*A&N Portfolio (all other DBP)
Internet of
Things
2017
Artificial
Intelligence
* *
Streaming
Analytics

25 |
OUR PARTNER ECOSYSTEM A FORCE MULTIPLIER FOR SUCCESS
Sample of Strategic Global Alliance Partners
Increase value:
• Increase implementation success rate by extended partner service capabilities
• Reduce time-to-value through broad industry and vertical footprint
• Accelerating innovation & solutions to provide systems of differentiation
• Effective sales and service delivery due to local coverage
• Successfully manage the transformation into a true DIGITAL business
© 2018 Software AG. All rights reserved.

26 |
Capabilities Benefits
ADABAS Data Management System
• Data management for high-performance
transaction processing
• Multi-platform availability
• Faster and more reliable data processing
• Easily share data with other systems
• Data management on platform of choice
NATURAL Application Development
• Platform for developing and operating
enterprise applications
• Eclipse™-based tool environment
• Cross-platform deployment
• Rapid delivery of applications
• Meet business demands faster
• Retain business logic independent from
platform decision
ADABAS & NATURAL Application Modernization
• Improve end-user experience and
interoperability of applications
• Leverage new technologies—the Web,
mobile, SOA or big data
• Retain investments without risk
• Increase end-user productivity
• Innovate faster
ADABAS & NATURAL
© 2018 Software AG. All rights reserved.
TRANSACTION PROCESSING

27 | © 2018 Software AG. All rights reserved.
3. MARKETS, POSITIONING & COMPETITION

28 |
DIGITIZATION WEDGE SEPARATES
© 2018 Software AG. All rights reserved.
DIGITAL DISRUPTION
Any industry ... Pharma Retail Manufacturing Insurance
Digital Disruption
Internet of Things
Smart Business
Connected Customers
CUSTOMERS FROM ESTABLISHED COMPANIES

29 | © 2018 Software AG. All rights reserved.
Retail
Consumer
centric
supply
chains
Platform
as a
retailer
PROCESS
INNOVATION
Pharma
Personalized
medicine
Health card
as a
medical
service
platform
PRODUCT
INNOVATION
Individualized
production
Smart
products (I 4.0, MES, IoT)
Predictive
solutions
ORGANIZATIONAL
INNOVATION
Insurance
Platform as
a broker
Personalized
insurance
contract
SERVICE
INNOVATION
Mobility
Connected
cars
Platform
as a
broker
MOBILITY
INNOVATION
…any Industry!
DIGITAL
INNOVATION!
Manufacturing
DISRUPT YOURSELF … IF NOT, OTHERS WILL OUTSTANDING CUSTOMER EXPERIENCE ENABLED BY DIGITAL PLATFORMS

30 |
Co-innovation through customers and vendors Innovation only through vendor
CHANGING THE GAME
Product Based
Application n
Application 2
Application 1
(Use case 1)
Microservices • Agile • Flexible/fast
Platform Based
Digital Business Logic (Innovation Layer)
DIGITAL PLATFORM
Use case 1 Use case 2 Use case n
Monolithic • Complex • Inflexible/slow
Digital Application 1 Digital Application 2 Digital Application n
PLATFORM VERSUS PRODUCT BASED INNOVATIONS
© 2018 Software AG. All rights reserved.
PRE-DIGITAL WORLD DIGITAL WORLD
31 |
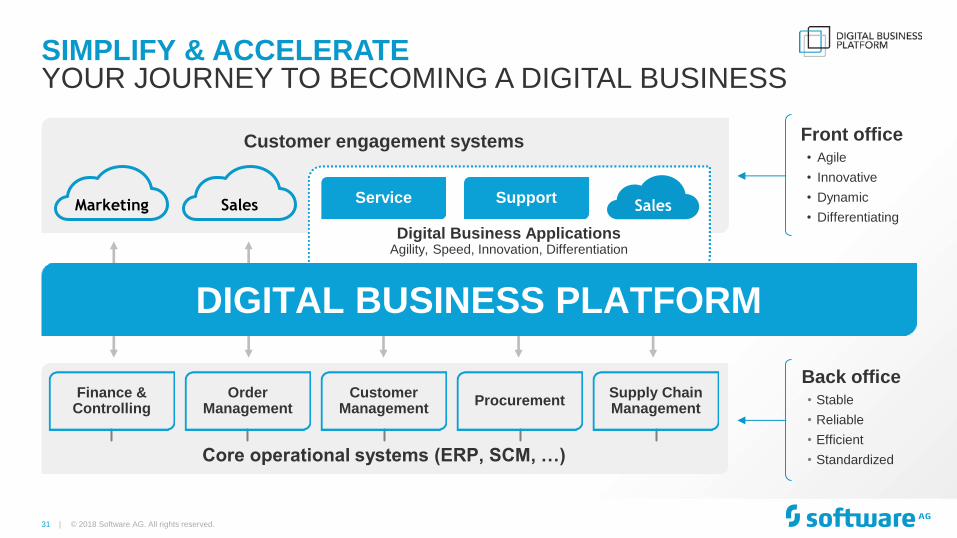
SIMPLIFY & ACCELERATE
© 2018 Software AG. All rights reserved.
YOUR JOURNEY TO BECOMING A DIGITAL BUSINESS
Front office • Agile
• Innovative
• Dynamic
• Differentiating
Customer engagement systems
Core operational systems (ERP, SCM, …)
Finance & Controlling
Order Management
Customer Management
Procurement Supply Chain Management
Digital Business Applications Agility, Speed, Innovation, Differentiation
Sales Service Support
DIGITAL BUSINESS PLATFORM
Marketing
Sales
Back office • Stable
• Reliable
• Efficient
• Standardized

32 |
SOFTWARE AG RANKED AS A LEADER THE FORRESTER WAVE™: STREAMING ANALYTICS, Q3 2017
Source: The Forrester Wave™: Streaming Analytics, Q3 2017, Forrester Research,
Inc., September 7, 2017
The Forrester Wave is copyrighted by Forrester Research, Inc. Forrester and Forrester Wave are trademarks of
Forrester Research, Inc. The Forrester Wave is a graphical representation of Forrester's call on a market and is
plotted using a detailed spreadsheet with exposed scores, weightings, and comments. Forrester does not
endorse any vendor, product, or service depicted in the Forrester Wave. Information is based on best available
resources. Opinions reflect judgment at the time and are subject to change.
“Software AG’s Apama continues to be a broadly
applicable and perennially capable streaming
analytics platform.”
“With its recent acquisition of Cumulocity, Apama
deeply extends its reach deeper into industrial IoT
use cases by providing device management,
digital twin, and other connectivity-oriented
services.”
“There is no stopping Apama to become the real-
time engine for digital transformation that extends
all the way from the factory floor to direct
customer interactions.”
© 2018 Software AG. All rights reserved.

33 |
SOFTWARE AG RANKED AS A LEADER
© 2018 Software AG. All rights reserved.
THE FORRESTER WAVE™: DIGITAL PROCESS AUTOMATION SOFTWARE (FORMERLY BPM PLATFORMS FOR DIGITAL BUSINESS - 2015), Q3 2017
Source: The Forrester Wave™: Digital Process Automation Software, Q3 2017,
Forrester Research, Inc., July 5, 2017
The Forrester Wave is copyrighted by Forrester Research, Inc. Forrester and Forrester Wave are trademarks of
Forrester Research, Inc. The Forrester Wave is a graphical representation of Forrester's call on a market and is
plotted using a detailed spreadsheet with exposed scores, weightings, and comments. Forrester does not
endorse any vendor, product, or service depicted in the Forrester Wave. Information is based on best available
resources. Opinions reflect judgment at the time and are subject to change.
“Software AG, a longtime player in the traditional
BPM space, with its webMethods BPMS … offers
strong support for dynamic case management,
integrated RPA {Robotic Process Automation},
extensive document support, and process
modeling.”

34 |
SOFTWARE AG RANKED AS A LEADER
© 2018 Software AG. All rights reserved.
Source: The Forrester Wave™ Hybrid Integration For Enterprises, Q4 2016,
Forrester Research, Inc., November 18, 2016
The Forrester Wave is copyrighted by Forrester Research, Inc. Forrester and Forrester Wave are trademarks of
Forrester Research, Inc. The Forrester Wave is a graphical representation of Forrester's call on a market and is
plotted using a detailed spreadsheet with exposed scores, weightings, and comments. Forrester does not
endorse any vendor, product, or service depicted in the Forrester Wave. Information is based on best available
resources. Opinions reflect judgment at the time and are subject to change.
“Software AG's DBP Integration Platform provides
typical integration capabilities, including
orchestration, transformation, messaging,
advanced routing, and wizard-based tooling. Its
platform supports multiple integration patterns,
including data integration and long-running
transactions.”
THE FORRESTER WAVE™: HYBRID INTEGRATION FOR ENTERPRISES, Q4 2016

35 |
SOFTWARE AG POSITIONED IN LEADERS QUADRANT
© 2018 Software AG. All rights reserved.
GARTNER’S 2017 MAGIC QUADRANT FOR ENTERPRISE ARCHITECTURE TOOLS
Figure 1. Magic Quadrant for Enterprise Architecture Tools
Source: Gartner, Inc., Magic Quadrant for Enterprise Architecture Tools, Samantha
Searle, Marc Kerremans, May 24, 2017
This graphic was published by Gartner, Inc. as part of a larger research document and should be evaluated in the
context of the entire document. The Gartner document is available upon request from Software AG.
Gartner does not endorse any vendor, product or service depicted in its research publications, and does not advise
technology users to select only those vendors with the highest ratings or other designation. Gartner research
publications consist of the opinions of Gartner's research organization and should not be construed as statements of
fact. Gartner disclaims all warranties, expressed or implied, with respect to this research, including any warranties of
merchantability or fitness for a particular purpose.
“The Leaders in [the] 2017 Magic Quadrant
“demonstrate clear support for delivering business-
outcome-driven EA, modeling and analysis. The
Leaders also demonstrate a clear vision of the
direction and maturation of the EA discipline, as well
as its relevance for digital business today and in the
future. The Leaders are responding to the needs of
leading EA practitioners that Gartner highlights in its
research

36 |
BLOOR RESEARCH, STREAMING ANALYTICS 2016
© 2018 Software AG. All rights reserved.
Software AG’s “comprehensive combination of
performance and scalability, streaming
analytics operators, graphical tools and solution
accelerators for application development” puts
it at the top of the class

37 | © 2018 Software AG. All rights reserved.
4. DIGITAL BUSINESS PLATFORM – CORE CAPABILITIES

38 |
Core ERP (SOR) Legacy BI Things
PaaS SaaS
THE NEW DIGITAL IT ARCHITECTURE BIMODAL AND INTEGRATION CENTRIC
DIGITAL BUSINESS PLATFORM (PaaS Suite)
+ HYBRID
CLOUD
ON PREMISE
Systems of Differentiation (Digital Applications)
Big Data Partners Mobile Apps
Modular, Agile, Flexible, Fast, Differentiating
© 2018 Software AG. All rights reserved.

39 |
YOUR DIGITAL BUSINESS PLATFORM YOUR DIGITAL FUTURE WITHOUT COMPROMISE
+ HYBRID
CLOUD
ON PREMISES
ANALYTICS & DECISIONS Streaming Analytics & Artificial Intelligence In-memory Data
PROCESS & APPLICATIONS Dynamic Process Automation
Low Code Applications
INTEGRATION & API Hybrid Integration
API Management
DEVICES Device Connectivity
Device Management
BUSINESS & IT
TRANSFORMATION
Process Transformation &
Management
Governance, Risk &
Compliance
Portfolio Management
Enterprise Architecture
Management
INT
ER
NE
T O
F T
HIN
GS
powered by
ARIS & ALFABET
powered by
CUMULOCITY
powered by
WEBMETHODS
powered by
TERRACOTTA & APAMA
powered by
WEBMETHODS
© 2018 Software AG. All rights reserved.

40 |
DIGITAL BUSINESS PLATFORM YOUR DIGITAL CAPABILITIES
BUSINESS & IT
TRANSFORMATION
PROCESS &
APPLICATIONS
ANALYTICS &
DECISIONS
INTEGRATION &
API
DEVICES
INT
ER
NE
T O
F T
HIN
GS
Process
analytics
Business strategy
& planning
Design &
analysis
Risk & compliance
management
Portfolio
management
Enterprise
architecture
Customer
journeys
B2B & managed
file transfer
API & service
catalog
API
gateway
API
portal
Master data
management
Edge
services
Device
management
Device
agents
Device
connectivity
Application
integration Messaging
Cloud & Big Data
integration
Mainframe &
data integration
Process
automation
Case
management
Mobile
enablement
Task & work
management
Rules
management
Content
management
Dynamic
orchestration
Robotic process
automation
Low code app
development
Visual
analytics
In-Memory
store & compute
Machine
learning
Event routing
& persistence
Alerts &
actions
Distributed
caching
Predictive
analytics
Streaming
analytics
Edge
analytics
© 2018 Software AG. All rights reserved.

41 | © 2018 Software AG. All rights reserved.
5. IOT PLATFORM – OFFERING AND CORE CAPABILITIES
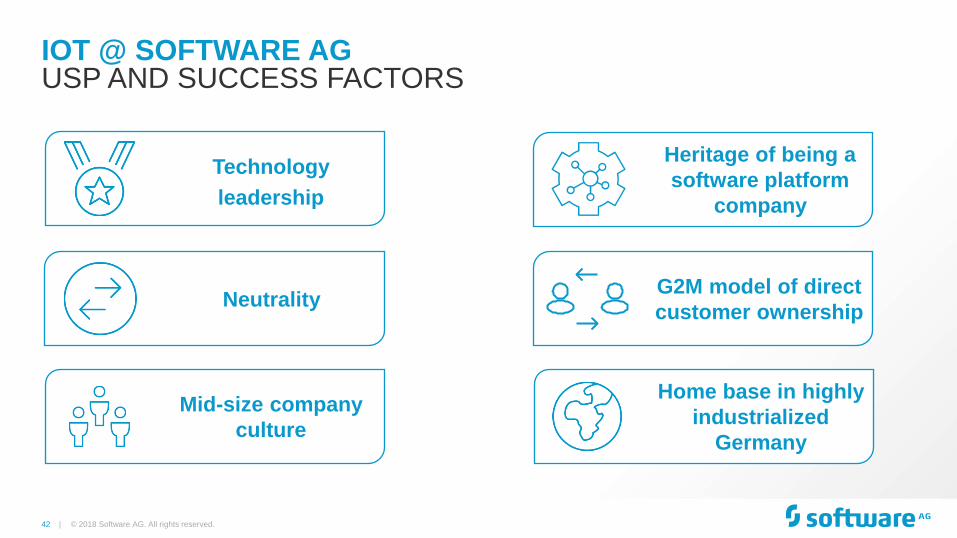
42 |
Technology
leadership
Neutrality
Home base in highly
industrialized
Germany
Mid-size company
culture
© 2018 Software AG. All rights reserved.
G2M model of direct
customer ownership
Heritage of being a
software platform
company
IOT @ SOFTWARE AG USP AND SUCCESS FACTORS

43 |
HYBRID INTEGRATION
© 2018 Software AG. All rights reserved.
DRIVING “PERVASIVE” CONNECTIVITY
Hybrid
Integration
“Things”
Mobile Apps
Social Networks On-Premises
Applications and Data Sources
Business
Process
Networks
Business
Partners
Subsidiaries
SaaS/Cloud
Services
EDW Mart
MDM

44 |
COMPONENTS OF AN END-TO-END IOT SOLUTION
© 2018 Software AG. All rights reserved.
Business challenges
• Create IoT solutions for smarter products and higher-value services
• Deliver value of IoT solutions quickly: start small & scale in iterations
• Balance risk & innovation: leverage new technologies, but stay open and flexible
• Benefit from best practice, IoT methodology and proven tools
IoT Edge Platform IoT Endpoints
ERP
CRM
SaaS
IoT Cloud Platform Enterprise Applications
Gateway
Long-range
Communication
Integration Local
Communication Edge
Server

45 |
CUMULOCITY IOT - A NEW IOT PLATFORM
© 2018 Software AG. All rights reserved.
COMBINING THE POWER OF CUMULOCITY WITH THE DIGITAL BUSINESS PLATFORM

46 |
IoT Framework
Scale Out (Enterprise Level)
• Cross divisional end-to-end
company processes
• Coding, professional developers
• Existing and new IoT applications
fully interwoven
Growing Maturity Level over Time
Fle
xib
ilit
y &
So
ph
isti
cati
on
DIFFERENT USER LEVELS FOR DIFFERENT CUSTOMER NEEDS
IoT SaaS
Fast Entry
• Self-service, out-of-the-box
• Pre-defined solution accelerators
IoT PaaS
Fan Out (Departmental)
• High productivity, fast go-to-market
• Smart rules
• Focus on business users
© 2018 Software AG. All rights reserved.

47 |
USE OF MACHINE LEARNING
… operationalizes these models to
enable organizations to respond
intelligently.
© 2018 Software AG. All rights reserved.
… uses machine learning to allow
organizations build models that
represent patterns of behavior.
Predictive Analytics Streaming Analytics
48 |
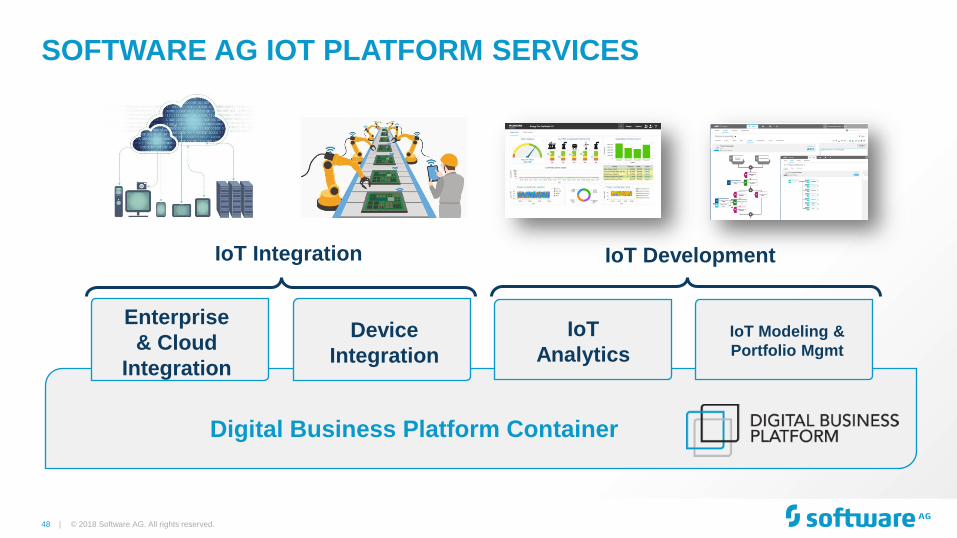
SOFTWARE AG IOT PLATFORM SERVICES
© 2018 Software AG. All rights reserved.
Digital Business Platform Container
IoT
Analytics Device
Integration
Enterprise
& Cloud
Integration
IoT Integration
IoT Modeling &
Portfolio Mgmt
IoT Development

49 |
SOFTWARE AG MAIN ACQUISITIONS FOR IOT
© 2018 Software AG. All rights reserved.
EXTENDS OUR TECHNOLOGY LEADERSHIP
• Follows a common technology vision
• Is already integrated in Digital Business
Platform
• Enables smarter applications across all
industry verticals
• Important capability for IoT use cases
• Key customer wins
AI, machine learning & predictive analytics
• Strong telco experience (Nokia spin-off)
• Development of IoT platform since 2010
• Integration
• Visualization and Templates
• Real-time Analytics
• Device Management
• Connectivity:
Multi protocol / machine languages
(300+ industrial protocols)
IoT PaaS – End-to-End Cloud Platform

50 |

51 |
5 PARTNERS – 5 PROMISES JOINT VENTURE

52 |

53 |
ADAMOS.COM
ADAMOS TOTAL VIEW
APP FACTORY
ALLIANCE
PARTNER
ECO SYSTEMS
ADAMOS
JV
… App App
APP MARKET PLACE
APP INNOVATION
& CERTIFICATION
COUNCIL
App App App
App App App App
ADAMOS
IoT SUITE
GOVERNANCE (Standards, Interfaces, …)
App App App App App App App
NEW
Enterprise & Cloud Integration
Device
Connectivity &
Management
Real-time
Analytics &
Visualization
Workflow
Automation …
NEW
App App
NEW
© 2018 Software AG. All rights reserved.

54 |
ADAMOS.COM
ADAMOS JV (ADAMOS GMBH)
ADAMOS
JV
PARTNER
ECO SYSTEMS
… App App
APP MARKET PLACE
APP INNOVATION
& CERTIFICATION
COUNCIL
App App App
App App App App
ADAMOS
IoT SUITE
App App App App App App App
NEW
Enterprise & Cloud Integration
Device
Connectivity &
Management
Real-time
Analytics &
Visualization
Workflow
Automation …
NEW
App App
ADAMOS
JV
APP MARKET PLACE
ADAMOS
IoT SUITE
App App App App App App App
Enterprise & Cloud Integration
Device
Connectivity &
Management
Real-time
Analytics &
Visualization
Workflow
Automation …
ADAMOS
JV APP MARKET PLACE
ADAMOS
IoT SUITE
App App App App App App App
Enterprise & Cloud Integration
Device
Connectivity &
Management
Real-time
Analytics &
Visualization
Workflow
Automation …
General
Management
• ADAMOS JV, is responsible to
provide state-of-the-art software and
solutions, independent of specific
software vendors (no lock in)
• ADAMOS JV is IaaS/PaaS operation
unit with no direct access to
customers, but responsible for
partner management
• Shareholders of ADAMOS will be
the founders and further leading
mechanical engineering companies
at equal share (Premium Partner,
max 10)
• Additional Partners (none-
shareholders) are users of the
ADAMOS platform with minimum
commitment
Supervisory
Board
Technology
Council
Pricing
Committee
Device
Connectivity &
Management
Real-time
Analytics &
Visualization
Workflow
Automation …
© 2018 Software AG. All rights reserved.

55 |
ADAMOS.COM
ADAMOS APP FACTORY ALLIANCE
APP FACTORY
ALLIANCE
… App App
APP MARKET PLACE
App
App App App App
ADAMOS
IoT SUITE
GOVERNANCE (Standards, Interfaces, …)
App App App App App App App
NEW
Enterprise & Cloud Integration
Device
Connectivity &
Management
Real-time
Analytics &
Visualization
Workflow
Automation …
APP FACTORY
ALLIANCE
GOVERNANCE (Standards, Interfaces, …)
The App Factory Alliance is a strategic cooperation of the
partners’ software divisions
Each App Factory develops primarily apps for its eco-system
owner and has also direct access to customers.
Core activities within the App Factory Alliance:
app development best practices
common standards and procedures
common app certification rules and processes
common market place for shared apps (op. by ADAMOS)
common I4.0 solutions cross partners for customers
Benefits for members are:
1. App development network
2. Large variety of applications
3. Cost efficiency: shared innovation & development
4. Reselling: own applications to other partners
5. Time-to-market: joint roadmaps, re-usability and sharing.
APP INNOVATION
& CERTIFICATION
COUNCIL
App App App
NEW
NEW
© 2018 Software AG. All rights reserved.

56 |
ADAMOS.COM
ADAMOS MARKETPLACES (ECO SYSTEMS)
ADAMOS
JV APP MARKET PLACE
APP INNOVATION
& CERTIFICATION
COUNCIL
App App App
ADAMOS
IoT SUITE
App App App App App App App
Enterprise & Cloud Integration
Device
Connectivity &
Management
Real-time
Analytics &
Visualization
Workflow
Automation …
NEW
• Eco systems provide Apps for the
the digital market places, which are
built in the App Factory Alliance
• Each partner keeps their own digital
innovation identity to the market
• Digital market places are operated
on the ADAMOS IoT Platform
• Partners can use a market place
blue-print to get started faster
• Market places are cloud based and
have a pricing model „pay per use „
for risk sharing
• Small partners without an own
market place can use the ADAMOS
market place
PARTNER
ECO SYSTEMS
… App App App App App App
NEW
App App
© 2018 Software AG. All rights reserved.

57 |

58 | © 2018 Software AG. All rights reserved.
6. CUSTOMER REFERENCES & USE CASES

59 |
Increase operational
efficiency
Optimize use of
assets
Better reliability
of equipment Improve product
quality
Efficiency & Optimizations
Offer higher-value
services with new
revenue models
“Assets as a service”
instead of owned
assets
Better customer
experience & new
engagements
Staying
competitive
New Business Models
© 2018 Software AG. All rights reserved.
SOFTWARE AG: EXAMPLE CUSTOMERS & USE CASES

60 |
FULLY TAILORED DEVICE & APPLICATION MANAGEMENT IoT PLATFORM ADOPTION
“The Deutsche Telekom ‘Cloud of Things’ [has] removed many concerns
about the perceived overheads for IoT deployment and allows our
customer’s equipment to be connected in minutes.”
- Alexander Lautz, Senior Vice President M2M, Deutsche Telekom
About Deutsche Telekom Deutsche Telekom is one of the world's leading telecommunications
companies, with 143 million mobile customers, 31 million fixed-network lines,
and over 17 million broadband lines.
Business Need Deutsche Telekom desired to expand its offering from its managed
connectivity foundations to provide a suite of capabilities to solve its
customers’ business problems, in particular those encountered through digital
transformation, limit the impact of connectivity price erosion.
Solution • Private Edition of Cumulocity IoT Platform
• Deployment in Deutsche Telekom Data Centre
• Fully rebranded Deutsche Telekom
• Dashboard, business rule and user interface customisation for solution
business
• Fault detection, automated resolution management and SLA monitoring for
operations
• Documentation, technical forum and support for developers
• Rapid low cost Proof-of-Concept (PoC) package for end customer projects
Benefits • Innovative Flexible Offering – Leveraging “ready made” software
• Additional M2M / IoT Solution Revenue – Trusted solution partner
• Local Deployment – Ensuring data security and service management
© 2018 Software AG. All rights reserved.

61 |
SUPPLY CHAIN AUTOMATION & AUTOMATED BILLING FOR DISTRIBUTORS (ERP INTEGRATION)
“The Cumulocity solution for our Nespresso Capsule Dispensers helped
us to reduce out-of-order and out-of-stock situations to a minimum.”
Raoul Marechal, Technics and Operations Manager, Lyreco
About Lyreco Lyreco is one of the leading global distributors of office and work supplies,
delivering 235,000 boxes every day at a 99.4% service rate from 400,000 m2 of
distribution centres using 1,750 vans and drivers.
Business Need Nespresso customers expect the highest quality from the product, the machine
and the service. Lyreco sought to ensure that every Nespresso customer would
always be served the highest quality whenever they desired, and in the most
ecological way.
Solution • Cumulocity VendMe vending machine, stock and operations management
application
• Dedicated Edition of the Cumulocity IoT Platform
• Vending machine telemetry devices and cellular connectivity
• Fully integrated to Lyreco SAP Enterprise Resource Planning (ERP) system
• Formulation and deployment of vending operations specific business rules
• Android and iPhone smartphone vending operator app
• Set up and available in 2 weeks
Benefits
• Cost-Effective Service Assurance – Avoid out-of-stock / out-of-order
• Operational Cost Savings – Fully automated supply chain
• Future Proof – Open APIs ensure easy extensions and no lock-in
© 2018 Software AG. All rights reserved.

62 |
ABOUT WINORA
Winora manufactures bicycles in Germany since 95 years, with
highest standards of quality, functionality and safety. Technology
and design have significantly changed.
BUSINESS NEED:
With the ongoing digitalization and need for constant innovation,
Winora wanted to provide digital connected Smart eBikes to
their customers.
SOLUTION:
Deutsche Telekom connected the Bikes to the IoT platform,
enabling Winora customers to see online view of routes/sports
activities, theft alerts with GPS monitoring as well as crash-
detection with emergency notifications to friends/relatives.
BENEFITS:
• The project is ongoing, commercial launch was in Spring
2017.
• Presentation of the system in EuroBike event resulted in
extremely positive market and consumer feedback, as well
as an increase in ordering numbers for Sduro eBikes.
© 2018 Software AG. All rights reserved.

63 |
SOFTWARE TRANSFORMS
© 2018 Software AG. All rights reserved.
“The ability to respond quickly to client requests and roll out completely new service offerings in
two months gave us a huge strategic advantage. Our team, working with Software AG’s IoT
platform, made it happen.”
— Ton de Jong | CIO, Royal Dirkzwager
From data overload to data advantage with IoT For Royal Dirkzwager and their clients, knowing where a vessel is at sea is paramount. But the
world’s oceans are large and tricky to monitor. To cope with the continuous stream of
information—and to exploit it for added functionality and reduced costs—Royal Dirkzwager
turned to Apama Analytics & Decisions and webMethods Integration, part of the Software AG
Digital Business Platform. And just like that, the liability of overload turned into a strategic
advantage by sifting through and utilizing information to help Royal Dirkzwager’s clients make
better maritime logistics decisions.
Customer Profile Royal Dirkzwager tracks nearly 2 trillion ship locations a
year for 800 maritime organizations in real time.
New Challenges • Overwhelming data volumes
• Growing demand for precision ship tracking
• Increasing customer functionality requests
Software AG Solutions Digital Business Platform:
• Real-Time Analytics powered by Apama
• Application Integration powered by webMethods
Key Benefits • Increased real-time message handling from 500 to
1,500 per second
• Extended live ship tracking from 40km off-coast to
global capture
• Enabled accurate, customer-accessible ship ETAs
• Reduced new service turnaround time
ROYAL DIRKZWAGER
64 | © 2018 Software AG. All rights reserved.
7. FINANCIALS

65 |
* EPS basic, 2007 – 2010 pro-forma, adjusted for share split (2011)
in €m, IFRS 2017 2016 2015 2014 2013 2012 2011 2010 2009 2008 2007
Total Revenue 879.0 871.8 873.1 857.8 972.7 1,047.3 1,098.3 1,119.5 847.4 720.6 621.3
BL DBP 455.4 441.4 431.5 394.5 422.9 385.5 339.6 321.5 247.2 210.7 149.9
BL A&N 223.7 234.6 248.0 245.3 274.5 310.5 313.9 355.4 328.5 332.1 310.2
BL Consulting 199.9 195.8 193.6 218.0 275.4 351.3 444.8 441.4 271.3 177.8 161.1
Group License 256.7 263.0 271.9 270.1 330.1 318.9 295.2 327.4 269.9 272.0 241.3
Group Maintenance 421.6 412.2 406.9 371.3 375.6 393.3 378.7 369.4 310.6 267.1 212.9
EBIT 222.8 213.9 209.4 176.0 205.5 248.3 269.2 268.6 218.2 180.5 136.8
EBITA (non-IFRS) 279.5 272.0 259.1 239.3 260.7 298.9 n/a n/a n/a n/a n/a
EPS (in €, non-IFRS)* 2.38 2.37 2.22 1.96 2.07 2.31 n/a n/a n/a n/a n/a
Dividend cash out 44.3 41.9 39.5 39.5 36.3 38.2 39.9 37.0 32.6 31.5 28.5
Free cash flow 161.9 187.0 170.0 132.7 159.1 170.7 187.7 217.8 188.4 133.4 82.2
Net cash / Net debt 55.2 73.1 -25.7 -15.1 -50.4 49.7 -60.9 -167.2 -271.8 -70.3 -133.0
Shareholders‘ equity 1,118.3 1,196.8 1,089.8 1,013.4 965.6 1,060.1 951.5 769.3 647.2 549.1 462.5
Employees (FTE) 4,596 4,471 4,337 4,421 5,238 5,419 5,535 5,644 6,013 3,526 3,479
FINANCIAL DATA
© 2018 Software AG. All rights reserved.
KEY FIGURES

66 |
1. Return on equity: Operating EBIT / Equity
2. Return on cap. employed: Operating EBIT / (Fixed assets + Working capital)
3. Current assets ./. Cash and Cash Equivalents ./. Current liabilities
4. Current assets ./. Current liabilities / Total revenue
5. (Operating Cash flow ./. Capex) / Revenue.
IFRS unless stated different
FY 2017 FY 2016 FY 2015 FY 2014 FY 2013 FY 2012 FY 2011 FY 2010 FY 2009 FY 2008
FY 2007
Operating margin (EBITA, non-IFRS)
31.8 31.2 29.7 27.9 26.8 28.5 n.a. n.a. n.a. n.a. n.a.
EBITDA margin 30.0 29.1 29.7 26.4 26.6 28.6 28.7 28.1 30.3 28.6 25.7
EBIT margin 25.3 24.5 24.0 20.5 21.1 23.7 24.5 24.0 25.8 25.1 23.3
ROE1 19.9 17.9 19.2 17.4 21.3 23.4 28.3 34.9 33.7 32.9 31.8
ROCE2 18.0 15.2 16.1 12.6 14.6 18.2 20.5 27.4 20.9 26.2 22.5
Net Working Capital (€m)3 -€298.1 -€200.2 -€155.9 -€98.1 -€213.5 -€41.6 -€23.8 -€194.4 -€211.3 -€74.1 -€55.0
Working Capital ratio4 7.7 20.0 16.6 25.7 24.3 26.2 17.5 -8.2 0.8 3.2 4.2
Free Cash Flow margin5 18.4 21.4 19.5 15.5 16.4 16.3 17.1 19.5 22.2 18.5 13.2
Corporate tax rate 37.3 33.0 32.4 33.7 32.0 31.2 31.7 31.0 32.7 34.0 35.4
WACC6 4.95 4.05 4.13 4.35 5.12 5.1 5.7 6.8 5.5 6.8 8.4
Equity ratio 58.6 61.2 60.1 54.8 48.4 59.8 56.6 48.1 39.1 51.8 47.2
DSO (Days Sales Outstanding) 103 113 111 115 107 105 93 100 109 120 119
Capex (€m) €27.5 €16.7 €15.5 €10.5 €12.7 €13.3 €10.9 €9.7 €12.1 €6.6 €11.8
Capital Employed7 (€m) €1,248.4 €1,381.9 €1,282.8 €1,326.0 €1,346.3 €1,313.0 €1,262.0 €929.6 €1,002.2 €669.9 €655.2
KEY FINANCIAL RATIOS
© 2017 Software AG. All rights reserved.
IN % OF REVENUE
6. Pro forma, not applied for corporate management
7. Fixed assets + Working capital

67 |
DBP Total Revenue
Adabas & Natural
Operating Margin Group
(EBITA non-IFRS)2)
OUTLOOK
© 2018 Software AG. All rights reserved.
FULL YEAR 2018
1) At constant currency rates 2) Adjusted for non-operating items (see non-IFRS earnings results) 3) Weighted average shares outstanding (basic/IAS 33.19) FY 2017: 74.6m / FY 2018: 74.0m; based on new US-Federal-Tax and Euro/US-Dollar exchange rate of 1/1.18
FY 2017 (in €m)
223.7
455.4
31.8%
FY 2018 Outlook (as of January 25, 2018)
30% to 32%
-6% to -2%1)
N/A
FY 2017 (in €m)
223.7
455.4
31.8%
Current Reporting New Reporting
- IoT / Cloud N/A 14.9 +70% to +100%1)
- DBP excl. IoT / Cloud N/A +3% to +7%1) 440.5
EPS non-IFRS3) €2.38 +5% to +15% €2.38

68 |
KEY REVENUE METRICS FY
© 2018 Software AG. All rights reserved.
441.4
234.6
455.4
223.7
0
100
200
300
400
500
DBP Revenue A&N Revenue
FY 2016
FY 2017
€m
31.20% 31.80%
0%
10%
20%
30%
EBITA (non-IFRS) in % of Group Revenue

69 |
Euro 34%
US Dollar 31%
Other 15%
CURRENCY IMPACT ON REVENUE
© 2018 Software AG. All rights reserved.
Q4 2017 / FY 2017
(in €m; yoy)
Q4
2017
Q4
in %
FY
2017
FY
in %
Licenses -7.3 -6% -7.2 -3%
Maintenance -5.2 -5% -2.2 -1%
Consulting & Other -1.2 -2% -0.6 0%
Total -13.7 -5% -10.0 -1%
Currency impact on revenue
34% revenue in Euro
66% revenue in foreign currency
Currency split FY 2017
BRL 4%
ZAR 3%
AUD 3%
GBP 6%
ILS 4%

70 |
REVENUE
© 2018 Software AG. All rights reserved.
Q4 2017 / FY 2017
(in €m) Q4
2017
Q4
2016
∆% ∆%
acc
FY
2017
FY
2016
∆% ∆%
acc
Product revenue 219.0 213.7 3% 8% 678.3 675.2 0% 2%
Licenses 115.3 107.5 7% 14% 256.7 263.0 -2% 0%
Maintenance 103.7 106.2 -2% 2% 421.6 412.2 2% 3%
Consulting 48.8 49.8 -2% 0% 198.8 195.2 2% 2%
Other 0.6 0.4 - - 1.9 1.4 - -
Total 268.4 263.9 2% 7% 879.0 871.8 1% 2%
Segment result 6.2 7% 20.8

71 |
DIGITAL BUSINESS PLATFORM SEGMENT REPORT Q4 2017 / FY 2017
(in €m) Q4
2017
Q4
2016
∆% ∆%
acc
FY
2017
FY
2016
∆% ∆%
acc
Licenses 77.8 78.1 0% 6% 186.9 186.3 0% 3%
Maintenance 66.9 66.3 1% 6% 268.5 255.1 5% 6%
Total revenue 144.7 144.4 0% 6% 455.4 441.4 3% 5%
Cost of sales -12.0 -9.2 30% 34% -33.3 -31.3 6% 8%
Gross profit 132.7 135.2 -2% 4% 422.1 410.1 3% 5%
Sales & Marketing -49.6 -52.1 -5% 0% -174.3 -172.4 1% 2%
Research & Development -25.7 -23.7 8% 9% -96.9 -89.9 8% 6%
Segment result 57.4 59.4 -3% 5% 150.9 147.8 2% 7%
Margin in % 39.7% 41.1% 33.1% 33.5%
© 2018 Software AG. All rights reserved.

72 |
ADABAS & NATURAL
© 2018 Software AG. All rights reserved.
SEGMENT REPORT Q4 2017 / FY 2017
(in €m) Q4
2017
Q4
2016
∆% ∆%
acc
FY
2017
FY
2016
∆% ∆%
acc
Licenses 37.6 29.4 28% 37% 69.9 76.8 -9% -6%
Maintenance 36.8 39.9 -8% -3% 153.1 157.1 -3% -3%
Product revenue 74.4 69.3 7% 14% 223.0 233.9 -5% -4%
Other 0.2 0.2 0% 5% 0.7 0.7 0% -1%
Total revenue 74.6 69.5 7% 14% 223.7 234.6 -5% -4%
Cost of sales -2.8 -3.1 -10% -7% -10.1 -11.7 -14% -12%
Gross profit 71.8 66.4 8% 15% 213.6 222.9 -4% -3%
Sales & Marketing -10.0 -13.8 -28% -24% -33.3 -38.0 -12% -11%
Research & Development -6.1 -6.1 0% 1% -23.8 -22.5 6% 5%
Segment result 55.7 46.5 20% 28% 156.5 162.4 -4% -3%
Margin in % 74.6% 66.9% 70.0% 69.2%

73 |
CONSULTING
© 2018 Software AG. All rights reserved.
SEGMENT REPORT Q4 2017 / FY 2017
(in €m) Q4
2017
Q4
2016
∆% ∆%
acc
FY
2017
FY
2016
∆% ∆%
acc
Total revenue 49.2 50.0 -2% 1% 199.9 195.9 2% 2%
Cost of sales -40.2 -39.0 3% 5% -156.9 -157.5 0% 0%
Gross profit 9.0 11.0 -18% -15% 43.0 38.4 12% 14%
Sales & Marketing -4.9 -4.8 2% 6% -19.1 -17.6 9% 10%
Segment result 4.1 6.2 -34% -31% 23.9 20.8 15% 17%
Margin in % 8.3% 12.4% 11.9% 10.6%
74 |
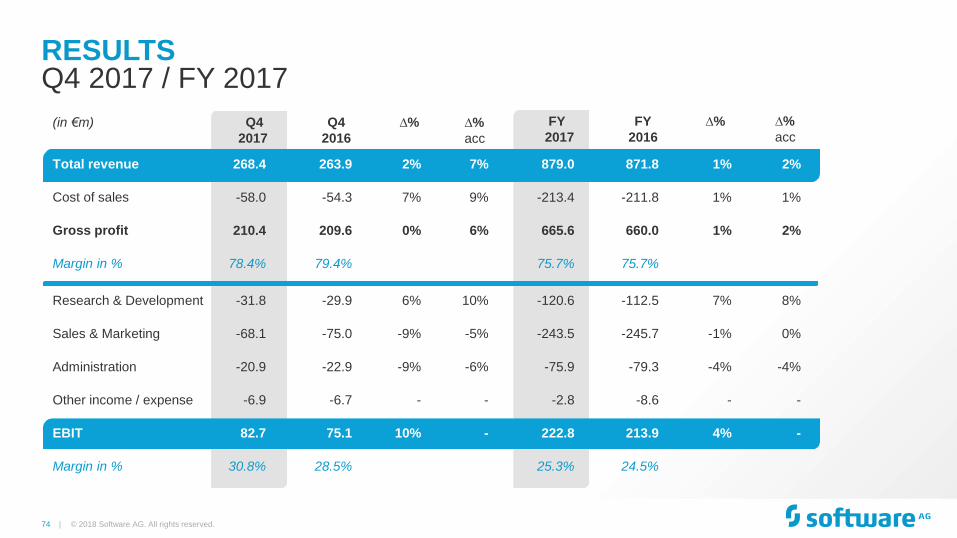
RESULTS
© 2018 Software AG. All rights reserved.
Q4 2017 / FY 2017
(in €m) Q4
2017
Q4
2016
∆% ∆%
acc
FY
2017
FY
2016
∆% ∆%
acc
Total revenue 268.4 263.9 2% 7% 879.0 871.8 1% 2%
Cost of sales -58.0 -54.3 7% 9% -213.4 -211.8 1% 1%
Gross profit 210.4 209.6 0% 6% 665.6 660.0 1% 2%
Margin in % 78.4% 79.4% 75.7% 75.7%
Research & Development -31.8 -29.9 6% 10% -120.6 -112.5 7% 8%
Sales & Marketing -68.1 -75.0 -9% -5% -243.5 -245.7 -1% 0%
Administration -20.9 -22.9 -9% -6% -75.9 -79.3 -4% -4%
Other income / expense -6.9 -6.7 - - -2.8 -8.6 - -
EBIT 82.7 75.1 10% - 222.8 213.9 4% -
Margin in % 30.8% 28.5% 25.3% 24.5%

75 |
EARNINGS
© 2018 Software AG. All rights reserved.
Q4 2017 / FY 2017
* Weighted average shares outstanding (basic) Q4 2017: 74.0m / Q4 2016: 76.2m / FY 2017: 74.6m / FY 2016: 76.2m
(in €m) Q4
2017
Q4
2016 ∆%
FY
2017
FY
2016
∆%
EBIT (before all taxes) 82.7 75.1 10% 222.8 213.9 4%
Financial result 1.9 -1.8 - 1.4 -4.4 -
Profit before taxes 84.6 73.3 15% 224.2 209.5 7%
Other taxes -1.9 -1.6 19% -7.2 -5.5 31%
Income taxes -34.5 -21.5 60% -76.4 -63.6 20%
Tax rate in % 43.0% 31.5% 37.3% 33.0%
Net income 48.2 50.2 -4% 140.6 140.4 0%
EPS in €* €0.65 €0.66 -2% €1.88 €1.84 2%

76 |
NON-IFRS EARNINGS
© 2018 Software AG. All rights reserved.
Q4 2017 / FY 2017
* Weighted average shares outstanding (basic) Q4 2017: 74.0m / Q4 2016: 76.2m / FY 2017: 74.6m / FY 2016: 76.2m
(in €m) Q4
2017
Q4
2016 ∆%
FY
2017
FY
2016 ∆%
EBIT (before all taxes) 82.7 75.1 10% 222.8 213.9 4%
Amortization on acquisition related intangible assets 6.6 7.3 -8% 29.6 29.1 2%
Share based payments 6.1 3.2 91% 20.7 14.2 46%
Restructuring / severances / legal case 2.0 2.9 -7% 4.7 11.8 -54%
Other impacts / impacts from M&A activities 1.0 1.7 -41% 1.7 3.0 -67%
EBITA (non-IFRS) 98.4 90.2 9% 279.5 272.0 3%
in % of revenue (Non-IFRS) 36.7% 34.2% 31.8% 31.2%
Net income (non-IFRS) 56.7 61.1 -7% 177.3 180.4 -2%
EPS in € (non-IFRS)* €0.77 €0.80 -4% €2.38 €2.37 0%

77 |
FY
2017
Amortization
(in €m)
Depreciation
* Estimated
FY
2018*
AMORTIZATION / DEPRECIATION IMPACT
© 2018 Software AG. All rights reserved.
(PRELIMINARY)
29.6
11.6
19.7
12.0
FY
2019*
Q1
2017
Q1
2017
7.8
2.9
Q2
2017
7.8
2.9
8.5
2.9
Q3
2017
6.7
2.8
Q1
2017
6.6
3.0
Q4
2017
17.7
12.0

78 |
CASH FLOW
© 2018 Software AG. All rights reserved.
Q4 2017 / FY 2017
* Cash flow from investing activities except acquisitions and except investments in debt instruments
** yoy change because of one time property investment at Darmstadt
*** Based on weighted average shares outstanding (basic) Q4 2017: 74.0m / Q4 2016: 76.2m / FY 2017: 74.6m / FY 2016: 76.2m
**
(in €m) Q4
2017
Q4
2016 ∆%
FY
2017
FY
2016 ∆%
Operating cash flow 43.4 46.5 -7% 189.4 203.7 -7%
./. CapEx* -2.8 -4.9 -27.5 -16.7
Free cash flow 40.6 41.6 -2% 161.9 187.0 -13%
in % of revenue 15.1% 15.8% 18.4% 21.4%
Free cash flow per share*** €0.55 €0.55 0% €2.17 €2.45 -11%

79 |
365.8
Dec. 31,
2017
Dec. 31,
2017
Assets Liabilities
BALANCE SHEET
© 2018 Software AG. All rights reserved.
(in €m)
Dec. 31,
2016
Dec. 31,
2016
374.6
305.9
55.7
1,161.6
1,957.2
Cash and cash equivalents
Financial assets
Trade and other receivables
Fixed assets
(Goodwill 921.4 / 936.6)
Total
59.4
Non-financial assets
301.5
327.0
133.1
1,195.6
1,957.2
Financial liabilities
Other liabilities
Deferred income
Shareholders’ equity
(ratio 58.6% / 61.1%)
Total
279.6
55.3
1,125.9
1,907.5
80.9
310.6
357.8
120.8
1,118.3
1,907.5

80 |
HEADCOUNT BY FUNCTIONAL AREAS* AND GEOGRAPHY
© 2018 Software AG. All rights reserved.
26% 1,176 (+6%)
19% 862 (+2%)
13% 623 (+3%)
42% 1,935 (+1%)
Research &Development
Sales &Marketing
Administration
Consulting &Services
26% 1,201 (+5%)
18% 823 (-4%)
13% 823 (+7%)
43% 1,997 (+2%)
Germany
India
USA
Rest of World
* According to P+L structure as of December 31, 2017
Total: 4,596 (FTE)

81 | © 2018 Software AG. All rights reserved.
8. SHARES & OWNERSHIP

82 |
SHAREHOLDER STRUCTURE
© 2018 Software AG. All rights reserved.
32.7% 59.3%
Software AGFoundation
Own Shares
InstitutionalInvestors
Private Investors
1) according to notification of voting rights above 3% threshold
Number of total shares: 76,400,000
Thereof Free Float: ~ 64%
Number of shares outstanding: ~ 74m
Registered shares since Oct. 2, 2017
Share Data Major Free Float Shareholders1)
35.3%
26.2%
21.6%
16.3%
Germany
North America
Continental Europe(excl. Germany)
UK & Ireland
Rest of World
Share Info
SOW, SOW:GR, SOWGn.DE
ISIN: DE000A2GS401
ADR symbol: STWRY
Indices: TecDAX, DAX100, TechAllShare
Deutsche Asset Mgt. Investment 4.91% 20.10.2017
OWNERSHIP REGIONAL SPLIT(FREE FLOAT)

83 |
0.30* 0.33* 0.37* 0.38*
0.43* 0.46 0.46 0.46
0.50 0.55
0.60
2006 2007 2008 2009 2010 2011 2012 2013 2014 2015 2016
DIVIDEND POLICY
© 2018 Software AG. All rights reserved.
FOCUS ON CONTINUITY
Dividend by fiscal year
(in € per share)
* According to the 1:3 stock split, rounded

84 |
CASH USE:
© 2018 Software AG. All rights reserved.
SHARE BUY-BACK 2013-17
Buy-back own shares
2013 - 2014
Cancellation of
treasury shares
April 30, 2015
Buy-back own
shares 2015
Sept. 8, 2015 -
Dec. 4, 2015
Until cancellation / capital reduction:
Share capital: 86,943,945.00 €
Number of shares: 86,943,945
€m 225
9.2%
€m 70
3.4%
- 9.1%
-3.29%
Until cancellation / capital reduction:
Share capital: 79,000,000.00 €
Number of shares: 79,000,000
Cancellation of
treasury shares
March 14, 2017
Buy-back own
shares 2017
March 13, 2017 -
May 11, 2017
3.266%
Own shares
Position after
cancellation
March 15, 2017
Since cancellation / capital reduction:
Share capital: 76,400,000.00 €
Number of shares: 76,400,000
0.38%

85 |
0
50
100
150
200
250
2012 2013 2013 2014 2014 2015 2015 2016 2016 2017
Share Buy-Back +Dividends
Free Cash Flow
CASH RETURN TO SHAREHOLDERS
© 2018 Software AG. All rights reserved.
Ø ¾ FREE CASH FLOW TURNS INTO DIVIDENDS AND SBB
€m

86 |
SOFTWARE AG FOUNDATION
© 2018 Software AG. All rights reserved.
ANCHOR SHAREHOLDER
The Software AG Foundation is one of Germany’s ten largest foundations
(capital stock € 1bn+, Software AG shares and other assets)
Founded by Dr. hc. Peter M. Schnell in 1992
Disburses financial support amounting to approx. € 30 million annually
Principle of a “self-help grant” (supports nonprofit organizations)
The Foundation focuses on many different projects in areas including:
• science and research, environment
• support for the elderly and disabled, support for children and young people
• education and training

87 | © 2018 Software AG. All rights reserved.
Code of Business
Conduct and Ethics Values such as trust, respect,
sincerity and transparency shape
our international collaboration
and business
Promoting Employee
Engagement We foster our employees'
personal and professional
development
Corporate University
& University Relations Helping universities and their
students excel through grants
and collaboration
Software AG We believe that moral
principles and economic
rewards not only go
together, they belong
together.
CORPORATE SOCIAL RESPONSIBILITY
Software AG
Foundation one of Germany’s largest charities —
is the major shareholder
Creating sustainable value

88 |
ANALYST COVERAGE
© 2018 Software AG. All rights reserved.
Baader Helvea E.R.
Barclays Capital
Bryan, Garnier & Co
Commerzbank
Crédit Suisse
Deutsche Bank
DZ Bank
Equinet
Goldman Sachs
Hauck & Aufhäuser
HSBC
Independent Research
J.P. Morgan Cazenove
Kepler Cheuvreux
LBBW
MainFirst Bank AG
Metzler
Morgan Stanley
Oddo BHF
Société Générale
UBS I.R.
Warburg Research
For latest consensus of analysts‘ financial estimates visit our
IR website on: www.softwareag.com
Banks / Broker who cover Software AG on a regular base

89 |
INVESTOR RELATIONS
© 2018 Software AG. All rights reserved.
Uhlandstrasse 12
64297 Darmstadt
Germany
phone: +49 (0) 6151 / 92 1900
fax: +49 (0) 6151 / 9234 1900
softwareag.com
e-mail: [email protected]

90 | © 2018 Software AG. All rights reserved.


