28
Investor Update Q4 2017
Investor UpdateQ4 2017

WHO WE ARE(All amounts in this presentation are in U.S. dollars unless otherwise stated)
Slate Asset Management L.P. | 2
1 As of December 31, 2017
• Pure Play: 100% grocery-anchored portfolio, entirely located in the United States
o 86 properties located across 21 states totaling 11.2 million square feet¹
• Focused Strategy: Build scale in large markets with market-leading grocers
o Focus on over-looked secondary markets in Metropolitan Statistical Areas (“MSAs”)
with population of 1 million or more
• Embedded Growth: Below-market rents, limited new grocery store supply driving
occupancy gains, and anchor redevelopment opportunities
• Operators: Apply hands-on real estate expertise through a proactive approach to unlock
value in historically under-managed real estate
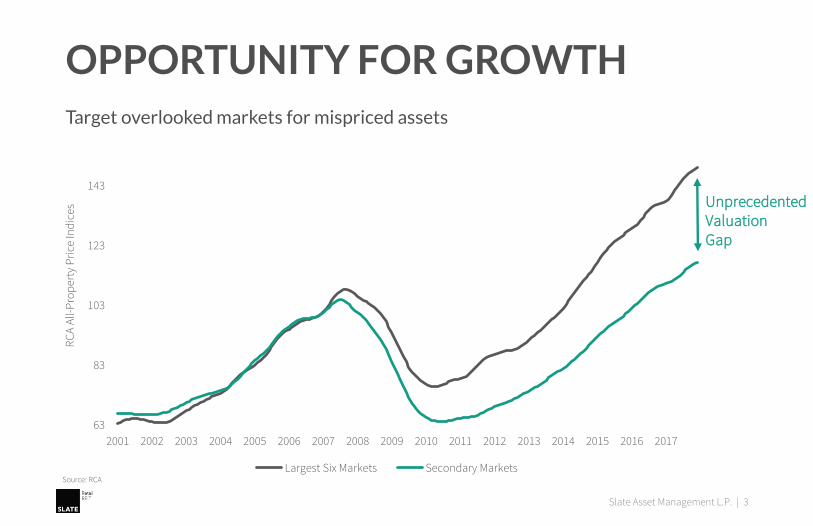
Source: RCA
UnprecedentedValuationGap
OPPORTUNITY FOR GROWTHTarget overlooked markets for mispriced assets
Slate Asset Management L.P. | 3
63
83
103
123
143
2001 2002 2003 2004 2005 2006 2007 2008 2009 2010 2011 2012 2013 2014 2015 2016 2017
RC
A A
ll-P
rop
erty
Pri
ce In
dic
es
Largest Six Markets Secondary Markets

ABILITY TO BUILD SCALE IN THE U.S.
Slate Asset Management LP | 4
Source: U.S. Census Bureau , Progressive Grocer
Canada | ~2,700 Grocery StoresUnited States | ~38,000 Grocery Stores
< Largest landlord controls ~1% of total inventory
^ Largest landlord controls ~20% of total inventory
There are ~15x more grocery stores in the U.S. than in Canada and the largest U.S. landlord only controls ~1% of the inventory, resulting in a fractured investment landscape in which to build scale (1 shopping cart represents ~500 grocery stores)
EXPOSURE TO LARGE U.S. MARKETS
Slate Asset Management L.P. | 5
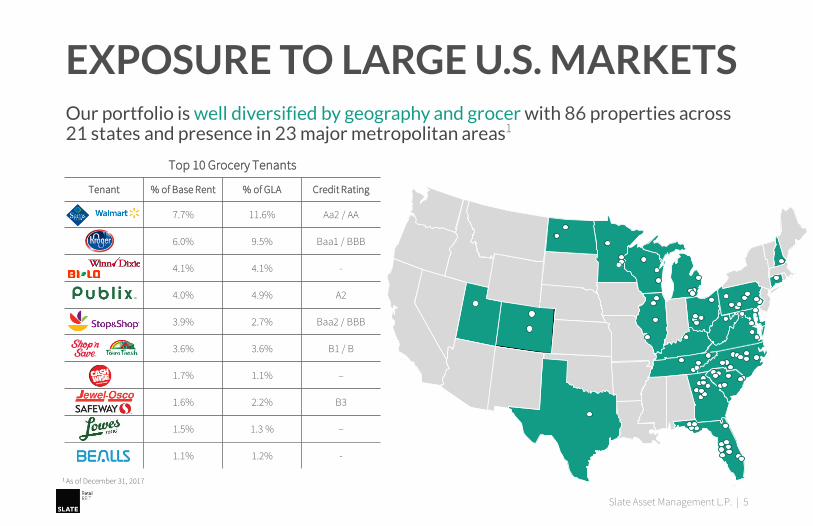
Top 10 Grocery Tenants
Tenant % of Base Rent % of GLA Credit Rating
7.7% 11.6% Aa2 / AA
6.0% 9.5% Baa1 / BBB
4.1% 4.1% -
4.0% 4.9% A2
3.9% 2.7% Baa2 / BBB
3.6% 3.6% B1 / B
1.7% 1.1% –
1.6% 2.2% B3
1.5% 1.3 % –
1.1% 1.2% -
Our portfolio is well diversified by geography and grocer with 86 properties across 21 states and presence in 23 major metropolitan areas1
1 As of December 31, 2017

FOCUS ON GROCERY RETAIL
• The grocery business is non-cyclical and less susceptible to economic fluctuation
o Visits to grocery store average 2-3x per week driving strong foot traffic, attracting other tenants to the center
• Grocery retailing is least threatened by the increasing popularity of e-commerce
• Grocery stores are strategically located close to houses in dense neighborhoods making it difficult to replace their efficacy online
99%Grocery purchases in the U.S. made in store
$700 blnU.S. grocery sales annually—the largest consumer segment by 70%
Slate Asset Management L.P. | 6
Sources: Kantar Group, U.S Commerce Dept, Progressive Grocer
Our strategy offers several attractive long-term defensive characteristics
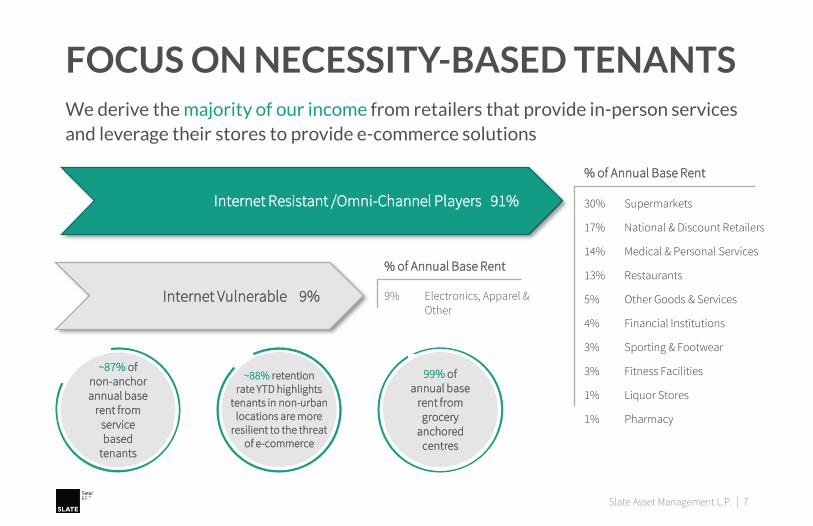
FOCUS ON NECESSITY-BASED TENANTS
Slate Asset Management L.P. | 7
We derive the majority of our income from retailers that provide in-person services
and leverage their stores to provide e-commerce solutions
Internet Resistant /Omni-Channel Players 91%
Internet Vulnerable 9%
% of Annual Base Rent
% of Annual Base Rent
9% Electronics, Apparel & Other
30% Supermarkets
17% National & Discount Retailers
14% Medical & Personal Services
13% Restaurants
5% Other Goods & Services
4% Financial Institutions
3% Sporting & Footwear
3% Fitness Facilities
1% Liquor Stores
1% Pharmacy
99% of annual base
rent from grocery
anchored centres
~87% of non-anchor annual base
rent from service based
tenants
~88% retention rate YTD highlights
tenants in non-urban locations are more
resilient to the threat of e-commerce

FOCUS ON NECESSITY-BASED TENANTS
Slate Asset Management L.P. | 8
78.2%
14.5%
7.3%
Neighbourhood Community Power
99.3%
0.7%
Grocery Anchored Other
Grocery-anchored neighborhood shopping centers are located closest to households
serving as local food distribution points
% of total base rent % of total base rent
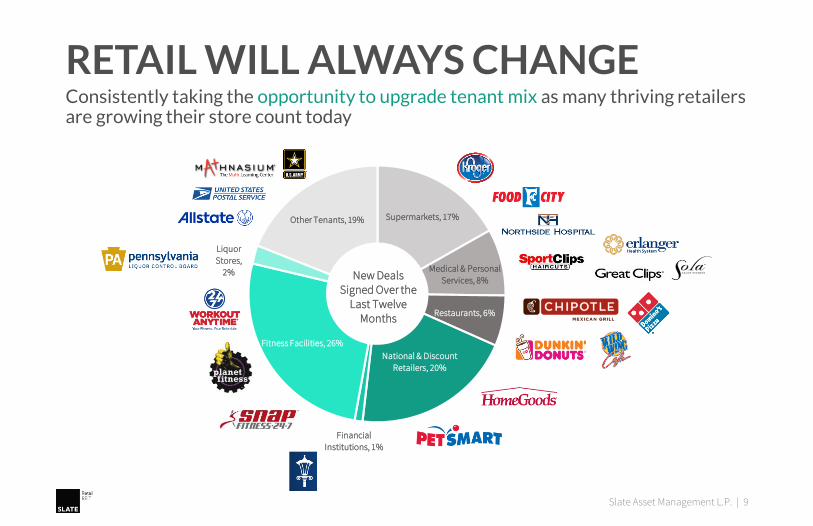
RETAIL WILL ALWAYS CHANGEConsistently taking the opportunity to upgrade tenant mix as many thriving retailers are growing their store count today
Slate Asset Management L.P. | 9
Supermarkets, 17%
Medical & Personal
Services, 8%
Restaurants, 6%
National & Discount
Retailers, 20%
Financial
Institutions, 1%
Fitness Facilities, 26%
Liquor
Stores,
2%
Other Tenants, 19%
New Deals Signed Over the
Last Twelve Months

PERCEPTION VS. REALITY2017 store closures have a limited impact on Slate Retail REIT
Slate Asset Management L.P. | 10
715
400
327
240 220 210
138 126106 105
68
3 0 0 0 0 1 0 0 1 0 0
Payless Rue21 Gymboree Family hhgregg Kmart JCPenny Gander Gordmans Sears Macy's
Total Retailer Store Closures (2,655) Slate Retail REIT Store Closures (5)
Limited annual impact on the REIT
0.7% of effective gross rent
10% re-leasing spread expected
on five impacted units

WELL-POSITIONED IN THE CYCLE
Net Completions of U.S. Community and Neighbourhood Shopping Centres 1999-2016Grocery-Anchored Supermarkets and Shopping Centres Occupancy 2007-2016
Source: CoStar
High occupancy and historically low new construction creates upward pressure on rents
Slate Asset Management L.P. | 11
784 755 647 611 692 783 883 890 847 751 351 134 112 89 69 74 81 85 82
94.5%
94.1%
93.4%
93.0%93.2%
93.4%
93.9%
94.3% 94.4%
95.2%
95.5%
1999 2000 2001 2002 2003 2004 2005 2006 2007 2008 2009 2010 2011 2012 2013 2014 2015 2016 2017
New Supply Occupancy
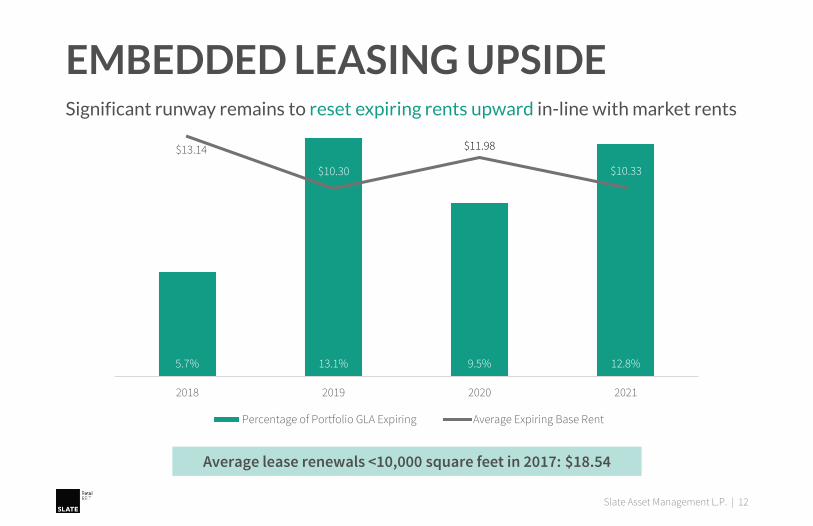
5.7% 13.1% 9.5% 12.8%
$13.14
$10.30
$11.98
$10.33
2018 2019 2020 2021
Percentage of Portfolio GLA Expiring Average Expiring Base Rent
EMBEDDED LEASING UPSIDESignificant runway remains to reset expiring rents upward in-line with market rents
Slate Asset Management L.P. | 12
Average lease renewals <10,000 square feet in 2017: $18.54

LEVERAGING PLATFORM FOR FUTURE ORGANIC GROWTH
Slate Asset Management L.P. | 13
1,507,118 square feet of leases signed in 2017
150,365
434,212
689,835 807,640
1,065,808
1,342,748
1,680,454
2,170,876
2,572,926
7.6
7.7 7.9 7.88.3 8.5
9.1
10.9 11.2
Q4'15 Q1'16 Q2'16 Q3'16 Q4'16 Q1'17 Q2'17 Q3'17 Q4'17
Cumulative Signed Leases Total Owned GLA (millions)

$14.74
$16.44
$17.24
$15.75
$17.76
$18.54
$14
$15
$16
$17
$18
$19
$20
2011-2015A 2016 YTD 2017
Expiring Rent New Rent
EMBEDDED LEASING UPSIDEGrowth through opportunistic acquisition followed by leasing and value creation
Slate Asset Management L.P. | 14
• Mark to market spread on shop space leases was 7.5% in 2017
• 510 naked leases¹ expiring through 2022 totaling 1.3M square feet
• Cumulative growth in new per square foot rental rates is 17.7% since 2011-2015 period
6.85%
8.02%
7.54%
¹Naked leases are defined as leases with no remaining options

VALUE CREATION THROUGH REDEVELOPMENT
• Projected incremental income of $3.75M drives potential gross value creation of $91.90M across 7 wholly-owned active redevelopment projects
• Estimated incremental yield on cost of ~10% assuming total estimated project costs of $37.80M
Slate Asset Management L.P. | 15
Progress to date exemplifies opportunity to grow NOI and create value
$ m
illio
ns
$180.00M
Gross Value Creation $91.90M
Estimated Annual Income for Active Redevelopments Illustrative Value Creation from Active Redevelopments
$5.61 $5.61
$3.75
$-
$1
$2
$3
$4
$5
$6
$7
$8
$9
$10
Series 1 Series 2
Pre-Development Income Projected Incremental NOI
$ m
illio
ns
$88.10 $88.10
$37.80
$54.10
$-
$20
$40
$60
$80
$100
$120
$140
$160
$180
$200
Acquisition Value Est. Value at Stabilization
Cost Basis Project Costs Net Value Creation

NAV GROWTH: REDEVELOPMENT PIPELINE
Slate Asset Management L.P. | 16
Current$37.80M
Future$50M - $75M
Projected Incremental NOI
Value Creation
Redevelopment Approach
• Driven by tenant demand not vice-versa
• Visible value creation; longer lease term, improved tenant mix, stronger tenant credit
• Build to own long-term
Risk Management
• Pre-leased prior to build-out
• Phased construction
• Experienced team
• Leverage long-standing relationships
$3.75M $54.10M
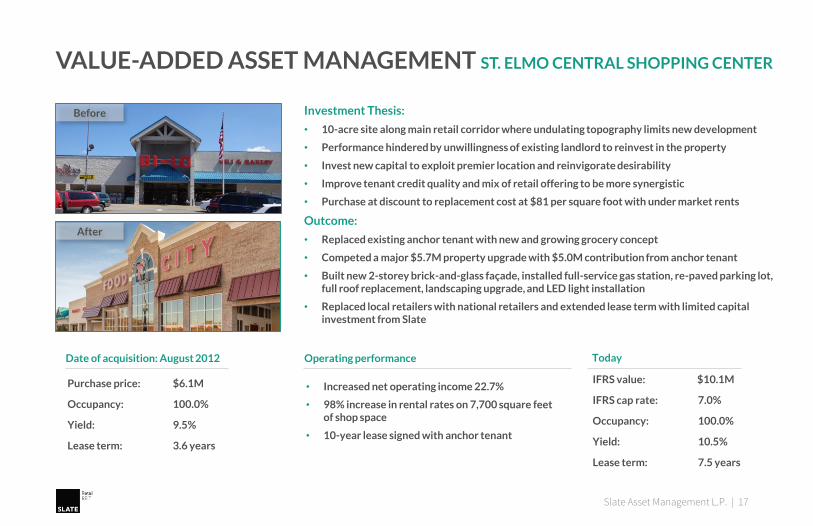
VALUE-ADDED ASSET MANAGEMENT ST. ELMO CENTRAL SHOPPING CENTER
Slate Asset Management L.P. | 17
Investment Thesis:
• 10-acre site along main retail corridor where undulating topography limits new development
• Performance hindered by unwillingness of existing landlord to reinvest in the property
• Invest new capital to exploit premier location and reinvigorate desirability
• Improve tenant credit quality and mix of retail offering to be more synergistic
• Purchase at discount to replacement cost at $81 per square foot with under market rents
Outcome:
• Replaced existing anchor tenant with new and growing grocery concept
• Competed a major $5.7M property upgrade with $5.0M contribution from anchor tenant
• Built new 2-storey brick-and-glass façade, installed full-service gas station, re-paved parking lot, full roof replacement, landscaping upgrade, and LED light installation
• Replaced local retailers with national retailers and extended lease term with limited capital investment from Slate
Purchase price: $6.1M
Occupancy: 100.0%
Yield: 9.5%
Lease term: 3.6 years
• Increased net operating income 22.7%
• 98% increase in rental rates on 7,700 square feet of shop space
• 10-year lease signed with anchor tenant
Before
After
Date of acquisition: August 2012 Operating performance Today
IFRS value: $10.1M
IFRS cap rate: 7.0%
Occupancy: 100.0%
Yield: 10.5%
Lease term: 7.5 years

VALUE-ADDED ASSET MANAGEMENT WESTHAVEN TOWN CENTER
Slate Asset Management L.P. | 18
Investment Thesis:
• Retail center serving as the commercial focal point for a 1,550 acre master planned community located in an affluent neighborhood south of Nashville, TN
• Distressed seller monetizing retail parcel to fund remaining housing development
• 50% completed but once finalized, community includes 3,000 captive homes for retail tenants
• Existing landlord focused on housing development presenting an opportunity for a focused real estate manger to complete lease up
• Increase in grocery-anchor sales would result in percentage rent payments
Outcome:
• Kroger completed a major store remodel in 2016 at their cost as a result of strong sales growth
• Growth in home construction spurred tenant demand resulting in lease up to 100% occupancy
• Growth in tenant sales resulted in percentage rent payments
• Sold non-core office outparcel in Q1 2018 for $8.8M reducing basis in center to less than $6.0M
Purchase price: $14.5M
Occupancy: 96.1%
Yield: 8.2%
Lease term: 4.1 years
• Increased net operating income 32.5%
• Increased occupancy to 100.0%
• More than doubled overall lease term
• Accretively sold non-core office outparcel
IFRS value: $12.5M
Realized proceeds: $8.8M
IFRS cap rate: 6.25%
Occupancy: 100.0%
Yield: 13.7%
Lease term: 9.0 years
Date of acquisition: December 2012 Operating performance Today
Westhaven Residential Neighbourhood
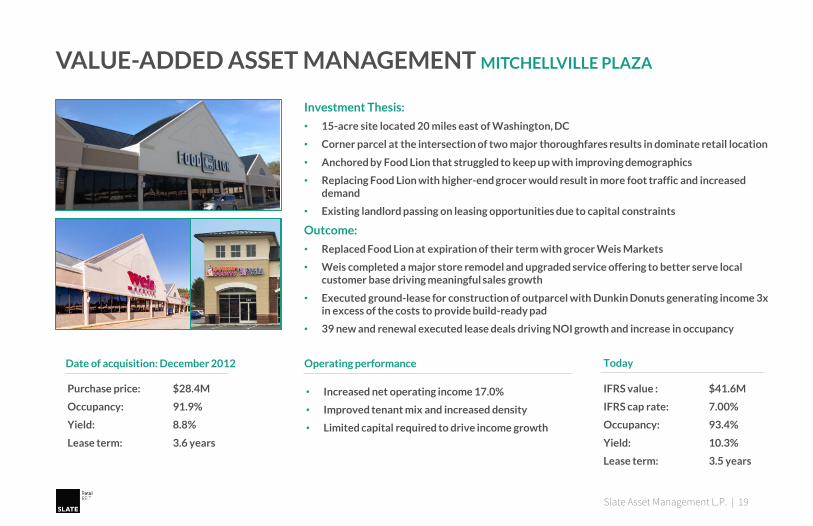
VALUE-ADDED ASSET MANAGEMENT MITCHELLVILLE PLAZA
Slate Asset Management L.P. | 19
Investment Thesis:
• 15-acre site located 20 miles east of Washington, DC
• Corner parcel at the intersection of two major thoroughfares results in dominate retail location
• Anchored by Food Lion that struggled to keep up with improving demographics
• Replacing Food Lion with higher-end grocer would result in more foot traffic and increased demand
• Existing landlord passing on leasing opportunities due to capital constraints
Outcome:
• Replaced Food Lion at expiration of their term with grocer Weis Markets
• Weis completed a major store remodel and upgraded service offering to better serve local customer base driving meaningful sales growth
• Executed ground-lease for construction of outparcel with Dunkin Donuts generating income 3x in excess of the costs to provide build-ready pad
• 39 new and renewal executed lease deals driving NOI growth and increase in occupancy
Purchase price: $28.4M
Occupancy: 91.9%
Yield: 8.8%
Lease term: 3.6 years
• Increased net operating income 17.0%
• Improved tenant mix and increased density
• Limited capital required to drive income growth
IFRS value : $41.6M
IFRS cap rate: 7.00%
Occupancy: 93.4%
Yield: 10.3%
Lease term: 3.5 years
Date of acquisition: December 2012 Operating performance Today

VALUE-ADDED ASSET MANAGEMENT MERCHANTS CROSSING
Slate Asset Management L.P. | 20
Investment Thesis:
• 16-acre site located 30 miles south of Atlanta located in a well-established retail node
• Located in one of Georgia’s fastest growing cities with the population doubling since 2000
• Anchored by Kroger who has been operating on site since 1987
• Minimal on-going capital required following Kroger’s major interior and exterior remodel in 2012 which included the addition of a full-service fuel center on site
• Purchase center with 30,000 square foot vacant box (former Kmart) below replacement cost at $59 per square foot
Outcome:
• Continued growth in Kroger’s sales driving increased foot traffic and ancillary tenant demand
• Back-filled vacant 30,000 square foot Kmart box with an 8-year lease term
• Increased occupancy to 95.2% driven robust new and renewal leasing activity
• Four remaining vacant units provide opportunity for future income growth
Purchase price: $10.3M
Occupancy: 78.2%
Yield: 7.5%
Lease term: 6.7 years
• Increased net operating income 34.7%
• Increased occupancy to 95.2% from 78.2%
• Limited capital required to drive income growth
IFRS value: $14.3M
IFRS cap rate: 7.25%
Occupancy: 95.2%
Yield: 10.1%
Lease term: 4.6 years
Date of acquisition: June 2014 Operating performance Today

VALUE-ADDED ASSET MANAGEMENT NORTH AUGUSTA PLAZA
Slate Asset Management L.P. | 21
Investment Thesis:
• 20-acre site along main retail corridor located less than 7-miles from Augusta National Golf Club
• 90,000 square foot Kmart with weak sales and under market rent is not highest and best use
• Replacing Kmart would reinvigorate center driving rent increases in shop space as well
• Anchored by a recently remodeled Publix with strong sales and long operating history
• Purchase at a discount to replacement cost at $82 per square foot
Outcome:
• Replaced Kmart with junior anchor tenants led by investment-grade Ross Stores, Inc.
• New glass facades, parking lot re-pave, roof replacement, new sidewalks, lighting upgrade
• Capital upgrades and new tenancies spurred interest from Chipotle Mexican Grill who built a drive-thru restaurant on site
• Renewing existing shop space tenants at more than 10.0% increase to expiring rents following redevelopment
Purchase price: $19.0M
Occupancy: 94.1%
Yield: 8.8%
Lease term: 4.2 years
• Increased net operating income 42.2%
• 114% increase rent replacing Kmart
• 10-year lease term achieved on junior anchor leases
• $10.9M of capital upgrades driving rent growth and cap rate compression
• Net operating income received through development period (2014-2017) ~$6.0M
Before
After
Date of acquisition: December 2013 Operating performance Today
IFRS value: $36.9M
IFRS cap rate: 6.25%
Occupancy: 91.0%
Yield: 7.7%
Lease term: 5.4 years

REIT/REOC TRADING COMPS
Source: CIBC, SNL Financial, FactSet, company reports
Slate Asset Management L.P. | 22
Price Market 2018E FFO 2018E AFFO Debt / Debt / Implied TEV /
29-Dec-17 Cap TEV Yield Multiple Payout Ratio
Multiple Payout Ratio
TEV GBV Cap Rate Owned SF
Canadian Retail Comparables - C$ ($ millions)
RioCan REIT $24.36 $7,977 $13,665 5.9% 13.6 x 80.3% 15.4 x 91.0% 42.9% 40.8% 5.9% $312
Choice Properties $13.35 $5,498 $9,797 5.5% 12.3 x 68.2% 14.9 x 82.6% 43.9% 44.6% 6.1% $216
First Capital Realty $20.72 $5,055 $9,406 4.2% 17.1 x 70.9% 18.6 x 77.3% 45.9% 43.5% 5.4% $359
SmartCentres REIT $30.91 $4,923 $9,155 5.7% 13.4 x 75.9% 14.4 x 81.3% 49.0% 46.8% 5.9% $240
CT REIT $14.50 $3,099 $5,687 5.0% 12.5 x 62.6% 15.1 x 75.8% 45.5% 47.4% 6.0% $210
Crombie REIT $13.80 $2,074 $4,601 6.4% 11.2 x 72.2% 13.5 x 87.4% 58.2% 51.6% 6.4% $237
Plaza Retail REIT $4.26 $437 $988 6.3% 11.7 x 74.2% 12.9 x 81.8% 56.2% 53.1% 7.3% $183
Average 5.6% 13.1 x 72.0% 15.0 x 82.5% 48.8% 46.8% 6.1% $247
U.S. Retail Comparables - US$
Regency Centers $69.18 $11,768 $15,308 3.1% 18.3 x 56.1% 21.7 x 66.6% 26.3% 68.7% 5.5% $344
Kimco $18.15 $7,726 $14,115 6.2% 11.9 x 73.5% 14.9 x 92.0% 44.0% 45.4% 7.3% $205
Brixmor Property Group $18.66 $5,690 $11,374 5.9% 9.3 x 54.8% 11.8 x 69.8% 55.7% 50.9% 7.8% $135
Weingarten Realty Investors $32.87 $4,223 $6,575 4.7% 13.7 x 64.2% 16.8 x 78.8% 37.4% 45.8% 6.5% $242
DDR $8.96 $3,301 $7,835 8.5% 8.8 x 74.8% 10.9 x 92.6% 55.1% 35.2% 8.3% $167
Acadia Realty Trust $27.36 $2,290 $4,522 3.9% 19.6 x 77.2% 22.9 x 90.4% 40.4% 56.2% 5.0% $501
Cedar Realty Trust $6.08 $556 $1,344 3.3% 10.7 x 35.2% 14.1 x 46.3% 51.5% 40.5% 7.7% $149
Average 5.1% 13.2 x 62.3% 16.2 x 76.6% 44.3% 48.9% 6.9% $249
Slate Retail REIT C$ $13.02 $603 $1,707 8.1% 7.8 x 62.8% 9.9 x 79.7% 64.7% 58.4% 7.4% $157
Slate Retail REIT US$ $10.35 $480 $1,360 8.1% 7.7 x 62.8% 9.8 x 79.7% 64.7% 58.4% 7.4% $125

U.S. STRIP CENTRE REIT COMPS
REIT/REOCAverage Base Rent(per square foot)
OccupancyMedian Household
IncomePopulation
American Assets Trust $27.33 97% $89,214 97,105
Acadia Realty Trust $26.68 96% $87,524 379,184
Brixmor $13.50 93% $65,476 86,272
DDR $15.25 92% $77,136 133,093
Federal Realty Trust $26.44 94% $102,307 125,838
Kimco $15.11 95% $79,253 130,941
Regency Centres $20.43 95% $86,417 141,998
Retail Opportunity Investments Corp. $19.74 97% $82,751 110,352
Retail Properties of America $17.33 95% $72,248 218,263
Urban Edge Properties $17.14 96% $82,262 171,835
Weingarten Realty Investors $18.03 94% $73,938 113,480
U.S. Strip Centre REIT W/A $17.04 95% $79,861 138,075
Slate Retail REIT $10.67 94% $70,114 52,202
Source: Green Street Advisors
Slate Asset Management L.P. | 23
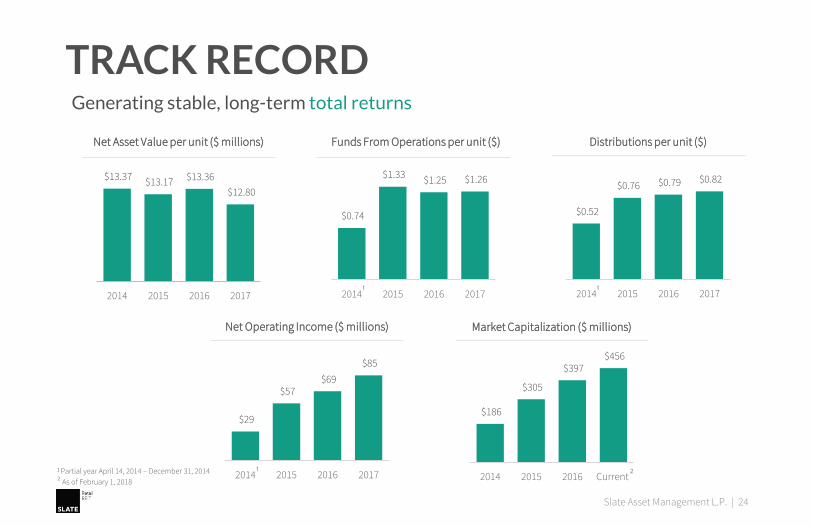
$0.52
$0.76 $0.79 $0.82
2014 2015 2016 2017
$0.74
$1.33 $1.25 $1.26
2014 2015 2016 2017
TRACK RECORD
Slate Asset Management L.P. | 24
Generating stable, long-term total returns
Distributions per unit ($)Funds From Operations per unit ($)
1 Partial year April 14, 2014 – December 31, 2014
² As of February 1, 2018
Net Asset Value per unit ($ millions)
Market Capitalization ($ millions)Net Operating Income ($ millions)
²
¹
¹
¹
$13.37 $13.17 $13.36
$12.80
2014 2015 2016 2017
$29
$57 $69
$85
2014 2015 2016 2017
$186
$305
$397 $456
2014 2015 2016 Current
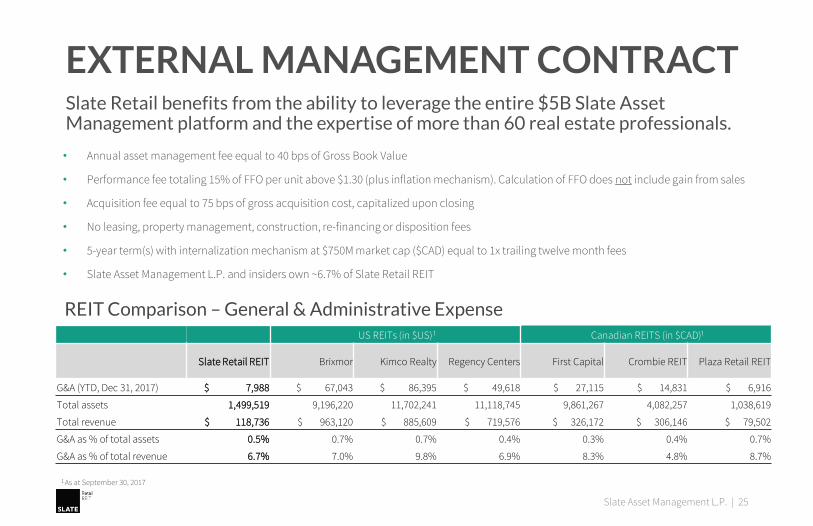
• Annual asset management fee equal to 40 bps of Gross Book Value
• Performance fee totaling 15% of FFO per unit above $1.30 (plus inflation mechanism). Calculation of FFO does not include gain from sales
• Acquisition fee equal to 75 bps of gross acquisition cost, capitalized upon closing
• No leasing, property management, construction, re-financing or disposition fees
• 5-year term(s) with internalization mechanism at $750M market cap ($CAD) equal to 1x trailing twelve month fees
• Slate Asset Management L.P. and insiders own ~6.7% of Slate Retail REIT
EXTERNAL MANAGEMENT CONTRACTSlate Retail benefits from the ability to leverage the entire $5B Slate Asset Management platform and the expertise of more than 60 real estate professionals.
Slate Asset Management L.P. | 25
US REITs (in $US) Canadian REITS (in $CAD)
Slate Retail REIT Brixmor Kimco Realty Regency Centers First Capital Crombie REIT Plaza Retail REIT
G&A (YTD, Dec 31, 2017) $ 7,988 $ 67,043 $ 86,395 $ 49,618 $ 27,115 $ 14,831 $ 6,916
Total assets 1,499,519 9,196,220 11,702,241 11,118,745 9,861,267 4,082,257 1,038,619
Total revenue $ 118,736 $ 963,120 $ 885,609 $ 719,576 $ 326,172 $ 306,146 $ 79,502
G&A as % of total assets 0.5% 0.7% 0.7% 0.4% 0.3% 0.4% 0.7%
G&A as % of total revenue 6.7% 7.0% 9.8% 6.9% 8.3% 4.8% 8.7%
REIT Comparison – General & Administrative Expense
¹ ¹
1 As at September 30, 2017
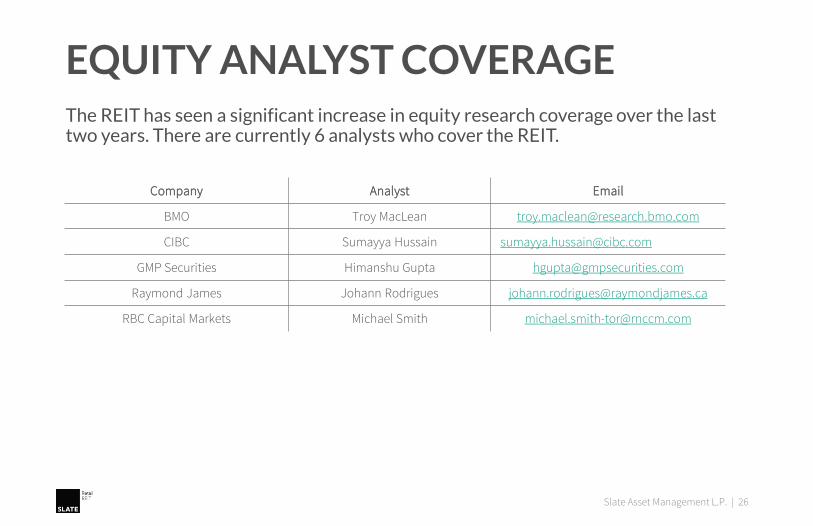
EQUITY ANALYST COVERAGEThe REIT has seen a significant increase in equity research coverage over the last two years. There are currently 6 analysts who cover the REIT.
Company Analyst Email
BMO Troy MacLean [email protected]
CIBC Sumayya Hussain [email protected]
GMP Securities Himanshu Gupta [email protected]
Raymond James Johann Rodrigues [email protected]
RBC Capital Markets Michael Smith [email protected]
Slate Asset Management L.P. | 26
CAUTIONARY STATEMENTSForward-Looking StatementsThis presentation contains forward-looking information within the meaning of applicable securities laws. These statements include, but are not limited to,statements concerning the REIT’s objectives, its strategies to achieve those objectives, as well as statements with respect to management’s beliefs, plans,estimates, and intentions, and similar statements concerning anticipated future events, results, circumstances, performance or expectations that are nothistorical facts. Readers should not place undue reliance on any such forward-looking statements. Forward-looking information involves known and unknownrisks, uncertainties and other factors which may cause the actual results, performance or achievements of the REIT to be materially different from any futureresults, performance or achievements expressed or implied by the forward-looking information. Actual results and developments are likely to differ, and maydiffer materially, from those expressed or implied by the forward-looking statements contained herein. Such forward-looking statements are based on a numberof assumptions that may prove to be incorrect, including, but not limited to, the continued availability of mortgage financing and current interest rates; theextent of competition for properties; assumptions about the markets in which the REIT and its subsidiaries operate; the global and North American economicenvironment; and changes in governmental regulations or tax laws. Although the forward-looking information contained in this presentation is based upon whatmanagement believes are reasonable assumptions, there can be no assurance that actual results will be consistent with these forward-looking statements.Certain statements included in this presentation may be considered “financial outlook” for purposes of applicable securities laws, and such financial outlookmay not be appropriate for purposes other than this presentation. Except as required by applicable law, the REIT undertakes no obligation to publicly update orrevise any forward-looking statement, whether as a result of new information, future events or otherwise.
Non-IFRS MeasuresThis presentation contains financial measures that do not have a standardized meaning under International Financial Reporting Standards (“IFRS”) asprescribed by the International Accounting Standards Board. Slate Retail uses the following non-IFRS financial measures: Funds from Operations (“FFO”),Adjusted Funds from Operations (“AFFO”), Net Operating Income (“NOI”), and Earnings Before Interest, Taxes, Depreciation and Amortization (“EBITDA”).Management believes that in addition to conventional measures prepared in accordance with IFRS, investors in the real estate industry use these non-IFRSfinancial measures to evaluate the REIT’s performance and financial condition. Accordingly, these non-IFRS financial measures are intended to provideadditional information and should not be considered in isolation or as a substitute for performance measures prepared in accordance with IFRS. In addition,they do not have standardized meanings and may not be comparable to measures used by other issuers in the real estate industry or other industries.
Use of EstimatesThe preparation of the REIT financial statements in conformity with IFRS requires management to make estimates, judgments and assumptions that affect thereported amounts of assets and liabilities, disclosure of contingent assets and liabilities at the date of the financial statements and the reported amount ofrevenues and expenses during the reporting period. Management’s estimates are based on historical experience and other assumptions that are believed to bereasonable under the circumstances. Actual results could differ from those estimates under different assumptions.
Slate Asset Management L.P. | 27
Slate Asset Management L.P.121 King St W, Suite 200Toronto, ON M5H 3T9
slateam.com
Investor RelationsSlate Retail REIT
+1 416 644 4264
Slate Asset Management L.P. | 28


