56
Olefins Refinery Aromatics Polymers HVS High Volume Specialties EO Based Performance Green Chemicals Services and Others Investors Presentation NDR in Malaysia with CIMB January 20, 2014
Olefins Refinery
Aromatics Polymers
HVS High
Volume Specialties
EO Based Performance
Green Chemicals
Services and Others
Investors Presentation
NDR in Malaysia with CIMB January 20, 2014

Disclaimer
This presentation includes forward-looking statements that are subject to risks and uncertainties, including
those pertaining to the anticipated benefits to be realized from the proposals described herein. This
presentation contains a number of forward-looking statements including, in particular, statements about future
events, future financial performance, plans, strategies, expectations, prospects, competitive environment,
regulation and supply and demand.
PTTGC has based these forward-looking statements on its views with respect to future events and financial
performance. Actual financial performance of the entities described herein could differ materially from that
projected in the forward-looking statements due to the inherent uncertainty of estimates, forecasts and
projections, and financial performance may be better or worse than anticipated. Given these uncertainties,
readers should not put undue reliance on any forward-looking statements.
Forward-looking statements represent estimates and assumptions only as of the date that they were made.
The information contained in this presentation is subject to change without notice and PTTGC does not
undertake any duty to update the forward-looking statements, and the estimates and assumptions associated
with them, except to the extent required by applicable laws and regulations.
2

Agenda
PTTGC Business Overview
Strategy and Execution
Recent Happenings
9M/13 Operating Results
Market Outlook
3
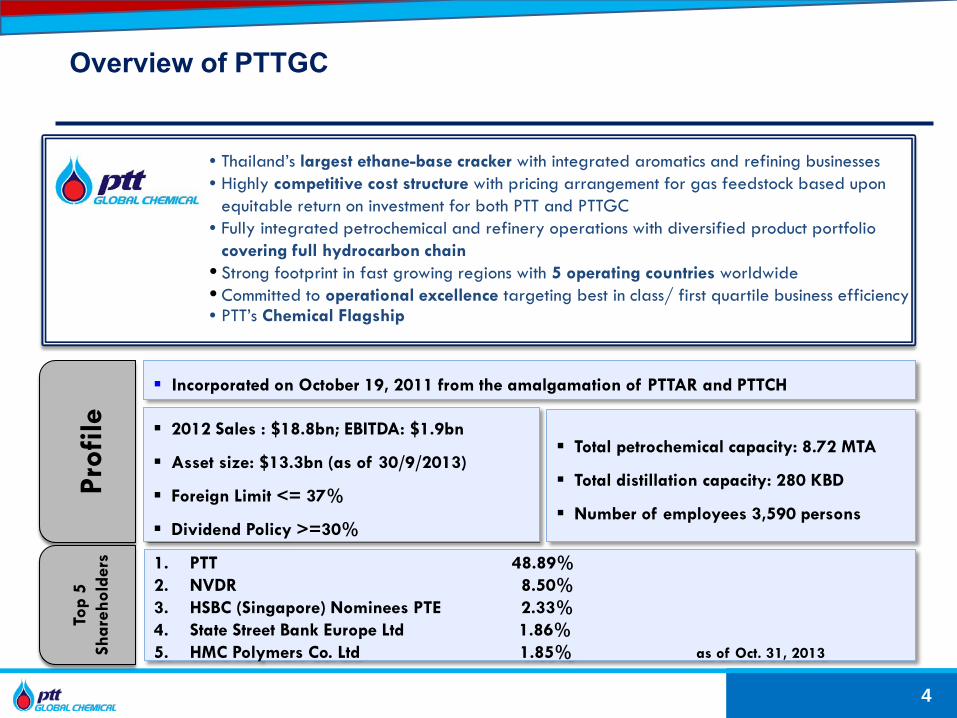
• Thailand’s largest ethane-base cracker with integrated aromatics and refining businesses • Highly competitive cost structure with pricing arrangement for gas feedstock based upon
equitable return on investment for both PTT and PTTGC • Fully integrated petrochemical and refinery operations with diversified product portfolio
covering full hydrocarbon chain • Strong footprint in fast growing regions with 5 operating countries worldwide • Committed to operational excellence targeting best in class/ first quartile business efficiency • PTT’s Chemical Flagship
Prof
ile Incorporated on October 19, 2011 from the amalgamation of PTTAR and PTTCH
Total petrochemical capacity: 8.72 MTA
Total distillation capacity: 280 KBD
Number of employees 3,590 persons
2012 Sales : $18.8bn; EBITDA: $1.9bn
Asset size: $13.3bn (as of 30/9/2013)
Foreign Limit <= 37%
Dividend Policy >=30%
Top
5 Sh
areh
olde
rs
1. PTT 48.89% 2. NVDR 8.50% 3. HSBC (Singapore) Nominees PTE 2.33% 4. State Street Bank Europe Ltd 1.86% 5. HMC Polymers Co. Ltd 1.85% as of Oct. 31, 2013
Overview of PTTGC
4

Flexible Feedstock and Highly Competitive Cost Structure
5
Flexible Feedstock and By-Product Enhancement
PTTGC's refinery (145 KBD) is one of the most complex refineries in Thailand, with Nelson Index of 10.17 and refining capacity accounting for 13% of country’s total capacity
Value enhancement from by-product exchange among Olefins, Aromatics and Refinery units highlights operational integration and efficiency:
- CR from Aromatics units sent to Refinery to produce middle distillate
- Pygas from Olefins unit sent to Aromatics for BTX - Offgas from Refinery sent to Cracker for olefins
products
Feedstock Supply Product Marketing
Refinery
Aromatics
Olefins / Polymers
Others
Condensate
Crude Oil
Others
Ethane, Propane, LPG
C5-C9
C10-C25
C2-C4
Olefins
100% Polymers (1)
46% (2)
54% (2)
Feedstock Supply Commercial Agreements Product Marketing Commercial Agreements
Customers
Others
70% (2)
30% (2)
103
318
799 824 830 883
951 967 1,006
-
200
400
600
800
1,000
1,200
MDEEthane
NAMEthane
NEA LPG NAMNaphtha
MDE LPG MDENaphtha
NEANaphtha
SEANaphtha
WEPNaphtha
Global Ethylene Cash Cost by Region
USD/Ton
2012E (3)
1. PTT owns 50%, PTTGC and IRPC each owns 25% in PTTPM. 2. FY12
(5)
Source: IHS (formerly CMAI) as of July 2012. Note: MDE = Middle East, NAM = North America, NEA = Northeast Asia, SEA = Southeast Asia, WEP = Western Europe.
3. PTTGC ethylene cash cost is based on Company estimate and ethane cracker only. 2012 PTTGC cash cost takes into account the effect of the renewal of gas price agreement. 4. MDE cash costs are average values of Iran and Saudi Arabia.
(5) (4)

Natural Gas
Crude Palm Oil
Crude
Condensate
Cracker
Aromatics Plants
Refinery
Ethylene
HDPE
LLDPE
LDPE
MEG
Propylene
Oleochemicals
Paraxylene
Benzene
PTAPET Fiber/Resin
EO
Ethanolamine
Ethoxylate
Cyclohexane
CumenePhenol
Acetone
EB/SM
PS
BPA
Methyl Ester(B-100)
PC
Caprolactam Nylon 6
Fatty Alcohol
MMA PMMA
Epoxy Resins
ABS
SBR
PP
PTT Phenol
Petroleum Products- LPG- Reformate- Light Naptha- Jet Fuel- Diesel- Fuel Oil
Reformate, Heavy
Naphtha
Pygas
Condensate Residue,
Hydrogen
Light Naphtha
C3,C4
OffGas Mixed C4 Butadiene
PO
PUTDI/HDI
Toluene
Polyols
Orthoxylene
Cracker Bottom,
Hydrogen
PA Plasticizer
1. PTTGC does not currently produce these products.
REFINERY & SHARED FACILITIES AROMATICS OLEFINS POLYMERS EO-BASED
PERFORMANCE GREEN CHEMICALS HIGH VOLUME SPECIALTIES
Feedstock Upstream Intermediates Downstream Proximity to Suppliers and Customers
Exchange Stream Products By-Products
Potential Product Opportunities (1)
Petroleum Products - LPG - Reformate - Light Naphtha - Jet Fuel - Diesel - Fuel Oil
Fully Integrated Petrochemical and Refinery Operations with Diversified Product Portfolio
6

Agenda
PTTGC Business Overview
Strategy and Execution
Recent Happenings
9M/13 Operating Results
Market Outlook
7

PTTGC’s Strategies Overview
8
Increasing distance from core
Business As Usual
• Operational
Excellence
• Marketing
Excellence
• Synergy Project
Excellence
• Debottlenecking /
Expansion
New Geography
New Products
• PU Chain
• PC Chain
• BV Derivatives
• Nylon 6,6
• PMMA
• Bio-Plastic
• VAO
Growth initiatives
Core uplift initiatives
REF ARO OLE
POL EOB GRN XVS
26 Plants Globally
ROIC 12% ROIC Uplift 2% 14% ROIC >14%
One Step Adjacency Green Business
“To be a Leading Chemical Company for Better Living”

9
Continues to Strive for Strong Profitable Growth
~800-900
~620-650
Green
563
Actual2012
Target2017
Target2022
Expected EBITDA BenefitUplift 15-30%
Phase 1 : Foundation for Growth Phase 2: The Growth Mode
Green
HVS
New Global Hub
Debottleneck
Synergy Project Excellence
Operational Excellence Marketing Excellence Capital Expenditure Excellence
We aim to grow ~5 percent p.a. in the next ten years
Sales in THB Bn Based on constant Dubai crude year 2012 at USD 109 per bbl

Execution Led by a Well Defined Strategy
10
Operational Excellence
Marketing Excellence
Synergy Project Excellence
Debottleneck CAPEX
Excellence
Reliability improvement
Energy efficiency improvement
Cost reduction
Product development
Customer/Portfolio mgmt
Strategic pricing
Product upgrade
Cost saving from share tank and facility
Steam Cost reduction
BV Project
Quench Tower
PX expansion
PTTPE Cracker and Polymer Plants Debottleneck
Capital Project Management
Engineering
Procurement
Construction
Project Mgmt.
1 2 3 4 5
EBITDA Uplift (USD mn)
Target EBITDA Uplift of Excellence Programs and Synergy Projects 2013-2017
28 83 87 91 91 113
79 81 83 85 36 83
149 149 149 43
75 108 108
177
289
392 431 433
2013 2014 2015 2016 2017
Operational Excellence Marketing Excellence Synergy Debottleneck (exclude PE expansion)
* Debottleneck EBITDA Uplift includes 1Q/14 BV project starts up 3Q/15 TOCGC Plant Improvement Project 4Q/15 PX expansion starts up
*

Excellence Programs 1H/13 9M/13 Target FY13
1. Operational excellence 1.1 7.9 28
- Reliability improvement - Energy efficiency improvement - Cost reduction
2. Marketing excellence 84.6 111.3 113
- HVP Sales Performance exceeded target - 7 New HVP Grades and 3 New Commodities Grades - Exported Mixed C4 - Export PE to alternative markets ie. South Africa3. Synergy projects 10.0 17.1 36
- EBITDA uplift in 3Q/13 was mainly contributed from C3/C4 Stream and 3 Streams (Heavy Gasoline, LCB, and CB) - Heavy gas (Offgas) - Construction Progress at 27.5% (End Sep) - Pure H2 via New PSA - Construction Progress at 83.2% (End Sep)4. Opportunity Synergy Benefits 0.0 13.1 0
- Biodiesel Export to China (B-100 from TOL blend with Diesel from Refinery) - Due to I-4/1 TA, transfer excess offspec Raw Pygas (normally flare) to upgrade at ARO2 - Due to I-4/1 TA, transfer excess offspec C3C4 from PTTPE Cracker to Refinery C3C4 pool for blending Total 95.7 149.4 177.0
Update Excellence Programs
11
Core Uplift 1-Step Adjacencies Emerging Business Models
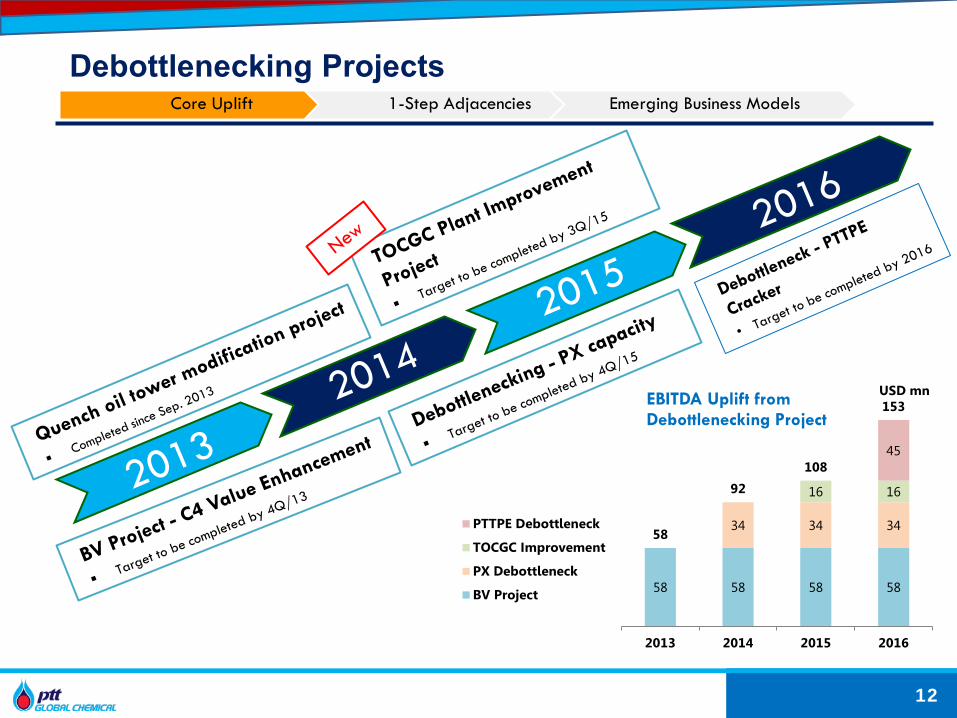
58 58 58 58
34 34 34
16 16
45
153
108
92
58
2016 2015 2014 2013
USD mn
PTTPE Debottleneck
TOCGC Improvement
PX Debottleneck
BV Project
Debottlenecking Projects
12
Core Uplift 1-Step Adjacencies Emerging Business Models
EBITDA Uplift from Debottlenecking Project

Quench oil tower modification project
13
Quench Oil Tower Modification project at I4-1 olefins plant
• To reduce naphtha to gas portion in I4-1 mixed feed cracker
Naphtha : Gas
From 0.95 : 1.0
To 0.60 : 1.0
• Project completed during I4-1 plant turnaround in Aug-Sept 2013
• Passed Operational Test
Core Uplift 1-Step Adjacencies Emerging Business Models
Status Completed
CAPEX 3 MUSD
Vapor Flute

C4 Value Enhancement (BV Project) BV Project
14
BV Project will enhance PTTGC’s C4 value chain by upgrading to Butadiene and Butene-1, which will pave a way towards Butadiene derivatives
Construction completed, now in test run period
C4 From
PTTGC’s Cracker
Butadiene Plant Synthetic Rubber
Customer 90% Domestic: 10% Export
Nameplate Capacity 75 KTA of Butadiene 25 KTA of Butene-1
Technology License ABB LUMMUS
Project Management Consulting PTTME
EPC Contractor Chiyoda (Thailand)
CAPEX 262 MUSD
EBITDA Uplift 58 MUSD/Year
Target Completed 4Q/13
Direction forward • Expand into Synthetic rubber business by using
butadiene from PTTGC and from JV Investment Plant
PTTGC LLDPE Plant
Butene -1
Butadiene
Core Uplift 1-Step Adjacencies Emerging Business Models

TOCGC Plant Improvement Project
15
Core Uplift 1-Step Adjacencies Emerging Business Models
EOE Capacity 336 KTA + Additional Capacity
90 KTA
Plant improvement to expand EOE capacity
• Improve catalyst usage to enhance production yield and also reduce CO2 emission.
• Increases EOE capacity by 90 KTA from 336 KTA to 426 KTA
• Additional EOE capacity will improve capacity of EO/EG depending on production mode.
• Progress: Construction
Purified EO
Ethylene Glycol (EG)
Additional Capacity 90 KTA of EOE
EPC Contractor Samsung Engineering
CAPEX 94.2 MUSD
EBITDA Uplift 16 MUSD/Year
Target Completion 3Q/15

PX Expansion Project
16
Core Uplift 1-Step Adjacencies Emerging Business Models
Increase PX and BZ capacity at ARO#2
• Board approved and EPC Awarded • Progress : construction
PAREX
Additional Capacity 115 KTA of PX 35 KTA of BZ
EPC Contractor PTTME and SK Engineering
CAPEX 128.8 MUSD
EBITDA Uplift 34 MUSD/year
Target Completion 4Q/15 during ARO2 TA period
Aromatics (KTA) Existing Debot. 2015 Total after Debot.
Paraxylene 655 +115 770
Benzene 355 +35 390
Orthoxylene 0 +20 20

PTTPE Cracker Debottlenecking
17
Core Uplift 1-Step Adjacencies Emerging Business Models
PTTPE debottlenecking with additional capacity of 12%
Downstream debottleneck expansion to capture fully-integrated margin by converting additional ethylene into downstream products
Adding 1 furnace to PTTPE cracker The additional volume of gas feedstock from
PTT will be ethane : LPG or 60 : 40 Progress: basic engineering package
Additional Capacity of PTTPE Cracker
12% Increase
CAPEX 285 MUSD
Expected IRR 17%
Target Completion 2016
Additional Olefins
Capacity
Possible value added downstream • m-LLDPE • LLDPE Expansion

Phenol 2 Project “Road to PC/Nylon”
18
Phenol 2 Project will capture longer value chain of benzene and propylene. Pave a way towards downstream phenol derivatives. Financing: Project Financing Scheme, D/E 2:1 Progress: Construction
Nameplate Capacity 250 KTA of Phenol 155 KTA of Acetone
Technology License UOP
Project Management Consulting
Bechtel
EPC Contractor POSCO CAPEX 348 MUSD Expected IRR 17%
Target Completed 3Q/15
Our 1-Step Adjacencies Direction • Partner with global player • Seek joint sales/mkt in ASEAN • PC Compounding
Phenol Chain
Core Uplift 1-Step Adjacencies Emerging Business Models

JV with PERTAMINA
19
Competitive advantage over size and vicinity
World-scale integrated petrochemical complex covering upstream to downstream Pave a way towards HVS product offering Estimated investment of USD 4-5 bn Expected COD 2018
Updated Progress • On December 10, 2013 PTTGC and Pertamina:
• Signed Manufacturing Joint Venture – HOA which includes a world scale cracker and downstream products complex, with no investment in the refinery complex.
• Entered into a marketing and trading JV to initially conduct polymer products marketing and distribution throughout Indonesia.
Core Uplift 1-Step Adjacencies Emerging Business Models

Pieces of Jigsaw to our downstream aspiration
20
Vencorex to HDI to system house Expand HDI derivatives business in Thailand and HDI monomer in
France Restructure Business in France to enhance its competitiveness. Build PU system house with Partner in Thailand for niche market Seek for JV polyols and MDI
Sinochem to secure access to China downstream market Signed MoU to jointly explore potential collaboration e.g., PU and
PC chains and Bio-based chemicals Strengthen sales & market in China
Petronas to expand into PC and PO chain Expand downstream product portfolio (PC and PO chain) and
support HVS strategic initiative Signed HoA with Petronas and Itochu, target completion by 2017 for
feasibility study Estimated Investment of USD 2 bn, PTTGC expects to contribute
25% of the equity component
Core Uplift 1-Step Adjacencies Emerging Business Models
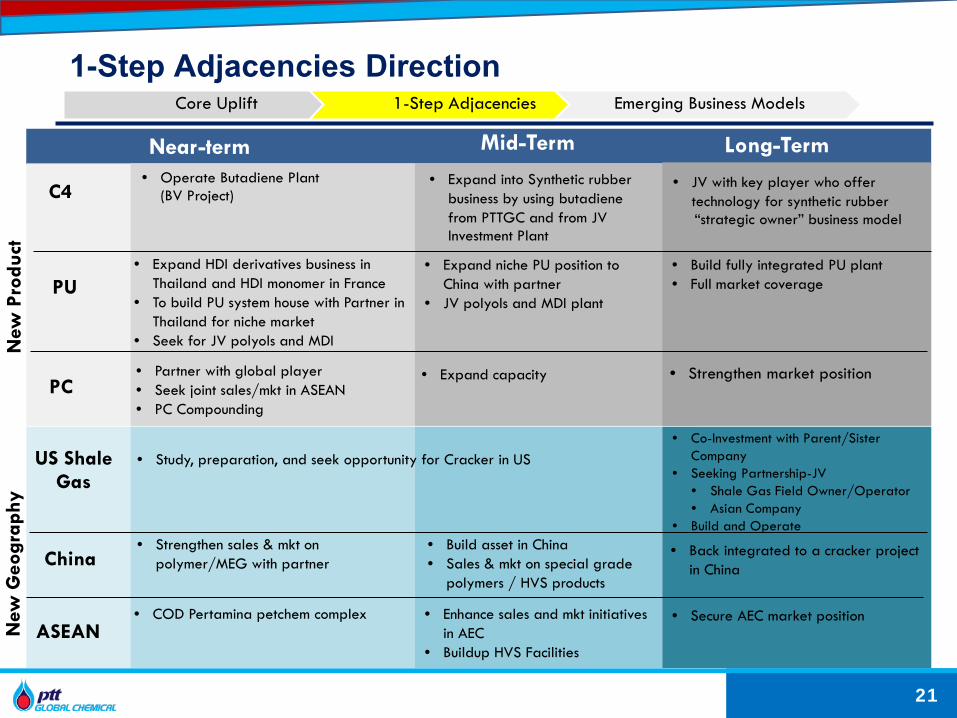
New
Pro
duct
N
ew G
eogr
aphy
C4
PU
PC
• Expand into Synthetic rubber business by using butadiene from PTTGC and from JV Investment Plant
Near-term
• JV with key player who offer technology for synthetic rubber
“strategic owner” business model
Mid-Term Long-Term
• Expand HDI derivatives business in Thailand and HDI monomer in France
• To build PU system house with Partner in Thailand for niche market
• Seek for JV polyols and MDI
• Expand niche PU position to China with partner
• JV polyols and MDI plant
• Build fully integrated PU plant • Full market coverage
• Partner with global player • Seek joint sales/mkt in ASEAN • PC Compounding
• Expand capacity • Strengthen market position
ASEAN
China
US Shale Gas
• Study, preparation, and seek opportunity for Cracker in US • Co-Investment with Parent/Sister
Company • Seeking Partnership-JV
• Shale Gas Field Owner/Operator • Asian Company
• Build and Operate
• COD Pertamina petchem complex • Enhance sales and mkt initiatives in AEC
• Buildup HVS Facilities
• Secure AEC market position
• Strengthen sales & mkt on polymer/MEG with partner
• Build asset in China • Sales & mkt on special grade
polymers / HVS products
• Back integrated to a cracker project in China
1-Step Adjacencies Direction
21
Core Uplift 1-Step Adjacencies Emerging Business Models
• Operate Butadiene Plant (BV Project)

Biochemical to Support Future Growth
22
Core Uplift 1-Step Adjacencies Emerging Business Models
Applications PTTGC holds 50% in NatureWorks. A manufacture of polylactic acid (PLA) and lactides, plant-based biopolymers used to manufacture plastics and fibers with world scale PLA capacity of 150,000 ton/year. Planned to build second plant
potentially in Asia Studied the possibilities to use
alternative feedstock
PTTGC holds 84.77% in Myriant Corporation. An R&D based company with proven technology platform. In April 2013, Myriant Corporation had completed the
construction of a 14,000 ton/year Succinic Acid Plant in Louisiana State and is currently commissioning.

USD 4.5 Bn
USD 2 Bn from Debt Financing
USD 2.5 Bn from Cash Flows from Operation
CAPEX to Support Growth Approved and Uncommitted CAPEX Plan for year 2013 - 2017
23
31%
64%*
5% Core Uplift
1 Step Adjacencies
Green
USD 4.5 Bn Uncommitted CAPEX
USD 1 Bn secured from USD Bond Issued in Sep. 2012

Agenda
PTTGC Business Overview
Strategy and Execution
Recent Happenings
3Q/13 Operating Results
Market Outlook
24

Award and Recognition
25

Mission to be Continued
Bowon Vongsinudom
President and CEO
26
PTTGC’s Top Management Team’s Commitment

New Organization Structure to Support Growth
27
PTTGC Board of Directors
VP – Internal Audit
EVP – Polymers Business
Unit
SVP - High
Volume Specialties Business
Unit
EVP – EO Based
Performance
Business Unit
EVP – Green
Chemicals Business
Unit
EVP – Marketing, Commercial and Supply
EVP – Finance and
Accounting
EVP – Corporate Strategy
EVP – Strategic
Execution and Excellence
EVP – Corporate
Affairs
EVP – Organizational Effectiveness
EVP – Project Executive Director
Head – Science and Innovation
EVP – GPC Olefins
EVP – GPC
Refinery and
Shared Facilities
EVP – GPC
Aromatics
EVP – Engineering
and Maintenance
SVP – Quality, Safety,
Occupational Health and
Environment
Audit Committee CG Committee Risk Management Committee
Nomination and Remuneration Committee
President and CEO
COD – Down Stream Petrochemical Business COU – Up Stream Petrochemical Business

Agenda
PTTGC Business Overview
Strategy and Execution
Recent Happenings
9M/13 Operating Results
Market Outlook
28

What happens in 2013?
29
US slowly recover
Unplanned S/D LDPE -
PTTGC’s Operating Performance
Petchem market stronger
Lower F/S supply (GSP 5) -
China econ slowdown
-
Oil price Fluctuation + Fluctuation THB -
Euro crisis -
+ +
Oil spill & rehabilitation -

Key Financial Highlights
30
45,
642
41,
106
44,
273
54,
423
57,
168
39,
886
40,
609
42,
569
47,
645
56,
993
11% 10%
11% 10%
10%
0%
2%
4%
6%
8%
10%
12%
-
20,000
40,000
60,000
80,000
100,000
120,000
9M/11 9M/12 9M/13 FY 11* FY 12
THB mn
EBITDAAdjusted EBITDAAdjusted EBITDA Margin (RHS)
25,981 24,239 25,856 30,033 34,001
5.77 5.38 5.73 6.66
7.50
-
2.00
4.00
6.00
8.00
-
10,000
20,000
30,000
40,000
9M/11 9M/12 9M/13 FY 11* FY 12
THB mn Net Profit EPS (Baht/Share) (RHS)
374,188 418,216 394,590
500,305 562,811
-
100,000
200,000
300,000
400,000
500,000
600,000
9M/11 9M/12 9M/13 FY 11* FY 12
THB mn Sales Revenue
Dividend - Solid Payout Ratio FY11 FY 12 6M/13
EPS (THB/Share) 6.66 7.50 3.60
Dividend (THB/Share) 2.98 3.4 1.62
Payout Ratio (%) 45% 45% 45%
* Proforma Statements
Dividend Policy: As least 30% of Net Profit

Refinery 8%
Aromatics 24%
Olefins and
Derivative 61%
Green 3% HVS
1% Others 2.96%
Refinery 43%
Aromatics 22%
Olefins and Derivative
23%
Green 5%
HVS 7%
Others 0.05%
31
Adjusted EBITDA Margin % by Core BU
Segmental Results Olefins and Olefins Derivatives Business contributed greatly to EBITDA
9M/13 Revenue Breakdown (%)*
9M/13 Adjusted EBITDA Breakdown (%)*
THB 42.4 Bn
THB 395 Bn
Refinery 16%
Aromatics 16%
Olefins and
Derivative
56%
Green 3%
HVS 3% Others
4.94%
Refinery 48%
Aromatics
20%
Olefins and
Derivative
21%
Green 5%
HVS 5%
Others 0.98%
FY12 Revenue Breakdown (%)
FY12 Adjusted EBITDA Breakdown (%)
THB 57 Bn
THB 563 Bn
*Refinery T/A in 1Q/13
Unit:% FY 12 9M/13Refinery 3 2Aromatics 8 11Olefins & Derivatives
27 28
Green 5 7HVS 7 2PTTGC 10 11

5.2
16.4
8.4 9.6 14.8 14.3
7.7 11.6
0.5
31.4
2013 2014 2015 2016 2017 2018 2019 2020 2021 2022
PTTGC PPCL Others
35 39
240 226
101 98
60 50
238 237
137 121
61 55
Strong Financial Position
32
Key Financial Ratios
As of Dec 31, 2012 As of Sep. 30, 2013
THB 413 Bn THB 436 Bn
Cash + ST Investment
CA
PPE
Non CA
Share holders’ Equity
IBD
Liab.
Statements of Financial Position Interest Rate Currencies
68 % Fixed 56 % THB
32 % Float 44 % USD & Others
Loan Type
• Cost of long term debts ~ 5.0%
(Include W/H Tax)
• Average loan life after refinancing -
5.0 Years
Treasury policy Net IBD to Equity ratio of ≤ 0.7x Net IBD to EBITDA ratio of ≤ 2.4x
Maturity of Financial Debt* as at 30 Sep., 2013
THB 121 Bn
THB Bn
ST Loan 3%
LT Loan 35% Deben
ture 62%
* After Refinance
1.34 1.06 0.98
1.18
0.32 0.25 0.26 0.30
0.0x0.2x0.4x0.6x0.8x1.0x1.2x1.4x1.6x
31 Dec.12
31 Mar.13
30 Jun.13
30 Sep.13
Net IBD / EBITDANet IBD/Equity
16.15% 16.39% 17.09% 16.11%
10.43% 11.13% 11.83% 10.50%
5%
10%
15%
20%
31 Dec. 1231 Mar. 1330 Jun. 13 30 Sep. 13
ROE ROA

Agenda
PTTGC Business Overview
Strategy and Execution
Recent Happenings
3Q/13 Operating Results
Market Outlook
33

Key Market Trends in 2014
34
Dubai Crude oil prices is expected to average 102 USD/BBL in 2014, softening from average 105 USD/BBL in 2013 due to addition Non-OPEC supply.
World Oil Demand should grow around 1.1 MMBD in 2014, while net additional of 2.25 MMBD refinery capacities will be added.
GRM should be pressure from these addition capacities.
Source: JBC, Nov. 2013
IEA Demand(mbd)
Growth (mbd)
2012 89.98 +1.02
2013 91.17 +1.19
2014 92.37 +1.20
EIADemand(mbd)
Growth (mbd)
2012 89.17 +0.87
2013 90.38 +1.21
2014 91.59 +1.21
Source: EIA, STEO Jan. 14
Source: IEA, OMR Dec. 13
OPECDemand(mbd)
Growth (mbd)
2012 88.90 +0.80
2013 89.80 +0.90
2014 90.80 +1.00
Source: OPEC, OMR Dec. 13
Key Market Trends in 2014 – Cont’
35
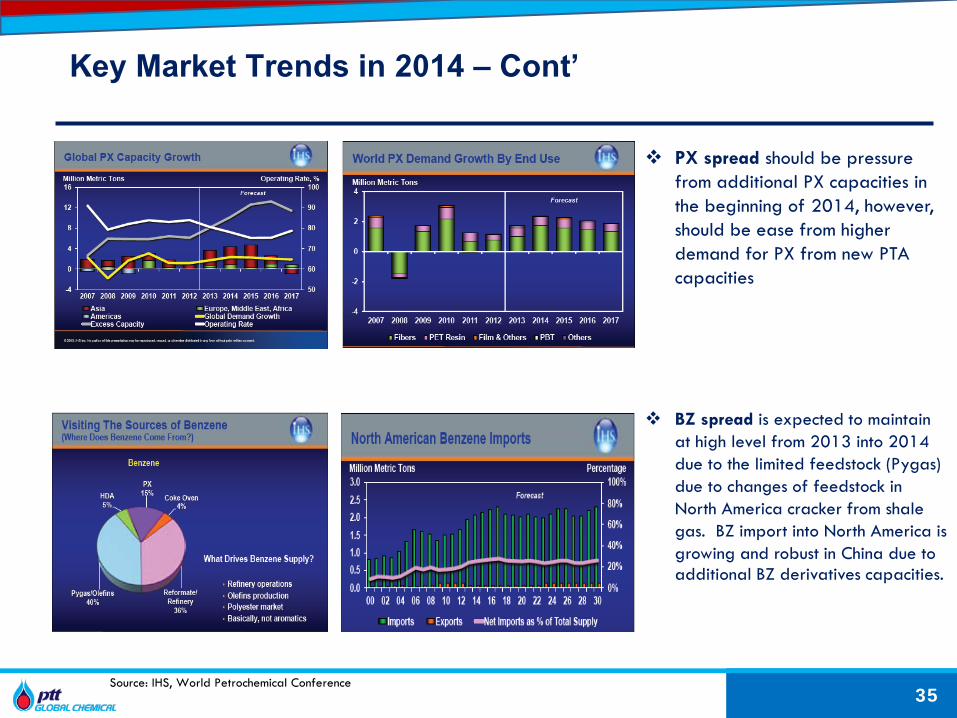
PX spread should be pressure from additional PX capacities in the beginning of 2014, however, should be ease from higher demand for PX from new PTA capacities
BZ spread is expected to maintain at high level from 2013 into 2014 due to the limited feedstock (Pygas) due to changes of feedstock in North America cracker from shale gas. BZ import into North America is growing and robust in China due to additional BZ derivatives capacities.
Source: IHS, World Petrochemical Conference

Key Market Trends in 2014 – Cont’
36
Global Ethylene supply & demand is expected to be tight in 2014 even though new capacities are being add into the market where global operating rate to be flat YoY at 87%
Global PE demand is still growing at 4.6% per year
HDPE price is expected to remain at high level from improving economic and less supply coming in 2014
Source: IHS, World Petrochemical Conference

37
For further information & enquiries, please contact our Investor Relations Team at [email protected]
Thank You
1 Thitipong Jurapornsiridee VP - Corporate Finance & IR [email protected] +662-265-85742 Puvadol Vasudhara IR Manager [email protected] +662-140-87123 Panugorn Puengpradit IR Analyst [email protected] +662-140-87144 Prang Chudasring IR Analyst [email protected] +662-265-83275 Chutima Jarikasem IR Coordinator [email protected] +662-140-8713

Agenda
Appendix
3Q/13 Detail Performance
Product Demand/Supply
The 3 Incidents in 2013
38

70
80
90
100
110
120
130
Jan-
12Fe
b-12
Mar
-12
Apr-
12M
ay-1
2Ju
n-12
Jul-1
2Au
g-12
Sep-
12O
ct-1
2N
ov-1
2D
ec-1
2Ja
n-13
Feb-
13M
ar-1
3Ap
r-13
May
-13
Jun-
13Ju
l-13
Aug-
13Se
p-13
Oct
-13
Dubai
3Q/13 Business Environment and Operations Recap
39
THB/USD
USD/BBL
116.1 106.4 106.3 107.4 108.2 100.7 106.3 1Q/12 2Q/12 3Q/12 4Q/12 1Q/13 2Q/13 3Q/13
27.00
28.00
29.00
30.00
31.00
32.00
33.00
Jan-
12Fe
b-12
Mar
-12
Apr-
12M
ay-1
2Ju
n-12
Jul-1
2Au
g-12
Sep-
12O
ct-1
2N
ov-1
2De
c-12
Jan-
13Fe
b-13
Mar
-13
Apr-
13M
ay-1
3Ju
n-13
Jul-1
3Au
g-13
Sep-
13O
ct-1
3N
ov-1
3
31.0 31.3 31.3 30.7 29.8 29.9 31.51Q/12 2Q/12 3Q/12 4Q/12 1Q/13 2Q/13 3Q/13
Unrests in several oil producing countries supported Dubai crude price to average at 106 USD/BBL in 3Q/13, increased 6% from 101 USD/BBL in 2Q/13.
Rising oil price contributed to a stock gain&NRV of Baht 3,768 mn
Baht depreciated from US FED’s signal on QE tapering from avg. 29.9 Baht/USD in 2Q/13 to 31.5 Baht/USD in 3Q/13
Higher crude price pushes products prices up while mix margin among products
Most Products Price/spreads increased
Diesel-Dubai 17.32 USD/BBL +3% QoQ -18% YoY
PX-Cond 511 USD/Ton -5% QoQ +20% YoY
HDPE 1,489 USD/Ton +3% QoQ +11% YoY
MEG 1,143 USD/Ton -3% QoQ +7% YoY
Overall utilization rate of major businesses
3Q/12 2Q/13 3Q/13Refinery 101% 63% 98%Aromatics 90% 84% 91%Olefins 91% 93% 75%Polymers 102% 90% 88%MEG 93% 100% 92%Green - FA 116% 112% 139%Green - ME 84% 106% 129%Phenol 128% 127% 124%

3Q/13 Key Financial Highlights
40
(Unit: Million Baht) 3Q/2013 3Q/2012
(Restate) 2Q/2013
YoY
% + /(-)
QoQ
% + /(-)
9 Month
Ending
June 30, 2013
9 Month
Ending
June 30, 2012
YoY
% + /(-)
Sale Revenue 141,394 145,309 111,887 -3% 26% 394,590 418,216 -6%
EBITDA 16,388 18,581 11,466 -12% 43% 44,273 41,106 8%
EBITDA Margin (%) 12% 13% 10% -1% 1% 11% 10% 14%
Net Profit 9,610 12,879 4,172 -25% 130% 25,857 24,239 7%
Earnings Per Share 2.13 2.86 0.93 -26% 129% 5.73 5.38 7%
Adjusted EBITDA 12,619 15,306 12,888 -18% -2% 42,569 40,609 5%
Adjusted EBITDA Margin (%) 9% 11% 12% -2% -3% 11% 10% 1%
9M/13 Sales Split Domestic : Export Volume
11% 74%
85% 38%
91% 64%
76%
89% 26%
15% 62%
9% 36%
24%
0% 20% 40% 60% 80% 100%
Phenol & BPAGreen
EO-basedPolymers
OlefinsAromatics
Refinery
Domestic Export
Refinery BU Performance
41
Market Price
-15
-5
5
15
25
3Q-12 4Q-12 1Q-13 2Q-13 3Q-13
Jet-Dubai Diesel-Dubai FO-Dubai
Sales Volume
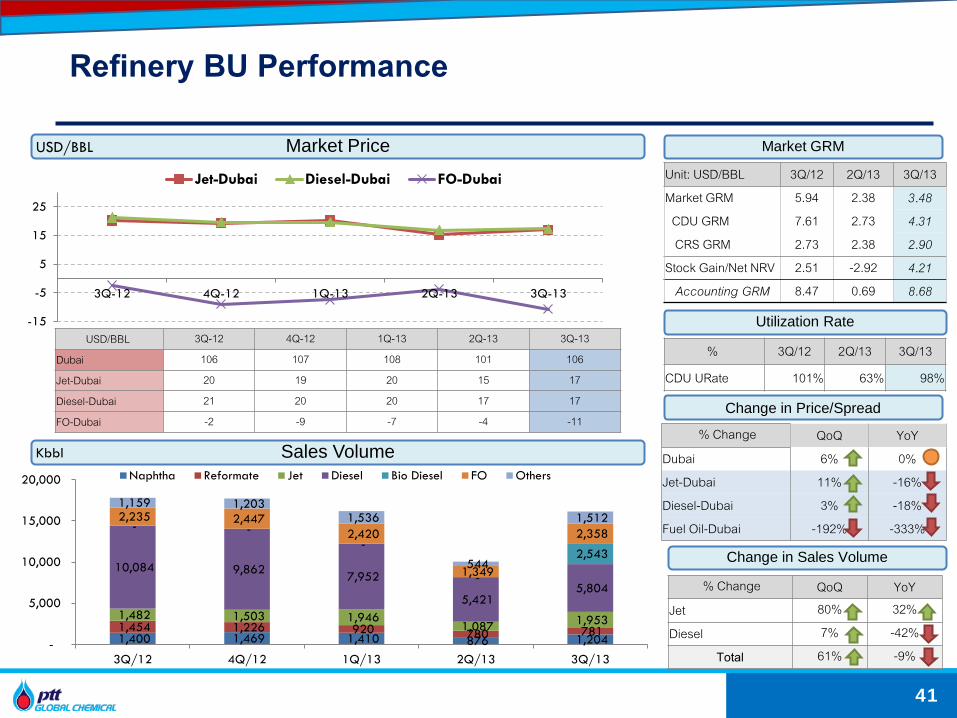
USD/BBL 3Q-12 4Q-12 1Q-13 2Q-13 3Q-13
Dubai 106 107 108 101 106
Jet-Dubai 20 19 20 15 17
Diesel-Dubai 21 20 20 17 17
FO-Dubai -2 -9 -7 -4 -11
1,400 1,469 1,410 876 1,204 1,454 1,226 920 780 781 1,482 1,503 1,946
1,087 1,953
10,084 9,862 7,952
5,421 5,804
- - -
-
2,543
2,235 2,447 2,420
1,349
2,358
1,159 1,203 1,536
544
1,512
-
5,000
10,000
15,000
20,000
3Q/12 4Q/12 1Q/13 2Q/13 3Q/13
Naphtha Reformate Jet Diesel Bio Diesel FO Others
Market GRM
Change in Price/Spread
Change in Sales Volume
Utilization Rate
% 3Q/12 2Q/13 3Q/13
CDU URate 101% 63% 98%
% Change QoQ YoY
Dubai 6% 0%
Jet-Dubai 11% -16%
Diesel-Dubai 3% -18%
Fuel Oil-Dubai -192% -333%
% Change QoQ YoY
Jet 80% 32%
Diesel 7% -42%
Total 61% -9%
USD/BBL
Kbbl
Unit: USD/BBL 3Q/12 2Q/13 3Q/13
Market GRM 5.94 2.38 3.48
CDU GRM 7.61 2.73 4.31
CRS GRM 2.73 2.38 2.90
Stock Gain/Net NRV 2.51 -2.92 4.21
Accounting GRM 8.47 0.69 8.68

Aromatics BU Performance
42
Market Price
800
1,000
1,200
1,400
1,600
1,800
3Q-12 4Q-12 1Q-13 2Q-13 3Q-13
Naphtha Condensate PX BZ
Sales Volume
P2F
Change in Price/Spread
Change in Sales Volume
Utilization Rate
% Change QoQ YoY
Condensate 7% 1%
PX-Cond -5% 20%
BZ-Cond -21% 27%
% Change QoQ YoY
BTX 2% -5%
% 3Q/12 2Q/13 3Q/13
BTX U-Rate 90% 84% 91%
USD/Ton 3Q/12 2Q/13 3Q/13
Market P2F 243 325 260
Stock Gain 41 -46 84
210 193 181 213 189
330 324 318 291 325
208 248 216 189 270
102 118 109 96
93
-
200
400
600
800
1,000
3Q/12 4Q/12 1Q/13 2Q/13 3Q/13
Benzene Paraxylene Ref+LN Other By-Products
USD/Ton
USD/Ton 3Q-12 4Q-12 1Q-13 2Q-13 3Q-13
PX- Cond 426 605 669 539 511
BZ-Cond 259 431 430 415 329
KTon
*Benzene = BZ+Cyclohexane Paraxylene = PX + Other BTX

Olefins and Olefins Derivatives BU Performance
43
800
1,000
1,200
1,400
1,600
3Q-12 4Q-12 1Q-13 2Q-13 3Q-13
Naphtha HDPE LLDPE LDPE MEG
Market Price
Sales Volume
188 169 200 218 129 198 203 216 193 208
111 117 102 70 119 96 63 75
71 25
91 101 83 104 95
404 383 393 334 352
0100200300400500
3Q-12
4Q-12
1Q-13
2Q-13
3Q-13
Olefins HDPE LLDPE LDPE MEG Total PE
QoQ YoYEthylene 5% 10%HDPE 3% 11%LLDPE 4% 11%LDPE 9% 18%MEG -3% 7%
QoQ YoYOlefins 41% -32%HDPE 8% 5%LLDPE 70% 7%LDPE -66% -74%MEG -8% 5%
Change in Price
Utilization
Change in Sales Volume
USD/Ton
USD/Ton 3Q-12 4Q-12 1Q-13 2Q-13 3Q-13
Naphtha 915 944 961 858 920
HDPE 1,343 1,393 1,482 1,443 1,489
LLDPE 1,341 1,399 1,477 1,433 1,490
LDPE 1,327 1,369 1,459 1,444 1,569
MEG 1,065 1,247 1,282 1,173 1,143
KTon
3Q/12 2Q/13 3Q/13
Olefins 91% 93% 75%
HDPE 100% 96% 106%
LLDPE 113% 72% 113%
LDPE 113% 99% 5%
MEG 93% 100% 92%

Phenol Performance
44
Market Price
Sales Volume
Change in Spread
Utilization
Change in Sales Volume
100
150
200
250
300
3Q-12 4Q-12 1Q-13 2Q-13 3Q-13
Phenol-BZ BPA-Phenol
USD/Ton 3Q-12 4Q-12 1Q-13 2Q-13 3Q-13
Phenol-BZ 264 165 233 245 244
BPA-Phenol 212 189 268 188 128
34,407 40,988 37,842 34,436 24,099
32,880 34,827
25,128 41,751 44,946
-
20,000
40,000
60,000
80,000
3Q-12 4Q-12 1Q-13 2Q-13 3Q-13
Phenol BPA
3Q/12 2Q/13 3Q/13
Phenol 128% 127% 124%
BPA 36% 116% 116%
QoQ YoY
Phenol-BZ 0% -8%
BPA-Phenol -32% -39%
QoQ YoY
Phenol -30% -30%
BPA 8% 37%
USD/Ton
Ton

3Q/13 Profit and Loss Statement
45
3Q/2012(Restate) 2Q/2013
THB Mn % THB Mn % THB Mn % THB Mn % THB Mn %1 Sales Revenue 145,309 100 111,887 100 141,394 100 (3,915) (3) 29,507 26 2 Feedstock Cost (119,602) (82) (87,594) (78) (116,522) (82) 3,080 3 (28,928) (33)3 Product to Feed Margin 25,707 18 24,293 22 24,872 18 (835) (3) 579 2 4 Variable Cost (5,136) (4) (6,204) (6) (6,211) (4) (1,075) (21) (7) (0)5 Fixed Cost (3,940) (3) (4,163) (4) (4,028) (3) (88) (2) 135 3 6 Stock Gain/(Loss) & NRV 3,275 2 (1,422) (1) 3,768 3 493 15 5,190 365 7 Gain/(Loss) Hedging Commodity (30) (0) 419 0 560 0 590 141 34 8 Other Income 1,311 1 1,362 1 1,235 1 (76) (6) (127) (9)9 SG&A (2,606) (2) (2,819) (3) (3,808) (3) (1,202) (46) (989) (35)
10 EBITDA 18,581 13 11,466 10 16,388 12 (2,193) (12) 4,922 43 11 Depreciation & Amortization (4,328) (3) (4,187) (4) (4,149) (3) 179 4 38 1 12 EBIT 14,253 10 7,279 7 12,239 9 (2,014) (14) 4,960 68 13 Financing Expenses (Net Interest Earned) (1,438) (1) (1,120) (1) (1,144) (1) 294 20 (24) (2)14 FX Gain/(Loss) 746 1 (2,726) (2) (738) (1) (1,484) (199) 1,988 73 15 Shares of gain/(loss)from investments 25 0 (22) (0) (54) (0) (79) (316) (32) (145)16 Corporate Income Tax (562) (0) 509 0 (708) (1) (146) (26) (1,217) (239)17 Net Profit After Income Tax 13,024 9 3,920 4 9,595 7 (3,429) (26) 5,675 145
Portion of Net Profit: 18 Shareholders 12,879 9 4,172 4 9,610 7 (3,269) (25) 5,438 130 19 Minorities 145 0 (252) (0) (15) (0) (160) (110) 237 94
20 Adjusted EBITDA 15,306 11 12,888 12 12,619 9 (2,687) (18) (269) (2)
3Q/2013 YoY QoQ
Note: Adjusted EBITDA = EBITDA – Stock Gain/(Loss) &NRV

9M/13 Profit and Loss Statement
46
THB Mn % THB Mn % THB Mn %1 Sales Revenue 418,216 100 394,590 100 (23,626) (6)2 Feedstock Cost (351,638) (84) (316,235) (80) 35,403 10 3 Product to Feed Margin 66,578 16 78,355 20 11,777 18 4 Variable Cost (12,271) (3) (19,318) (5) (7,047) (57)5 Fixed Cost (10,588) (3) (12,319) (3) (1,731) (16)6 Stock Gain/(Loss) & NRV 498 0 1,703 0 1,205 242 7 Gain/(Loss) Hedging Commodity 367 0 1,127 0 760 207 8 Other Income 4,128 1 3,921 1 (207) (5)9 SG&A (7,605) (2) (9,196) (2) (1,591) (21)
10 EBITDA 41,106 10 44,273 11 3,167 8 11 Depreciation & Amortization (12,290) (3) (12,288) (3) 2 0 12 EBIT 28,816 7 31,985 8 3,169 11 13 Financing Expenses (Net Interest Earned) (4,136) (1) (3,379) (1) 757 18 14 FX Gain/(Loss) 502 0 (1,478) (0) (1,980) (395)15 Shares of gain/(loss)from investments 84 0 (94) (0) (178) (212)16 Corporate Income Tax (618) (0) (1,419) (0) (801) (130)17 Net Profit After Income Tax 24,648 6 25,615 6 967 4
Portion of Net Profit: 18 Shareholders 24,239 6 25,857 7 1,618 7 19 Minorities 409 0 (242) (0) (651) (159)
20 Adjusted EBITDA 40,609 10 42,570 11 1,961 5
YoY9M/12 9M/13
Note: Adjusted EBITDA = EBITDA – Stock Gain/(Loss) &NRV

Agenda
Appendix
3Q/13 Detail Performance
Product Demand/Supply
The 3 Incidents in 2013
47

434 407 402 480 531
467 456 463 345
439 415 420 460 477 486 486
961 858
920 946 928 896 878 872
1,395
1,265 1,322
1,427 1,459
1,363 1,333 1,335 1,306
1,297 1,336
1,367 1,388
1,373 1,363 1,358
0
200
400
600
800
1,000
1,200
1,400
1,600
1Q/13 2Q/13 3Q/13 4Q/13 1Q/14F 2Q/14F 3Q/14F 4Q/14F
Olefins Improved derivatives demand will support to Olefins market
USD/Ton Short-term Price Forecast Short-Term • Olefins prices remain high in 2H-13 due to
improve demand in derivatives markets in line with new PE plants in Asia will come on-stream
• However , For year 2014 the market will be pressured from
1) Additional new supply in Asia (mainly from China)
2) Turnaround and shutdown for maintenance of Asia cracker
3) Global economic outlook show the sign of
recovery Long-term Supply/Demand
Additional (2013-2018) (Unit : MMT)
Supply Demand 40.70 36.04
America24%
Middle East19%
Europe5%
China35%
Other Asia17%
Source: CMAI January 2014
-2,000
0
2,000
4,000
6,000
8,000
10,000
12,000
2013 2014 2015 2016 2017 2018
America Europe Middle East China Other Asia Additional demand
Unit : KMT
Reliance India 1,350 KMT Q1-16 to Q3-16
SINOPEC Wuhan CH 800 KMT Q1-11 to Q3-13
ExxonMobil SG 1,000 KMT Q3-11 to Q2-13
Sichuan PC China 800 KMT Q3-11 to Q4-13
Ilam Iran 458 KMT Q1-15 to Q1-16 OPAL India
1,100 KMT Q1-14 to Q3-14
CNOOC & Shell China 1,000 KMT Q1-16 to Q1-17
Sinopec Zhijin China 300 KMT Q4-14 to Q2-13
48

522 585 568 590
621 595 577 596 516
449 569 599 627 592 560 583
498 586
649 718 758
672 604 626
961 858 920 946 928 896 878 872
1,483 1,443 1,489 1,536 1,550 1,492 1,455 1,468 1,477
1,433 1,489 1,545 1,555 1,488 1,438 1,455 1,459
1,444
1,569 1,664 1,687 1,569 1,482 1,499
0
200
400
600
800
1,000
1,200
1,400
1,600
1,800
1Q/13 2Q/13 3Q/13 4Q/13 1Q/14F 2Q/14F 3Q/14F 4Q/14F
Short-term Price Forecast USD/Ton Short-Term • PE prices should still be supported from
growing demand in 2014 while new supplies are limited when compared to 2013 which should continue to support HDPE price to remain at high level
Polyethylene The market will be pressured from new supply in the short term
HDPE Long-term Supply/Demand
Additional (2013-2018) (Unit : MMT)
Supply Demand 12.92 11.54
America22%
Middle East24%
Europe8%
China39%
Other Asia7%
-5000
5001,0001,5002,0002,5003,000
2013 2014 2015 2016 2017 2018
America Europe Middle East China Other Asia Additional demand
Unit : KMT
Ilam Iran 300 KMT Q1-14 to Q1-15 SINOPEC Wuhan CH
300 KMT Q1-11 to Q3-13
Saudi Polymers Saudi 550 KMT Q3-11 to Q1-13
BPCL India 110 KMT Q3-13 to Q4-14
OPAL India 350 KMT Q1-13 to Q3-14
Sichuan PC China 300 KMT Q1-12 to Q4-13
Shanxi Coking Corp China 150 KMT Q2-15 to Q2-16
Source: CMAI January 2014 49

LLDPE & LDPE New Capacities and Closures
50 Source: CMAI January 2014
LDPE Long-term Supply/Demand
LLDPE Long-term Supply/Demand
Additional (2013-2018) (Unit : MMT)
Supply Demand 12.05 9.13
Additional (2013-2018) (Unit : MMT)
Supply Demand 5.96 3.80
America20%
Middle East15%
Europe2%
China38%
Other Asia25%
America22%
Middle East30%
Europe18%
China24%
Other Asia8%
-5000
5001,0001,5002,0002,5003,0003,500
2013 2014 2015 2016 2017 2018 America Europe Middle East China Other Asia Additional demand
Unit : KMT
SINOPEC Wuhan China 300 KMT Q1-11 to Q3-13
Sichuan PC China 300 KMT Q3-12 to Q4-13
OPAL India 350 KMT Q1-13 to Q3-14
Yulin Energy China 300 KMT Q2-13 to Q2-14
CNOOC & Shell China 300 KMT Q1-16 to Q1-17
Reliance India 550 KMT Q1-16 to Q4-16
-500
0
500
1,000
1,500
2,000
2013 2014 2015 2016 2017 2018
America Europe Middle East China Other Asia Additional demand
Unit : KMT Borouge UAE. 350 KTA Q1-14 to Q3-14
Reliance India 400 KTA Q1-15 to Q4-16
50

Short-term Price Forecast USD/Ton Short-Term • MEG market will be driven up from stronger
demand in the downstream textiles and fabrics sectors in China due to high seasonal demand in 2H-2013
• For year 2014, the market remain robust continuously from previous year due to strong derivative demand from new Polyester plants in China will start up
375 351 284 281 256
421 503 552
961 858 920 946 928 896 878 872
1,395 1,265 1,322
1,427 1,459 1,363
1,333 1,335 1,282
1,173 1,143 1,208 1,204 1,307
1,370 1,420
0
200
400
600
800
1,000
1,200
1,400
1,600
1Q/13 2Q/13 3Q/13 4Q/13 1Q/14F 2Q/14F 3Q/14F 4Q/14F
MEG the market remain robust due to seasonal and strong derivative demand
MEG Long-term Supply/Demand
Additional (2013-2018) (Unit : MMT)
Supply Demand 14.98 8.89
America14%
Europe5%
Middle East13%India
5%
China60%
Other Asia3%
51 Source: PCI November 2013
01,0002,0003,0004,0005,0006,0007,000
2013 2014 2015 2016 2017 2018
America Europe India Middle East
China Other Asia Additional demand
Ningbo Heyuan China 500 KTA Q4-12 to Q1-13
Unit : KMT PetroChina Sichuan China 380 KTA Q3-13 to Q1-14
Dahua Chemical China 500 KTA Q2-15 to Q1-16
Sinopec Wuhan China 295 KTA Q1-13 to Q3-13
51

Short-term Price Forecast Short-Term • Additional new supply in Asia and squeezed
PTA margins and high inventory levels among downstream Polyester market will affect the PX market in 2H-2013
• For year 2014, PX market still be pressured on more new supplies in Asia mainly from China
USD/Ton
673 551 528 496 477 500 474 458
961 858 920 946 928 896 878 872
1,634
1,409 1,449 1,442 1,405 1,397 1,352 1,330
0
200
400
600
800
1,000
1,200
1,400
1,600
1,800
1Q/13 2Q/13 3Q/13 4Q/13 1Q/14F 2Q/14F 3Q/14F 4Q/14F
Paraxylene Additional new supplies will pressure on PX market
PX Long-term Supply/Demand
52
Additional (2013-2018) (Unit : MMT)
Supply Demand 24.42 14.93
Source: PCI November 2013
America2%
Europe3%
Middle East24%
India15%
China24%
Other Asia32%
01,0002,0003,0004,0005,0006,0007,0008,000
2013 2014 2015 2016 2017 2018
America Europe India Middle East China Other Asia Additional demand
Unit : KMT PetroRabigh Saudi. 1,400 KTA Q3-15 to Q3-16
SK Energy S. Korea 800 KTA Q3-12 to Q1-14
Tenglong Aromatics1 China 800 KTA Q2-12 to Q3-13
52

Short-term Price Forecast USD/Ton Short-Term • Benzene supply in 2H-2013 will depend
on the shutdown for maintenance of Aromatics plants and higher operating rate of Cracker in Asia due to high margin
• For year 2014, Benzene market will be depend on volatile crude and feedstock prices and improve derivatives demand from SM and Phenol market
428 429 336 337 387 335 325 347
961 858 920 946 928 896 878 872
1,389 1,287 1,256 1,283 1,315
1,231 1,203 1,219
0
200
400
600
800
1,000
1,200
1,400
1,600
1Q/13 2Q/13 3Q/13 4Q/13 1Q/14F 2Q/14F 3Q/14F 4Q/14F
Benzene the market will still be driven by the main products
Additional (2013-2018) (Unit : MMT)
Supply Demand 8.76 8.01
BZ Long-term Supply/Demand
America2%
Middle East25%
Europe3%China
24%
Other Asia59%
53 Source: CMAI January 2014
-500
0
500
1,000
1,500
2,000
2,500
2013 2014 2015 2016 2017 2018
America Europe Middle East China Other Asia Additional demand
Anqing PC China 54 KTA Q3-12 to Q1-13
Samsung Total PC S. Korea 422 KTA Q4-14 to Q3-14
Nghi Son Vietnam 246 KTA Q1-15 to Q3-17
ExxonMobil Sing. 340 KTA Q1-13 to Q2-13
Unit : KMT
Reliance India 260 KTA Q1-16 to Q-15
53
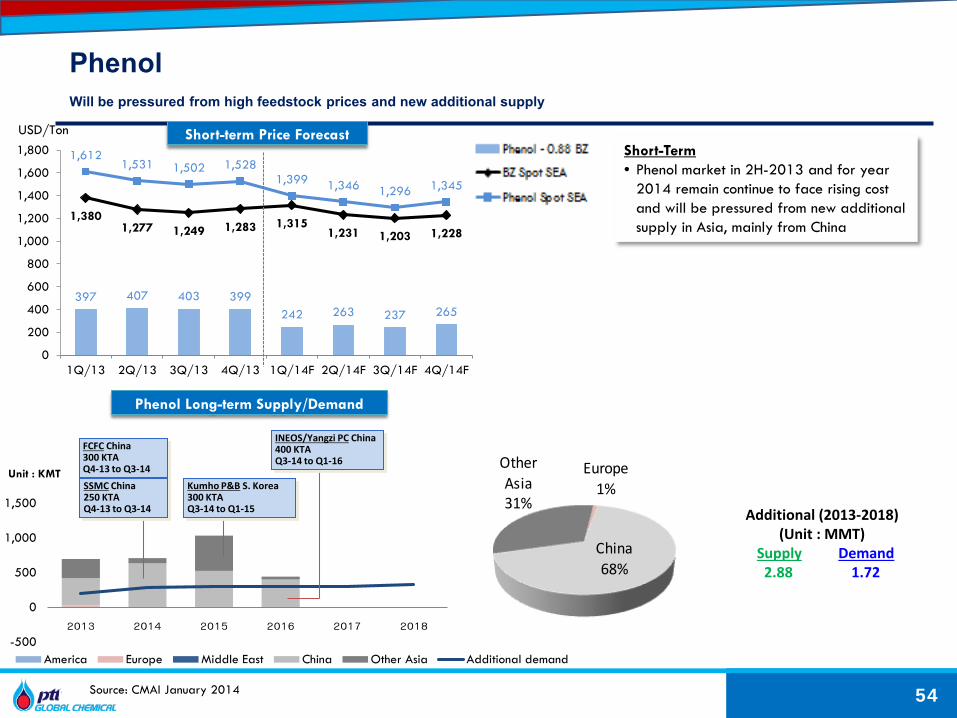
Short-term Price Forecast USD/Ton
Short-Term • Phenol market in 2H-2013 and for year
2014 remain continue to face rising cost and will be pressured from new additional supply in Asia, mainly from China
397 407 403 399 242 263 237 265
1,380 1,277 1,249 1,283 1,315
1,231 1,203 1,228
1,612 1,531 1,502 1,528
1,399 1,346 1,296 1,345
0
200
400
600
800
1,000
1,200
1,400
1,600
1,800
1Q/13 2Q/13 3Q/13 4Q/13 1Q/14F 2Q/14F 3Q/14F 4Q/14F
Phenol Will be pressured from high feedstock prices and new additional supply
Additional (2013-2018) (Unit : MMT)
Supply Demand 2.88 1.72
Phenol Long-term Supply/Demand
Europe1%
China68%
Other Asia31%
54 Source: CMAI January 2014
-500
0
500
1,000
1,500
2013 2014 2015 2016 2017 2018
America Europe Middle East China Other Asia Additional demand
Unit : KMT
INEOS/Yangzi PC China 400 KTA Q3-14 to Q1-16
FCFC China 300 KTA Q4-13 to Q3-14
SSMC China 250 KTA Q4-13 to Q3-14
Kumho P&B S. Korea 300 KTA Q3-14 to Q1-15
54

Agenda
Appendix
3Q/13 Detail Performance
Product Demand/Supply
The 3 Incidents in 2013
55

The 3 Incidents in 2013
56
Oil Spill What happened? On July 27, 2013 leakage in the flexible hose was found at the SPM while discharging crude oil. The leakage resulted in oil spill of 54,341 liters. On and off shore cleanup operation was done quickly and effectively. What’s the update? The oil spill incident expenses, including provision, for 3Q/13 was Baht1,059 mn. - Recovery expenses Baht 192 mn - Restoration expenses Baht 791 mn - Other expenses Baht 76 mn PTTGC and the insurance company are in the process of negotiation of the reimbursement claim covered by the insurance company.
GSP#5 Shutdown What happened? On August 14, 2013, thunder storm and lightning strike on the Waste Heat Recovery Unit or WHRU of PTT’s GSP#5 which is the gas supplier of I4-2 plant (capacity 450 KTA) PTT anticipated that the repairs will take approximately 3-5 months. What’s the update? -PTT’s GSP#5 is back to run at 50% and expects to run at 100% in early 2Q/14 and 100% back to normal operation by Aug. 2014. -PTTGC’s overall olefin utilization rate to be around 90% in 4Q/13.
LDPE Shutdown What happened? LDPE (capacity 300KTA) shutdown since July 10, 2013 to repair the cylinder of the Booster/Primary Compressor. PTTGC expected to take approximately 3.5 months to repair the LDPE plant. Impact estimated 2% of NI. What’s the update? -Start up on Sep. 26, 2013, which was earlier than plan. -Resume with utilization rate of 77% in Oct. with target of over 100% for the remaining of the year. -In the process of doing Root- Cause Analysis


