40
Invista Real Estate Investment Management Holdings plc 2009 Results Presentation Duncan Owen, CEO Guy Eastaugh, CFO 26 February 2010
| Date post: | 26-May-2015 |
| Category: |
Documents |
| Upload: | khanyasmin |
| View: | 795 times |
| Download: | 4 times |

Invista Real Estate Investment Management Holdings plc
2009 Results Presentation
Duncan Owen, CEO
Guy Eastaugh, CFO
26 February 2010

2
Agenda
Highlights
Fund Performance
Financial Results
New Balance Sheet Co-Investment
Strategy and Outlook
Appendix

33
Key objectives
Superior investment performance
Grow recurring management fees
Increase the number of opportunities for performance fees
Deploy balance sheet into growth areas for our business
Diversify the business into new fund types and geographies

44
2009 Highlights
Recurring revenue
Profit pre FVA £11.1m - business continues to generate a good margin at 32% - effective cost control with 17% reduction in administrative expenses
Market passed the point of inflection - stabilisation of capital values
Growth in listed funds
Positive net fund inflows since Q3 2009
Strong investment performance with 70%* of AUM meeting or outperforming benchmarks over 3 year period to 31 December 2009 (over 90% in 2009)
Performance fees – BOSS fund offers new performance fees
Deployment of Capital
Capital discipline - £73.7 million of cash at year end
International Fund acquisition of Big Orange Self Storage for £12.95m - year end valuation gains
Investment in Invista European Real Estate Trust rights issue - £2.6 million up 41% (original investment up over 300%)
Securities Fund - realised gains of £600,000 & the fund up c.35%
Diversification - Take over of the Asian platform in Singapore and Hong Kong at no purchase cost*Not all funds under management are listed, only those where benchmarks are available*Source: Invista, IPD, FTSE EPRA/NAREIT
55
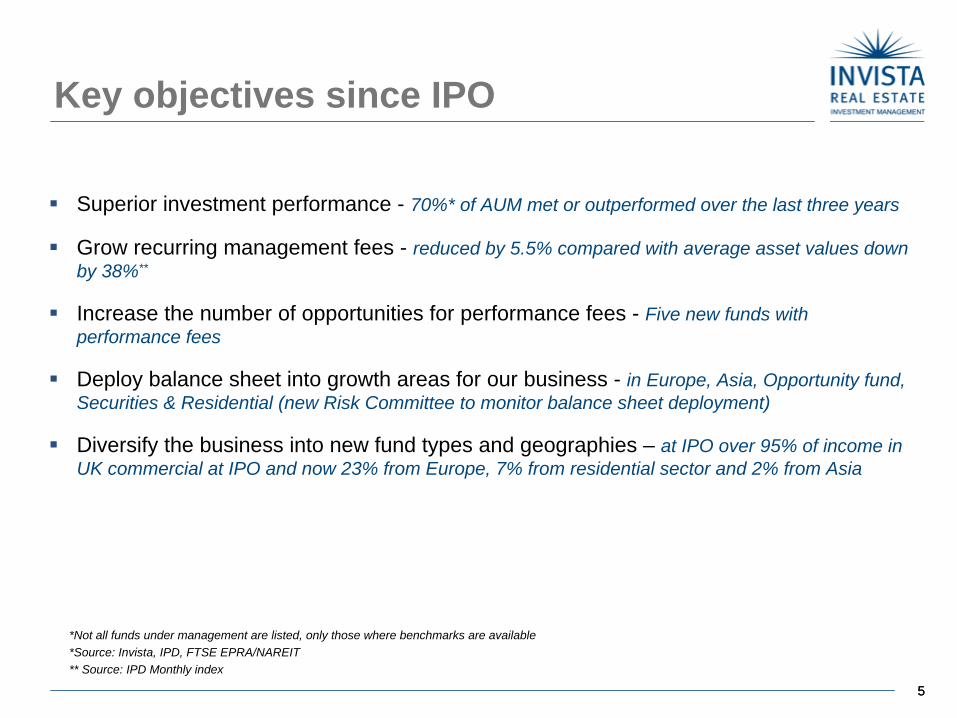
Key objectives since IPO
Superior investment performance - 70%* of AUM met or outperformed over the last three years
Grow recurring management fees - reduced by 5.5% compared with average asset values down by 38%**
Increase the number of opportunities for performance fees - Five new funds with performance fees
Deploy balance sheet into growth areas for our business - in Europe, Asia, Opportunity fund, Securities & Residential (new Risk Committee to monitor balance sheet deployment)
Diversify the business into new fund types and geographies – at IPO over 95% of income in UK commercial at IPO and now 23% from Europe, 7% from residential sector and 2% from Asia
*Not all funds under management are listed, only those where benchmarks are available*Source: Invista, IPD, FTSE EPRA/NAREIT** Source: IPD Monthly index

6
Highlights
Fund Performance
Financial Results
New Balance Sheet Co-Investment
Strategy and Outlook
Appendix

77
AUM and Revenue
FY 2008
34%
15%
51%
HBOS Funds Separate Accounts Collective Investor Funds
Revenue
31 Dec 2008
48%
23%
29%
HBOS Funds Separate Accounts Collective Investor Funds
FY 2009
33%
13%
54%
HBOS Funds Separate Accounts Collective Investor Funds
31 Dec 2009
45%
24%
31%
HBOS Funds Separate Accounts Collective Investor Funds
Assets Under Management

88
Diversification by AUM and Revenue
31 Dec 2005
52%
29%
19%
HBOS Funds Separate Accounts Collective Investor FundsRevenue
31 Dec 2005
57%33%
10%
HBOS Funds Separate Accounts Collective Investor Funds
31 Dec 2009
33%
13%
54%
HBOS Funds Separate Accounts Collective Investor Funds
31 Dec 2009
45%
24%
31%
HBOS Funds Separate Accounts Collective Investor Funds
Assets Under Management
Growth in higher margin CIFs for future profitability and with less dependency on group
9
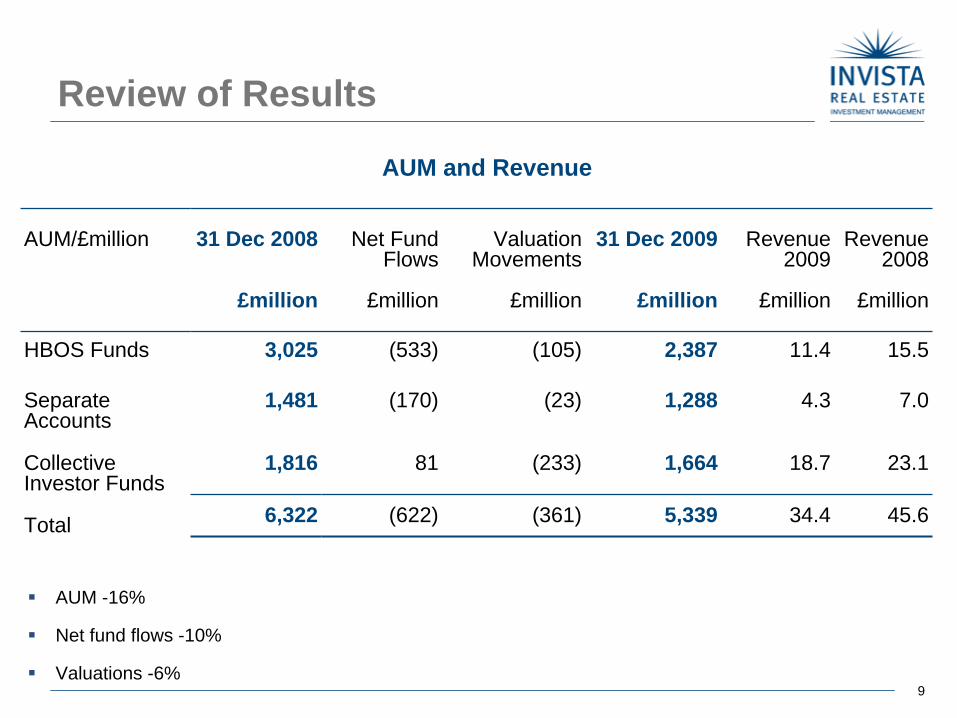
Review of Results
AUM/£million 31 Dec 2008
£million
Net Fund Flows
£million
Valuation Movements
£million
31 Dec 2009
£million
Revenue2009
£million
Revenue2008
£million
HBOS Funds 3,025 (533) (105) 2,387 11.4 15.5
SeparateAccounts
1,481 (170) (23) 1,288 4.3 7.0
CollectiveInvestor Funds
1,816 81 (233) 1,664 18.7 23.1
Total 6,322 (622) (361) 5,339 34.4 45.6
AUM -16%
Net fund flows -10%
Valuations -6%
AUM and Revenue

1010
Three Year investment performanceObjective – maximise investment returns compared with benchmarks (set by funds/clients)
70%* of AUM meeting or outperforming benchmarks over 3 year period to 31 December 2009
Over 90% of AUM meeting or outperforming benchmarks in 2009
91%
68% 70%
0%
10%
20%
30%
40%
50%
60%
70%
80%
90%
100%
2007 2008 2009
Perf
orm
ance
%
Sustained outperformance over the long run
Source: Source: Invista, IPD, MSS Real Estate, FTSE EPRA/NAREIT
Note: The publication deadline for this report typically precedes the release of benchmark returns for the most recently completed calendar year for two of the Invista funds. As a result, the published Invista fund performance figures for 2009 may yet be revised upwards or downwards; similarly, the performance figures for 2008 are now complete, given the subsequent receipt of benchmark returns since the publication of the previous Annual Report.
*Not all funds under management are listed, only those where benchmarks are available

11
Agenda/Contents
Highlights
Fund Performance
Financial Results
New Balance Sheet Co-Investment
Strategy and Outlook
Appendix
12
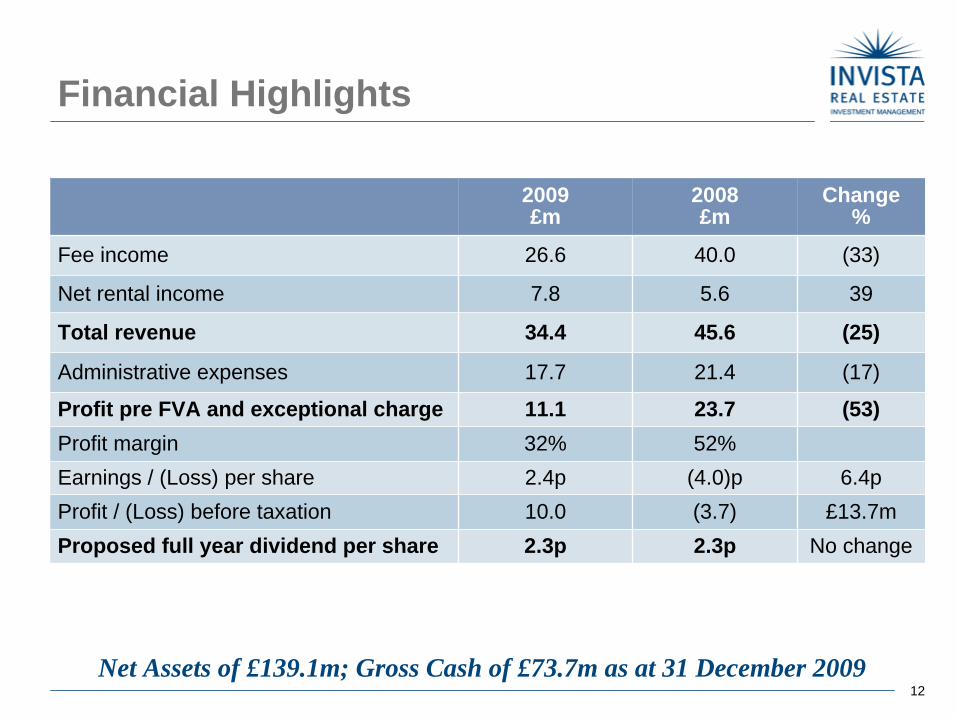
Financial Highlights
2009£m
2008£m
Change%
Fee income 26.6 40.0 (33)
Net rental income 7.8 5.6 39
Total revenue 34.4 45.6 (25)
Administrative expenses 17.7 21.4 (17)
Profit pre FVA and exceptional charge 11.1 23.7 (53)Profit margin 32% 52%Earnings / (Loss) per share 2.4p (4.0)p 6.4pProfit / (Loss) before taxation 10.0 (3.7) £13.7mProposed full year dividend per share 2.3p 2.3p No change
Net Assets of £139.1m; Gross Cash of £73.7m as at 31 December 2009

13
Revenue
Years to 31 December
31 Dec 2009
£million
31 Dec 2008
£million
Change
%
Management fees 26.6 38.3 (31)
Performance fees - 1.7 (100)
Net rental income 7.8 5.6 39
Revenue 34.4 45.6 (25)
Average AUM £5.51bn £7.65bn (28)
Management fee margin 48.3bps 50.1bps -1.8bps
Source: Invista REIM
14
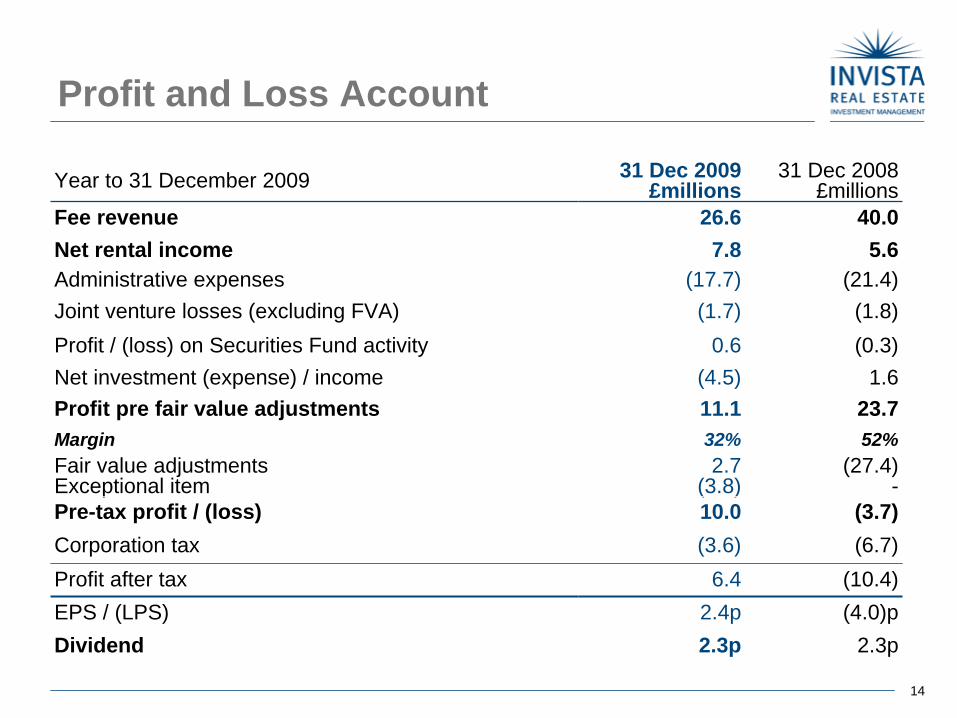
Profit and Loss Account
Year to 31 December 2009 31 Dec 2009£millions
31 Dec 2008£millions
Fee revenue 26.6 40.0Net rental income 7.8 5.6Administrative expenses (17.7) (21.4)Joint venture losses (excluding FVA) (1.7) (1.8)Profit / (loss) on Securities Fund activity 0.6 (0.3)Net investment (expense) / income (4.5) 1.6Profit pre fair value adjustments 11.1 23.7Margin 32% 52%Fair value adjustmentsExceptional item
2.7(3.8)
(27.4)-
Pre-tax profit / (loss) 10.0 (3.7)Corporation tax (3.6) (6.7)Profit after tax 6.4 (10.4)EPS / (LPS) 2.4p (4.0)pDividend 2.3p 2.3p
15
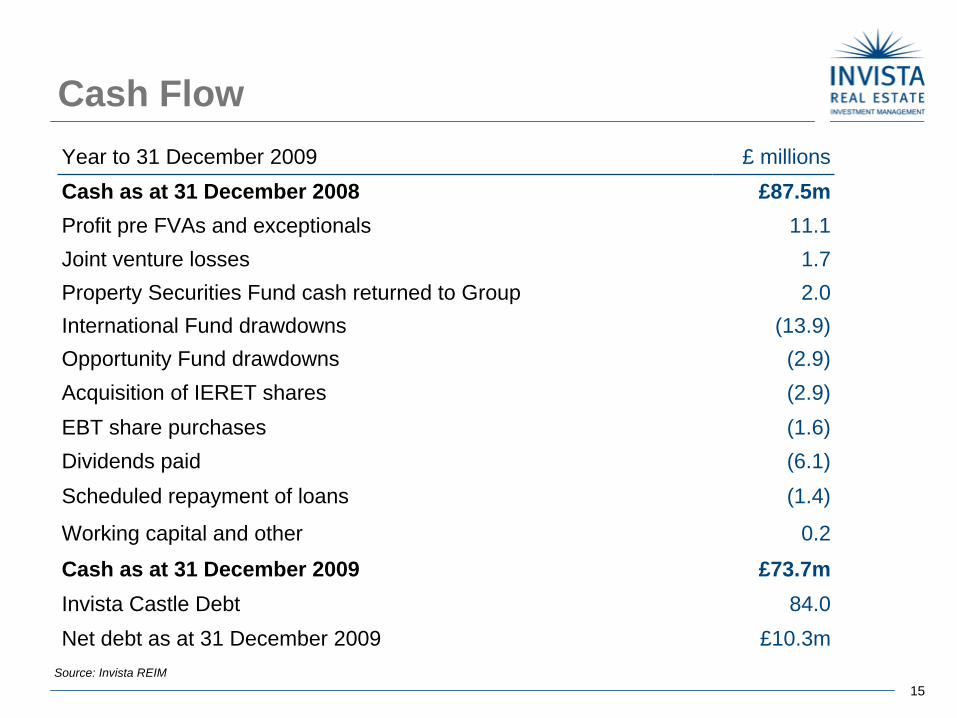
Cash FlowYear to 31 December 2009 £ millionsCash as at 31 December 2008 £87.5mProfit pre FVAs and exceptionals 11.1Joint venture losses 1.7Property Securities Fund cash returned to Group 2.0International Fund drawdowns (13.9)Opportunity Fund drawdowns (2.9)Acquisition of IERET shares (2.9)EBT share purchases (1.6)Dividends paid (6.1)Scheduled repayment of loans (1.4)
Working capital and other 0.2
Cash as at 31 December 2009 £73.7mInvista Castle Debt 84.0Net debt as at 31 December 2009 £10.3m
Source: Invista REIM

1616
Cash
£73.7m in cash as at 31 December 2009
Outstanding commitments £m
Opportunity Fund 17.2
International Fund 10.4
Net 46.1
Net includes £8.9m of cash in the Invista Castle Group
1717
Banking ArrangementsCASTLE (100% owned : on balance sheet)
£13.6m Acquisition Loan due April 2011 has LTV covenant of 70%
Current LTV 69%
£70.4m Senior Debt (amortising 2028) has no LTV covenant
Weighted average interest rate swapped out at 6.6%
Secured on the underlying assets of Invista Castle Limited
CELSIUS (50% owned : being held at £nil)
€141m Senior Debt & extension to facility from Kaupthing
Loan not in default
Non recourse to Invista
1818
Balance Sheet Investments Invista Castle £37.0m
317 residential family houses
Across 5 sites; let to MoD on 25 year lease, 18 years remaining
Invista Real Estate International Fund £17.1m
Principal asset is 50% interest in Big Orange Self Storage
Global Property Securities Fund £10.8m
Booked realised profits of £0.6m; returned £2.0m to Invista
Invista Real Estate Opportunity Fund £6.1m
Four investments; three UK, one Switzerland
Stakes in Listed Trusts £7.0m
6.4% stake in Invista European Real Estate Trust
2.25% stake in Invista Foundation Property Trust

19
Highlights
Fund Performance
Financial Results
New Balance Sheet Co-Investment
Strategy and Outlook
Appendix
20
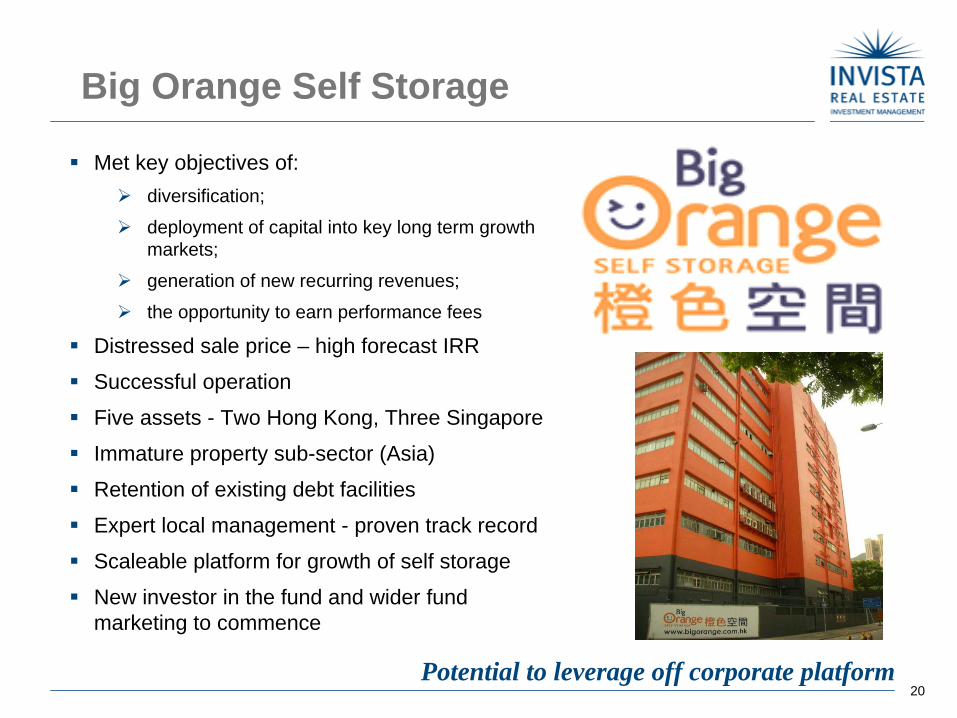
Big Orange Self Storage
Met key objectives of:diversification;
deployment of capital into key long term growth markets;
generation of new recurring revenues;
the opportunity to earn performance fees
Distressed sale price – high forecast IRR
Successful operation
Five assets - Two Hong Kong, Three Singapore
Immature property sub-sector (Asia)
Retention of existing debt facilities
Expert local management - proven track record
Scaleable platform for growth of self storage
New investor in the fund and wider fund marketing to commence
Potential to leverage off corporate platform

21
Target markets and acquired assets
Japan
Hong Kong
Singapore
Hong Kong
Singapore
Invista Operations
Acquired Assets
Existing markets
Target market
Sha Tin (9,793 sq m)1
Current phase I occupancy 99%
Phase II in progress
Kwai Chung (8,531 sq m) 1
Current phase I occupancy 64%
Phase II in progress
Woodlands (8,000 sq m)1
Current phase I occupancy 68%
Bukit Batok (4,398 sq m) 1
Current phase I occupancy 15%
Hougang (4,469 sq m)1
Phase I in progress
1 Represents maximum lettable area for self storage
Singapore Portfolio (16,867 sq m)
Hong Kong Portfolio (18,324 sq m)

22
Invista Opportunity Fund
Invests in UK and Continental Europe
Fund's objective is to target a net return to investors of over 15%
Five assets currently in the fund (Four investments)
Created recurring revenue, minimum annual fee and diversification into a growth area
Fund has £33.5 million of gross asset value
Invested £17.3m of equity (i.e. 31% of commitments)
Borrowing varies between 40% – 71% LTV
Annualised rental income for entire portfolio £1.36m p.a.

23
Invista Opportunity Fund Assets
47 acres of agricultural land in Witney reserved for housing
£4.3 million acquisition cost with £2.0 million senior debt
Land subject to Option Agreement in 2012 at indexed price
Value today without planning £5.0 million
Strategy to acquire adjoining sites and renegotiate Option
100,000 sq ft Industrial property located in Etoy, between Geneva and Lausanne
JV with Gicram, a well established French developer
Acquired from a liquidation at auction, cost of £7.3 million
Strategy to secure retail planning for new development
Witney Land, Oxfordshire
Littoral Park, Etoy, Switzerland
24
Highlights
Fund Performance
Financial Results
New Balance Sheet Co-Investment
Strategy and Outlook
Appendix

50
55
60
65
70
75
80
85
90
95
100
Jun-0
7
Dec-07
Jun-0
8
Dec-08
Jun-0
9
Dec-09
Jun-1
0
Dec-10
Jun-1
1
Dec-11
Jun-1
2
Dec-12
Cap
ital V
alue
Inde
x (B
ase
100
= Ju
ne 2
007)
Index of market capital value Trend
Projected series
UK commercial property market values
* Source: Invista REIM, IPD
Passed the point of inflection
Historical series (values fell by 44% between Jun 2007 and Jul 2009*)
Current direction of
value change

2626
Strategic PrioritiesUK & continental European business is well placed for growth
Focus on continued investment outperformance/proactive asset management
Capture positive investor sentiment with growth into open ended funds & listed trusts
Deploy third party capital and balance sheet into the opportunistic fund
International business expansion
Focus on returns and deployment of capital in the international fund
Growth of BOSS to gain scale
Growth of Global Securities Fund
Corporate development
Deployment of balance sheet capital into growth areas of the business - capital discipline
Develop capability to broaden access to distribution
Inorganic expansion possibilities
Platform well placed to take advantage of market opportunities

2727
Summary
Strong investment performance record
Strong retail distribution partners and client relationships
High operating margins
Positioning to take advantage of industry trends
History of fund innovation
Ability to exploit new opportunities in continental Europe & Asia
Proven ability to access real estate assets
Diversified mix of funds and clients
2828
Outlook
Market stabilisation - real estate markets have reached a point of inflection
Risks remain - to future performance with market sentiment over correcting
Growth sector - optimistic that investor demand and allocations for property related funds will grow over the medium to long term
Focus on developing and growing existing funds – introduce new investors capital
Moving into 2010 in strong position, with
Strong balance sheet cash of £73.7m
Strong investment performance
Platforms in Asia and Europe

29
Highlights
Fund Performance
Financial Results
New Balance Sheet Co-Investment
Strategy and Outlook
Appendix

30
Balance Sheet
Year to 31 December 2009 2009£millions
2008£millions
Investment Properties 121.5 122.0Investments in joint ventures 23.2 5.2Investments 19.5 11.6Other non current assets 3.2 3.9Total non current assets 167.4 142.7Trade and other receivables 4.5 6.5Cash 73.7 87.5Total Assets 245.6 236.7Current liabilities & other payables (13.8) (11.6)Debt (84.0) (85.4)Derivatives used for hedging (8.7) (14.5)
Net Assets 139.1 125.2

31
Fair Value Adjustments
2009 ResultsReconciliation of Reported Profit pre FVA & exceptional charge
Year to 31 December 2009 PBT PBTProfit and Loss Account Reported Castle IREIF IREOF Except'n Pre-FVA
£m £m £m £m £m £mIncomeRevenue 34.4 34.4Net interest income / (expense) -4.5 -4.5
ExpensesAdmin -17.7 -17.7Joint Venture gains and losses 1.5 -4.2 1.0 -1.7Net valuation losses from investments 0.1 0.5 0.6Exceptional charge -3.8 3.8 0
TOTAL PROFIT £10.0m 0.5 -4.2 1.0 3.8 £11.1m
Fair Value Adjustments & Exceptionals

32
Real estate behaves increasingly as a financial asset, with greater securitisation and innovative ways for real estate investment.
Institutional investors outsource their property teams to third party managers who develop critical mass and expertise.
Repricing: Magnitude & Timing Forecast
Source: JLL; IPD; DB Real Estate; DTZ; Note: Real estate market maturity reflects the transparency and liquidity of each market, as well as the share of real estate market that is “investable”
Limited “investment” market with most real estate development carried out through REOCs using bank finance.
Institutional investors (Pension Funds, Insurance Cos) build their exposure, often through in-house teams.
1. Pre-institutional 2. Institutional 4. Product Innovation
3. Outsourcing
Netherlands
Latin America Philippines
India
High
35% - 50%
Moderate 20% - 35%
Low
5% - 20%
UKSingapore
Australia
Korea Japan Canada
United StatesFirst Tier China Cities
Central & Eastern Europe
Hong Kong
Mexico
Pric
e D
ecre
ase
FranceIberiaBenelux
Germany
Strategy

3333
Progress since IPO - Recurring revenueObjective – to grow recurring revenue
Revenue was £20.1m* pa vs. 2009 at £34.4m
UK Capital values have fallen by 38% since Dec 2006 revenue has fallen by 5.5%
* Full year immediately preceding IPO
50
60
70
80
90
100
110
120
130
140
150
Dec-06
Mar-07
Jun-0
7
Sep-07
Dec-07
Mar-08
Jun-0
8
Sep-08
Dec-08
Mar-09
Jun-0
9
Sep-09
Dec-09
Cap
ital v
alue
inde
x (B
ase:
Dec
200
6 =
100)
£18m
£22m
£25m
£29m
£32m
£36m
£40m
£43m
£47m
£50m
£54m
Rec
urrin
g re
venu
e (£
m)
UK comercial property market value index (IPD) Invista Recurring Revenue
ALPHA
3434
Progress since IPO Performance fees
Objective – to increase the number of opportunities for performance fees
Five new funds since IPO with the ability to earn performance fees
2006 – Invista European Real Estate Trust listed trust launched with annual performance fee potential
2007 – launched Opportunity fund with performance fee on realisation
2008 – launched International fund with performance fee on realisation
2008 – Residential mandate with performance fee potential
2009 – BOSS fund acquisition with new investor and performance fee upon realisation
2006 & 2007 & 2008 – performance fees earned from listed trusts
Quote from 2006 Report & Accounts
“As time goes by, the number of funds which give Invista the opportunity to earn performance fees will increase giving rise to an enhanced probability of
performance fee based income each year”

3535
Progress since IPO Deployment of capital
Objective – Deployment of balance sheet into growth areas2007 -Committed co-investment opportunistic fund – new minimum annual fee revenue of £840,000
2008 - Committed co-investment Asian fund – new minimum annual fee revenue of £750,000
2008 - Acquisition of Invista Castle portfolio residential target growth area
2009 - BOSS fund acquisition with new investor and performance fee upon – new minimum annual fee revenue
2009 - Supported Invista European Real Estate Trust rights issue which helped grow recurring revenue
Opportunities to recycle2007 - Residential contract negotiated to retain management of the portfolio upon sale2008 - Original French (Celsius) portfolio of 22 properties transferred to fund with profit of £1m and revenue now of £1.3m Property Securities – 2009 over £2m (i.e. 20% of original sum) realised with gain of over £600,000
Challenges – Need for balance sheet processesCelsius residual written down to NIL = value lossCastle positioning has failed to seed a fund and balance sheet is to be used only for co-investment and seeding

3636
Progress since IPO Diversification
Objective – diversify by fund type and geography
2006 – Invista European Real Estate Trust listed trust IPO & European team established
2007 - Residential team established, fund of fund account won, new Opportunity fund
2008 - Paris office opened, invested in 8 European countries, international fund launched, securities team established
2009 - Platform acquired in Singapore and Hong Kong
2006 vs. 2009 fee income spread
At IPO 2006 – greater than 95% of management fees derived from UK Commercial funds
2009 - 23% of management fees from continental European funds
2009 - 2% of management fees from Asian funds
2009 - 7% of management fees from Residential asset management
Quote from 2007 report & accounts
“Invista continues to develop its business with property funds across different sectors, fund types and alternative geographical areas”

3737
-5.0%
-4.0%
-3.0%
-2.0%
-1.0%
0.0%
1.0%
Jan-8
7
Jul-8
7
Jan-8
8
Jul-8
8
Jan-8
9
Jul-8
9
Jan-9
0
Jul-9
0
Jan-9
1
Jul-9
1
Jan-9
2
Jul-9
2
Jan-9
3
Jul-9
3
Jan-9
4
Jul-9
4UK commercial property capital value movement in context
-6%
-5%
-4%
-3%
-2%
-1%
0%
1%
2%
3%
Sep-04
Mar-05
Sep-05
Mar-06
Sep-06
Mar-07
Sep-07
Mar-08
Sep-08
Mar-09
Sep-09
Mar-10
Sep-10
Mar-11
Sep-11
Mar-12
Mon
thly
cap
ital g
row
th
Late 1980s/early 1990s historical
2004/09 historical
2010/12 projection
Source: Invista REIM, IPD Monthly Index
3838
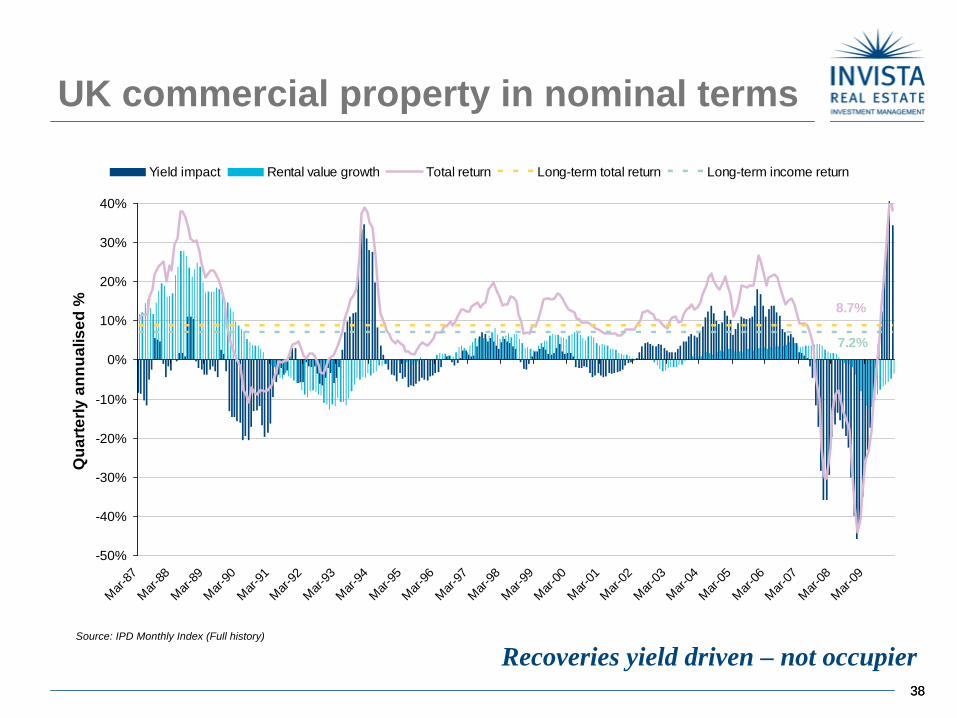
UK commercial property in nominal terms
Recoveries yield driven – not occupierSource: IPD Monthly Index (Full history)
8.7%
7.2%
-50%
-40%
-30%
-20%
-10%
0%
10%
20%
30%
40%
Mar-87
Mar-88
Mar-89
Mar-90
Mar-91
Mar-92
Mar-93
Mar-94
Mar-95
Mar-96
Mar-97
Mar-98
Mar-99
Mar-00
Mar-01
Mar-02
Mar-03
Mar-04
Mar-05
Mar-06
Mar-07
Mar-08
Mar-09
Qua
rterly
ann
ualis
ed %
Yield impact Rental value growth Total return Long-term total return Long-term income return
3939
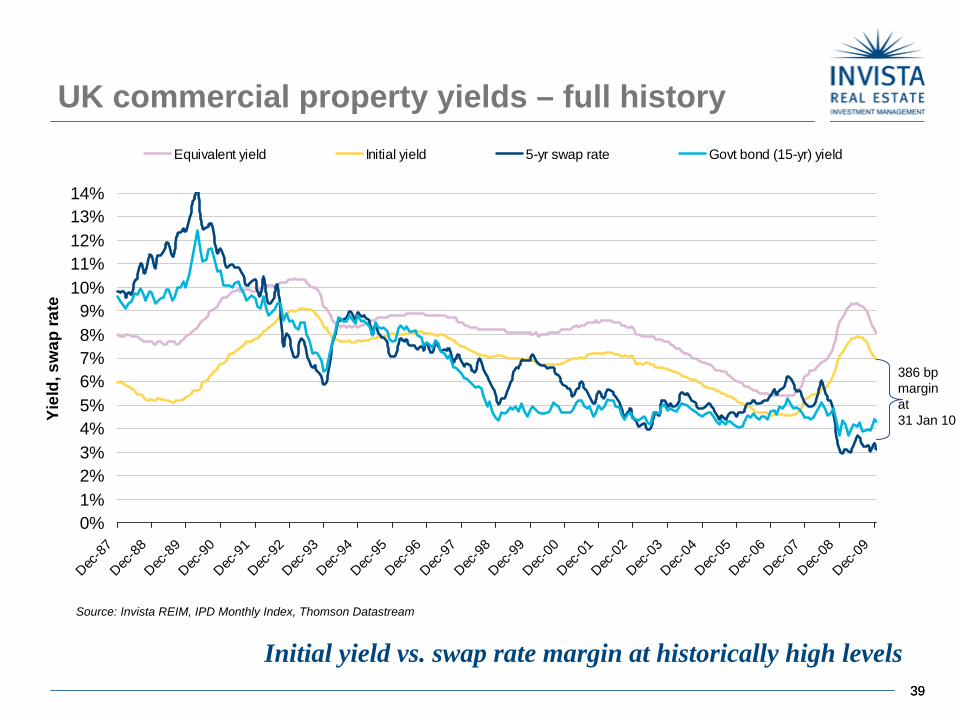
UK commercial property yields – full history
Source: Invista REIM, IPD Monthly Index, Thomson Datastream
0%1%2%3%4%5%6%7%8%9%
10%11%12%13%14%
Dec-87
Dec-88
Dec-89
Dec-90
Dec-91
Dec-92
Dec-93
Dec-94
Dec-95
Dec-96
Dec-97
Dec-98
Dec-99
Dec-00
Dec-01
Dec-02
Dec-03
Dec-04
Dec-05
Dec-06
Dec-07
Dec-08
Dec-09
Yiel
d, s
wap
rate
Equivalent yield Initial yield 5-yr swap rate Govt bond (15-yr) yield
386 bp margin at 31 Jan 10
Initial yield vs. swap rate margin at historically high levels

40
Important noticeWE WOULD ALSO POINT OUT:
Invista Real Estate Investment Management Holdings plc state that reasonable skill and care has been used in the preparation of this presentation and any forecasts expressed within it. Notwithstanding this warranty Invista shall not be liable for any loss of profit, business, revenues or any special indirect or consequential damage of any nature whatsoever or loss of anticipated saving or for any increased costs sustained by the client or his servants or agents in any way whether arising in any way directly or indirectly as a result of reliance on this model or of any error or defect in this presentation. This presentation and associated information is the property of Invista Real Estate Investment Management Holdings plc who reserve all intellectual property rights to its use and the components of the forecasts contained herein. It should not be copied or used for any other purpose or distributed to any other parties.All features in this pack are current at the time of publication but may be subject to change in the future.Unless otherwise stated, the source of information is Invista Real Estate Investment Management Holdings plc.No modifications or amendments to the presentation may be made without the prior permission of Invista Real Estate Investment Management Holdings plc.The document is to be used by the intended recipient(s) only and the document may not be forwarded to a third party without the prior consent of Invista Real Estate Investment Management Holdings plc.This document contains commercially sensitive information. In the event that disclosure of this document or the information contained therein is contemplated pursuant to the Freedom of Information Act 2000, please notify us.The data contained in this document is for information purposes only. It is correct to the best of our knowledge at the date of issue and may be subject to change. This document is not legally binding and no party shall have any right of action against Invista in relation to the accuracy or completeness of the information contained in it or any other written or oral information made available in connection with it.This presentation does not constitute an offer to invest in the securities of Invista Real Estate Investment Management Holdings plc.For the avoidance of doubt this document does not constitute a financial promotion as defined under the Financial Services and Markets Act 2000 (Financial Promotions) Order 2001, as amended.Invista Real Estate Investment Management Holdings plc. Registered in England and Wales. Registered number 05788425. Registered office Exchequer Court, 33 St. Mary Axe, London EC3A 8AA. Invista Real Estate Investment Management Limited is authorised and regulated by the Financial Services Authority. Registered in England and Wales. Registered number 04459443. Registered office Exchequer Court, 33 St. Mary Axe, London EC3A 8AA.


