Monatshefte f€ ur Chemie 133, 1497–1534 (2002) DOI 10.1007/s00706-002-0502-y Invited Review Multiple-Quantum Magic-Angle Spinning: High-Resolution Solid State NMR Spectroscopy of Half-Integer Quadrupolar Nuclei Amir Goldbourt 1 and Perunthiruthy K. Madhu 2;1 Department of Chemical Physics, Weizmann Institute of Science, Rehovot 76100, Israel 2 Department of Chemistry, University of Southampton, Southampton SO17 1BJ, United Kingdom Received April 16, 2002; accepted May 6, 2002 Published online September 19, 2002 # Springer-Verlag 2002 Summary. Experimental and theoretical aspects of the multiple-quantum magic-angle spinning experiment (MQMAS) are discussed in this review. The significance of this experiment, introduced by Frydman and Harwood, is in its ability to provide high-resolution NMR spectra of half-integer quadrupolar nuclei (I 3=2). This technique has proved to be useful in various systems ranging from inorganic materials to biological samples. This review addresses the development of various pulse schemes aimed at improving the signal-to-noise ratio and anisotropic lineshapes. Representative spec- tra are shown to underscore the importance and applications of the MQMAS experiment. Keywords. NMR spectroscopy; Solid state; Quadrupolar nuclei; MQMAS; Amplitude modulation. Introduction The internal spin interactions in solid state nuclear magnetic resonance (NMR) that chiefly govern the spectral response are quadrupolar (Q), dipole–dipole (DD), chem- ical shift anisotropy (CSA), and scalar coupling (J). These interactions are in general anisotropic in character. The quadrupolar interaction vanishes in the case of spin- 1 2 nuclei like 1 H and 13 C due to the internal spherical symmetry of the nuclear spin system. This is not the case for nuclei with spin quantum number I 1. These nuclei possess an electric quadrupolar moment (also called nuclear quadrupole moment) in addition to having a nuclear magnetic moment as in the case of spin- 1 2 nuclei. This nuclear quadrupole moment couples to the inhomogeneous Corresponding author. E-mail: [email protected]
Transcript
Monatshefte f€uur Chemie 133, 1497–1534 (2002)
DOI 10.1007/s00706-002-0502-y
Invited Review
Multiple-Quantum Magic-Angle Spinning:High-Resolution Solid State NMRSpectroscopy of Half-IntegerQuadrupolar Nuclei
Amir Goldbourt1 and Perunthiruthy K. Madhu2;�1 Department of Chemical Physics, Weizmann Institute of Science, Rehovot 76100, Israel2 Department of Chemistry, University of Southampton, Southampton SO17 1BJ,
United Kingdom
Received April 16, 2002; accepted May 6, 2002
Published online September 19, 2002 # Springer-Verlag 2002
Summary. Experimental and theoretical aspects of the multiple-quantum magic-angle spinning
experiment (MQMAS) are discussed in this review. The significance of this experiment, introduced
by Frydman and Harwood, is in its ability to provide high-resolution NMR spectra of half-integer
quadrupolar nuclei (I � 3=2). This technique has proved to be useful in various systems ranging from
inorganic materials to biological samples. This review addresses the development of various pulse
schemes aimed at improving the signal-to-noise ratio and anisotropic lineshapes. Representative spec-
tra are shown to underscore the importance and applications of the MQMAS experiment.
The internal spin interactions in solid state nuclear magnetic resonance (NMR) thatchiefly govern the spectral response are quadrupolar (Q), dipole–dipole (DD), chem-ical shift anisotropy (CSA), and scalar coupling (J). These interactions are ingeneral anisotropic in character. The quadrupolar interaction vanishes in the case ofspin-1
2nuclei like 1H and 13C due to the internal spherical symmetry of the nuclear
spin system. This is not the case for nuclei with spin quantum number I� 1. Thesenuclei possess an electric quadrupolar moment (also called nuclear quadrupolemoment) in addition to having a nuclear magnetic moment as in the case ofspin-1
2nuclei. This nuclear quadrupole moment couples to the inhomogeneous
internal electric field gradients (EFG) [1]. The interaction of the nuclear quadru-pole moment with a non-vanishing EFG at the nuclear site leads to a modificationof the Zeeman energy levels and dominates the appearance of an NMR spectrum.The nature of EFG depends on the local electronic environment and symmetryabout the nucleus. Hence, if the characteristics of the EFG can be determined fromNMR experiments, information about the chemistry of a molecule, and detailsabout the molecular or the crystalline environment can be ascertained.
Quadrupolar nuclei can be classified into those with integer spins (1, 3, etc.) andhalf-integer spins (3
2; 5
2, etc.). Some prominent nuclei that fall into the class of spin-
1 are deuterium (2H) and nitrogen (14N), spin-3 is boron (10B), spin-32
are sodium(23Na), rubidium (87Rb), and boron (11B), spin-5
2are oxygen (17O), aluminium
(27Al), and molybdenum (95Mo), spin-72
are cobalt (59Co), calcium (43Ca), andscandium (45Sc), and spin-9
2is niobium (93Nb). A survey of the periodic table
shows that around 70% of the elements are quadrupolar in nature.Several techniques are available to obtain a high-resolution spectrum of spin-1
2nuclei by decoupling experiments and systematically probing the anisotropy of theinteractions by recoupling experiments [2]. However, in samples containing quad-rupolar nuclei, unless there is a spherical charge distribution around the nucleus,which occurs only in a few cases, the quadrupolar interaction far exceeds DD,CSA, and J interactions. Typically, the quadrupolar interactions vary from a fewkHz to a few MHz leading up to 2000–3000 MHz in the case of 127I.
Due to their abundance, quadrupolar nuclei are dominant in several molecularsystems ranging from porous materials, ceramics and glasses, to superconductorsand biological systems such as nucleic acids and proteins. The practical applicationsof quadrupolar nuclei in several branches of science were discussed a long time agoby Pound [3]. Two factors have impeded the routine study of these materials. One isthe line broadening in a powder sample arising from the size of the quadrupolemoment that causes lack of resolution in currently available spectrometers andsecondly, the complexity in spin dynamics due to the presence of more than twoenergy levels. This renders development of pulse methodology a demanding task asagainst the scenario in spin-1
2. Utilising the established spin-1
2techniques does not
always provide the required result. For example, magic-angle-spinning (MAS) [4, 5]does not provide isotropic high-resolution spectra in quadrupolar systems and cross-polarisation (CP) to and from such nuclei are normally not efficient [6, 7]. Hence,although rich in information content (e.g. in 2H systems), and sometimes enablingan easier interpretation of the spectrum, high-resolution quadrupolar split spectra inthe solid state are difficult to acquire with conventional spin-1
2means.
In order to overcome the resolution problems in quadrupolar systems, mechan-ical ways were first devised. This resulted in two ingenious attempts, namely,double rotation, DOR [8] and dynamic angle spinning, DAS [9, 10], both involvingmanipulation of the spatial part of the quadrupolar Hamiltonian. Recent attemptsfocussed on the manipulation of the spin part of the Hamiltonian and this paved theway to the introduction of MQMAS [11, 12] by Frydman and Harwood, and lately,satellite transition MAS (STMAS) by Gan [13]. The introduction of MQMAS ledto a spurt of activities that saw a large number of applications and improvements ofthis scheme. The popularity of this technique as against its forerunners can beunderstood from the simplicity of the experimental protocol with no need for
1498 A. Goldbourt and P. K. Madhu
any extra hardware and demanding spectrometer performance efficiency. Develop-ment in this area has also shed more light on the complicated spin dynamics ofquadrupolar nuclei.
In this review, we deal mainly with MQMAS, and refer to [14–16] for detailson DOR, DAS, and STMAS. Many of the basic properties of the quadrupolarHamiltonian have been dealt with in a succinct manner by Vega [17] and we borrowon them extensively here giving the appropriate equations wherever necessary.
The outline of this review is as follows: Introduction to the quadrupolarHamiltonian under MAS, the technique of MQMAS and interpretation of MQMASspectra, possible solutions to the problem of sensitivity, some heteronuclear tech-niques, and finally a few representative applications and future perspectives.
Quadrupolar Spins – Theory and Methods
The quadrupolar Hamiltonian, HQ, besides being stronger than the other internalspin Hamiltonians, is often stronger than typical radiofrequency (rf) fieldsemployed in NMR. For an analysis of quadrupolar spectra, the first two terms inthe expansion of HQ are considered: the first-order, Hð1Þ
Q , and second-order, Hð2ÞQ ,
following standard perturbation theory.Figure 1 shows the energy levels of spins I ¼ 3
2and 1 in a Zeeman field �0 in the
absence and presence of a quadrupolar interaction �Q. Also shown is a schematic ofthe resultant quadrupolar split NMR spectra for the case of a single crystal. Thequadrupolar interaction shifts the eigenvalues of the Zeeman Hamiltonian, resultingin an NMR spectrum that is split into 2I peaks. In a powdered sample, lines arebroadened by the orientation dependence of the first- and second-order quadrupolarinteractions.
The first-order quadrupolar interaction affects only the satellite transitionsm$m� 1, where jmj takes the values 1
2; 3
2; 5
2; . Thus, in the case of integer
spins, the observable satellite transitions are broadened extensively (up to severalMHz), making their detection cumbersome (an exception is deuterium, 2H, whichpossesses a relatively small quadrupolar coupling constant (� 200 kHz), hencebeing a commonly probed nucleus). The broadening is a result of the significantshift the energy levels experience due to Hð1Þ
Q . However, the symmetric transitionsm$ �m are affected only by the relatively smaller second-order quadrupolar inter-action. Hence, the observable single-quantum transition of half-integer quadrupolarspins, � 1
2$ 1
2, is broadened only by Hð2Þ
Q . This transition, called the central transi-tion, thus provides a relatively narrow powder lineshape, which retains all informa-tion about the nuclear quadrupole coupling constant, NQCC, and the asymmetry ofthe quadrupolar interaction tensor, �.
NQCC characterises the size of the quadrupolar interaction experienced by aparticular nucleus and is given in frequency units by e2qQ=h, denoted by �. Here,eq is the magnitude of the EFG and eQ is the nuclear electric quadrupole momentin units of the electronic charge e [18]. The quadrupolar frequency �Q in units ofHz or !Q in units of rad s� 1, is given by [1],
�Q ¼ !Q
2�¼ 3�
2Ið2I � 1Þ : ð1Þ
Solid State NMR Spectroscopy 1499
Hence, for a spin-32, for example, �Q ¼ 1
2�, and for a spin-5
2, �Q ¼ 3
20�. The NQCC
vanishes for those quadrupolar nuclei positioned at a cubic site due to the inherent
symmetry. The second-order quadrupolar interactions scale as�2
Q
�0. Hence, a higher
resolution is obtained at higher magnetic fields for the same quadrupolar strength.
The MAS Hamiltonian
The general form of the quadrupolar Hamiltonian in the notation of irreducibletensor operators [1, 17] is given in Eq. (2) as
H ¼ �Q
3
X2
k¼�2
ð�1ÞkT ð2Þ
q V ð2Þ�q ð2Þ
with
Tð2Þ0 ¼
ffiffiffi1
6
r½3I2
z � IðI þ 1Þ�
Tð2Þ� 1 ¼ IzI � ¼ I � Iz
Tð2Þ� 2 ¼ I2
� : ð3Þ
Fig. 1. Energy levels of a spin-32
and a spin-1 quadrupolar system in the presence of Zeeman field,
first-order quadrupolar and second-order quadrupolar interactions. The allowed transitions, �m¼� 1, are indicated. The stick spectra at the bottom are the quadrupolar split spectra for a single
crystal. �Q is the first-order quadrupolar frequency, �ð2ÞCQ and �
ð2ÞSQ are the second-order quadrupolar
frequencies of central and satellite transitions respectively, !0¼ 2��0 is the Larmor frequency, and
�!Q¼ 2���Q is the quadrupolar splitting
1500 A. Goldbourt and P. K. Madhu
The elements Vð2Þq are obtained from the components of the quadrupolar tensor
ð2Þm
in their principal axis system (PAS) by a transformation to the laboratory frameusing the Euler angles , �, �:
V ðkÞq ¼
Xk
q0¼�k
ð2Þq0 D
ð2Þq0qð; �; �Þ: ð4Þ
The terms DðkÞq0qð; �; �Þ are the Wigner matrix elements [19], and
ð2Þ0 ¼
ffiffiffi3
2
r
ð2Þ� 1 ¼ 0
ð2Þ� 2 ¼ � 1
2�: ð5Þ
In the laboratory frame the quadrupolar interaction can be treated as a perturbationto the Zeeman field, and can be expressed as a sum of first-order and second-orderterms, as follows:
HQ ¼ Hð1ÞQ þ H
ð2ÞQ
Hð1ÞQ ¼ �Q
3Tð2Þ0 V
ð2Þ0 ¼
h�0Q6
½3I2z � IðI þ 1Þ�
Hð2ÞQ ¼
h�2Q
9�0
�2Iz
�2I2
z � IðI þ 1Þ þ 1
4
�Vð2Þ�1 V
ð2Þ1
þ Iz
�I2z � IðI þ 1Þ þ 1
2
�Vð2Þ�2 V
ð2Þ2
�ð6Þ
where �0Q is given by
�0Q ¼ �Q
�3cos2� � 1
2þ �
2sin2� cos 2
: ð7Þ
Under MAS conditions, the PAS of the quadrupolar spin has to be first trans-formed into the rotor frame with the proper Wigner matrix D(,�, �). The angles(,�, �) describe the location of the rotor axis in the PAS of the quadrupolar tensor.Only then the transformation into the LAB frame is performed using D(!rt, MA, 0),!rt being the phase angle experienced by the rotor while spinning at the magicangle, MA (54.7�) with respect to the static magnetic field. Thus Eq. (6) describesthe MAS average Hamiltonian for the quadrupolar nucleus with a new definition ofthe terms V
ð2Þq :
V ð2Þq ¼
X2
m¼�2
Dð2Þmqð!rt; MA; 0Þ
X2
n¼�2
Dð2Þnmð; �; �Þð2Þn : ð8Þ
The terms Vð2Þq V
ð2Þ�q in Eq. (6) contain products of Wigner matrix elements.
These may be expanded using the Clebsch-Gordon coefficients [19]. Hence, inthe fast spinning limit, the spatial part of the quadrupolar second-order Hamiltonianbecomes a sum of Legendre polynomials with ranks 0, 2, and 4 (the terms with
Solid State NMR Spectroscopy 1501
ranks 1 and 3 vanish due to symmetry). After such an expansion, a straightforwardcalculation gives a simple expression for the symmetric transitions,
�m;�m ¼X
l¼0;2;4
�ðlÞQ ð; �; �ÞClðI;mÞPlðcos MAÞ: ð9Þ
In Eq. (9) Pl(cos ) is the Legendre polynomial of rank l, and Cl(I, m) are zero-,second- and fourth-rank (spin) coefficients depending on the spin quantum numberI and order 2m of the transition. Their explicit forms may be found in Ref. [11] andare reproduced here:
Equation (9) is the basis of the MQMAS experiment as will be discussed lateron. Additional details about the functional forms of lineshapes and shifts of quad-rupolar nuclei can be found in Ref. [20, 21].
Magic-Angle Spinning Spectra
As outlined above, the central transition of non-integer quadrupolar spins is notaffected by the first-order quadrupolar interaction. Hence, it is amenable to NMRspectroscopy using standard NMR techniques. Nevertheless, the existence of sev-eral energy levels complicates the excitation profile of a quadrupolar spin. Whilefor a spin-1
2system the nutation frequency �nut equals the rf field strength
�1(¼ �B1), for a quadrupolar spin I; �nut ¼I þ 1
2
��1. This equation holds goods as
long as the excitation is selective, that is �1� �Q. A hard-pulse excitation (�1� �Q)gives a nutation frequency that is similar to a spin-1
2, �nut¼ �1. In the intermediate
regime, a complex behaviour is expected and the nutation frequency of the centraltransition depends on �Q. Thus, in order to obtain a quantitative MAS spectrum, asmall angle pulse
�1t � �
6
�has to be used [22, 23]. This ensures that in a sample
of multiple sites with varying values of �Q, each site is uniformally excited. Figure2 illustrates this aspect for a spin-3
2nucleus.
Theoretical second-order quadrupolar broadened line shapes are given in Fig. 3for both static and MAS cases for a few values of �. Although MAS achievesconsiderable line narrowing of the central transition (3 to 4 times with respect tothe line width in a static case) it is still beyond what can be called a high-resolutionquadrupolar spectrum.
The reason why MAS cannot narrow the second-order broadening can be seendirectly from Eq. (9). The isotropic quadrupolar shift (l¼ 0) is given explicitly inEq. (11) as
�ð2Þiso ¼ 1
30
�2Q
�0
�IðI þ 1Þ � 3
4
��1 þ 1
3�2
: ð11Þ
1502 A. Goldbourt and P. K. Madhu
Fig. 2. The single-quantum signal intensity (normal MAS spectral intensity with a single pulse for
excitation) plotted in arbitrary units as a function of the flip angle of the excitation pulse. The curves
are calculated for different values of the ratio of the 23Na quadrupolar frequency, �Q, to the rf field
strength, �1¼ 100.0 kHz, as indicated against each curve. The MAS rate was 10.0 kHz and the 23Na
Larmor frequency was 91.25 MHz at a magnetic field of 8.1 T. This figure illustrates that the
excitation of a powder sample is non-uniform, unless a small flip angle pulse is used
Fig. 3. Simulated second-order quadrupolar broadened central transition lineshapes of half-integer
quadrupolar spins for both static and MAS conditions. The frequency scale is in units of A, given by
A ¼ 19
�IðI þ 1Þ � 3
4
�2Q
�0. Note that A is a universal parameter and, hence, the lineshapes do not
depend on I, but the widths do
Solid State NMR Spectroscopy 1503
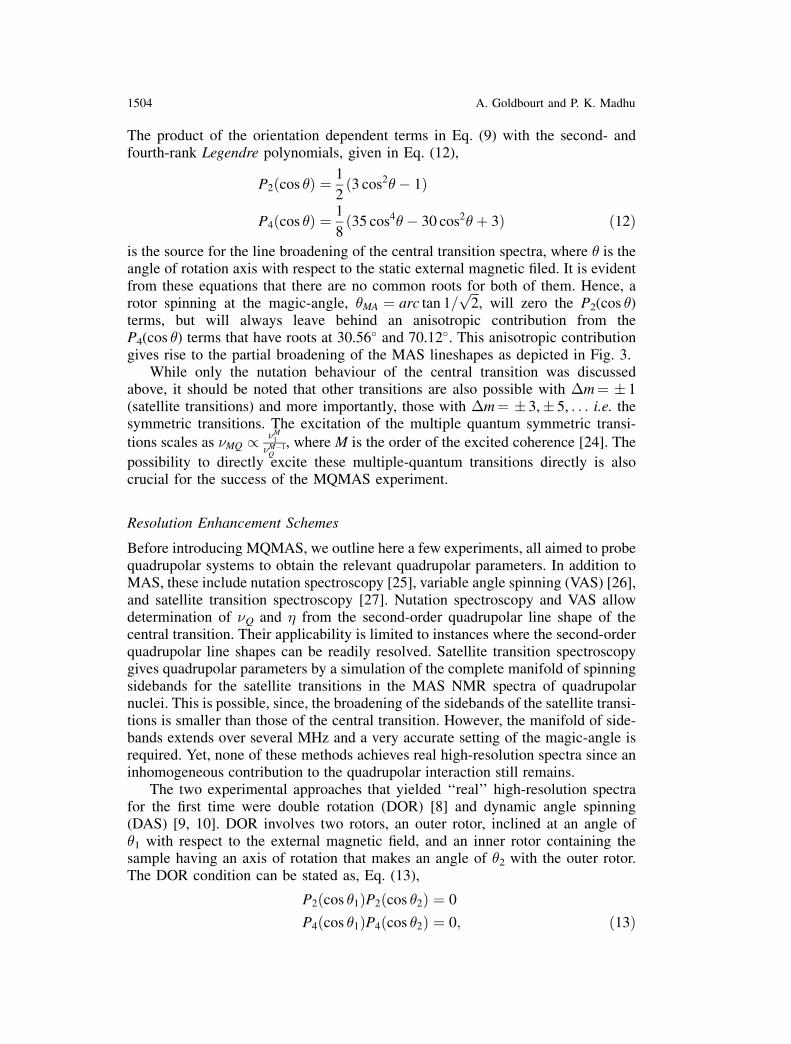
The product of the orientation dependent terms in Eq. (9) with the second- andfourth-rank Legendre polynomials, given in Eq. (12),
P2ðcos Þ ¼ 1
2ð3 cos2 � 1Þ
P4ðcos Þ ¼ 1
8ð35 cos4 � 30 cos2 þ 3Þ ð12Þ
is the source for the line broadening of the central transition spectra, where is theangle of rotation axis with respect to the static external magnetic filed. It is evidentfrom these equations that there are no common roots for both of them. Hence, arotor spinning at the magic-angle, MA ¼ arc tan 1=
ffiffiffi2
p, will zero the P2(cos )
terms, but will always leave behind an anisotropic contribution from theP4(cos ) terms that have roots at 30.56� and 70.12�. This anisotropic contributiongives rise to the partial broadening of the MAS lineshapes as depicted in Fig. 3.
While only the nutation behaviour of the central transition was discussedabove, it should be noted that other transitions are also possible with �m¼ � 1(satellite transitions) and more importantly, those with �m¼ � 3,� 5, . . . i.e. thesymmetric transitions. The excitation of the multiple quantum symmetric transi-
tions scales as �MQ / �M1
�M�1Q
, where M is the order of the excited coherence [24]. The
possibility to directly excite these multiple-quantum transitions directly is alsocrucial for the success of the MQMAS experiment.
Resolution Enhancement Schemes
Before introducing MQMAS, we outline here a few experiments, all aimed to probequadrupolar systems to obtain the relevant quadrupolar parameters. In addition toMAS, these include nutation spectroscopy [25], variable angle spinning (VAS) [26],and satellite transition spectroscopy [27]. Nutation spectroscopy and VAS allowdetermination of �Q and � from the second-order quadrupolar line shape of thecentral transition. Their applicability is limited to instances where the second-orderquadrupolar line shapes can be readily resolved. Satellite transition spectroscopygives quadrupolar parameters by a simulation of the complete manifold of spinningsidebands for the satellite transitions in the MAS NMR spectra of quadrupolarnuclei. This is possible, since, the broadening of the sidebands of the satellite transi-tions is smaller than those of the central transition. However, the manifold of side-bands extends over several MHz and a very accurate setting of the magic-angle isrequired. Yet, none of these methods achieves real high-resolution spectra since aninhomogeneous contribution to the quadrupolar interaction still remains.
The two experimental approaches that yielded ‘‘real’’ high-resolution spectrafor the first time were double rotation (DOR) [8] and dynamic angle spinning(DAS) [9, 10]. DOR involves two rotors, an outer rotor, inclined at an angle of 1 with respect to the external magnetic field, and an inner rotor containing thesample having an axis of rotation that makes an angle of 2 with the outer rotor.The DOR condition can be stated as, Eq. (13),
P2ðcos 1ÞP2ðcos 2Þ ¼ 0
P4ðcos 1ÞP4ðcos 2Þ ¼ 0; ð13Þ
1504 A. Goldbourt and P. K. Madhu
with their solutions, Eq. (14), being either
f 1; 2g ¼ f54:73�; 30:56�g or
f 1; 2g ¼ f54:73�; 70:12�g: ð14ÞThe DAS scheme makes use of only one rotor, but the orientation of the rotor
axis with respect to the external magnetic field toggles between two angles for twoequal periods of time. It is a two-dimensional (2D) experiment in which the rotor isspun for a time t1 at an angle 1, then the magnetisation is stored along the z-axiswhile the spinner angle is hopped (� 30 ms), and finally coherence is transferredback to the central transition with rotor spinning at an angle 2. The two rotor axisangles are chosen in such a way that the conditions, Eq. (15),
P2ðcos 1Þ þ P2ðcos 2Þ ¼ 0
P4ðcos 1Þ þ P4ðcos 2Þ ¼ 0 ð15Þare satisfied. A simple DAS solution is { 1, 2}¼ {37.38�, 79.19�}.
Both DOR and DAS are technically very demanding and are limited by severalfactors. In the DAS experiment the T1 relaxation time of the quadrupolar nuclei hasto be larger than the hopping duration of the rotor. Spin exchange mediated bydipolar interaction can occur during the relatively long hopping time and an extrabroadening might appear from large chemical shift anisotropies, since they are notcompletely averaged out. The DOR experiment is limited by the relatively slowspinning rates available thus producing a complex manifold of sidebands.
By manipulating the spin part of the Hamiltonian during MAS, Frydman andHarwood showed that a high-resolution NMR spectrum can be obtained by cor-relating multiple and single quantum coherences [11]. The technique was namedmultiple-quantum magic-angle spinning, MQMAS, and was introduced in 1995.Recently, using similar ideas, another method based on spin averaging was pro-posed by Gan called satellite transition MAS (STMAS) [13, 28]. In this experimentthe single-quantum satellite transitions rather than the multiple-quantum transi-tions are correlated with the central transition. The main limitations of this tech-nique seem to be the requirement for a very accurate setting of the magic angle(down to 0.1%) and the need for synchronised t1 acquisition, which limits theavailable spectral widths. These issues are currently being investigated.
The rest of this review deals with MQMAS and its development. The ease in itsimplementation compared with DOR and DAS can be gauged from the numerouspublications and applications that have resulted ever since its inception.
MQMAS-Principle and Practical Implementation
MQMAS is a 2D solid state MAS NMR experiment. It results in a high-resolutionspectrum along the indirect dimension, correlated with its corresponding MASspectrum in the detection dimension. This is achieved by simultaneously manip-ulating spin and spatial parts of the quadrupolar Hamiltonian. MAS takes the roleof spatial averaging and removes the chemical shift anisotropy, CSA, the hetero-nuclear dipolar interactions, and the second rank elements of the second-orderquadrupolar interaction. Radiofrequency pulses are used to manipulate the spin
Solid State NMR Spectroscopy 1505
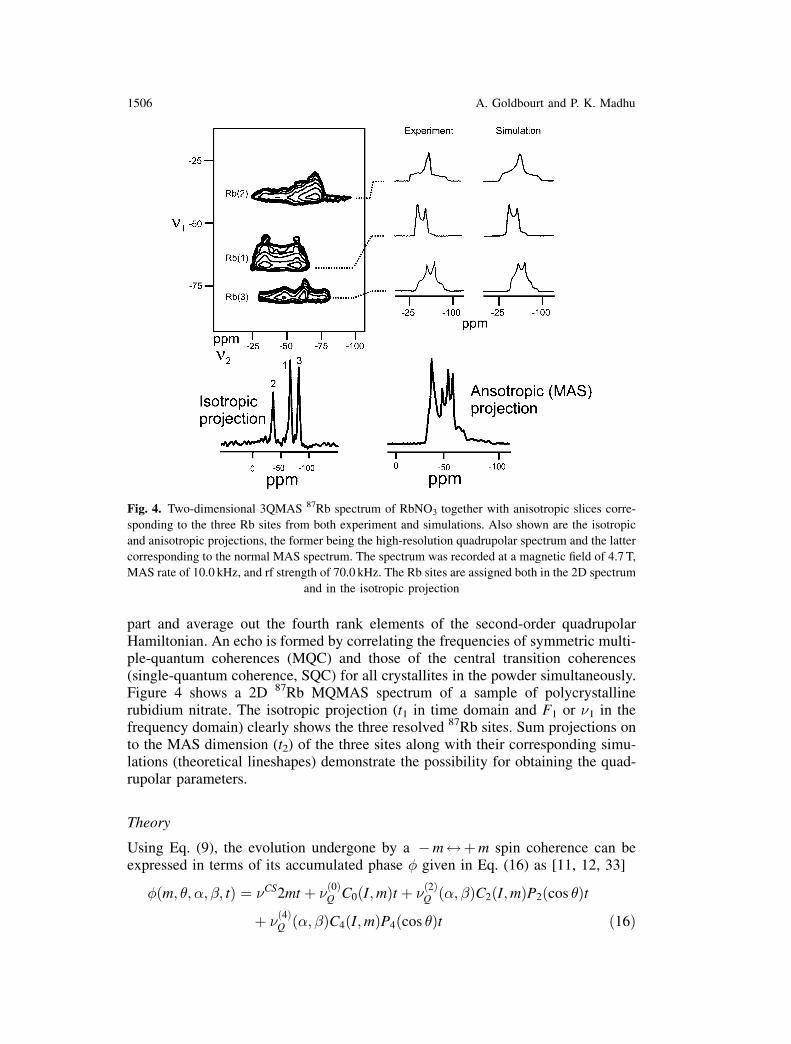
part and average out the fourth rank elements of the second-order quadrupolarHamiltonian. An echo is formed by correlating the frequencies of symmetric multi-ple-quantum coherences (MQC) and those of the central transition coherences(single-quantum coherence, SQC) for all crystallites in the powder simultaneously.Figure 4 shows a 2D 87Rb MQMAS spectrum of a sample of polycrystallinerubidium nitrate. The isotropic projection (t1 in time domain and F1 or �1 in thefrequency domain) clearly shows the three resolved 87Rb sites. Sum projections onto the MAS dimension (t2) of the three sites along with their corresponding simu-lations (theoretical lineshapes) demonstrate the possibility for obtaining the quad-rupolar parameters.
Theory
Using Eq. (9), the evolution undergone by a �m$þm spin coherence can beexpressed in terms of its accumulated phase � given in Eq. (16) as [11, 12, 33]
�ðm; ; ; �; tÞ ¼ �CS2mt þ �ð0ÞQ C0ðI;mÞt þ �
ð2ÞQ ð; �ÞC2ðI;mÞP2ðcos Þt
þ �ð4ÞQ ð; �ÞC4ðI;mÞP4ðcos Þt ð16Þ
Fig. 4. Two-dimensional 3QMAS 87Rb spectrum of RbNO3 together with anisotropic slices corre-
sponding to the three Rb sites from both experiment and simulations. Also shown are the isotropic
and anisotropic projections, the former being the high-resolution quadrupolar spectrum and the latter
corresponding to the normal MAS spectrum. The spectrum was recorded at a magnetic field of 4.7 T,
MAS rate of 10.0 kHz, and rf strength of 70.0 kHz. The Rb sites are assigned both in the 2D spectrum
and in the isotropic projection
1506 A. Goldbourt and P. K. Madhu
where is the angle of rotation axis with respect to the static magnetic field, B0. Inthe above �CS is associated with isotropic chemical shift. The C coefficients thatdepend on the spin quantum number I and the order of excited coherence, M¼ 2m,are given in Eq. (10). In a 2D experiment, spin coherences evolve during times t1and t2. In order to obtain an isotropic echo signal, the anisotropic part of the phase� should be set to zero. This can be done with the constraints in Eq. (17):
�ð2ÞQ ð; �ÞC2ðI;m1ÞP2ðcos 1Þt1 þ �
ð2ÞQ ð; �ÞC2ðI;m2ÞP2ðcos 2Þt2 ¼ 0
�ð4ÞQ ð; �ÞC4ðI;m1ÞP4 cosð 1Þt1 þ �
ð4ÞQ ð; �ÞC4ðI;m2ÞP4 cosð 2Þt2 ¼ 0: ð17Þ
By setting m1;2 ¼ 12
(a single-quantum experiment) and the echo position to t2¼ t1all terms but those of Eq. (15) are eliminated, and the conditions for the DASexperiment are met. An alternative way to accomplish the same task is by manip-ulating the spin coherences, so that, by setting 1¼ 2¼ MA and leaving m1,2 asparameters, the above constraints reduce to Eq. (18) given by,
C4ðI;m1Þt1 þ C4ðI;m2Þt2 ¼ 0: ð18ÞUnder these conditions, all 2nd rank anisotropies are removed, and since the ex-pression above is independent of �
ð4ÞQ , all crystallites are refocused at a time t2 ¼
� C4ðI;m1ÞC4ðI;m2Þ t1 giving rise to a quadrupolar echo. This is the idea behind the MQMAS
experiment.In a MQMAS experiment, any order of MQC 2mi can be used keeping in mind
that the detection must be performed at the central transition. Thus, the experimentis performed by exciting MQC using a rf pulse and then converting them into single-quantum observable coherences using another rf pulse. However, recently Jerschowet al. showed that for a half-integer spin with I> 3
2, higher order coherences can be
correlated within each other, e.g. five-quantum (5Q) and triple-quantum (3Q) coher-ences, as long as an additional detection pulse is employed at the end of the sequence[34]. The MQ echo is picked up using a proper phase cycle and thus only the desiredcoherence pathway is selected. While experiments correlating MQ and SQ coher-ences are named 3QMAS, 5QMAS etc., the ones correlating various MQC’s arenamed MQ=NQ MAS, where M and N are any two higher coherences. In principle,the highest resolution is attained by choosing the highest possible coherences [34,35]. Thus, for a spin 5
2, 3QMAS, 5QMAS and 5Q=3QMAS can all be performed with
5Q=3QMAS having the highest resolution.Routinely, MQMAS is performed by correlating MQC with SQC giving rise to
a purely isotropic second-order quadrupolar echo at a time
t2 ¼����C4ðI;m1Þ=C4
�I;
1
2
����t1: ð19Þ
Since the ratioC4ðI;m1ÞC4ðI;12Þ
can be of any sign, additional spin manipulation has to beperformed in order to observe the echo, as will be discussed in the next section. Asignal arising from a positive value of the ratio is called an echo and that arising froma negative value is called an antiecho. Table 1 gives the value of k ¼
��C4ðI;m1Þ=C4
I; 1
2
��� for various I and m values. Extension of this table to the MQ=NQ experi-ment is straightforward using the Cl(I, m) coefficients in Eq. (10).
Solid State NMR Spectroscopy 1507
Pulse Schemes
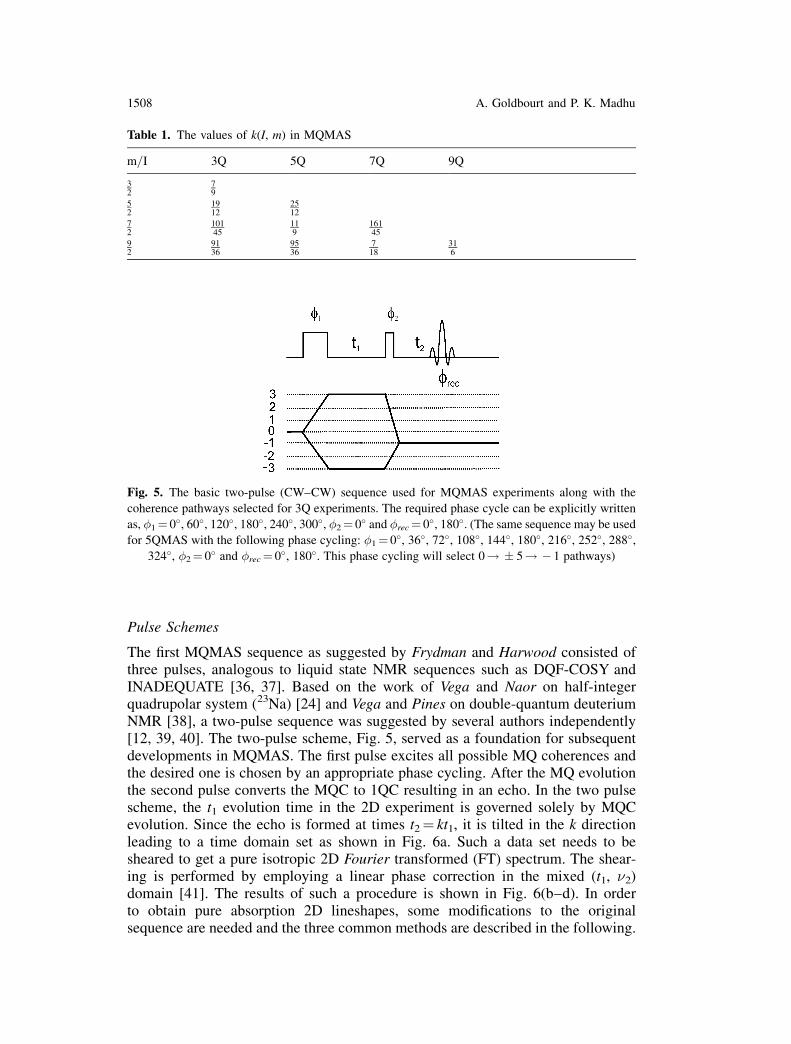
The first MQMAS sequence as suggested by Frydman and Harwood consisted ofthree pulses, analogous to liquid state NMR sequences such as DQF-COSY andINADEQUATE [36, 37]. Based on the work of Vega and Naor on half-integerquadrupolar system (23Na) [24] and Vega and Pines on double-quantum deuteriumNMR [38], a two-pulse sequence was suggested by several authors independently[12, 39, 40]. The two-pulse scheme, Fig. 5, served as a foundation for subsequentdevelopments in MQMAS. The first pulse excites all possible MQ coherences andthe desired one is chosen by an appropriate phase cycling. After the MQ evolutionthe second pulse converts the MQC to 1QC resulting in an echo. In the two pulsescheme, the t1 evolution time in the 2D experiment is governed solely by MQCevolution. Since the echo is formed at times t2¼ kt1, it is tilted in the k directionleading to a time domain set as shown in Fig. 6a. Such a data set needs to besheared to get a pure isotropic 2D Fourier transformed (FT) spectrum. The shear-ing is performed by employing a linear phase correction in the mixed (t1, �2)domain [41]. The results of such a procedure is shown in Fig. 6(b–d). In orderto obtain pure absorption 2D lineshapes, some modifications to the originalsequence are needed and the three common methods are described in the following.
Table 1. The values of k(I, m) in MQMAS
m=I 3Q 5Q 7Q 9Q
32
79
52
1912
2512
72
10145
119
16145
92
9136
9536
718
316
Fig. 5. The basic two-pulse (CW–CW) sequence used for MQMAS experiments along with the
coherence pathways selected for 3Q experiments. The required phase cycle can be explicitly written
as, �1¼ 0�, 60�, 120�, 180�, 240�, 300�, �2¼ 0� and �rec¼ 0�, 180�. (The same sequence may be used
for 5QMAS with the following phase cycling: �1¼ 0�, 36�, 72�, 108�, 144�, 180�, 216�, 252�, 288�,
324�, �2¼ 0� and �rec¼ 0�, 180�. This phase cycling will select 0! � 5! � 1 pathways)
1508 A. Goldbourt and P. K. Madhu
z-Filter Experiments
The z-filter was adapted to MQMAS from liquid state NMR [36] by Amoureux et al.[42]. This three pulse scheme (Fig. 7a) consists of a MQ excitation pulse, a mixingpulse that transfers �m coherences into 0Q coherence, thereby introducing a z-filter and finally a soft 90� pulse that creates observable magnetisation (m¼ � 1coherence). The transfer of (þm)! (� 1) and (�m)! (� 1) does not occur withthe same efficiency in the two-pulse experiment, Fig. 5. The middle pulse in thez-filter experiment forces an equal transfer by performing �m! 0 coherencetransfer. This scheme ensures a pure cosine modulation along the indirect dimen-sion, t1. Phase modulated data set in t1 can be obtained by using hypercomplexacquisition or by employing TPPI=STATES [36]. The frequency spectrum is ob-tained by Fourier transforming along the direct dimension, F2, performing a shear-ing transformation with a phase correction of eik!2t1 of all points and again Fouriertransforming along F1, as demonstrated in Fig. 6.
Fig. 6. Schematics showing the 2D time domain, shearing, and frequency domain representation of
MQMAS spectrum: (a) 3Q! 1Q correlation experiment obtained using the pulse sequence shown in
Fig. 5. Note that the free induction decay, fid, has a slope of 79
(Table 1). The shearing transformation is
illustrated in (b) and (c) which is done via a first-order t1-dependent phase correction along the F2 axis
(�2). (d) Isotropic! anisotropic correlation spectrum obtained after a Fourier and shearing transfor-
mation of the time-domain data set in (a). The spectrum corresponds to 23Na 3QMAS of sodium
oxalate, Na2C2O4. The prime in (d) on �1 denotes the result after the shearing transformation.
(Reproduced with permission from Ref. [12], Copyright (1995), American Chemical Society)
Solid State NMR Spectroscopy 1509
Phase-Modulated Split-t1 Whole-Echo
Whole-echo acquisition [43], adapted to MQMAS by Massiot et al. [40], is analternative way to obtain pure phase spectra. It relies on the fact that an echo of thefid can be induced by a � pulse without significant signal loss. Fourier transformationof such an echo signal leads to pure absorptive spectrum with a vanishing disper-sive part, as long as relaxation effects are negligible.
The split-t1 method, introduced by Brown et al. [44], gets rid of the need to do ashearing transformation by combining the MQ and 1Q (or NQ) evolution periods inthe t1 time domain. A combination with the whole-echo acquisition method resultsin a pure phase 2D MQMAS spectra, with ridges lying parallel to the F2 frequencyaxis [45]. Figure 7b shows split-t1 whole-echo pulse sequence for spin-3
2where
3QC and 1QC evolve for times 916
t1 and 716
t1 respectively. These values correspondto the general required delays of 1
1þkfor MQ evolution and k
1þkfor 1Q evolution.
The pulse sequence consists of three pulses: an excitation pulse, a conversionpulse and a soft � pulse to shift the echo. There are two different versions of thisexperiment, depending on the sign of C4ðI;m1Þ=C4
I; 1
2
�(see Fig. 13). Since the
echo always appears at a constant time during t2, �echo, this time should be chosen
Fig. 7. MQMAS pulse sequences using (a) z-filter and (b) split-t1 whole-echo scheme (this form of
split-t1 needs to be used for 3QMAS in spin-32) providing pure phase absorptive spectra with (b)
avoiding the need for a shearing transformation. The phase cycle is mentioned in the figure. floor(x)
returns the largest integer � x. In general, split-t1 experiments have delays 11þk
t1 and k1þk
t1 which for
spin-32
become 916
t1 and 716
t1
1510 A. Goldbourt and P. K. Madhu
such that the whole echo appears in the fid. Signal processing includes: (1) puttingthe position of the echo signals at the middle of the fid’s and zero filling symmet-rically; a Gaussian weighted window can be applied to the time domain data ifdesired, (2) redefining the time origin to be zero at the centre of the echo (this issimilar to swapping the two halves of the spectrum), and (3) complex 2D FT(including apodisation, phasing etc.). An alternative approach includes (1) FTalong t1, (2) inversion of alternating points, and (3) FT along t2.
Hypercomplex Experiments
Another method to obtain pure absorption line shapes is to collect a set of hyper-complex data. Two experiments are performed consecutively with a phase shift of90�
Mon the first pulse, M being the order of coherence evolving during t1. The
resulting two signals, Sx and Sy, can be combined to yield echo and anti-echosignals by the following linear combinations:
S0eðt1; t2Þ ¼ Sx � iSy
S0aðt1; t2Þ ¼ Sx þ iSy: ð20ÞA shearing transformation can now be applied after FT along F2 (if needed):
The FT will create two sets of 2D signals which can be combined according to
Sðw1;w2Þ ¼ Seðw1;w2Þ þ Sað�w1;w2Þ ð22Þthus giving rise to pure absorption mode lineshapes.
Additional Pulse Scheme Combinations
In addition to the three schemes mentioned above, several other pulse combinationsmay be considered. A z-filter sequence can be combined with split-t1 experiments byusing the following coherence pathway: � 3! � 1! 0! � 1. This makes use of4 rf pulses, the first two hard rf pulses for excitation of MQC and their conversion to� 1 coherences. The latter two are soft �=2 pulses. Another option is to perform asplit-t1 experiment without shifting the echo. In this case a hypercomplex acquisi-tion should be performed, without the need for a shearing transformation. Some-times such combinations can be advantageous, since sensitivity enhancementschemes, which will be discussed later, can be successfully applied to them.
Data Analysis – Extraction of NMR Parameters
After applying the Fourier transformation, the axes have to be properly labelledand referenced according to the experimental conditions. The labelling schemecorresponds to either the split-t1 frequency domain data, or to a sheared MQMASspectrum. This labelling is not straightforward since the evolution in the F1 domainis governed by isotropic chemical and second-order quadrupolar shifts.
There are several different ways in the literature to label the axes [46, 47]. Weadopt here a method in which the apparent Larmor frequency does not scale with M
Solid State NMR Spectroscopy 1511
(the order of MQ coherence evolving during t1), but its sign can change according tothe specific experiment. A negative Larmor frequency is used (i.e. the isotropic axisis inverted before any referencing is performed) if M<2I, and positive otherwise.Referencing the spectrum along the F1 dimension should take into account theevolution of the isotropic chemical shift (�cs) under MQ and 1Q coherences. Thereference frequency in F1 is defined therefore as k�M
1þk�, � being the shift in ppm with
respect to a reference sample. This expression is the sum of �M1þk
�, chemical shiftresulting from the evolution of MQC’s, and k
1þk�, chemical shift resulting from the
evolution of single-quantum coherence. The expressions for �1 (frequency shift inppm along F1) and �2 (centre of gravity of peaks along F2) depend on �cs and on thesecond order quadrupole shift (�Q) and are given by Eq. (23) and Eq. (24) as [48],
�1 ¼ �p þ k
1 þ k�cs þ
AðI; pÞ � kAðI;�1Þ1 þ k
�Q ð23Þ
�2 ¼ �iso þ AðI;�1Þ�Q ð24Þwhere
AðI; pÞ ¼ p
30ð4IðI þ 1Þ � 3p2Þ: ð25Þ
The values of k are given in Table 1 and p¼ �M for a coherence order M¼ 2I,p¼M for M<2I. The centre of gravity is generally defined as in Eq. (24)
�2 ¼Ð�2Ið�2Þd�2ÐIð�2Þd�2
: ð26Þ
When the lineshapes are clearly resolved in the 2D spectra, each site can beprojected separately by taking the sum of relevant slices. The quadrupolar param-eters can be either simulated or extracted by moment analysis [49] or direct cal-culation [50]. When distributions of quadrupolar interactions and chemical shiftsexist, lineshapes cannot always be properly defined. This situation is encounteredmany times in substances like glasses, ceramics and mesoporous materials. In suchcases, the extraction of the NQCC and � is cumbersome, but it is still possible to
obtain the value of the second order quadrupole effectSOQE � �
The values of �cs and SOQE can be extracted by inverting Eqs. (23) and (24),resulting in Eq. (27) and Eq. (28),
�cs ¼ � ð1 þ kÞAðI;�1ÞpAðI;�1Þ þ AðI; pÞ �1 þ
AðI; pÞ þ kAðI;�1ÞpAðI;�1Þ þ AðI; pÞ �2 ð27Þ
�Q ¼ 1 þ k
pAðI;�1Þ þ AðI; pÞ �1 þp � k
pAðI;�1Þ þ AðI; pÞ �2; ð28Þ
with
SOQE ¼ !0=2�
103
ffiffiffiffiffi�Q
p� 4Ið2I � 1Þ
3: ð29Þ
An alternative approach for the extraction of the NMR parameters is by per-forming MQMAS at two different magnetic fields, and comparing only the valuesof �1 along the F1 frequency axis.
1512 A. Goldbourt and P. K. Madhu
Experimental Aspects
Optimisation of MQMAS pulse sequence starts with a proper calibration of the rfpower, so that selective pulses (selective 90� and 180�) could be employed accu-rately for z-filter or shifted echo experiments. This is done with a reference sample,usually a solution, where �Q is averaged to zero.
The MQMAS excitation and conversion pulses are then adjusted by monitoringthe MQ echo intensity in a one-dimensional (1D) experiment, employing a verysmall delay, between the excitation and conversion pulses, of say, 5 ms. Initially, theexcitation pulse is fixed to some value and the duration of the conversion pulse isvaried. Then, the length of the excitation pulse is varied for the optimised conver-sion pulse length. The optimisation protocol can be usually accomplished on asample of Na2SO4 or Na2ClO3 for spin-3
2systems and aluminium acetyl acetonate
for spin-52
systems, but it may be noted here that the optimum values are �Q
dependent, Fig. 8.Starting values for the pulses can be obtained from numerical simulations as
illustrated in Fig. 8. Figure 8a shows the maximum 3QC intensity that could beobtained for various quadrupolar strengths as a function of the pulse duration withthe rf field fixed at 95 kHz. In b, the efficiency of the 3Q! 1Q conversion pulse is
Fig. 8. (a) Plot of the 3Q intensity as a function of the duration of the pulse (excitation pulse in a
MQMAS scheme) for various values of �Q and (b) plot of the SQ intensity as a function of the
duration of the pulse (conversion pulse in a MQMAS scheme) for �1¼ 95 kHz, and MAS rate of
8 kHz. Three hundred powder orientations were considered for the simulation
Solid State NMR Spectroscopy 1513
indicated for each of the values of NQCC calculated in a. It may be emphasisedhere that the overall excitation efficiencies achieved by the optimised pulses are62% and 33% for NQCC of 3.0 and 4.5 MHz with the amount of the 1QC even-tually obtained being around 40% and 18%. The values are relative to the theoret-ical MAS single quantum signal and they already point to the main weakness ofthis method, which is the lack of an appreciable sensitivity.
In order to perform a successful and useful MQMAS experiment three stepsneed to be taken. They are (1) choosing a proper pulse scheme for pure phasespectroscopy, (2) selecting a suitable enhancement scheme to improve the sensi-tivity of the excitation and conversion pulses, and (3) optimisation of all the pulses.A pulse scheme should be chosen by taking into account several factors, some ofwhich were already mentioned previously (relaxation times and spin quantumnumber) but also factors like the gyromagnetic ratio and the hardware capabilities.Some of these factors are crucial when choosing the right sensitivity enhancementscheme and will be elaborated on extensively in the next section.
Sensitivity Enhancement in MQMAS
In Fig. 8 it was shown that the excitation and conversion processes are inherentlyinefficient using hard pulses. The excitation efficiency of 3QC, for example, drops
as�2
1
�2Q
. Some of the most important applications of MQMAS are envisaged in sys-
tems in which low-� nuclei like 17O, which is of low natural abundance also, canbe probed routinely. It has also been established that a correlation of the highestpossible MQC to 1QC achieves the best resolution, and if possible, MQC to NQC.However, excitation of 5QC, 7QC, 9QC in higher spin systems is even moredifficult compared with the 3QC excitation. Figure 9 shows the amount of 3QCgenerated for a typical quadrupolar system for rf values of 50 kHz (a) and 100 kHz(b) as a function of the pulse duration for several MAS rates [51]. Although, high rfvalues (and high MAS for better lineshapes) are attractive with higher values of theNQCC, the required rf fields and MAS rates are out of reach in most of the spectro-meters. Signal-to-noise can be gained by synchronous detection [52] or by acquir-ing multiple echoes during the free precession of the observable magnetisation(QCPMG) [53], but the gains achieved are not appreciable. The following sectionsdemonstrate how a manipulation of the rf pulses can lead to significant signal gainwhich could of course be combined with the schemes mentioned above. Thenoticeable effect on the lineshapes is also discussed.
Enhancement Schemes for Spin-32
The first attempt to enhance 3Q excitation efficiency was by Marinelli et al. [54]making use of composite pulses. They showed that an application of two hardpulses with a 90� phase difference, and nutation angles of and 2 for the firstand second pulse respectively, resulted in an enhancement of the order of 30% inspin-3
2systems. The flip angle needs to be optimised according to the rf power and
quadrupolar strength. For sodium oxalate using�Q
�1¼ 17, for instance, the best 3QC
was obtained with ��=2. When large chemical shift anisotropies exist, such as
1514 A. Goldbourt and P. K. Madhu
the case for a spin-7=2 59Co complex, a x�xx composite pulse proved to be moreefficient, but flip angles can no longer be predicted in a simple manner.
A significant step towards enhancing the MQMAS signal was made with theintroduction of the RIACT-II (rotation induced adiabatic coherence transfer) scheme[55] (Fig. 10a). Here the excitation pulse consists of a selective 90� pulse creatingcentral transition coherences, immediately followed by a long hard CW pulse, 1=4of a rotor period (� r) in length. For the conversion pulse again a pulse of duration� r=4 is used. Another advantage of this scheme is its ability to perform equally wellon a relatively large range of quadrupolar constants, thus making MQMAS morequantitative. However, the main drawback of the experiment is the distortion of thelineshapes along the MAS dimension [56]. It has been shown that moving the posi-tion of the rf offset has a substantial effect on the pulse efficiency. Hence, it can beused to selectively excite certain sites according to their quadrupolar strengths,while minimising the intensity of others [57], and thus may be used as a spectralediting technique.
The RIACT approach was soon followed by an experimental scheme usingmodulated rf fields for conversion of MQC to SQC. Two variants were introduced,namely, double frequency sweeps, DFS, Fig. 10(b) [58] and fast amplitude modula-tion, FAM, Fig. 10c [59, 60]. The resulting signal enhancement was approximately3-fold relative to the original two-pulse (CW–CW) scheme (Fig. 5 or Fig. 7b, thesplit-t1 version) depending on the quadrupolar strength. While DFS uses continuousmodulation of the rf frequency, FAM utilises a discreet single amplitude modulationfrequency. Their major advantage over the RIACT-II scheme (having approximatelythe same signal enhancement) is the improved lineshapes along the MAS dimension,thereby allowing more accurate determination of NQCC and �. Both DFS and FAMare �Q dependent.
Fig. 9. Plot of the 3Q intensity (normalised with respect to single-quantum MAS signal) as a
function of the duration of the pulse (excitation pulse in a MQMAS scheme) for (a) �1¼ 50 kHz
and (b) �1¼ 100 kHz for various MAS rates, �r indicated on the top of each curve. The following
quadrupolar parameters, �Q¼ 2.50 MHz and �¼ 0.70, were assumed for the simulations except for
the dotted curve for which �Q¼ 5.0 MHz and �¼ 0.70
Solid State NMR Spectroscopy 1515
The DFS pulses require an rf field strength of the order of 100–150 kHz. Di-verging rf frequency sweeps are employed covering the whole �Q range. With noprevious knowledge of the quadrupolar strengths, a sweep of over � 2.5 MHzshould be used, as this is normally the practical bandwidth of the probe. The sweepshould start at a slightly off-resonance carrier frequency, starting with zero ampli-tude or half-Gaussian shape at the beginning of the pulse. Finally, one needs tooptimise the sweep length. When the sweep covers the whole range of �Q values,an optimum length is approximately a quarter of a rotor period. These are startingvalues which can be further optimised [58, 61, 62].
FAM pulses, lately referred to as FAM-I, employ standard rf fields (�1¼ 70–110 kHz), and are designed from a repeating unit of four segments: a pulse with apositive phase, a delay, a pulse with a negative phase and a final delay ½�x; �; ��xx; � �n, nis the number of repetitions). Optimisation is done by setting � ¼ 1 ms, and n¼ 4.The values of n, � are varied until maximum echo intensity is obtained in the 1Dexperiment. Variation of the basic FAM block can be made by adding several unitswith different n and � numbers (extended FAM-I [63]), or by changing the lengths ofthe pulses with respect to the delays. The first option can be viewed as the discreetand simplified version of the DFS pulses. A major outcome of the introduction of
Fig. 10. Sensitivity enhanced MQMAS pulse schemes for spin-32
FAM-I sequences. The coherence pathways (dotted pathway for a, d, e, and f) selected for each of the
schemes are the same as indicated in the figure; n1 and n2 are the number of times the FAM-I loop is
repeated, with n2 often equalling a full rotor period. Both �2
and � pulses are soft pulses
1516 A. Goldbourt and P. K. Madhu
these modulated rf schemes was the gaining of a better understanding of the MQC toSQC conversion process and of the characteristics of echo formation [60, 63]. Thislatter understanding resulted in the SL-FAM scheme, Fig. 10d (hereafter referred toas RIACT-FAM), obtained by combining RIACT excitation and extended FAM-Iconversion, resulting in high sensitivity, relatively undistorted lineshapes andreduced dependence on NQCC.
With FAM-I it is possible to redistribute the population of the spin energylevels. This is called RAPT (rotor assisted population transfer) [64]. It has beenshown that an enhancement by a factor of 1.5–2 is achieved in a MAS experimenton spin-3
2, when satellite redistribution is achieved before the excitation pulse, as
shown in Fig. 11. The RAPT experiment comprised of the basic FAM-I scheme,½�x; �; ��xx; � �n, where the value of n is set to a large number such that the modulationlasts for a whole rotor period. The pulses are normally set to 1 ms and delays to theshortest time possible subjected to the hardware capabilities (e.g. transmitter phasestabilisation). However, shortening the delays is not very crucial for the perfor-mance of this scheme. The theoretical enhancement is I þ 1
2if a complete satellite
Fig. 11. (a) Pulse sequence used for the FAM-MAS experiment (RAPT scheme) employing FAM
pulses lasting for a full rotor period followed by a soft �2
pulse. (b) Population arrangement for a spin-32
system at thermal equilibrium (left) and after satellite redistribution with FAM pulses (right, one
possible arrangement involving saturation of satellite transitions). (c) A single-pulse MAS spectrum
and the corresponding FAM-MAS spectrum of a sample of RbNO3. An enhancement by a factor of
� 1.8 was obtained with a spinning rate of 10.0 kHz and a FAM block given by [1 ms (pulse, x phase),
1ms (delay), 1 ms (pulse, �xx phase), 1ms (delay)], repeated 25 times lasting 100ms. The external
magnetic field was 4.1 T
Solid State NMR Spectroscopy 1517
saturation is achieved. The schematic in Fig. 11 corresponds to complete satellitesaturation.
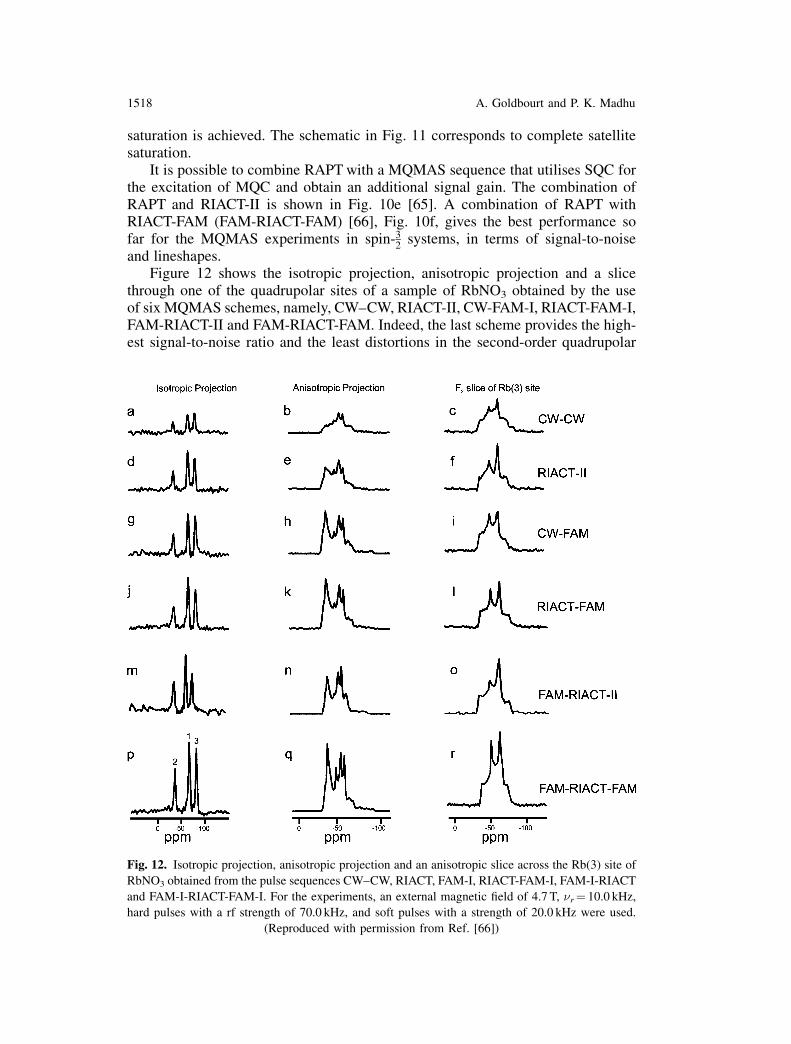
It is possible to combine RAPT with a MQMAS sequence that utilises SQC forthe excitation of MQC and obtain an additional signal gain. The combination ofRAPT and RIACT-II is shown in Fig. 10e [65]. A combination of RAPT withRIACT-FAM (FAM-RIACT-FAM) [66], Fig. 10f, gives the best performance sofar for the MQMAS experiments in spin-3
2systems, in terms of signal-to-noise
and lineshapes.Figure 12 shows the isotropic projection, anisotropic projection and a slice
through one of the quadrupolar sites of a sample of RbNO3 obtained by the useof six MQMAS schemes, namely, CW–CW, RIACT-II, CW-FAM-I, RIACT-FAM-I,FAM-RIACT-II and FAM-RIACT-FAM. Indeed, the last scheme provides the high-est signal-to-noise ratio and the least distortions in the second-order quadrupolar
Fig. 12. Isotropic projection, anisotropic projection and an anisotropic slice across the Rb(3) site of
RbNO3 obtained from the pulse sequences CW–CW, RIACT, FAM-I, RIACT-FAM-I, FAM-I-RIACT
and FAM-I-RIACT-FAM-I. For the experiments, an external magnetic field of 4.7 T, �r¼ 10.0 kHz,
hard pulses with a rf strength of 70.0 kHz, and soft pulses with a strength of 20.0 kHz were used.
(Reproduced with permission from Ref. [66])
1518 A. Goldbourt and P. K. Madhu
lineshapes. (No comparison was made with DFS scheme as a conversion pulse,however it is expected to perform at least equally as well as the FAM-I scheme).
FAM-I, DFS and RIACT use an adiabatic anti-crossing mechanism in order toefficiently convert the 3QC to the 1QC, th details of which are extensively dealtwith in Ref. [60, 62].
A different approach to obtain sensitivity enhancement was suggested byVosegaard et al. [67]. Two long pulses with a duration of 2–3 rotor periods wereapplied to the quadrupolar spins, employing low rf fields and high spinning rates.Rotary resonance conditions were found, in which an excitation minimum occurswhen 2!1¼ n!r, (n¼ 0,1, . . .) and in between those minima points, enhanced signalswere obtained. For the conversion pulse a maxima was found at !1¼ n!r. Thisscheme called FASTER-MQMAS experiment achieves a 3-fold enhancement ofthe MQMAS spectra (like FAM-I, although at a lower rf power), but providesdistorted lineshapes, as the excitation and conversion pulses select only a specificportion of the crystallites. A spectrum of RbClO4 was obtained with a spinning rateof 30 kHz, an excitation pulse of duration � ¼ 75 ms (2.25 rotor periods) and rfpower �1¼ 37 kHz and a conversion pulse with � ¼ 65 ms (1.95 rotor periods)and �1¼ 30 kHz. The selective echo � pulse was employed at �1¼ 30 kHz.
Enhancement Schemes for Spin-52
Spin-52
systems are more complex than spin-32
systems in the sense that additionalenergy levels are involved during the process of excitation and conversion. Thisfact complicates the rather simple mechanisms that explained the enhancementphenomena in spins-3
2. Thus, enhancement schemes for spin-5
2based on the same
design as spin-32
do not perform equally well.Sensitivity enhancement of 3QMAS and 5QMAS spectra in spin-5
2was
obtained by employing FAM-I pulses for conversion of MQC to SQC [68]. Iugaet al. [61] have shown that a very accurate lineshape of a �¼ 15.3 MHz 27Al site ofthe mineral andalusite could be obtained using DFS pulses from a 3QMAS spec-trum. They also obtained some signal enhancement in the 5QMAS spectra of9Al2O3 2B2O3 using DFS pulses, but with strong lineshape distortions [61]. Con-siderable shortening of the FAM-I pulse, up to a composite pulse scheme (FAM-II,Fig. 13a) [69] has been shown to enhance the 3QMAS signal of AlPO4-5. Thisvery short scheme makes FAM-II independent of the spinning rate. The same ideawas exploited for the signal enhancement in 5QMAS experiments (Fig. 13b),where FAM-II was incorporated in the excitation pulse and either FAM-I orFAM-II used for conversion of 5QC to SQC [48]. A subtle point to be noted inFig. 13a and b is the difference in the way split-t1 scheme is executed for 3QMASand 5QMAS in spin-5
2systems. In general, for a correlation of the highest MQC
with 1QC, a scheme like Fig. 13b needs to be chosen, while for a correlation of allthe lower coherences with the SQC, a scheme like Fig. 13a is the desired one. FAMpulse scheme can not be efficiently incorporated into the original version of the z-filter scheme, but rather in a modified version in which the z-filter follows a split-t1procedure.
FAM-II is essentially composed of several pulses with alternating phases. Theoverall duration of a FAM-II pulse is short, up to � 5 ms. A starting unit for 3Q! 1Q
Solid State NMR Spectroscopy 1519
conversion can be 2, �11, 0.5ms. (A bar means a negative phase, numbers correspondto pulse durations). Addition or subtraction of segments, as well as length variationsshould be performed according to spectrometer capabilities, since transmitter phaseglitches introduce pulse distortions.
In a 5QMAS experiment, a short ½x�xx�n modulation (FAM-II) is applied followinga hard excitation pulse with optimised values of n and pulse durations. The hardexcitation pulse creates 3QC from the equilibrium population and FAM-II convertsthe 3QC to 5QC. For conversion (5QC-SQC), a two-part FAM-I pulse or a two-partFAM-II pulse can be used. Vosegaard et al. suggested, for the first and second partsof a FAM-1 pulse, values of 0.4 and 0.85 ms and n of 6 and 4 [68]. A FAM-II pulse forconversion may be optimised from a series of pulses of the initial form 2; 1:5;1; 0:5; 1:5; �11.
Without loss of generality, it may be stated that FAM-I pulses are preferred forconversion of the highest MQC to 1QC, as this process is always adiabatic [60].For all other MQC! 1QC, FAM-II pulses are preferred.
Although none of the enhancement schemes have been reported on higher spinsystems (except for one example on cobalt, spin-7
2[54]), it is reasonable to believe
Fig. 13. (a) FAM-II split-t1 whole-echo pulse sequence used for sensitivity enhancement in the
3QMAS of spin-52
systems. The acquisition starts after a delay of 1931
t1 (where the arrow points to).
(b) CFF (CW-FAM-FAM) split-t1 whole-echo pulse sequence used for the 5QMAS of spin-52
systems
with FAM-II kind of approach employed for enhancing both excitation and conversion efficiency
1520 A. Goldbourt and P. K. Madhu
that a gain in signal-to-noise could be obtained by using one or several of the abovementioned schemes.
We conclude this section by giving the explicit phase cycle values, Table 2, forsplit-t1 shifted-echo 3QMAS (Fig. 7b, 10, 13a) and 5QMAS (Fig. 13b, 13c)sequences.
Heteronuclear Experiments Involving MQMAS
With MQMAS as a high-resolution solid state NMR tool, one may design hetero-nuclear experiments which lead to connectivity information, distance measurementsand additional spectral editing techniques. Spin-locking of half-integer quadrupolarspins is hard to achieve. However, when the Hartmann-Hahn condition, !S,nut¼!I,rf � n!r (n being an integer), is met, instances can be found in which cross-polar-isation (CP) becomes possible to some extent [6, 7]. Several schemes have beenproposed that combine CP with MQMAS. Initially it was suggested to cross-polarise19F to 27Al [70] or 1H to 27Al [71] employing a very low rf field on the 27Al channel,�1S¼ 5 kHz, and to detect the z-filtered 3QMAS spectra of the 27Al nucleus. TheseCP-MQMAS experiments gave very poor signal-to-noise ratio. While a normal3QMAS experiment took appromimately 30 minutes to collect, a 27Al{1H}CP ver-sion had a poor signal intensity even after 16 hrs. Nevertheless, connectivity infor-mation could be obtained, thus providing spectral editing possibilities.
The efficiency of these experiments was improved by two different approaches.The first one uses again single-quantum cross-polarisation, combines the CP stepwith an inverse split-t1 MQMAS experiment, which could incorporate FAM pulsesto gain even more signal-to-noise [72]. The second one employs cross-polarisationdirectly to the triple-quantum transitions [73]. It was also demonstrated that anymultiple-quantum transition can in principle be cross-polarised under suitable con-ditions [74, 75].
The cross-polarisation process was utilised to perform a MQMAS=HETCOR
experiment [76], in which 23Na polarisation was transferred to a 31P nucleus after
Table 2. The phase table for 3Q- and 5QMAS split-t1 whole-echo sequences
performing a split-t1 MQMAS experiment with amplitude modulated data set. InFig. 14 an example of the pulse sequence and the corresponding spectrum is given.The advantage in transferring 23Na magnetisation to 31P in the sample of Na3P3O9
and not vice versa stems from the relatively short T1 of the 23Na (3 s) comparedwith that of 31P (600 s).
The rotational echo double resonance (REDOR) experiment [77] probes thedistance between two spin-1
2nuclei. It is possible to probe the distance to a quad-
rupolar nucleus by performing REAPDOR [78]. However, in this experiment, thequadrupolar spin is not directly detected. By applying REDOR decay pulses duringSQ evolution (MQ-t2-REDOR) [79] or during MQ evolution (MQ-t1-REDOR) [80]of a MQMAS experiment, distances can be probed between a quadrupolar nucleusand a spin-1
2nucleus, while detecting the quadrupolar spin. Application of the
REDOR pulses during 3QC evolution, for instance, enhances the dipolar interac-tion by a factor of 3, thus enhancing the sensitivity of the experiment. Figure 15demonstrates the applicability of the experiment on a sample of AlPO4-CHA. The
Fig. 14. (a) Pulse sequence, coherence transfer pathways and phase cycle table for MQMAS=
HETCOR experiment. To obtain 2D pure-absorption line shapes both þ 3 and � 3 pathways are
retained. The 96 step phase cycle is such that both CYCLOPS [96] and spin-temperature alternation
[97] are incorporated. The phase of �3 needs to be shifted by 90� to include STATES procedure.
(b) 23Na–31P MQMAS-HETCOR spectrum of Na3P2O9. The external magnetic field corresponded to
a proton frequency of 500 MHz, the two pulses in (a) were 16 ms long corresponding to a 3� rotation
on the central transition of 23Na, CP contact time was 10 ms and �r¼ 5 kHz. Thirty five complex t1increments were collected each consisting of 960 transients with a recycle delay of 3 s. (Reproduced
with permission from Ref. [76])
1522 A. Goldbourt and P. K. Madhu
pulse sequence for (a) MQ-t2-REDOR and (b) MQ-t1-REDOR are shown, with a fitof distances in (c).
More recent attempts have been made in investigating residual dipolar couplingsbetween quadrupolar nuclei [81], studying the cross-terms between quadrupolar andother interactions [82], elucidating relative orientations among quadrupolar nuclei[83] all of which are ultimately expected to yield more structural information.
Fig. 15 (continued)
Solid State NMR Spectroscopy 1523
Common Applications
MQMAS has made study of various quadrupolar systems feasible in a routine way.Here, we outline a few representative examples of such investigations along with thetype of information that may be extracted from MQMAS, possibly in conjunctionwith other experiments as well. The applications and observations are selected in arandom order. The range of such studies is expected to increase with the advent ofhigher magnetic fields and by the use of sensitivity enhanced MQMAS schemes.
Fig. 15. (a) Pulse sequence used for 3Q-t1-REDOR experiment. The phase cycle employed is as
A hypercomplex data set was collected by acquiring a complementary set of 96 fid’s with �1¼ 30�; t1increments were rotor-synchronised.
(c) Experimentally measured and simulated REDOR curves are shown for Al1, Al2 and Al3 sites in
AlPO4-CHA obtained from 3Q-t1-REDOR and 3Q-t2-REDOR schemes. Analysis of the curves
yielded the following distances: rAl3�F ¼ 4:1ð � 0:1Þ and rAl2�F ¼ 4:7ð � 0:1Þ �A. (Reproduced with
permission from Ref. [79], Coypright (1998), American Chemical Society and [80])
1524 A. Goldbourt and P. K. Madhu
High Resolution 17O NMR of Organic Solids
An important role for MQMAS is envisaged in the study of 17O 3QMAS and5QMAS experiments. This particular nucleus is expected to play a role in biomo-lecular structure determination with its high chemical shift dispersion. Wu [84] wasthe first to demonstrate the feasibility of such an experiment on some organicsubstances, [17O2]-D-alanine, potassium hydrogen [17O4] dibenzoate, [17O4]-D,L-glutamic acid-HCl and [2, 4-17O2] uracil. The 3QMAS spectrum of the glutamicacid is shown in Fig. 16. It is noted that substantial resolution can be achieved inthese compounds with labelling of about 15–50% and moderate magnetic field of11.75 T. Rotor synchronised t1 increments were found to improve the signal-to-noise ratio. Besides providing information regarding isotropic chemical shift andquadrupolar parameters, 17O MQ-MAS spectra are expected to shed light onseveral aspects of organic and biological systems, such as, H-bonding, side chainconformation, and base pairing in nucleic acids. One of the challenges in this field
Fig. 16. (a) Molecular strucuture and 17O positions marked of L-glutamic acid HCL (b) 17O
3QMAS spectrum of (a) with 28 rotor-synchronised t1 increments. (Reproduced with permission
from Ref. [84], Copyringht (2001), American Chemical Society)
Solid State NMR Spectroscopy 1525
lies in the synthesis of 17O-enriched biological molecules together with the need todevelop better sensitivity enhanced MQMAS schemes.
27Al MQMAS: Study of Porous Materials
Zeolites play a big role in catalytic applications due to their stability and activitycombined with a high selectivity. They are basically a unique class of porous solidaluminosilicates. 27Al MAS NMR has been used in the past for a detailed study ofaluminium coordination in zeolites [23, 85, 86]. However, the resulting spectraprovide information that is normally restricted to aluminum coordination. Thus,resolving sites with similar environments is rarely achieved experimentally. 27AlMQMAS, however, provides good resolution for the various 27Al sites therebyallowing a near complete characterisation of such materials. When these materialsare amorphous, details about the type of distribution become available. Propertieslike site specific dealumination [87] and positions and properties of acidic sites
Fig. 17. (a) Projection of the MAZ zeolite along the c-axis, black circles are T atoms and light circles
are the oxygen atoms. Tetrahedral framework aluminium sites are assigned to the Al atoms incorpo-
rated in the T1 and T2 crystallographic sites. (b) 27Al 3QMAS spectrum of the MAZ zeolite sample
with the horizontal axis corresponding to the F2 dimension and the vertical axis corresponding to the
F1 dimension. The anisotropic slices corresponding to S1 and S2 are shown in (c) in the first row. Note
the deviation of these lineshape from Lorentzian (d, first row) as assumed in the earlier studies. Also
shown in (c) are the 1D 27Al MAS spectrum of the MAZ zeolite (third row) and fitted spectrum
(second row) using the slices S1 and S2 obtained from the 3QMAS spectrum. Also shown in (d) are the
fitted spectrum (second row) using two Lorentzian shaped lines shown in the first row. A better fit may
be found in (c) by virtue of the availability of true lineshapes due to resolution enhancement enabled
by MQMAS spectrum. (Reproduced with permission from Ref. [90], Copyright (1999), American
Chemical Society)
1526 A. Goldbourt and P. K. Madhu
[88, 89] can be obtained unambiguously. Wouters et al. [90] demonstrated howMQMAS can give improved information about site populations. 27Al MAS NMRstudies have been used to arrive at the ratio of AlT1
AlT2 (corresponding to the twocrystallographic sites, T1 and T2, Fig. 17a) in the mazzite zeolite. Slices along theMAS dimension of a 3QMAS spectrum (Fig. 17b) were used to deconvolute the 1DMAS spectrum (Fig. 17c), instead of the traditional Lorentzian=Gaussian line-shapes (Fig. 17d). The site population was shown to be completely different thanprevious reports (1.75 instead of 0.86) with a much better fit. It may be noted that,in general, site population estimates can be misleading in NMR experiments sincethe lineshapes and the positions of the lines are field dependent.
11B MQMAS and MAS of Glasses
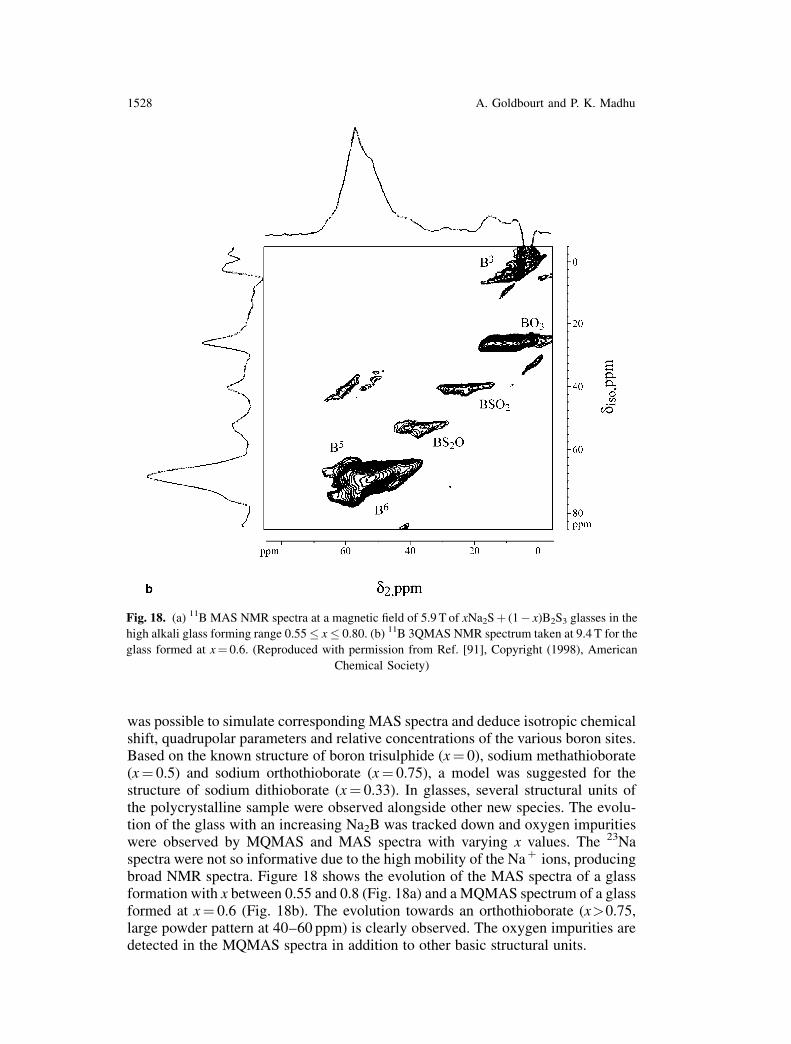
11B MAS and MQMAS have been applied to a study of xNa2Sþ (1� x)B2S3 glassesand polycrystals [91]. With the enhanced resolution from the MQMAS spectra, it
Fig. 18. (continued)
Solid State NMR Spectroscopy 1527
was possible to simulate corresponding MAS spectra and deduce isotropic chemicalshift, quadrupolar parameters and relative concentrations of the various boron sites.Based on the known structure of boron trisulphide (x¼ 0), sodium methathioborate(x¼ 0.5) and sodium orthothioborate (x¼ 0.75), a model was suggested for thestructure of sodium dithioborate (x¼ 0.33). In glasses, several structural units ofthe polycrystalline sample were observed alongside other new species. The evolu-tion of the glass with an increasing Na2B was tracked down and oxygen impuritieswere observed by MQMAS and MAS spectra with varying x values. The 23Naspectra were not so informative due to the high mobility of the Naþ ions, producingbroad NMR spectra. Figure 18 shows the evolution of the MAS spectra of a glassformation with x between 0.55 and 0.8 (Fig. 18a) and a MQMAS spectrum of a glassformed at x¼ 0.6 (Fig. 18b). The evolution towards an orthothioborate (x>0.75,large powder pattern at 40–60 ppm) is clearly observed. The oxygen impurities aredetected in the MQMAS spectra in addition to other basic structural units.
Fig. 18. (a) 11B MAS NMR spectra at a magnetic field of 5.9 T of xNa2Sþ (1� x)B2S3 glasses in the
high alkali glass forming range 0.55 � x � 0.80. (b) 11B 3QMAS NMR spectrum taken at 9.4 T for the
glass formed at x¼ 0.6. (Reproduced with permission from Ref. [91], Copyright (1998), American
Chemical Society)
1528 A. Goldbourt and P. K. Madhu
Additional studies have been performed on aluminosilicates utilising 17O and27Al MQMAS NMR [93, 92] providing information about bond angle distributionsand coordinations.
Observation of Indirect Spin–Spin Couplings in Quadrupolar Nuclei
The indirect spin–spin coupling constant, J, which is a useful parameter providinginsight into molecular structure and chemical bonding, is difficult if not impossibleto measure in solid state NMR of quadrupolar systems. The splitting arising from Jwill be masked in the second-order quadrupolar broadening. The advent of MQMAShas made the observation of J possible as demonstrated by Wu et al. [94] in the 11BI ¼ 3
2
�3QMAS spectrum of a solid borane–triphenylphosphite complex, (PHO3P–
BH3). Two isotropic peaks representing a doublet pattern were found. The experi-ments were performed at two magnetic fields to confirm that the splitting wasindeed from one-bond J coupling between 11B and 31P. The experimental spectrumand derived NMR parameters are shown in Fig. 19. The apparent splitting in theindirect dimension of MQMAS spectrum is 2.125 J thus leading to an enhancedresolution. This enhancement is generally higher for the highest order of MQC. Forlower MQC in higher spin systems one gets a reduction in the J splitting (except for7QC in spin-9
2) [94].
Co-ordination Environments of 25Mg in Nucleic Acids
Magnesium, 25Mg, is a spin-52
nucleus with a low NMR sensitivity. MQMAS hasbeen shown to be effective for the resolution and assignment of Mg binding sites
Fig. 19. 11B 3QMAS spectra of (PhO)3P–BH3 at 7.4 T showing a J split doublet (a) with and (b)
without resolution enhancement. The J splitting arises due to a 1J(11B, 31P)¼ 85 � 5 Hz as measured
from the MQMAS spectrum. An analysis of the 11B MQMAS spectra also yielded the following
parameters: �Q¼ 1.22 � 0.02 MHz, �¼ 0.10 � 0.05, and �iso¼ 3.0 � 0.1 ppm. (Reproduced with per-
mission from Ref. [94], Copyright (1994), American Chemical Society)
Solid State NMR Spectroscopy 1529
Fig. 20 (continued)
1530 A. Goldbourt and P. K. Madhu
within nucleic acids [95]. Figure 20a shows a 25Mg 3QMAS spectrum of a ternarycomplex of magnesium(II), adenosine 50-triphosphate, and bis(2-pyriyl)amine(BPA) ([Mg(H2O)6][HBPA]2[Mg(MATP)2] 12H2O (MgATP=BPA), a schematicof which is shown in Fig. 20b. The two crystallographically inequivalent Mg siteswere resolved in the spectrum, and the NMR parameters were derived. A combina-tion of this data with a 1D proton REDOR dephasing experiment, Fig. 20c, enabledan assignment of the two Mg peaks. Peak 1 corresponds to Mg(2) co-ordinated bywater molecules, and thus dominates the REDOR difference spectrum. The weaklycoupled peak 2 corresponds to Mg(1) which is co-coordinated entirely by phos-phate oxygen donors. The experiment mentioned above highlights the potential of
Fig. 20. (a) Illustration of the two magnesium coordination environments in MgATP=BPA. (b) Top
spectrum is a 25Mg 3QMAS spectrum of MgATP=BPA acquired with the following parameters,
external magnetic field 11.7 T, �r¼ 10.0 kHz, CW–CW pulse scheme with an excitation pulse of
7.5ms and conversion pulse of 4.0 ms, number of transients of 24000 and number of t1 increments of
16. Two magnesium peaks can be observed in the spectrum. The bottom spectrum is the best fit
simulations of the experimental spectrum. The deduced parameters are indicated in the figure.
(c) REDOR kind of pulse sequence and resulting difference curves that lead to the identification
of which of the 25Mg signal is being generated by each coordination environment shown in (a). The25Mg spin-echo data is obtained by the pulse sequence having �
2and � pulses of duration 4.4ms and
8.89 ms. An interpulse spacing of 400ms had 8 1H � pulses inserted, centered at 14
and 34
of the rotor
period. The inset graph compares the difference spectrum with the linseshapes simulated for peaks 1
and 2 using the parameters determined by MQMAS given in (b). (Reproduced with permission from
Ref. [95], Copyright (2001), American Chemical Society)
Solid State NMR Spectroscopy 1531
25Mg NMR as a tool for elucidating magnesium coordination environments inbiological complexes.
Conclusions
In this review an outline of the MQMAS experiment together with the basic theoryfor MAS and MQMAS of half-integer quadrupolar nuclei was given. Severalexperimental protocols were explored together with a detailed description of pos-sible sensitivity enhancement schemes. For a spin-3
2, FAM-RIACT-FAM proved to
be a very efficient enhancement scheme giving rise to relatively undistorted line-shapes. FASTER-MQMAS can be used when only low rf power is available (20–70 kHz), however, lineshapes are severely distorted. DFS pulses perform at least aswell as FAM and give the user an additional free parameter (frequency modulation)to play with. DFS pulses can also be applied to low-� nuclei with spin-5
2, since only
low rf power levels are needed. When hardware is not suitable for these pulses,spin-5
2MQMAS can be obtained with the aid of FAM-II pulses. The data analysis
procedure was discussed in detail thus giving an accurate way to extract the rele-vant NMR parameters, i.e. NQCC and chemical shift. Heteronuclear experimentswith high-resolution detection of the quadrupolar nucleus were explored andfinally, some representative applications of the MQMAS experimental methodwere demonstrated.
Acknowledgements
The authors thank Prof. S. Vega for many discussions and suggestions on the manuscript. Discussions
with Prof. L. Frydman are gratefully acknowledged. We thank Dr. T. Brauniger and M. Carravetta for a
critical reading of the manuscript. We thank Dr. A. J. Vega for providing us with the data which was
used for the generation of Fig. 3.
References
[1] Abragam A (1961) The Principles of Nuclear Magnetism. Clarendon Press, Oxford
[2] Duer M (2002) Solid-State NMR Spectroscopy: Principles and Applications. Blackwell Science
[3] Pound RV (1950) Phys Rev 79: 685
[4] Andrew ER, Bradbury A, Eades RG (1958) Nature 182: 1659
[5] Lowe IJ (1959) Phys Rev Lett 2: 285
[6] Vega AJ (1992) J Magn Reson 78: 245
[7] Vega AJ (1992) Solid State NMR 1: 17
[8] Samoson A, Lippmaa E, Pines A (1988) Mol Phys 65: 1013
[9] Llor A, Virlet J (1988) Chem Phys Lett 152: 248
[10] Chmelka BF, M€uuller KT, Pines A, Stebbins J, Wu Y, Zwanziger JW (1989) Nature 339: 42