20
Inward FDI and Vietnam’s labor productivity – Implication for FDI inflows from the EU Le Van Hung Vietnam Institute of Economics Email: [email protected] Hanoi, 25.10.2017

Inward FDI and Vietnam’s labor productivity – Implication for FDI inflows
from the EU
Le Van Hung
Vietnam Institute of Economics
Email: [email protected]
Hanoi, 25.10.2017

Contents
1. Overview of FDI and labor productivity (LP) in Vietnam
2. The role of FDI sector in improving LP
3. Measuring of the contribution of FDI to labor productivity growth
4. Contribution of FDI sector on Vietnam’LP
5. Conclusion and implication for FDI inflows from the EU
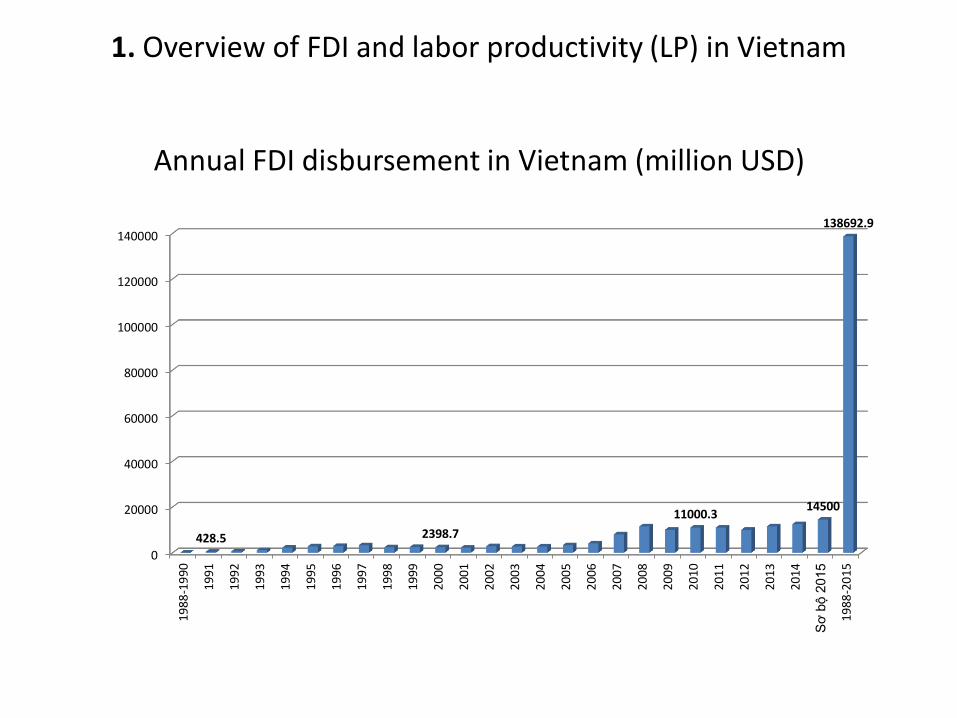
1. Overview of FDI and labor productivity (LP) in Vietnam
Annual FDI disbursement in Vietnam (million USD)
0
20000
40000
60000
80000
100000
120000
140000
1988
-19
90
1991
1992
1993
1994
1995
1996
1997
1998
1999
2000
2001
2002
2003
2004
2005
2006
2007
2008
2009
2010
2011
2012
2013
2014
Sơ
bộ 2
015
1988
-20
15
428.5 2398.7
11000.314500
138692.9

FDI registered by industry (accumulated to 31/12/2015)
0
20000
40000
60000
80000
100000
120000
140000
160000
180000162772.7
50896.4

Growth rate of Vietnam’s LP
0.0
1.0
2.0
3.0
4.0
5.0
6.0
7.0
2006 2007 2008 2009 2011 2012 2013 2014 2015 2016
4.04.2
2.82.6
4.1 4.03.7
4.7
6.6
5.3

Labor productivity gap between FDI sector and domestic sector
0.0
1.0
2.0
3.0
4.0
5.0
6.0
7.0
8.0
9.0
10.0
2006 2011 2016
1.7 1.6 1.4
9.69.0
8.0
FDI/State ownership
FDI/Non-stateOwnership

2. The role of FDI sector in improving LP
• FDI to help labor move from low productivity sectors (agricultural and informal sector) to higher productivity sectors (manufacturing and service sector) ((Kuznets, 1966; Harberger, 1998), Timer và Vries (2008), Crafts (1984)).
• FDI sector with the advantage of technology, market, knowledge, will help to increase labor productivity higher and more stable (Vahter, 2004)
• FDI sector will create a spillover effect on technology and management skills for the local sector through linkages (Trần Văn Thọ (2005), Porter (1990) , Blomstrom và Kokko (1998) , Blomström và Persson (1983), Ramirez (2006),…
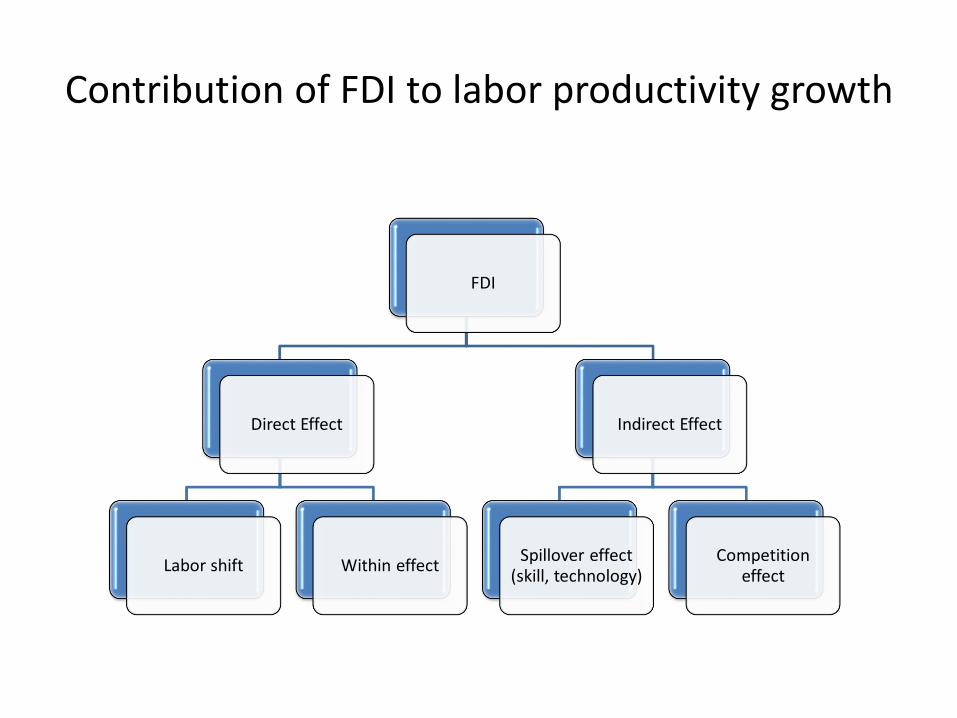
Contribution of FDI to labor productivity growth
FDI
Direct Effect
Labor shift Within effect
Indirect Effect
Spillover effect (skill, technology)
Competition effect

3. Measure the contribution of FDI to labor productivity growth
• Direct contributionThe method measures the labor productivity in the economy using the below formula:
(1)In which:Pe: LP of economy, Pi: LP level in sector i , Ye: gross output of economy (value added); Le: total labor in
economy, i= i-n (numbers of sectors in economy); Li: total labor in sector i; Si proportion of labor to sector i (Si=Li/Le)
Using formula (1), we can calculate the change in productivity levels between two points in time:
(2)
We can use the below formula to calculate the growth rate of labor productivity in economy (gPe) between two periods and compare year T to base year (0):
(3)
the first component in the right-hand side of the equation measures the productivity growth within sector (intra-sectoral effect); the second component is the effect of structural change on labor productivity in economy (shift effect).
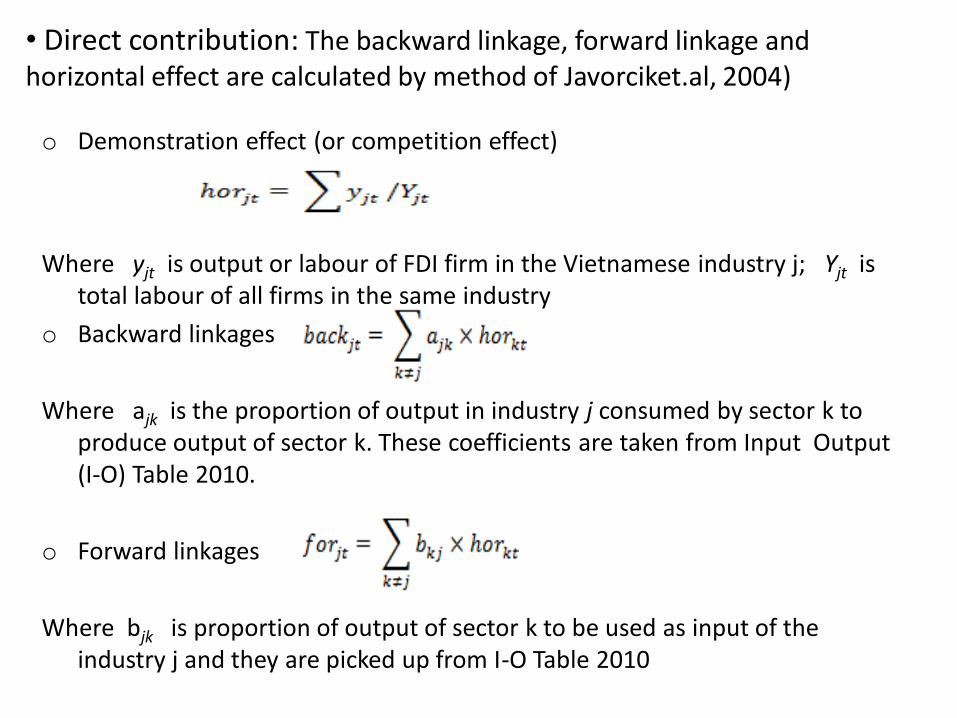
• Direct contribution: The backward linkage, forward linkage and horizontal effect are calculated by method of Javorciket.al, 2004)
o Demonstration effect (or competition effect)
Where yjt is output or labour of FDI firm in the Vietnamese industry j; Yjt is total labour of all firms in the same industry
o Backward linkages
Where ajk is the proportion of output in industry j consumed by sector k to produce output of sector k. These coefficients are taken from Input Output (I-O) Table 2010.
o Forward linkages
Where bjk is proportion of output of sector k to be used as input of the industry j and they are picked up from I-O Table 2010
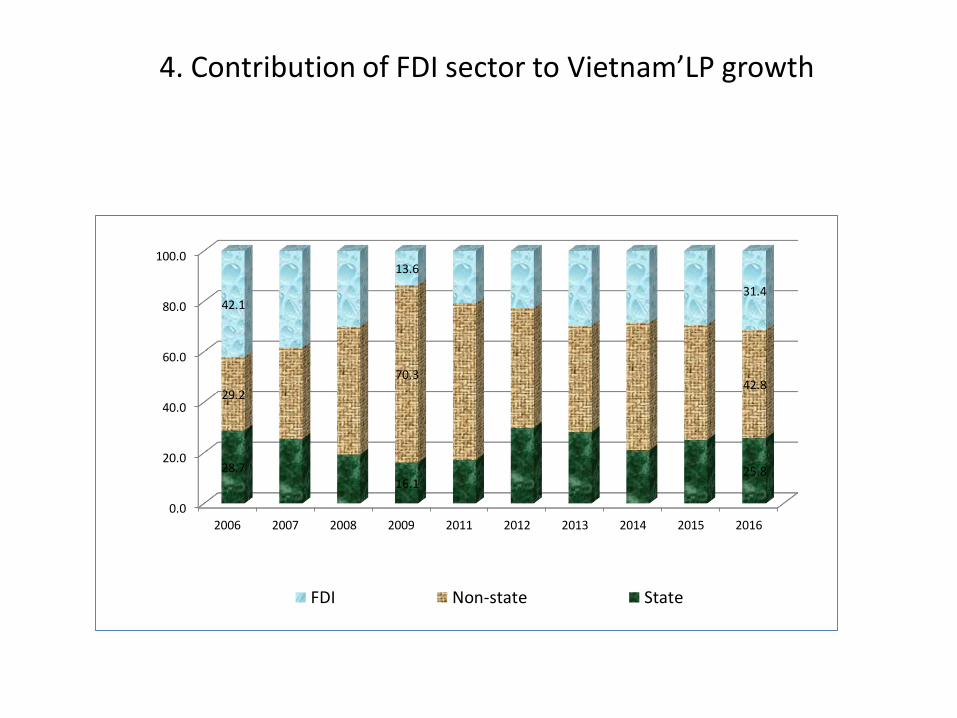
4. Contribution of FDI sector to Vietnam’LP growth
0.0
20.0
40.0
60.0
80.0
100.0
2006 2007 2008 2009 2011 2012 2013 2014 2015 2016
28.716.1
25.8
29.2
70.342.8
42.1
13.6
31.4
FDI Non-state State

Share of investment capital, employment, and their contribution to LP growth
24%
10%
39%
47%
86%
38%
29%
4%
23%
0% 20% 40% 60% 80% 100%
Share of LP growth
share of employment
Share of investment capital
State Non-state FDI
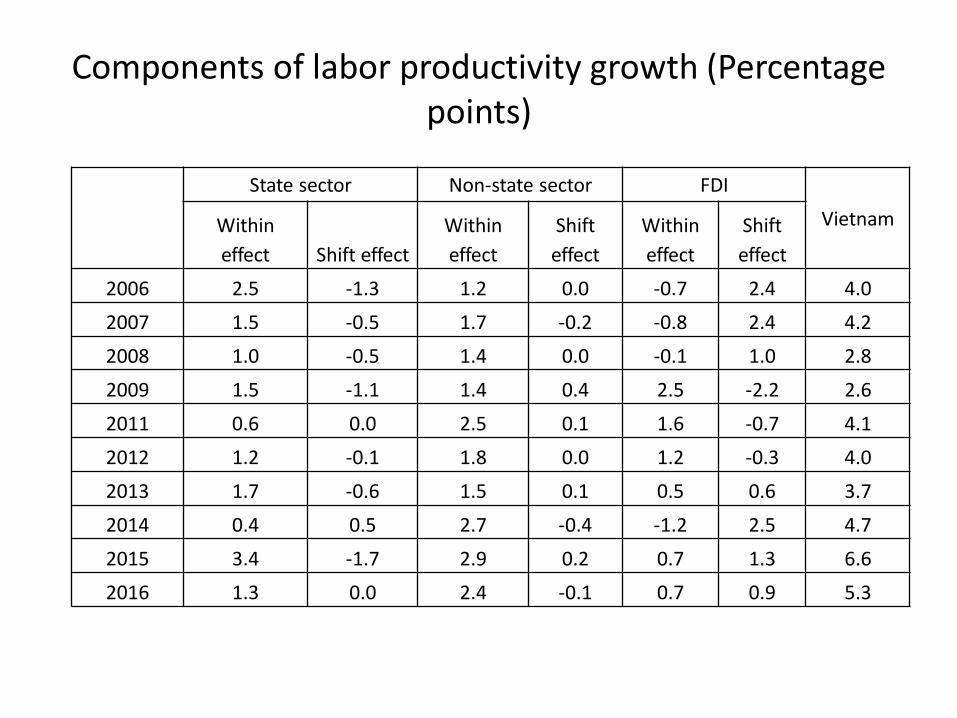
Components of labor productivity growth (Percentage points)
State sector Non-state sector FDI
VietnamWithin
effect Shift effect
Within
effect
Shift
effect
Within
effect
Shift
effect
2006 2.5 -1.3 1.2 0.0 -0.7 2.4 4.0
2007 1.5 -0.5 1.7 -0.2 -0.8 2.4 4.2
2008 1.0 -0.5 1.4 0.0 -0.1 1.0 2.8
2009 1.5 -1.1 1.4 0.4 2.5 -2.2 2.6
2011 0.6 0.0 2.5 0.1 1.6 -0.7 4.1
2012 1.2 -0.1 1.8 0.0 1.2 -0.3 4.0
2013 1.7 -0.6 1.5 0.1 0.5 0.6 3.7
2014 0.4 0.5 2.7 -0.4 -1.2 2.5 4.7
2015 3.4 -1.7 2.9 0.2 0.7 1.3 6.6
2016 1.3 0.0 2.4 -0.1 0.7 0.9 5.3
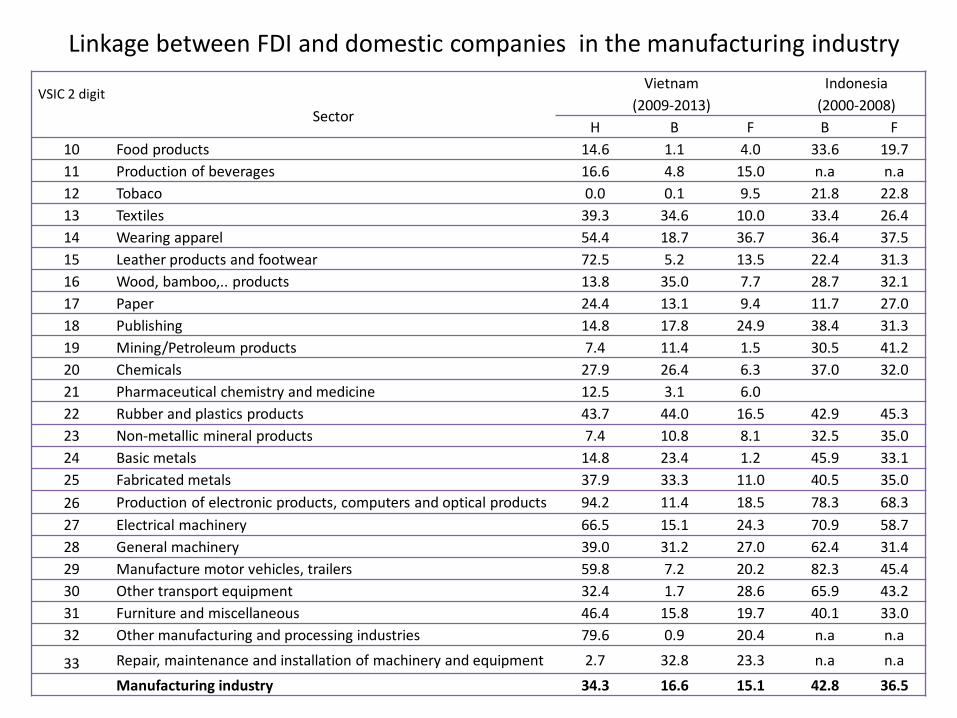
Linkage between FDI and domestic companies in the manufacturing industry
VSIC 2 digit
Sector
Vietnam
(2009-2013)
Indonesia
(2000-2008)
H B F B F
10 Food products 14.6 1.1 4.0 33.6 19.7
11 Production of beverages 16.6 4.8 15.0 n.a n.a
12 Tobaco 0.0 0.1 9.5 21.8 22.8
13 Textiles 39.3 34.6 10.0 33.4 26.4
14 Wearing apparel 54.4 18.7 36.7 36.4 37.5
15 Leather products and footwear 72.5 5.2 13.5 22.4 31.3
16 Wood, bamboo,.. products 13.8 35.0 7.7 28.7 32.1
17 Paper 24.4 13.1 9.4 11.7 27.0
18 Publishing 14.8 17.8 24.9 38.4 31.3
19 Mining/Petroleum products 7.4 11.4 1.5 30.5 41.2
20 Chemicals 27.9 26.4 6.3 37.0 32.0
21 Pharmaceutical chemistry and medicine 12.5 3.1 6.0
22 Rubber and plastics products 43.7 44.0 16.5 42.9 45.3
23 Non-metallic mineral products 7.4 10.8 8.1 32.5 35.0
24 Basic metals 14.8 23.4 1.2 45.9 33.1
25 Fabricated metals 37.9 33.3 11.0 40.5 35.0
26 Production of electronic products, computers and optical products 94.2 11.4 18.5 78.3 68.3
27 Electrical machinery 66.5 15.1 24.3 70.9 58.7
28 General machinery 39.0 31.2 27.0 62.4 31.4
29 Manufacture motor vehicles, trailers 59.8 7.2 20.2 82.3 45.4
30 Other transport equipment 32.4 1.7 28.6 65.9 43.2
31 Furniture and miscellaneous 46.4 15.8 19.7 40.1 33.0
32 Other manufacturing and processing industries 79.6 0.9 20.4 n.a n.a
33 Repair, maintenance and installation of machinery and equipment 2.7 32.8 23.3 n.a n.a
Manufacturing industry 34.3 16.6 15.1 42.8 36.5

5. Conclusion and implication for FDI inflows from the EU
Conclusion
• In the last decade, the FDI sector plays an important role in directly contributing to the Vietnam’s labor productivity growth. However, the contribution of the FDI sector to labor productivity growth is largely due to the shift of labor (64%).
• The level of linkage between the FDI sector and the domestic sector is almost low in manufacturing industry , especially in the high technology and technology sectors. It implies that the indirect effect on labor productivity of the FDI sector through the spillover effect on technology and labor skills is small and weak.

Some suggestions to improve the contribution of FDI to labor productivity
– Improve the level and skills of domestic labor
o To upgrade the quality of universities and vocational training schools in Vietnam according to international standards;
o Ranking and evaluation of universities and vocational training for post-graduates students (employment, income, stability)
– FDI attraction policy
o Vietnam needs to attract quality FDI instead of quantity
o Experimenting to build several eco-industrial parks specializing in processing agricultural products (Ex: coffee in Highland region , aquatic products / fruits in the Mekong Delta region)

Implication for FDI inflows from EU
FDI from the EU to Vietnam is still small compared to the potential (currently accounts for 7% of total FDI registered capital in Vietnam )
Registered FDI capital of over $ 1 billion by country
50553.5
42433.9
38255.4
31885.5
20482.1
17003.1
11966.5
10527.6
10141.7
7799.7
7604.5
6485
5323.3
5128.3
3754.7
3390.4
2933
2300.5
1830.7
1372.5
1366.4
1211.7
1056.6
0 10000 20000 30000 40000 50000 60000
Hàn Quốc
Nhật Bản
Xin-ga-po
Đài Loan
Quần đảo Virgin thuộc Anh
Đặc khu hành chính Hồng Công (TQ)
Ma-lai-xi-a
CHND Trung Hoa
Hoa Kỳ
Thái Lan
Hà Lan
Xa-moa
Quần đảo Cay men
Ca-na-đa
Vương quốc Anh
Pháp
Thụy Sỹ
Lúc-xăm-bua
Ôx-trây-li-a
Bru-nây
CHLB Đức
Tây Ấn thuộc Anh
Liên bang Nga
The expectation on FDI inflow from EU
• EU companies have strengths in food processing, agro-fishery, nutritious food, renewable resources, pharmaceuticals, manufacturing machinery and equipment.
• Vietnam has great potential to link with EU companies in the supply of raw materials and vice versa, EU’s enterprises will support the transfer of technology and production methods to the Vietnamese side.
=> VEFTA will promote FDI flows from the EU into Vietnam =>Expect more spillover effects from FDI in the EU.

The policy on attraction of FDI inflows from EU
• Promote and introduce the investment environment of Vietnam to EU companies.
• The governments of Vietnam and the EU countries hold annual enterprise meetings to them look for investment opportunities
• Increase cooperation /joint venture between Vietnam and EU(Ex: Vincom and Posch, Siemen)

Thank you for your attention!


