+ All Categories
Home > Documents > IOD influence on the early winter tibetan plateau snow...

IOD influence on the early winter tibetan plateau snow...

Date post: 15-Jul-2018
Category:
Upload: ngotram
View: 214 times
Download: 0 times
Share this document with a friend
18
IOD influence on the early winter tibetan plateau snow cover: diagnostic analyses and an AGCM simulation Chaoxia Yuan Tomoki Tozuka Toshio Yamagata Received: 2 June 2011 / Accepted: 19 September 2011 / Published online: 30 September 2011 Ó Springer-Verlag 2011 Abstract Using diagnostic analyses and an AGCM simu- lation, the detailed mechanism of Indian Ocean Dipole (IOD) influence on the early winter Tibetan Plateau snow cover (EWTPSC) is clarified. In early winter of pure positive IOD years with no co-occurrence of El Nin ˜o, the anomalous dipole diabatic heating over the tropical Indian Ocean excites the baroclinic response in the tropics. Since both baroclinic and barotropic components of the basic zonal wind over the Arabian Peninsula increase dramatically in early winter due to the equatorward retreat of the westerly jet, the baroclinic mode excites the barotropic Rossby wave that propagates northeastward and induces a barotropic cyclonic anomaly north of India. This enables the moisture transport cycloni- cally from the northern Indian Ocean toward the Tibetan Plateau. The convergence of moisture over the plateau explains the positive influence of IOD on the EWTPSC. In contrast, the basic zonal wind over the Arabian Peninsula is weak in autumn. This is not favorable for excitation of the barotropic Rossby wave and teleconnection, even though the IOD-related diabatic heating anomaly in autumn similar to that in early winter exists. This result explains the insignifi- cant (significant positive) partial correlation between IOD and the autumn (early winter) Tibetan Plateau snow cover after excluding the influence of ENSO. The sensitivity experiment forced by the IOD-related SST anomaly within the tropical Indian Ocean well reproduces the baroclinic response in the tropics, the teleconnection from the Arabian Peninsula, and the increased moisture supply to the Tibetan Plateau. Also, the seasonality of the atmospheric response to the IOD is simulated. Keywords Indian Ocean Dipole Winter Tibetan Plateau snow cover Wave-activity flux Ray tracing Teleconnection Barotropic mode Baroclinic mode AGCM simulation 1 Introduction The Tibetan Plateau is the highest and biggest plateau in the world; it occupies an area of around 1,000 by 2,500 km, and has an average elevation of over 4,000 meters. Owing to these unique geographical features, it plays an essential role in the atmospheric circulation of the Northern Hemisphere. The mechanical effects of the plateau on the atmo- spheric circulation have been examined since the late 1940s mostly to explain the asymmetry of atmospheric circulation (e.g., Charney and Eliassen 1949; Bolin 1950). The plateau is located right in the path of the midlatitude westerly jet in autumn and winter. When hitting the pla- teau, the westerlies are forced partly to ascend and partly to detour (Trenberth and Chen 1988). Thus, large-scale quasi- stationary waves are induced, contributing to the asym- metry of zonal circulation. The resulting trough over East Asia limits the precipitation upstream of the trough, and causes an extensive arid climate there (Manabe and Broc- coli 1990; Broccoli and Manabe 1992). The thermal effects of the Tibetan Plateau have also received much attention so far for their importance to C. Yuan (&) T. Tozuka T. Yamagata Department of Earth and Planetary Science, Graduate School of Science, The University of Tokyo, Tokyo 113-0033, Japan e-mail: [email protected] T. Tozuka e-mail: [email protected] T. Yamagata e-mail: [email protected] 123 Clim Dyn (2012) 39:1643–1660 DOI 10.1007/s00382-011-1204-0
Transcript

IOD influence on the early winter tibetan plateau snow cover:diagnostic analyses and an AGCM simulation

Chaoxia Yuan • Tomoki Tozuka • Toshio Yamagata

Received: 2 June 2011 / Accepted: 19 September 2011 / Published online: 30 September 2011

� Springer-Verlag 2011

Abstract Using diagnostic analyses and an AGCM simu-

lation, the detailed mechanism of Indian Ocean Dipole (IOD)

influence on the early winter Tibetan Plateau snow cover

(EWTPSC) is clarified. In early winter of pure positive IOD

years with no co-occurrence of El Nino, the anomalous

dipole diabatic heating over the tropical Indian Ocean excites

the baroclinic response in the tropics. Since both baroclinic

and barotropic components of the basic zonal wind over the

Arabian Peninsula increase dramatically in early winter due

to the equatorward retreat of the westerly jet, the baroclinic

mode excites the barotropic Rossby wave that propagates

northeastward and induces a barotropic cyclonic anomaly

north of India. This enables the moisture transport cycloni-

cally from the northern Indian Ocean toward the Tibetan

Plateau. The convergence of moisture over the plateau

explains the positive influence of IOD on the EWTPSC. In

contrast, the basic zonal wind over the Arabian Peninsula is

weak in autumn. This is not favorable for excitation of the

barotropic Rossby wave and teleconnection, even though the

IOD-related diabatic heating anomaly in autumn similar to

that in early winter exists. This result explains the insignifi-

cant (significant positive) partial correlation between IOD

and the autumn (early winter) Tibetan Plateau snow cover

after excluding the influence of ENSO. The sensitivity

experiment forced by the IOD-related SST anomaly within

the tropical Indian Ocean well reproduces the baroclinic

response in the tropics, the teleconnection from the Arabian

Peninsula, and the increased moisture supply to the Tibetan

Plateau. Also, the seasonality of the atmospheric response to

the IOD is simulated.

Keywords Indian Ocean Dipole � Winter Tibetan

Plateau snow cover � Wave-activity flux � Ray tracing �Teleconnection � Barotropic mode � Baroclinic mode �AGCM simulation

1 Introduction

The Tibetan Plateau is the highest and biggest plateau in

the world; it occupies an area of around 1,000 by 2,500 km,

and has an average elevation of over 4,000 meters. Owing

to these unique geographical features, it plays an essential

role in the atmospheric circulation of the Northern

Hemisphere.

The mechanical effects of the plateau on the atmo-

spheric circulation have been examined since the late

1940s mostly to explain the asymmetry of atmospheric

circulation (e.g., Charney and Eliassen 1949; Bolin 1950).

The plateau is located right in the path of the midlatitude

westerly jet in autumn and winter. When hitting the pla-

teau, the westerlies are forced partly to ascend and partly to

detour (Trenberth and Chen 1988). Thus, large-scale quasi-

stationary waves are induced, contributing to the asym-

metry of zonal circulation. The resulting trough over East

Asia limits the precipitation upstream of the trough, and

causes an extensive arid climate there (Manabe and Broc-

coli 1990; Broccoli and Manabe 1992).

The thermal effects of the Tibetan Plateau have also

received much attention so far for their importance to

C. Yuan (&) � T. Tozuka � T. Yamagata

Department of Earth and Planetary Science,

Graduate School of Science, The University of Tokyo,

Tokyo 113-0033, Japan

e-mail: [email protected]

T. Tozuka

e-mail: [email protected]

T. Yamagata

e-mail: [email protected]

123

Clim Dyn (2012) 39:1643–1660

DOI 10.1007/s00382-011-1204-0

various aspects of the Asian climate (e.g., Reiter and Gao

1982; Hsu and Liu 2003; Duan and Wu 2005; Duan et al.

2005; Wang et al. 2008; Bao et al. 2010; Li et al. 2011).

The plateau is a huge heat source in the middle troposphere

in summer months (March-September) and a heat sink in

winter months (October-February) (e.g., Flohn 1957; Yeh

et al. 1957; Ye and Wu 1998). The heating (cooling) of the

plateau in summer (winter) months causes a strong

ascending (descending) motion of airflows over the plateau

and a corresponding convergence (divergence) in the lower

troposphere. This helps the seasonal reversal of atmo-

spheric circulation over the Asian-Australian monsoon

regions (Wu et al. 2007). Also, it influences the onset of the

Asian and Indian summer monsoons; the increase of air

temperature over the eastern plateau and southern China in

May reverses the land-sea thermal contrast and triggers the

onset of the southeast Asian summer monsoon; the increase

of air temperature over Iran and the western plateau in June

leads to the onset of the Indian summer monsoon (e.g., He

et al. 1987; Yanai et al. 1992).

The heating of the plateau is mainly contributed by the

sensible heat flux, especially during the pre-monsoon sea-

son (Li and Yanai 1996; Ye and Wu 1998). Hence, it is

greatly influenced by surface thermal conditions. In winter

months, the ground is frozen, and snow is the main form of

precipitation (Sato 2001). With the presence of snow, the

surface albedo is dramatically increased, and more

incoming solar radiation is reflected. The surface albedo of

fresh snow can reach 0.9, much higher than the globally

average one of 0.3. Also, extra solar energy is used to melt

the snow and to evaporate the water, rather than to heat the

ground (e.g., Shukla 1984; Shukla and Mooley 1987;

Yasunari et al. 1991). The consequent lower surface tem-

perature reduces the amount of sensible heat flux to the

overlying atmosphere and results in a decrease of the

overlying air temperature. In this sense, Yasunari (2007)

and Turner and Slingo (2010) regard snow cover as the

most important factor for the surface thermal condition

over the Tibetan Plateau.

The anomalous snow accumulation in winter over the

Tibetan Plateau experiences a strong interannual variation

(Yuan 2011; Yu et al. 2011). Due to the high altitude of

the Tibetan Plateau, the winter snow anomaly keeps a

significant positive correlation with the snow anomaly in

the subsequent spring and summer. Shaman and Tziperman

(2005) showed the significant positive correlation between

winter and the subsequent summer snow depths. The early

winter snow cover also has a long-lasting positive corre-

lation with the snow cover from winter to the subsequent

early summer (Yuan 2011). Therefore, the winter snow

anomaly influences not only the winter climate but also the

subsequent summer climate via its long-lasting influences

on the surface thermal condition. This has in fact been

noticed for a long time. Blanford (1884) hypothesized a

negative correlation between the winter snow accumulation

over the Himalayas (southern edge of the Tibetan Plateau)

and the subsequent summer monsoon rainfall over the

western India. Since then, especially after the 1970s, when

the satellite observations of snow cover over the Eurasian

continent were first available, many studies have been

devoted to the lagged impacts of the winter snow anomaly

on the subsequent summer climate (e.g., Hahn and Shukla

1976; Barnett et al. 1989; Fasullo 2004). In this sense,

deeper understanding on the interannual variability of

winter snow accumulation over the Tibetan Plateau not

only improves our understanding of winter atmospheric

circulation but also benefits the seasonal predictability of

the Asian summer climate.

Shaman and Tziperman (2005) examined the role of sea

surface temperature (SST) anomaly related to the El Nino/

Southern Oscillation (ENSO) in the tropical Pacific on the

interannual variability of winter snow depth over the

Tibetan Plateau, and claimed a positive influence of ENSO.

Since the ENSO and the Indian Ocean Dipole (IOD, Saji

et al. 1999) sometimes co-occur, Yuan et al. (2009) ana-

lyzed the respective influences of IOD and ENSO. In

marked contrast to Shaman and Tziperman (2005), they

found that the IOD rather than the ENSO is related to an

increase of the early winter Tibetan Plateau snow cover

(EWTPSC). The positive IOD event is associated with a

barotropic cyclonic anomaly north of India. The barotropic

cyclonic anomaly transports extra moisture from the

northern Indian Ocean to the Tibetan Plateau, and results in

an increase of precipitation and snow cover there (Lang

and Barros 2004; Ueno 2005).

However, in Yuan et al. (2009), the detailed mechanism

leading to the barotropic cyclonic anomaly north of India in

early winter has not been clarified yet. In fact, no research

to date has systematically described the circulation anom-

aly related to the IOD in early winter. Therefore, in this

study, based on the observational data, various diagnostic

methods are applied to investigate the circulation anomaly

generated by the IOD-related diabatic heating in early

winter. This completes the key step in understanding the

influence of IOD on the EWTPSC. Then, an atmospheric

general circulation model (AGCM) is adopted to reproduce

this circulation anomaly to provide us a deeper insight into

the IOD-EWTPSC relationship. In most AGCMs, the land

surface scheme is not sophisticated enough to resolve

interannual variations of the regional snow cover (e.g., Frei

and Gong 2005; Khan et al. 2008). Therefore, attentions

are paid to the circulation anomaly related to the IOD in

early winter that has been attributed to increase the mois-

ture supply to the Tibetan Plateau.

The content of the present work is organized as follows.

In Sect. 2, the data and diagnostic methods used in the

1644 C. Yuan et al.: IOD influence on the early winter tibetan plateau snow cover

123

study are introduced. Based on the observational data, Sect.

3 analyzes the atmospheric response to the IOD in early

winter, and explains the mechanism generating the baro-

tropic cyclonic anomaly north of India. In Sect. 4, the

AGCM is applied to reproduce the observed circulation

anomaly related to the IOD and to confirm the mechanism

of the positive IOD-EWTPSC relationship. The final sec-

tion summarizes and discusses the main results.

2 Description of the data and diagnostic methods

2.1 Data

The monthly data from Hadley Centre sea ice and sea

surface temperature (HadISST, see Rayner et al. 2003) and

that of atmospheric fields from the National Centers for

Environmental Prediction and National Center for Atmo-

spheric Research Reanalysis Project (NCEP/NCAR

reanalysis, see Kalnay et al. 1996) are used for a period

from January 1960 to December 1999.

To be consistent with Yuan et al. (2009), the Dipole

Mode Index (DMI) in the present work is defined as the

peak period (September-November) SST anomaly differ-

ences between the western (40�–60�E, 10�S–10�N) and

eastern (90�–110�E, 10�S–Equator) poles of IOD to reflect

its interannual variation. However, conclusions are basi-

cally the same if a conventional definition of DMI is

adopted (Saji et al. 1999). The index of ENSO is also the

peak period (November–January) Nino-3 (90�–150�W,

5�S–5�N) SST anomaly.

2.2 Partial correlation and regression

The partial correlation and regression analyses are applied

to separate the influence of IOD from that of ENSO. The

formula of partial correlation is the same as in Yuan et al.

(2009). All time series used for the partial correlation

analysis are linearly detrended. The anomalous field par-

tially regressed on the IOD after excluding the influence of

ENSO is calculated by product of the partial correlation

coefficient between the field and IOD and one standard

deviation of the field.

2.3 Matsuno-Gill model

Matsuno (1966) studied the atmospheric response to a

sinusoidal diabatic forcing along the Equator. He showed

that, without a basic state, the dominant circulation

anomaly is trapped in the tropics with a pair of cyclonic

(anticyclonic) anomalies that straddle the Equator to the

west of the positive (negative) heating as the stationary

Rossby wave response and an easterly (westerly)

anomaly along the Equator to the east of the positive

(negative) heating as the stationary Kelvin wave

response. The circulation anomaly in the upper tropo-

sphere is opposite to that in the lower troposphere due to

the assumption of the pure baroclinic response in the

tropics (Gill 1980; Geisler and Stevens 1982; Kasahara

and Puri 1981).

The IOD-related SST anomaly remains significant in both

its western and eastern poles in early winter (Fig. 1). Above

the SST anomaly, a considerable diabatic heating anomaly is

induced in the tropics, as revealed by the outgoing longwave

radiation (OLR) anomaly in Fig. 2a. Hence, following

Matsuno (1966) and Gill (1980), the Matsuno-Gill model is

used in this study to diagnose the tropical atmospheric

response to the IOD-related diabatic heating.

In the Matsuno-Gill model (see 2 in Appendix 1), the

heating rate Q is set as a dipole along the Equator to mimic

the diabatic heating anomaly related to the IOD. It is

depicted in Fig. 3a and expressed as

Q ¼ Qþ þ Q� ; ð1aÞ

Qþ ¼0 x\� 3L�cosðkxÞeð�1

4y2Þ �3L� x� � L

0 x [ � L; k ¼ p

2L;

8<

:

ð1bÞ

Q� ¼0 x\L�cosðkxÞeð�1

4y2Þ L� x� 3L

0 x [ 3L; k ¼ p

2L:

8<

:

ð1cÞ

Here, Q? (Q-) denotes the western heating (eastern cool-

ing). The description of the Matsuno-Gill model and the

solutions to the dipole diabatic heating are shown in

Appendix 1.

In reality, the diabatic heating anomaly related to the

IOD is not exactly symmetric about the Equator; the neg-

ative heating anomaly over the eastern pole is shifted to the

Southern Hemisphere. However, a small deviation of the

diabatic heating from the Equator does not dramatically

change the pattern of atmospheric response; it only leads to

an asymmetry in amplitude with the larger amplitude in the

hemisphere to which the heating is shifted (Gill 1980;

Kasahara 1984).

2.4 Wave-activity flux

The atmospheric response to the tropical diabatic heating is

not confined to the tropics. In the presence of zonal wind

with vertical shear, the barotropic mode is excited (Lim

and Chang 1986; Kasahara and Dias 1986). The resulting

barotropic mode with the same phase as the upper part of

the baroclinic mode propagates poleward, and transports

wave energy to mid-high latitudes (Lee et al. 2009).

C. Yuan et al.: IOD influence on the early winter tibetan plateau snow cover 1645

123

To examine the above, the analysis of wave-activity flux

is useful. The wave-activity flux vector is parallel to the

propagation direction of wave energy under both the quasi-

geostrophic approximation and the Wentzel-Kramers-

Brillouin (WKB) approximation. It can be used to diagnose

the generation, propagation, and absorption of wave

packets in a slowly varying basic flow. As in Yuan et al.

(2009), the formula of wave-activity flux vector W derived

by Takaya and Nakamura (2001) is used in this study.

2.5 Ray tracing

The wave-activity flux tracks the propagation of wave

energy of all waves with various wavenumbers as a whole,

and hence contains no phase information. In contrast, a ray

is defined to be in the direction of the local group velocity

of the wave with a specific wavenumber. By tracing the

ray, the propagation of wave energy of the specific wave

can be tracked. Readers are referred to Appendix 2

for details of the ray tracing method used in the present

work.

3 Atmospheric response to the IOD in early winter

3.1 Atmospheric response in the tropics

Figure 3b shows the steady atmospheric response in the

lower troposphere to the dipole heating located along the

Equator (Eq. 1, Fig. 3a) in the Matsuno-Gill model (Eq. 2)

with L = 1 and e ¼ 0:1. There is a clear pair of anticy-

clonic (cyclonic) anomalies straddling the Equator as the

Fig. 1 November–December SST anomaly (�C) partially regressed on the IOD, after excluding the influence of ENSO. Anomalies at a 90%

confidence level by the two-tailed t test are shaded

(a)

(b)

Fig. 2 November–December OLR anomalies (contour interval is

2 W m�2) obtained from a the partial regression on the IOD after

excluding the influence of ENSO with the NCEP/NCAR reanalysis

data and b the AGCM result for a pure positive IOD experiment

(P-IOD) as discussed in Sect. 4. Anomalies at the 90% confidence

level by the two-tailed t test are shaded

1646 C. Yuan et al.: IOD influence on the early winter tibetan plateau snow cover

123

stationary Rossby wave response. Poleward flow exists at

the western (eastern) edge of the pair of anticyclones

(cyclones). Along the Equator, easterlies (westerlies) lie

east (west) of the positive heating. Note that the easterlies

are stronger than the westerlies because the easterlies are

composed of the mixture of the easterlies associated with

the stationary Kelvin wave response to the positive heating

in the west and the stationary Rossby wave response to the

negative heating in the east. Due to an offset effect of the

stationary Kelvin wave response to the positive and nega-

tive heatings, no significant flow is seen along the Equator

to the east of the negative heating. Also, strong conver-

gence (divergence) and ascent (descent) occur over the

positive (negative) heating regions (Fig. 3c). Because of

the nature of the Matsuno-Gill model, the circulation

anomaly in the upper troposphere is assumed to be oppo-

site, forming the baroclinic structure in the vertical direc-

tion. In the observations, the streamfunction anomaly

related to the IOD at 850 hPa in the lower troposphere

shows a pair of anticyclonic (cyclonic) anomalies strad-

dling the Equator west of the negative (positive) heating

anomaly (Fig. 4a). Notice that the cyclone northwest to the

diabatic heating over the Arabian Peninsula is not as

apparent as in the Matsuno-Gill model. This is caused by

an offset effect of barotropic Rossby waves generated there

with opposite sign of anomaly, and will be discussed in the

following subsection. Northward flow is observed along the

western edge of the anticyclonic anomaly over the Bay of

Bengal. This carries the moisture toward the Indian sub-

continent, as shown later in Fig. 7a. At 250 hPa in the

upper troposphere, the anomalous pattern is reverse; a

cyclonic (anticyclonic) anomaly is seen over the Bay of

Bengal (Arabian Peninsula) (Fig. 4c). This baroclinic

response in the tropics becomes clearer in the zonal-verti-

cal sections of the streamfunction anomaly averaged over

5�–15�N and 5�–15�S in Fig. 5a, c. Also, ascending

(descending) motion prevails over the positive (negative)

heating regions consistent with the Matsuno-Gill model.

In general, the observed circulation anomaly related to

the IOD is consistent with the result of the Matsuno-Gill

model, confirming the baroclinic response to the IOD-

related diabatic heating anomaly. It is worth mentioning

that the basic flow in the Matsuno-Gill model is set to zero,

which is different from reality. Lau and Lim (1982) added

the basic flow to the model, and found that the anomalous

circulation pattern in the tropics doesn’t change much.

With the presence of westerly (easterly) lower tropospheric

winds, the Rossby wave response becomes stronger

(weaker) in amplitude but extends less (further) westward,

however, the Kelvin wave response becomes weaker

(stronger) but extends further (less) eastward. The pair of

Rossby wave response to the eastern diabatic heating

anomaly over the eastern tropical Indian Ocean are zonally

elongated probably due to the effects of the easterly basic

flow there (Fig. 4a).

3.2 Atmospheric response in mid latitudes

At 250 hPa, the center of the cyclonic anomaly north of the

Bay of Bengal is much farther north than that of the anti-

cyclonic anomaly over the Arabian Peninsula (Fig. 6a).

Therefore, the cyclonic anomaly is not just the upper-layer

counterpart of the lower-layer anticyclonic anomaly over

the Bay of Bengal. The meridional-vertical section of the

(a)

(b)

(c)

Fig. 3 Non-dimensionalized heating located along the Equator as

described by Eq. 1 and the steady atmospheric responses. a Dipole

diabatic heating. b Streamfunction (contour interval is 3 9 105) and

wind (vector) anomalies. c Velocity potential (contour interval is

3 9 105) and divergent wind (vector) anomalies. Winds with

magnitudes less than 0.04 in b and 0.02 in c are not shown

C. Yuan et al.: IOD influence on the early winter tibetan plateau snow cover 1647

123

streamfunction anomaly averaged over 80�–100�E shows

that the vertical structure is baroclinic from 10�N to about

28�N as the atmospheric response to the diabatic heating

anomaly in the tropics (Fig. 6c). However, from 28�N

northward, the vertical structure becomes barotropic. It is

by this barotropic cyclonic circulation anomaly north of

India that the moisture from the Arabian Sea, the Indian

subcontinent, and the Bay of Bengal is transported cycl-

onically to the Tibetan Plateau (Yuan et al. 2009; Fig. 7a),

explaining the positive influence of IOD on the EWTPSC.

The barotropic cyclonic anomaly north of India may be

generated by the northeastward propagation of the sta-

tionary Rossby wave from the Arabian Peninsula. Due to

the equatorward retreat of the westerly jet over the Eur-

asian continent in early winter (Fig. 8a), the Arabian

Peninsula is covered by the westerly at 250 hPa. As a

result, both barotropic and baroclinic components of the

basic zonal wind increase dramatically, as represented by

the dramatic increase of sum and difference of the clima-

tological zonal wind at 250 and 850 hPa averaged over

(20�-80�E, 15�-20�N), respectively. As seen in Fig. 9a, the

baroclinic (barotropic) component reaches 25 m s�1

ð15 m s�1Þ in December. This sets up the environment to

generate the barotropic component (Lim and Chang 1986;

Kasahara and Dias 1986). The resulting barotropic mode

with the same phase as the upper part of the baroclinic

mode propagates poleward, and transports wave energy to

higher latitudes (Lee et al. 2009). To show this wave

energy transport, the wave-activity flux at 250 hPa is cal-

culated. As shown in Fig. 10a, a significant amount of

wave-activity flux emanated from the Arabian Peninsula

propagates northeastward, and mostly converges north of

India. This confirms that the barotropic mode is indeed

generated over the Arabian Peninsula in early winter, and

transports the wave energy to the north of India.

Since the wave-activity flux does not contain the phase

information during the propagation, the ray tracing method

is applied to confirm the generation of the cyclonic

anomaly north of India by the anticyclonic anomaly over

the Arabian Peninsula. As introduced in Appendix 2, the

ray tracing not only tracks the ray but also marks the phase

change along the ray. It is often conducted at the upper

troposphere for the stationary Rossby wave, and the cli-

matology of zonal wind there is then used as the basic state

(b)

(d)

(a)

(c)

Fig. 4 November–December streamfunction (contour interval is

3� 105 m2 s�1) and velocity (vector, m s�1) anomalies at a, b 850

and c, d 250 hPa obtained from (left panels) the partial regression on

the IOD after excluding the influence of ENSO with the NCEP/NCAR

reanalysis data and (right panels) the P-IOD. Velocity anomalies at

the 90% confidence level by the two-tailed t test are shown only.

Streamfunction anomalies at 90 and 99% confidence levels are

shaded

1648 C. Yuan et al.: IOD influence on the early winter tibetan plateau snow cover

123

(Karoly 1983; Shaman and Tziperman 2005). Therefore,

November–December climatology at 250 hPa is used as the

basic state for the ray tracing in this study. Figure 11a, c

and e show the horizontal distributions of zonal wind ( �U),

meridional derivative of the absolute vorticity ( �Qy), and the

stationary wavenumber (Ks). It is seen that the midlatitude

westerly jet demarcates the zonal maximum bands of both�Qy and Ks. According to the wave-guide theory (Hoskins

and Ambrizzi 1993), the zonal maximum band of Ks acts as

a wave-guide; once the ray enters the wave-guide, it will be

trapped and propagate in the downstream direction because

rays tend to be refracted toward the larger Ks.

The origin of ray is set at (55�E, 18�N) over the Arabian

Peninsula. The initial zonal wavenumber k is chosen as 5 to

satisfy the WKB approximation because Ks at the origin is

around 7. The ray is integrated until the first phase change

of p and marked at one hour interval. As shown in Fig. 12a,

the ray starts from the Arabian Peninsula, propagates

northeastward, and has the first phase change of p north of

India. This is not surprising because the observed wave

pattern from the Arabian Peninsula to the north of India has

the zonal wavenumber around 5. Therefore, the result

confirms that the anticyclonic anomaly over the Arabian

Peninsula can lead to the barotropic cyclonic anomaly

north of India by the propagation of stationary Rossby

wave. This result is not sensitive to a small shift of the

origin as long as the shift is about ±5� (10�) in meridional

(zonal) direction and a small change in the initial k. With

the initial k of 6, the ray still has the first phase change of pnorth of India (Fig. 12c), but the angle of the ray to the

zonal direction becomes smaller compared with the case

of k = 5 owing to the increase of k and the fixed value of

Ks.

3.3 Seasonality of the atmospheric responses

The SST anomaly and the corresponding OLR anomaly in

September–October in the tropics related to the IOD are

very similar to those in early winter, except that the

anomalies over the eastern pole are stronger in September–

October than in early winter (not shown). By the diabatic

heating anomaly, the anticyclonic anomaly over the Bay of

Bengal extends farther westward and covers most of the

northern tropical Indian Ocean at 850 hPa (not shown). At

250 hPa (Fig. 13a), the cyclonic anomaly is seen from the

Bay of Bengal to India, but much weaker than the one in

(b)

(d)

(a)

(c)

Fig. 5 November–December streamfunction (contour interval is

3� 105 m2 s�1) and velocity (vector, m s�1) anomalies in zonal-

vertical sections averaged over a 5–15�N and c 5�–15�S partially

regressed on the IOD after excluding the influence of ENSO with the

NCEP/NCAR reanalysis data, and b Equator–15�N and d Equator–

15�S in the P-IOD. Velocity anomalies at the 90% confidence level by

the two-tailed t test are shown only. Streamfunction anomalies at 90

and 99% confidence levels are shaded

C. Yuan et al.: IOD influence on the early winter tibetan plateau snow cover 1649

123

early winter (Fig. 6a). In addition, it is confined to the

upper troposphere in the tropics as the upper-layer coun-

terpart of the lower-layer anticyclonic anomaly (Fig. 13c).

Since no barotropic cyclonic anomaly is observed north of

India, the teleconnection from the Arabian Peninsula to the

north of India by the propagation of the barotropic sta-

tionary Rossby wave is not present in September–October.

Although the IOD-related diabatic heating anomaly over

the tropical Indian Ocean in autumn is similar to that in

early winter, the induced atmospheric response is quite

different owing to a significant seasonal variation of the

basic state, as revealed by the seasonal march of westerly

jet (Fig. 8a). The barotropic component of the basic zonal

wind over the Arabian Peninsula is easterly in September

and vanishes in October; the baroclinic component changes

sign from September to October (Fig. 9a). This basic state

is certainly not favorable for generation of the barotropic

Rossby wave and the consequent teleconnection from the

Arabian Peninsula. The result is consistent with the partial

correlation between IOD and the Tibetan Plateau snow

cover after excluding the effects of ENSO. As shown in

Yuan et al. (2009), the partial correlation coefficient

between IOD and September-October Tibetan Plateau

snow cover is -0.1, insignificant; that between IOD and

November–December Tibetan Plateau snow cover is 0.4 at

a 95% significant level by the two-tailed t test for the data

set from 1973 to 1999.

4 AGCM simulation of the IOD influence on the snow

cover over the Tibetan Plateau in early winter

4.1 Description of the model and experiments

The AGCM adopted here is Frontier Atmospheric Model

(FrAM) version 1.1. It was originally developed at the

Climate Variation Research Program of Frontier Research

Center for Global Change, Japan Agency for Marine-Earth

Science and Technology (JAMSTEC). The model has 28

vertical levels from the surface to 10 hPa in the hybrid

vertical coordinate system; the sigma (isobaric) coordinate

is used at the surface (stratosphere). It is horizontally

truncated at T42, corresponding to a horizontal resolution

of 2.8125�. Various parameterizations are used for the

model physics; the cumulus convection scheme is based on

Emanuel (1991), the land surface scheme is based on

Viterbo and Beljaars (1995), the longwave radiation

scheme is after Shibata (1989) and Shibata and Aoki

(1989), and the shortwave radiation scheme is after Lacis

and Hansen (1974). The model has successfully simulated

(b)

(d)

(a)

(c)

Fig. 6 November–December streamfunction anomalies (contour

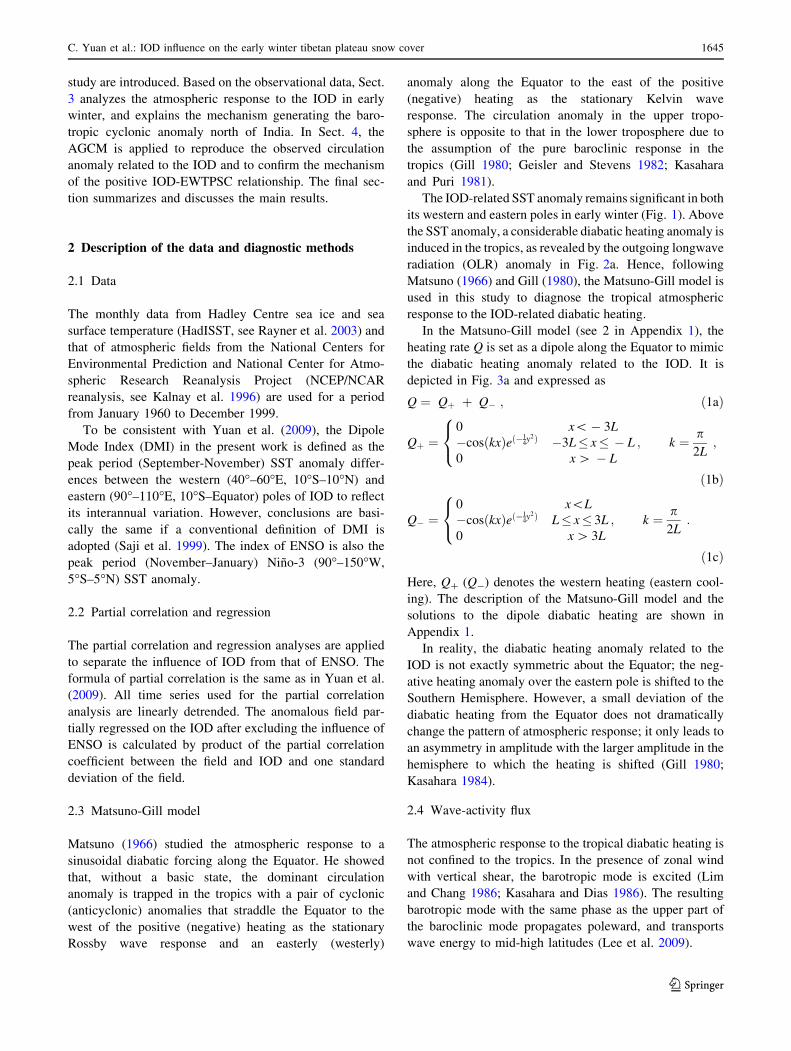
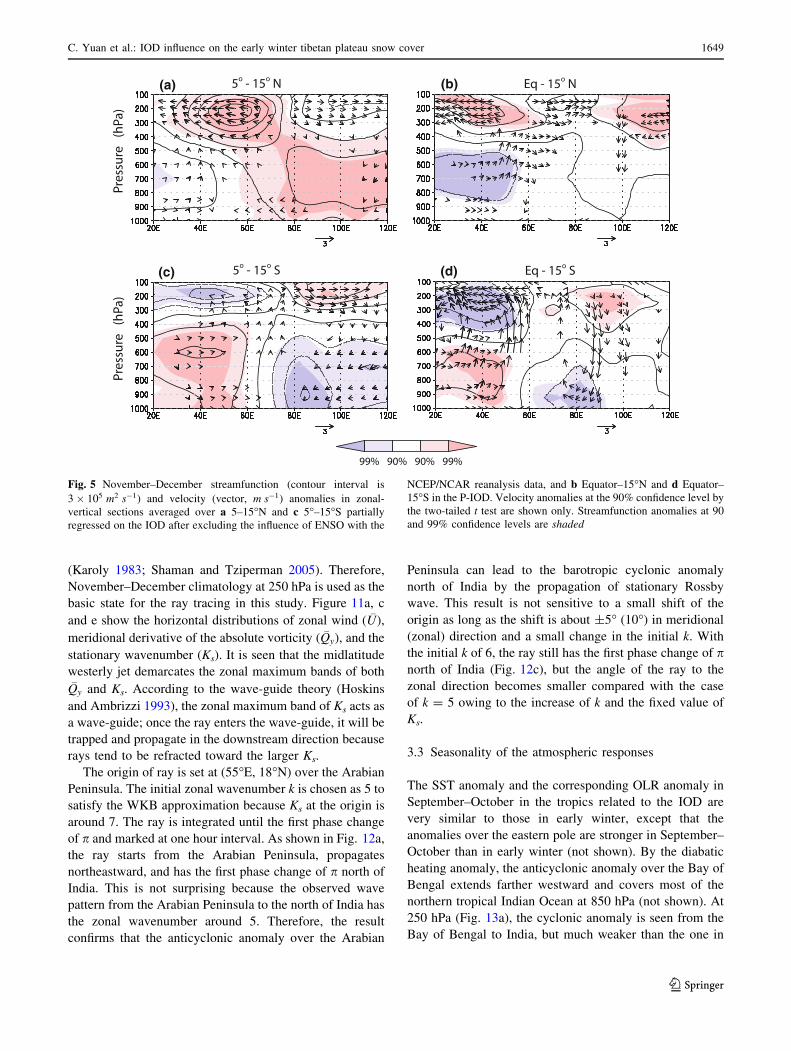
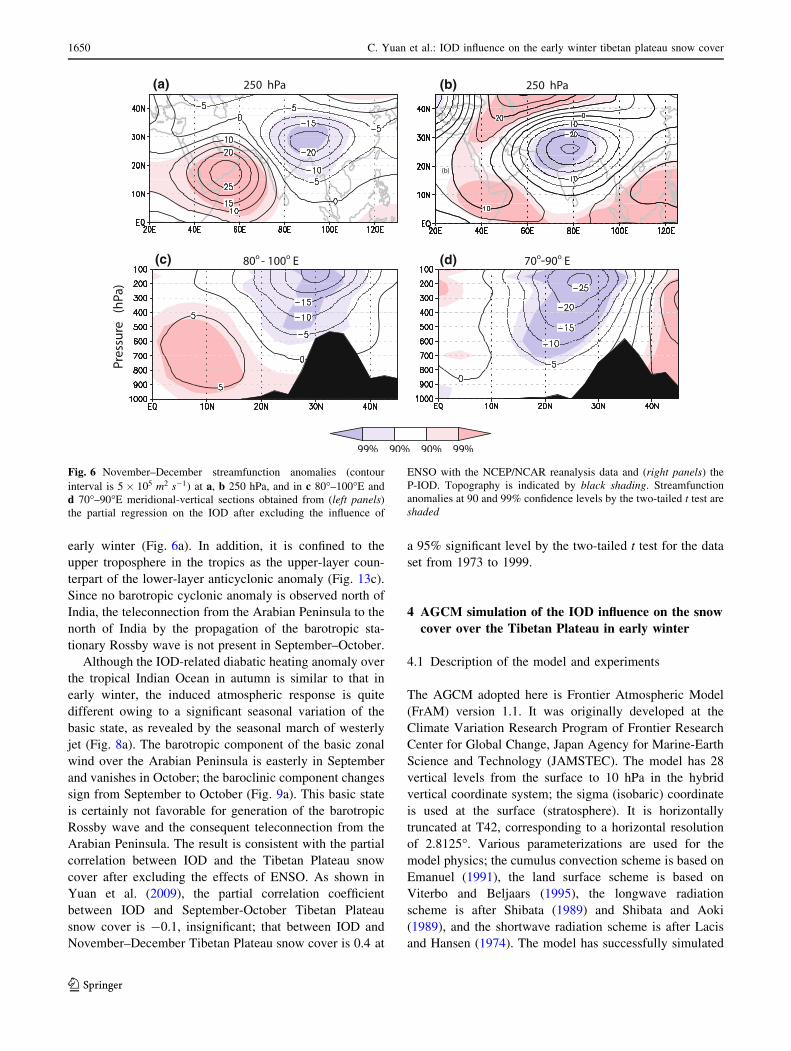
interval is 5� 105 m2 s�1) at a, b 250 hPa, and in c 80�–100�E and

d 70�–90�E meridional-vertical sections obtained from (left panels)

the partial regression on the IOD after excluding the influence of

ENSO with the NCEP/NCAR reanalysis data and (right panels) the

P-IOD. Topography is indicated by black shading. Streamfunction

anomalies at 90 and 99% confidence levels by the two-tailed t test are

shaded

1650 C. Yuan et al.: IOD influence on the early winter tibetan plateau snow cover

123

(a)

(c)

(b)

(d)

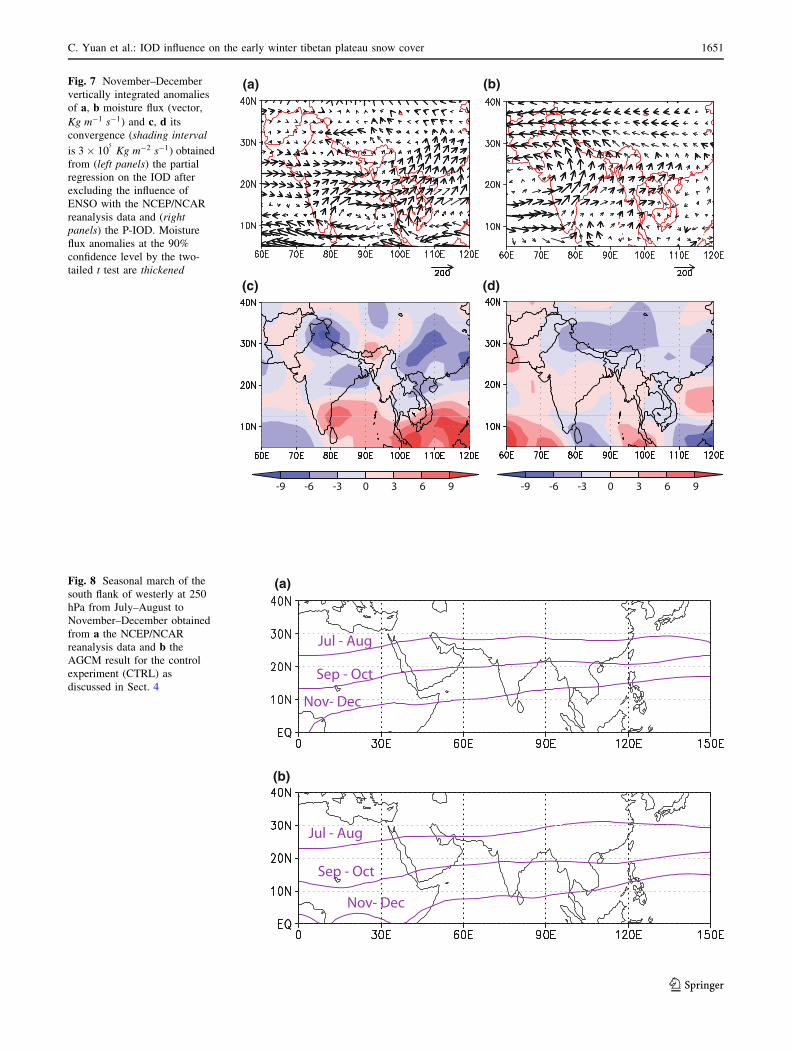
Fig. 7 November–December

vertically integrated anomalies

of a, b moisture flux (vector,

Kg m�1 s�1) and c, d its

convergence (shading interval

is 3� 105

Kg m�2 s�1) obtained

from (left panels) the partial

regression on the IOD after

excluding the influence of

ENSO with the NCEP/NCAR

reanalysis data and (rightpanels) the P-IOD. Moisture

flux anomalies at the 90%

confidence level by the two-

tailed t test are thickened

(b)

(a) Fig. 8 Seasonal march of the

south flank of westerly at 250

hPa from July–August to

November–December obtained

from a the NCEP/NCAR

reanalysis data and b the

AGCM result for the control

experiment (CTRL) as

discussed in Sect. 4

C. Yuan et al.: IOD influence on the early winter tibetan plateau snow cover 1651

123

the IOD-related climate variations in many studies such as

the summer atmospheric circulation in the tropics (Guan

et al. 2003), the summer monsoon precipitation in India

(Ashok et al. 2004), and the winter moisture supply to the

Arabian Peninsula (Chakraborty et al. 2006).

Two experiments are conducted. Each has 20 ensemble

members starting from different initial conditions, and is

integrated for one calendar year from May 1st to April 30th

in the following year. The same set of initial condition is

used for the two experiments. The control experiment

(CTRL) is forced by the monthly climatology of HadISST

as the lower boundary condition to remove the interannual

variability of SST. The sensitivity experiment (P-IOD) is

aimed to simulate the atmospheric circulation anomaly in a

pure positive IOD year with no co-occurrence of El Nino.

Hence, the P-IOD is forced by the monthly climatology of

HadISST plus the SST anomaly partially regressed on the

IOD after removing the impact of ENSO. The SST

anomaly is only applied within the tropical Indian Ocean

from 20�S to 20�N. At the open boundaries in the north,

south and east, additional 10� buffer regions are added.

The ensemble mean of CTRL is used as the model cli-

matology, and validated against the climatology of NCEP/

NCAR reanalysis. The anomaly of P-IOD is defined as the

mean deviation of the 20 ensemble members of P-IOD

from the model climatology. Zonal mean fields for the

zonal wind and the geopotential height are further removed

to highlight a zonal wave pattern. The two-tailed t test is

used to check the statistical significance of the anomaly.
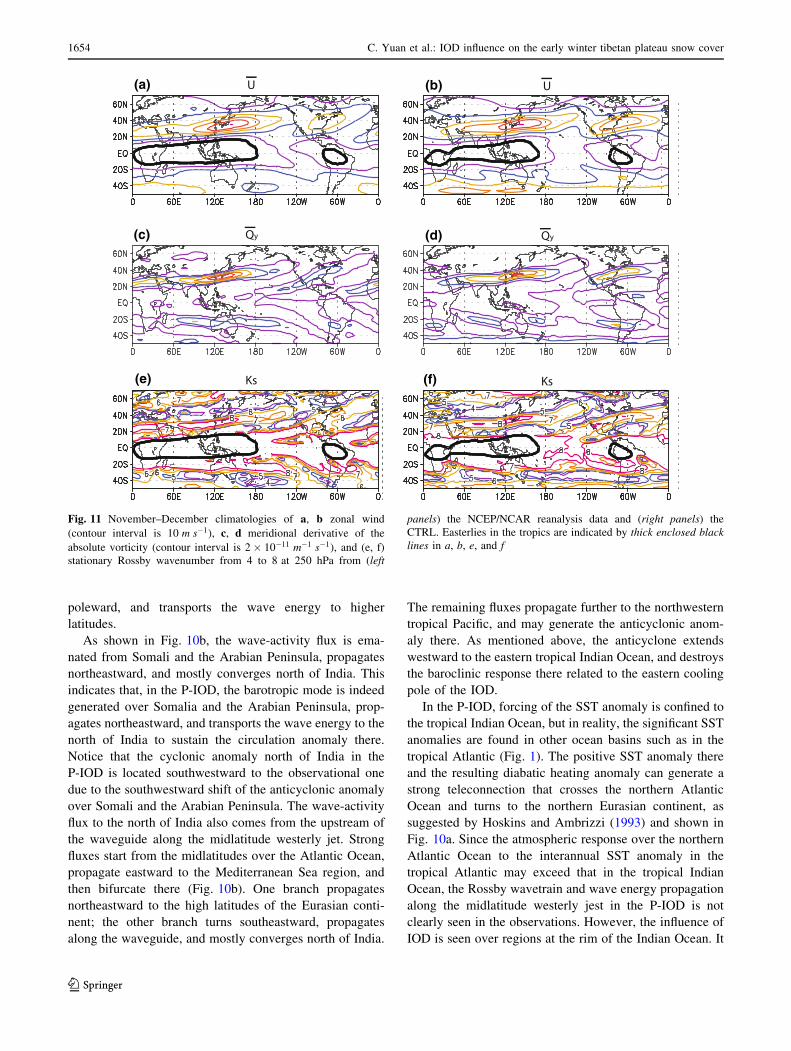
4.2 CTRL experiment

Prior to investigating the impact of IOD on the atmospheric

circulation, it is necessary to check the performance of the

present model. The CTRL well simulates the equatorward

retreat of westerly jet over the Eurasian continent from

summer to winter (Fig. 8b) The dramatic increase of both

barotropic and baroclinic components of the zonal wind

over the Arabian Peninsula from summer to winter is also

reproduced rather well (Fig. 9b). Note that in early winter,

the southern edge of the midlatitude westerly jet in the

CTRL at 250 hPa extends farther southward than that in the

NCEP/NCAR reanalysis. This results in a stronger baro-

clinic component of the zonal wind by 5 m s�1 over the

Arabian Peninsula and the coverage of westerly over

Somalia. The horizontal distributions of zonal wind ( �U),

meridional derivative of the absolute vorticity ( �Qy), and

stationary Rossby wavenumber (Ks) in early winter at 250

hPa are shown in Fig. 11b, d, and f. When compared to

those obtained from the NCEP/NCAR reanalysis, the

CTRL well captures the location and strength of the wes-

terly jet in the midlatitudes, the maximum bands of both �Qy

and Ks along the jet, and the distribution of equatorial

easterly. These basic state conditions are crucial for the

teleconnection related to the IOD in early winter, as dis-

cussed in Sect. 3 Therefore, the good correspondence

between the climatologies of model and the NECP/NCAR

reanalysis assures that this model can provide useful

insight into the atmospheric circulation anomaly related to

the IOD in early winter.

4.3 P-IOD experiment

4.3.1 Circulation anomaly in the tropics

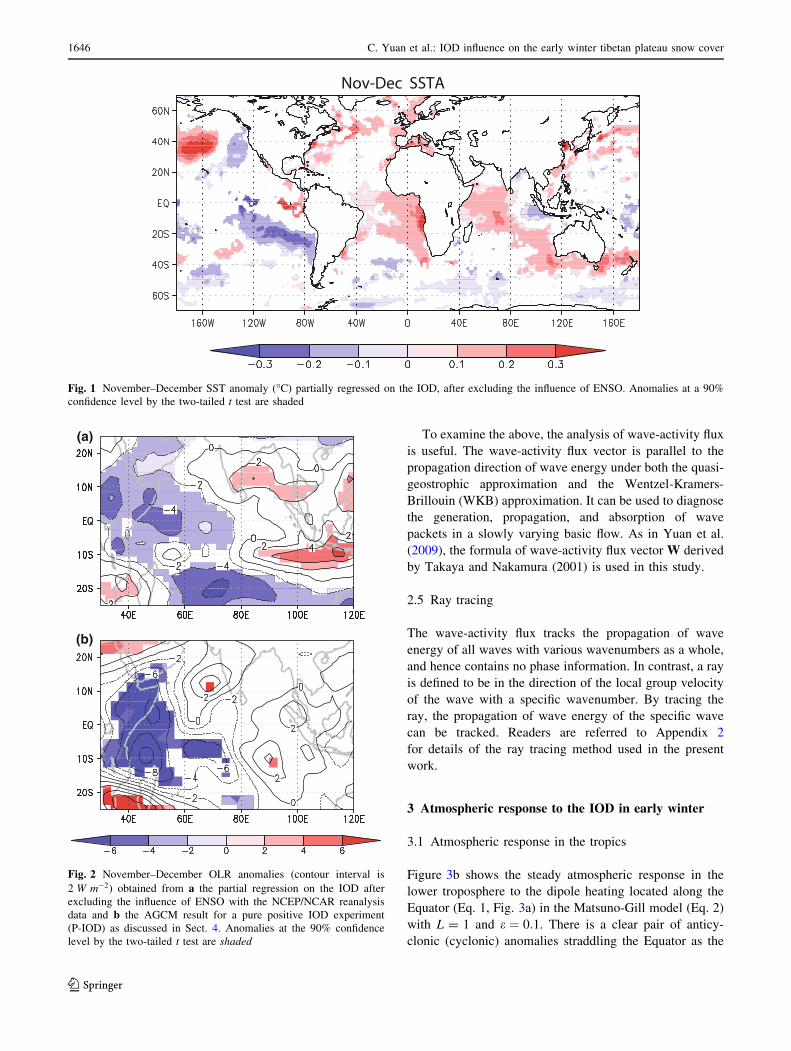
The simulated OLR anomaly in the early winter of P-IOD

is consistent with the reanalysis data (Fig. 2). The negative

OLR anomaly extends from Eastern Africa to the central

tropical Indian Ocean, indicating the enhanced convective

activity associated with the positive SST anomaly in the

western pole of IOD. The positive OLR anomaly is over

(b)

(a)

Fig. 9 Seasonal march of barotropic (blue line) and baroclinic (red

line) components of the basic zonal wind (m s�1) over the Arabian

Peninsula represented by sum and difference of the climatological

zonal wind at 250 and 850 hPa averaged over (20�–80�E, 15�–20�N)

from a the NCEP/NCAR reanalysis data and b the CTRL

1652 C. Yuan et al.: IOD influence on the early winter tibetan plateau snow cover

123

the eastern tropical Indian Ocean, and indicates the sup-

pressed convection there due to the negative SST anomaly

in the eastern pole. However, the simulated OLR anomaly

over the western (eastern) tropical Indian Ocean is stronger

(weaker) than the observed one, suggesting that the con-

vection activity over the western (eastern) tropical Indian

Ocean in the FrAM may be more (less) sensitive to a small

SST anomaly than in reality.

The dipole convective anomaly induces a pair of anti-

cyclonic (cyclonic) anomalies straddling the Equator in the

lower troposphere (Fig. 4b), as in the reanalysis data

(Fig. 4a). Owing to the stronger (weaker) convective

anomaly in the western (eastern) tropical Indian Ocean in

the simulation, the simulated cyclonic (anticyclonic)

anomaly over the Arabian Peninsula (Bay of Bengal) is

stronger (weaker) than the observed one. Hence, the

anomalous airflow is advected to the Indian subcontinent

mainly by the cyclone over the Arabian Peninsula rather

than the anticyclone over the Bay of Bengal, in contrast to

the reanalysis data. At 250 hPa in the upper troposphere

(Fig. 4d), the circulation anomaly in the tropics is almost

reverse to that at 850 hPa (Fig. 4b), except that an easterly

anomaly extends westward from the northwestern tropical

Pacific to the eastern tropical Indian Ocean. This easterly

anomaly is related to the anticyclone in the northwestern

tropical Pacific, which may be generated by the stationary

Rossby wave propagation from the north of India, as will

be discussed later. Also, the center of the simulated

anticyclonic anomaly in the upper troposphere is located

around Somalia, about five degrees southwestward to that

of the observed. This southwestward shift of the simulated

anticyclone may be due to the further southward extension

of westerly jet in early winter of the CTRL (Fig. 8b).

The simulated baroclinic response in the tropics and the

strong ascent (descent) over the western (eastern) tropical

Indian Ocean is clearly seen in the zonal-vertical sections

(Fig. 5b, d). To show a better view, these sections are

averaged over Equator–15�N (Equator–15�S) in the P-IOD

rather than 5�–15�N (5�–15�S) in the reanalysis data by

taking the model bias into account.

4.3.2 Circulation anomaly in mid latitudes

The barotropic cyclonic anomaly north of India is also

reproduced in the P-IOD (Fig. 6b, d). In Sect. 3, it is shown

that the anomaly is generated through the teleconnection

from the Arabian Peninsula in early winter, when both

barotropic and baroclinic components of the basic zonal

wind there increase dramatically and enable generation of

the barotropic mode and the consequent teleconnection.

This is confirmed by the model. First, the CTRL well

captures the significant increase of both barotropic and

baroclinic components of the basic zonal wind (Fig. 9b).

This sets up the environment for generating the barotropic

mode (Lim and Chang 1986; Kasahara and Dias 1986; Lee

et al. 2009). The resulting barotropic mode propagates
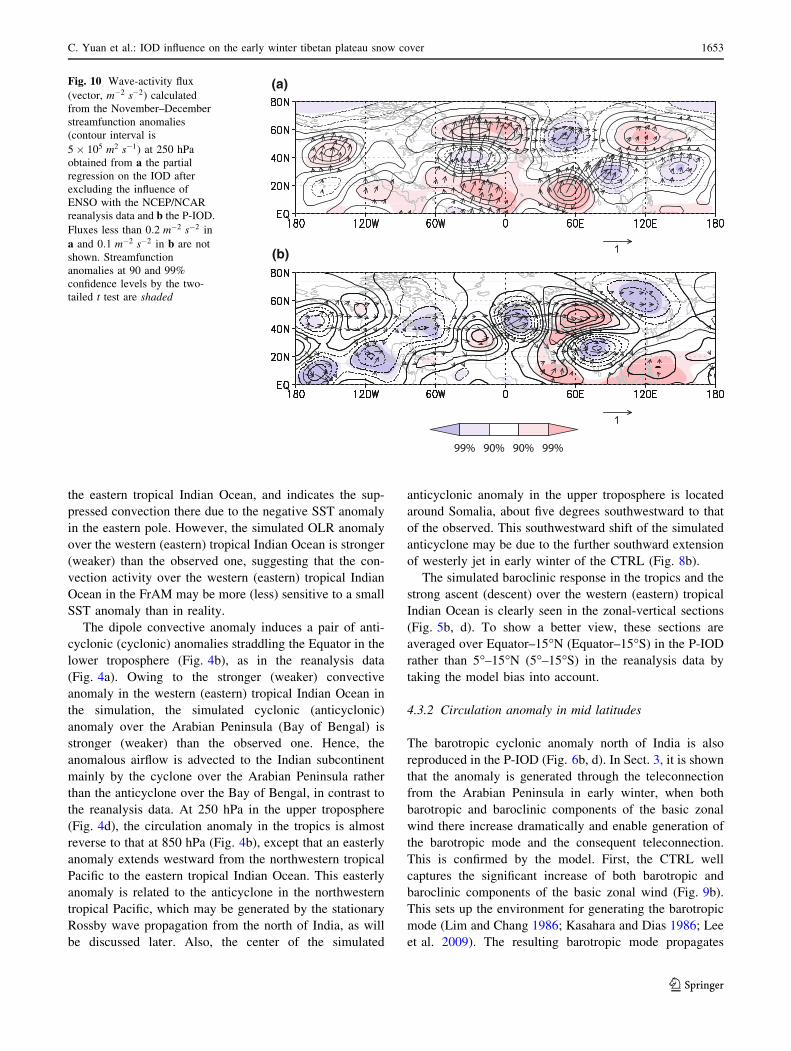
(a)

(b)

Fig. 10 Wave-activity flux

(vector, m�2 s�2) calculated

from the November–December

streamfunction anomalies

(contour interval is

5� 105 m2 s�1) at 250 hPa

obtained from a the partial

regression on the IOD after

excluding the influence of

ENSO with the NCEP/NCAR

reanalysis data and b the P-IOD.

Fluxes less than 0:2 m�2 s�2 in

a and 0:1 m�2 s�2 in b are not

shown. Streamfunction

anomalies at 90 and 99%

confidence levels by the two-

tailed t test are shaded

C. Yuan et al.: IOD influence on the early winter tibetan plateau snow cover 1653

123

poleward, and transports the wave energy to higher

latitudes.

As shown in Fig. 10b, the wave-activity flux is ema-

nated from Somali and the Arabian Peninsula, propagates

northeastward, and mostly converges north of India. This

indicates that, in the P-IOD, the barotropic mode is indeed

generated over Somalia and the Arabian Peninsula, prop-

agates northeastward, and transports the wave energy to the

north of India to sustain the circulation anomaly there.

Notice that the cyclonic anomaly north of India in the

P-IOD is located southwestward to the observational one

due to the southwestward shift of the anticyclonic anomaly

over Somali and the Arabian Peninsula. The wave-activity

flux to the north of India also comes from the upstream of

the waveguide along the midlatitude westerly jet. Strong

fluxes start from the midlatitudes over the Atlantic Ocean,

propagate eastward to the Mediterranean Sea region, and

then bifurcate there (Fig. 10b). One branch propagates

northeastward to the high latitudes of the Eurasian conti-

nent; the other branch turns southeastward, propagates

along the waveguide, and mostly converges north of India.

The remaining fluxes propagate further to the northwestern

tropical Pacific, and may generate the anticyclonic anom-

aly there. As mentioned above, the anticyclone extends

westward to the eastern tropical Indian Ocean, and destroys

the baroclinic response there related to the eastern cooling

pole of the IOD.

In the P-IOD, forcing of the SST anomaly is confined to

the tropical Indian Ocean, but in reality, the significant SST

anomalies are found in other ocean basins such as in the

tropical Atlantic (Fig. 1). The positive SST anomaly there

and the resulting diabatic heating anomaly can generate a

strong teleconnection that crosses the northern Atlantic

Ocean and turns to the northern Eurasian continent, as

suggested by Hoskins and Ambrizzi (1993) and shown in

Fig. 10a. Since the atmospheric response over the northern

Atlantic Ocean to the interannual SST anomaly in the

tropical Atlantic may exceed that in the tropical Indian

Ocean, the Rossby wavetrain and wave energy propagation

along the midlatitude westerly jest in the P-IOD is not

clearly seen in the observations. However, the influence of

IOD is seen over regions at the rim of the Indian Ocean. It

(a) (b)

(c) (d)

(e) (f)

Fig. 11 November–December climatologies of a, b zonal wind

(contour interval is 10 m s�1), c, d meridional derivative of the

absolute vorticity (contour interval is 2� 10�11 m�1 s�1), and (e, f)

stationary Rossby wavenumber from 4 to 8 at 250 hPa from (left

panels) the NCEP/NCAR reanalysis data and (right panels) the

CTRL. Easterlies in the tropics are indicated by thick enclosed blacklines in a, b, e, and f

1654 C. Yuan et al.: IOD influence on the early winter tibetan plateau snow cover

123

is fair to say that the P-IOD captures to some extent the

observed teleconnection from around the Arabian Penin-

sula to the north of India.

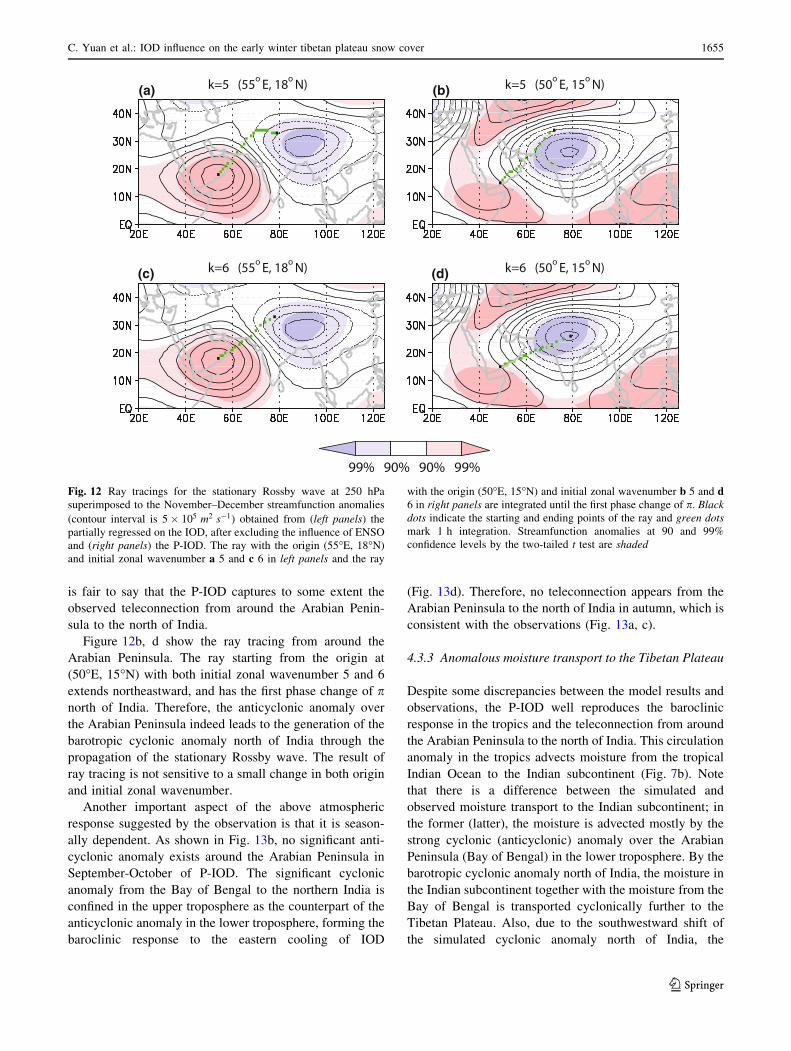
Figure 12b, d show the ray tracing from around the

Arabian Peninsula. The ray starting from the origin at

(50�E, 15�N) with both initial zonal wavenumber 5 and 6

extends northeastward, and has the first phase change of pnorth of India. Therefore, the anticyclonic anomaly over

the Arabian Peninsula indeed leads to the generation of the

barotropic cyclonic anomaly north of India through the

propagation of the stationary Rossby wave. The result of

ray tracing is not sensitive to a small change in both origin

and initial zonal wavenumber.

Another important aspect of the above atmospheric

response suggested by the observation is that it is season-

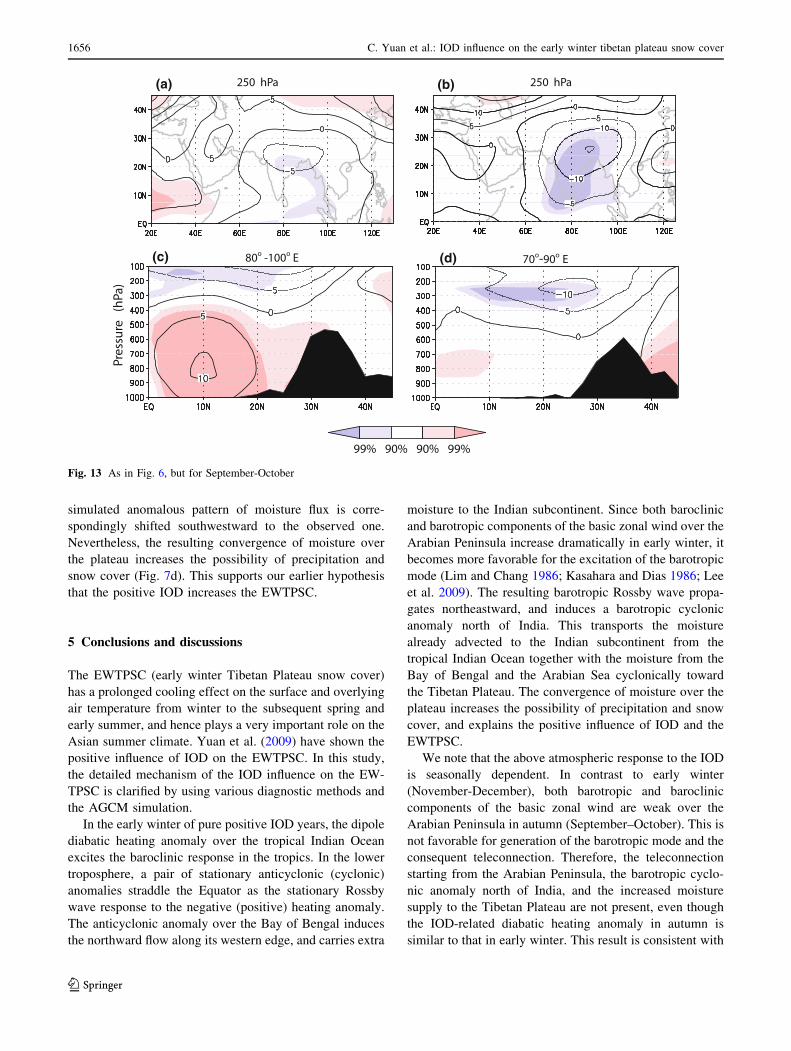
ally dependent. As shown in Fig. 13b, no significant anti-

cyclonic anomaly exists around the Arabian Peninsula in

September-October of P-IOD. The significant cyclonic

anomaly from the Bay of Bengal to the northern India is

confined in the upper troposphere as the counterpart of the

anticyclonic anomaly in the lower troposphere, forming the

baroclinic response to the eastern cooling of IOD

(Fig. 13d). Therefore, no teleconnection appears from the

Arabian Peninsula to the north of India in autumn, which is

consistent with the observations (Fig. 13a, c).

4.3.3 Anomalous moisture transport to the Tibetan Plateau

Despite some discrepancies between the model results and

observations, the P-IOD well reproduces the baroclinic

response in the tropics and the teleconnection from around

the Arabian Peninsula to the north of India. This circulation

anomaly in the tropics advects moisture from the tropical

Indian Ocean to the Indian subcontinent (Fig. 7b). Note

that there is a difference between the simulated and

observed moisture transport to the Indian subcontinent; in

the former (latter), the moisture is advected mostly by the

strong cyclonic (anticyclonic) anomaly over the Arabian

Peninsula (Bay of Bengal) in the lower troposphere. By the

barotropic cyclonic anomaly north of India, the moisture in

the Indian subcontinent together with the moisture from the

Bay of Bengal is transported cyclonically further to the

Tibetan Plateau. Also, due to the southwestward shift of

the simulated cyclonic anomaly north of India, the

(a)

(c)

(b)

(d)

Fig. 12 Ray tracings for the stationary Rossby wave at 250 hPa

superimposed to the November–December streamfunction anomalies

(contour interval is 5� 105 m2 s�1) obtained from (left panels) the

partially regressed on the IOD, after excluding the influence of ENSO

and (right panels) the P-IOD. The ray with the origin (55�E, 18�N)

and initial zonal wavenumber a 5 and c 6 in left panels and the ray

with the origin (50�E, 15�N) and initial zonal wavenumber b 5 and d6 in right panels are integrated until the first phase change of p. Blackdots indicate the starting and ending points of the ray and green dotsmark 1 h integration. Streamfunction anomalies at 90 and 99%

confidence levels by the two-tailed t test are shaded

C. Yuan et al.: IOD influence on the early winter tibetan plateau snow cover 1655

123

simulated anomalous pattern of moisture flux is corre-

spondingly shifted southwestward to the observed one.

Nevertheless, the resulting convergence of moisture over

the plateau increases the possibility of precipitation and

snow cover (Fig. 7d). This supports our earlier hypothesis

that the positive IOD increases the EWTPSC.

5 Conclusions and discussions

The EWTPSC (early winter Tibetan Plateau snow cover)

has a prolonged cooling effect on the surface and overlying

air temperature from winter to the subsequent spring and

early summer, and hence plays a very important role on the

Asian summer climate. Yuan et al. (2009) have shown the

positive influence of IOD on the EWTPSC. In this study,

the detailed mechanism of the IOD influence on the EW-

TPSC is clarified by using various diagnostic methods and

the AGCM simulation.

In the early winter of pure positive IOD years, the dipole

diabatic heating anomaly over the tropical Indian Ocean

excites the baroclinic response in the tropics. In the lower

troposphere, a pair of stationary anticyclonic (cyclonic)

anomalies straddle the Equator as the stationary Rossby

wave response to the negative (positive) heating anomaly.

The anticyclonic anomaly over the Bay of Bengal induces

the northward flow along its western edge, and carries extra

moisture to the Indian subcontinent. Since both baroclinic

and barotropic components of the basic zonal wind over the

Arabian Peninsula increase dramatically in early winter, it

becomes more favorable for the excitation of the barotropic

mode (Lim and Chang 1986; Kasahara and Dias 1986; Lee

et al. 2009). The resulting barotropic Rossby wave propa-

gates northeastward, and induces a barotropic cyclonic

anomaly north of India. This transports the moisture

already advected to the Indian subcontinent from the

tropical Indian Ocean together with the moisture from the

Bay of Bengal and the Arabian Sea cyclonically toward

the Tibetan Plateau. The convergence of moisture over the

plateau increases the possibility of precipitation and snow

cover, and explains the positive influence of IOD and the

EWTPSC.

We note that the above atmospheric response to the IOD

is seasonally dependent. In contrast to early winter

(November-December), both barotropic and baroclinic

components of the basic zonal wind are weak over the

Arabian Peninsula in autumn (September–October). This is

not favorable for generation of the barotropic mode and the

consequent teleconnection. Therefore, the teleconnection

starting from the Arabian Peninsula, the barotropic cyclo-

nic anomaly north of India, and the increased moisture

supply to the Tibetan Plateau are not present, even though

the IOD-related diabatic heating anomaly in autumn is

similar to that in early winter. This result is consistent with

(a)

(d)

(b)

(c)

Fig. 13 As in Fig. 6, but for September-October

1656 C. Yuan et al.: IOD influence on the early winter tibetan plateau snow cover

123

the insignificant (significant positive) partial correlation

between IOD and September–October (November–

December) Tibetan Plateau snow cover after excluding the

influence of ENSO, as shown in Yuan et al. 2009.

We have used the AGCM of FrAM (Frontier Atmo-

spheric General Circulation Model) to reproduce the

observed circulation anomaly related to the IOD and to

explain the positive influence of IOD on the EWTPSC. In

the sensitivity experiment P-IOD, the FrAM is forced by

the SST climatology in all basins and the SST anomaly

within the tropical Indian Ocean related to the pure positive

IOD with no co-occurrence of El Nino. The convective

activity is enhanced (suppressed) over the western (eastern)

tropical Indian Ocean. This dipole convective anomaly

induces the baroclinic atmospheric response in the tropics.

In the lower troposphere, the cyclonic (anticyclonic)

anomaly is seen over the Arabian Peninsula (Bay of Ben-

gal), transporting extra moisture toward the Indian sub-

continent. The teleconnection from around the Arabian

Peninsula and the consequent generation of the barotropic

cyclonic anomaly north of India are also reproduced. By

the barotropic cyclonic anomaly, the extra moisture over

the Indian subcontinent together with the moisture from the

Bay of Bengal is transported cyclonically to the Tibetan

Plateau. The convergence of the moisture anomaly over the

plateau supports the positive correlation between IOD and

EWTPSC. In addition, the seasonality of the circulation

anomaly related to the IOD is also seen in the P-IOD; the

teleconnection from around the Arabian Peninsula to the

north of India is not present in autumn owing to the sig-

nificant seasonal variation of the basic state.

The IOD-related circulation anomaly in early winter not

only influences the EWTPSC but also the Indian winter

monsoon. The warm and humid air is advected from the

tropical Indian Ocean to the Indian subcontinent by the

anticyclonic anomaly over the Bay of Bengal in the lower

troposphere (Fig. 4a). These wind anomalies oppose the

climatological wind pattern in early winter in the Indian

subcontinent, and hence the Indian winter monsoon is

weakened. This supports Yang et al. (2010), who have

found that a positive IOD tends to decrease the Indian

winter monsoon. The increased moisture supply and con-

vergence over the central and southern China by the warm

and humid southwesterlies (Fig. 7a) may increase the

winter precipitation and even snowstorms there. The

extremely heavy snowstorm that hit the central and

southern China in January 2008 caused a huge economic

loss. This was closely related to these southwesterly

anomalies (Wen et al. 2009). More studies are certainly

needed to understand thoroughly the role of IOD in the

winter climate variation from both scientific and societal

viewpoints.

Acknowledgments We thank Drs. H. Nakamura, T. Hibiya, Y.

Masumoto, and I. Yasuda for fruitful discussions. The present

research is supported by the Japan Society for Promotion of Science

(JSPS) through Grant-in-Aid for Scientific Research (B) 20340125

and Sumitomo Foundation. The first author has been supported by the

Research Fellowship of JSPS for Young Scientists.

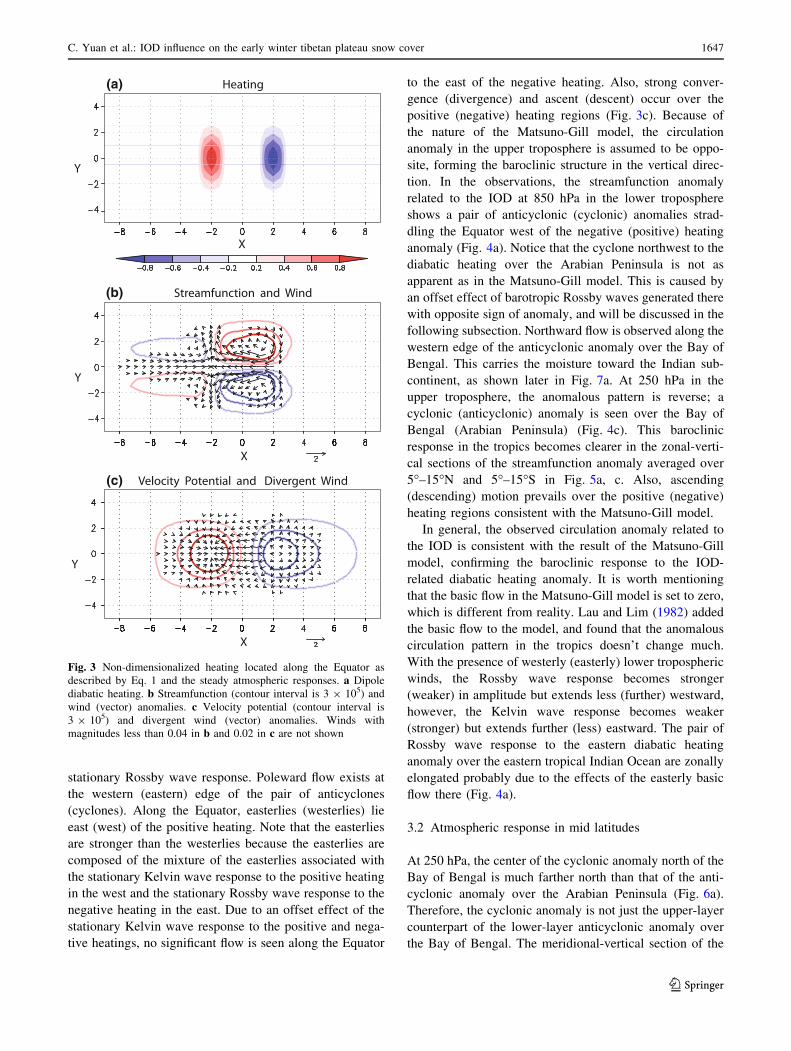
Appendix 1: Steady atmospheric responses to a dipole

diabatic heating located along the Equator

in the Matsuno-Gill model

The Matsuno-Gill model is a set of shallow water equations

non-dimensionalized by a length scale of the equatorial

Rossby radius ðc2bÞ12 and a time scale ð2bcÞ�

12: Here, b is

the meridional derivative of the Coriolis parameter f ; cð¼ffiffiffiffiffiffiffigHp

Þ is the long gravity wave speed, g is the gravity

acceleration, and H is the equivalent depth. If H is adopted

as 400 m, the length scale is about 10�, and the time scale is

about one quarter of a day. When the basic state is of no

motion, the governing equations for a disturbance are

eu� 1

2yvþ op

ox¼ 0 ; ð2aÞ

1

2yuþ op

oy¼ 0 ; ð2bÞ

epþ ou

oxþ ov

oy¼ �Q : ð2cÞ

Here, p is the geopotential height of the disturbance, u and

v are the zonal and meridional velocities of the disturbance,

e is the linear damping rate, and Q is the diabatic heating

rate. Note that the linear damping term in the meridional

momentum equation (2b) is removed due to the long wave

approximation (Gill 1980).

Since the Matsuno-Gill model is a linear model, the

atmospheric response to the dipole diabatic heating along

the Equator (Eq. 1, Fig. 3a) can be linearly decomposed to

the response to each monopole forcing. Readers are

referred to (Gill 1980) for detailed processes of calculation

treating the monopole forcing. Here, only the results are

given.

The steady response to the western heating is

pþ ¼1

2qþ0 þ qþ2 1þ y2

� �� �e �

14y2ð Þ ; ð3aÞ

uþ ¼1

2qþ0 þ qþ2 �3þ y2

� �� �e �

14y2ð Þ ; ð3bÞ

vþ ¼ 4eqþ2 þ Qþð Þye �14y2ð Þ ; ð3cÞ

wþ ¼1

2eqþ0 þ

1

2eqþ2 1þ y2

� �þ Qþ

� �

e �14y2ð Þ ; ð3dÞ

C. Yuan et al.: IOD influence on the early winter tibetan plateau snow cover 1657

123

where

ðe2 þ k2Þqþ0

¼0 x\� 3L

ksinkxþ ecoskx� ke�eðxþ3LÞ �3L� x� � L

�kð1þ e�2eLÞe�eðxþLÞ �L\x

;

8><

>:

ð4aÞ

ð9e2 þ k2Þqþ2

¼�kð1þ e�6eLÞe3eðxþ3LÞ x\� 3L

�ksinkxþ 3ecoskx� ke3eðxþLÞ �3L� x� � L

0 �L\x

:

8><

>:

ð4bÞ

The steady response to the eastern cooling is

p� ¼1

2q�0 þ q�2 1þ y2

� �� �e �

14y2ð Þ ; ð5aÞ

u� ¼1

2q�0 þ q�2 �3þ y2

� �� �e �

14y2ð Þ ; ð5bÞ

v� ¼ 4eq�2 þ Q�ð Þye �14y2ð Þ ; ð5cÞ

w� ¼1

2eq�0 þ

1

2eq�2 1þ y2

� �þ Q�

� �

e �14y2ð Þ ; ð5dÞ

where

ðe2 þ k2Þq�0

¼0 x\L

�ksinkx� ecoskxþ keeðL�xÞÞ L� x� 3L

�kð1þ e�2eLÞeeð3L�xÞ 3L\x

;

8><

>:ð6aÞ

ð9e2 þ k2Þq�2

¼kð1þ e�6eLÞe3eðx�LÞ x\L

ksinkx� 3ecoskxþ ke3eðx�3LÞ L� x� 3L

0 3L\x

:

8><

>:ð6bÞ

Therefore, the total steady response of atmosphere is

p ¼ pþ þ p� ; ð7aÞu ¼ uþ þ u� ; ð7bÞv ¼ vþ þ v� ; ð7cÞw ¼ wþ þ w� : ð7dÞ

In the present work, we tentatively adopt L = 1 (about 10�)

and e ¼ 0:1 (about 0.4 day-1).

Appendix 2: Ray tracing

The ray is defined to be in the direction of the local group

velocity of the wave with a specific wavenumber. By ray

tracing, the propagation of wave energy of the specific

wave can be tracked as in the following:

x ¼Z

ugdt þ x0 ; ð8aÞ

y ¼Z

vgdt þ y0 : ð8bÞ

Here, (x, y) is the ray, (x0, y0) is the origin of the ray, and ug

and vg are the zonal and meridional group velocities. The

phase change along the ray is governed by

h ¼ �Z

xdt þZ

kdxþZ

ldyþ h0 ; ð9Þ

where h and h0 are the phase after and before the ray

tracing, x is the frequency, and k and l are the zonal and

meridional wavenumbers.

From the dispersion relation of Rossby wave under both

the quasi-geostrophic approximation and the WKB

approximation, the frequency can be given by

x ¼ �Uk þ �Vlþ �Qxl� �Qyk� �

= k2 þ l2� �

; ð10Þ

and the group velocities are expressed as

ug ¼ �U þ k2 � l2� �

�Qy � 2kl �Qx

� �= k2 þ l2� �2

; ð11aÞ

vg ¼ �V þ k2 � l2� �

�Qx þ 2kl �Qy

� �= k2 þ l2� �2

: ð11bÞ

Here, suffixes x and y denote the partial derivative, overbar

denotes the variables of the basic state, �U and �V are the

zonal and meridional components of the basic-state

velocity, �Qð¼ r2 �wþ f Þ is the basic-state absolute

vorticity, and �w is the basic-state streamfunction. If the

basic state varies slowly in space, changes in k and l along

the ray are governed by

dgk

dt¼ � ox

ox

¼ �k �Ux � l �Vx

þ �Qxyk � �Qxxl� �

= k2 þ l2� �

; ð12aÞ

dgl

dt¼ � ox

oy

¼ �k �Uy � l �Vy

þ �Qyyk � �Qxyl� �

= k2 þ l2� �

: ð12bÞ

Therefore, by use of Eqs. 8, 11 and 12, the ray under the

quasi-geostrophic approximation and the WKB approxi-

mation can be traced.

For the case of stationary Rossby wave (x = 0), if the

basic state is nearly zonally symmetric, Eq. 10 is reduced to

�U � �Qy=K2s ¼ 0 ð13Þ

where

�Qy ¼ b � �Uyy : ð14Þ

1658 C. Yuan et al.: IOD influence on the early winter tibetan plateau snow cover

123

Here, b is the meridional derivative of f, and Ksð¼ffiffiffiffiffiffiffiffiffiffiffiffiffiffik2 þ l2p

Þ is the local total wavenumber of stationary

Rossby wave. Therefore, along the ray of stationary Rossby

wave, the total wavenumber must satisfy

Ks ¼� �Uyy þ b

�U

12

: ð15Þ

References

Ashok K, Guan Z, Saji NH, Yamagata T (2004) Individual and

combined influences of ENSO and the Indian Ocean Dipole on

the Indian summer monsoon. J Clim 17:3141–3155

Bao Q, Yang J, Liu Y, Wu G, Wang B (2010) Roles of anomalous

Tibetan Plateau warming on the severe 2008 winter storm in

Central-Southern China. Mon Weather Rev 138:2375–2384

Barnett TP, Dumenil L, Schlese U, Roeckner E, Latif M (1989) The

effects of Eurasian snow cover on regional and global climate

variations. J Atmos Sci 46(5):661–686

Blanford HF (1884) On the connection of the Himalayan snowfall

with dry winds and seasons of droughts in India. Proc R Soc

Lond 37:3–22

Bolin B (1950) On the influence of the Earth’s orography on the

general character of the westerlies. Tellus 2:184–195

Broccoli AJ, Manabe S (1992) The effects of orography on

midlatitude northern hemisphere dry climates. J Clim 5:1181–

1201

Chakraborty A, Behera SK, Mujumdar M, Ohba R, Yamagata T (2006)

Diagnosis of tropospheric moisture over Saudi Arabia and

influences of IOD and ENSO. Mon Weather Rev 134:598–617

Charney JG, Eliassen A (1949) A numerical method for predicting the

perturbations of the middle latitude westerlies. Tellus 1:38–54

Duan A, Wu G (2005) Wave-mean flow interaction and its

relationship with the atmospheric energy cycle with diabatic

heating. Sci China (D) 48:1293–1302

Duan A, Liu Y, Wu G (2005) Heating status of the Tibetan Plateau from

April to June and rainfall and atmospheric circulation anomaly

over East Asia in midsummer. Sci China (D) 48:250–257

Emanuel KA (1991) A scheme for representing cumulus convection

in large-scale models. J Atmos Sci 48:2313–2335

Fasullo J (2004) A stratified diagnosis of the Indian Monsoon-

Eurasian snow cover relationship. J Clim 17:1110–1122

Flohn H (1957) Large-scale aspects of the ‘‘summer monsoon’’ in

South and East Asia. J Meteorol Soc Jpn 35:180–186

Frei A, Gong G (2005) Decadal to century scale trends in North

American snow extent in coupled atmosphere-ocean general

circulation models. Geophys Res Lett 32, doi:10.1029/2005

GL023394

Geisler JE, Stevens DE (1982) On the vertical structure of damped

steady circulation in the tropics. Q J R Meteorol Soc 108:87–93

Gill AE (1980) Some simple solutions for heat-induced tropical

circulation. Q J R Meteorol Soc 106:447–462

Guan Z, Ashok K, Yamagata T (2003) Summertime response of the

tropical atmosphere to the Indian Ocean Dipole sea surface

temperature anomalies. J Meteorol Soc Jpn 81(3):533–561

Hahn DG, Shukla J (1976) An apparent relationship between Eurasian

snow cover and Indian monsoon rainfall. J Atmos Sci

33:2461–2462

He H, McGinnis JW, Song Z, Yanai M (1987) Onset of the Asian

summer monsoon in 1979 and the effects of the Tibetan Plateau.

Mon Weather Rev 115:1966–1995

Hoskins BJ, Ambrizzi T (1993) Rossby wave propagation on a

realistic longitudinally varying flow. J Atmos Sci

50(12):1661–1671

Hsu HH, Liu X (2003) Relationship between the Tibetan Plateau

heating and East Asian summer monsoon rainfall. Geophys Res

Lett 30, doi:10.1029/2003GL017909

Kalnay E, Kanamitsu M, Kistler R, Collins W, Deaven D, Gandin L,

Iredell M, Saha S, White G, Wollen J, Zhu Y, Leetmaa A,

Reynolds R, Chellia M (1996) The NCEP/NCAR 40-year

reanalysis project. Bull Am Meteorol Soc 77:437–471

Karoly DJ (1983) Rossby wave propagation in a barotropic

atmosphere. Dyn Atmos Oceans 7:111–125

Kasahara A (1984) The linear response of a stratified global

atmosphere to tropical thermal forcing. J Atmos Sci

41(14):2217–2237

Kasahara A, Dias PLDS (1986) Response of planetary waves to

stationary tropical heating in a global atmosphere with merid-

ional and vertical shear. J Atmos Sci 43(18):1893–1911

Kasahara A, Puri K (1981) Spectral representation of three-dimen-

sional global data by expansion in normal mode functions. Mon

Weather Rev 109:37–51

Khan V, Holko L, Rubinstein K, Breiling M (2008) Snow cover

characteristics over the main Russian river basins as represented

by reanalyses and measured data. J Appl Meteor Climatol

47:1819–1833

Lacis AA, Hansen JE (1974) A parameterization for the absorption of

solar radiation in the earth’s atmosphere. J Atmos Sci

31:118–133

Lang TJ, Barros AP (2004) Winter storms in the central Himalayas.

J Meteorol Soc Jpn 82(3):829–844

Lau KM, Lim H (1982) Thermally driven motions in an equatorial b-

Plance: Hadley and Walker circulations during the winter

monsoon. Mon Weather Rew 110:336–353

Lee SK, Wang C, Mapes BE (2009) A simple atmospheric model of

the local and teleconnection responses of tropical heating

anomalies. J Clim 22:272–284

Li C, Yanai M (1996) The onset and interannual variability of the

Asian summer monsoon in relation to land-sea thermal contrast.

J Clim 9:358–375

Li L, Liu Y, Bo C (2011) Impacts of diabatic heating anomalies on an

extreme snow event over South China in January 2008. Clim

Environ Res 16:126–136

Lim H, Chang CP (1986) Generation of internal- and external-mode

motions from internal heating: Effects of vertical shear and

damping. J Atmos Sci 43(9):948–957

Manabe S, Broccoli AJ (1990) Mountains and arid climates of middle

latitudes. Science 247:192–195

Matsuno T (1966) Quasi-geostrophic motions in the equatorial area.

J Meteorol Soc Jpn 44(1):25–43

Rayerner NA, Parker DE, Horton EB, Folland CK, Alexander LV,

Rowell DP, Kent EC, Kaplan A (2003) Global analyses of sea

surface temperature, sea ice, and night marine air temperature

since the late nineteenth century. J Geophys Res 108, doi:

10.1029/2002JD002670

Reiter ER, Gao D (1982) Heating of the Tibet Plateau and movements

of the South Asia high during spring. Mon Weather Rev

110:1694–1711

Saji NH, Goswami BN, Vinayachandran PN, Yamagata T (1999) A

dipole mode in the tropical Indian Ocean. Nature 401:360–363

Sato T (2001) Spatial and temporal variations of frozen ground and

snow cover in the eastern part of the Tibetan Plateau. J Meteorol

Soc Jpn 79:519–534

Shaman J, Tziperman E (2005) The effect of ENSO on Tibetan

Plateau snow depth: A stationary wave teleconnection mecha-

nism and implications for the South Asian monsoons. J Clim

18:2067–2079

C. Yuan et al.: IOD influence on the early winter tibetan plateau snow cover 1659

123

Shibata K (1989) An economical scheme for the vertical integral of

atmospheric emission in longwave radiative transfer. J Meteorol

Soc Jpn 67:1047–1055

Shibata K, Aoki T (1989) An infrared radiative scheme for the

numerical models of weather and climate. J Geophys Res

94:14,923–14,943

Shukla J (1984) Predictability of time averages. Part II: The influence

of the boundary forcing. In: Burridge BM, Kallen E (eds)

Problems and prospects in long and medium range weather

forecasting. Springer, Heidelberg, pp 155–206

Shukla J, Mooley DA (1987) Empirical prediction of the summer

monsoon rainfall over India. Mon Weather Rev 115:695–703

Takaya K, Nakamura H (2001) A formulation of a phase-independent

wave-activity flux for stationary and migratory quasigeostrophic

eddies on a zonally varying basic flow. J Atmos Sci 58:608–627

Trenberth K, Chen SC (1988) Planetary waves kinematically forced

by Himalayan orography. J Atmos Sci 45:2934–2948

Turner AG, Slingo JM (2010) Using idealized snow forcing to test

teleconnections with the Indian summer monsoon in the Hadley

Centre GCM. Clim Dyn doi:10.1007/s00382-010-0805-3

Ueno K (2005) Synoptic conditions causing nonmonsoon snowfalls in

the Tibetan Plateau. Geophys Res Lett 32, doi:10.1029/2004

GL021421

Viterbo P, Beljaars ACM (1995) An improved land surface param-

eterization scheme in the ECMWF model and its validation.

J Clim 8:2716–2748

Wang B, Bao Q, Hoskins B, Wu G, Liu Y (2008) Tibetan Plateau

warming and precipitation changes in East Asia. Geophys Res

Lett 35 doi:10.1029/2008GL034330

Wen M, Yang S, Kumar A, Zhang P (2009) An analysis of the large-

scale climate anomalies associated with the snowstorms affect-

ing China in January 2008. Mon Weather Rew 137:1111–1131

Wu G, Liu Y, Wang T, Wan R, Liu X, Li W, Wang Z, Zhang Q, Duan

A, Liang X (2007) The influence of mechanical and thermal

forcing by the Tibetan Plateau on Asian climate. J Hdrometeor

8:770–789

Yanai M, Li C, Song Z (1992) Seasonal heating of the Tibetan Plateau

and its effects on the evolution of the Asian summer monsoon.

J Meteorol Soc Jpn 70(1):319–351

Yang J, Liu Q, Liu Z (2010) Linking observations of the Asian

monsoon to the Indian Ocean SST: possible roles of Indian

Ocean basin mode and dipole mode. J Clim 23:5889–5902

Yasunari T (2007) Role of land-atmosphere interaction on Asian

monsoon climate. J Meteorol Soc Jpn 85B:55–75

Yasunari T, Kitoh A, Tokioka T (1991) Local and remote responses

to excessive snow mass over Eurasia appearing in the northern

spring and summer climate. J Meteorol Soc Jpn 69:473–487

Ye D, Wu G (1998) The role of the heat source of the Tibetan Plateau

in the general circulation. Meteorol Atmos Phys 67:181–198

Yeh T, Lo S, Chu P (1957) The wind structure and heat balance in the

lower troposphere over Tibetan Plateau and its surrounding. Acta

Meteor Sin 28:108–121

Yu J, Liu Y, Wu G (2011) An analysis of the diabatic heating

characteristic of the atmospheric over the Tibetan Plateau in

winter II: Interannual variation. Acta Meteor Sin 69:89–98

Yuan C (2011) A study on the influence of the Indian Ocean Dipole

Mode on the snow cover of the Tibetan Plateau in the early

winter. PhD thesis, The University of Tokyo

Yuan C, Tozuka T, Miyasaka T, Yamagata T (2009) Respective

influences of IOD and ENSO on the Tibetan snow cover in early

winter. Clim Dyn 33:509–520

1660 C. Yuan et al.: IOD influence on the early winter tibetan plateau snow cover

123


Recommended