30
Singh Groove Concept Combustion Analysis using Ionization Current By: Garrett R. Herning AutoTronixs, LLC. © October 2007

Singh Groove Concept Combustion Analysis using Ionization Current
By: Garrett R. Herning AutoTronixs, LLC.
© October 2007

1
Ionization Current:
Ionization current is a method devised of using the spark plug as a sensor in an IC engine. The basis for it lies in the fact that a mix of gasoline and air will not conduct electricity very well. However once a mix of gas and air begins combustion, it now has many free electrons due to the chemical reaction of combustion. These electrons enable it to conduct electricity. If one puts an electrical potential across the spark plug after it fires to start combustion, a small amount of current will be able to be measured during combustion until all the available electrons have recombined to form the byproducts of combustion.
One of the unique characteristics of this ionization current when applied to an IC engine is that we get 2 peak current points. The first is during the first part of combustion. This is when most of the mixture of air and fuel is burned and there are a lot of free electrons. As combustion starts to die down, the current drops off rapidly. During this time pressure inside the cylinder begins to ride and we get a second smaller peak at the point of maximum cylinder pressure. From examining this graph and knowing the spark timing, we can tell a variety of things such as ignition delay, combustion time, peak pressure and to some extent cylinder turbulence. Figure 1 shows a typical ionization plot with each of the different parameters that can be measured identified.
Figure 1: Typical Ionization Current Plot

2
In order to see when events happen in relation to the engines physical position a signal generator needs to be attached to the block and referenced off the crankshaft. This way we can measure the combustion events in relation to the physical position of the engine during rotation. To accomplish this a signal generator was devised by the use of a toothed wheel attached to the front pulley of the engine and a pair of photoelectric sensors bolted to a bracket off the block. The toothed wheel was referenced off of TDC on #1 cylinder. A single tooth was machined taller so that it would trip the second photoelectric sensor and create a unique pulse for TDC. Figures 2 and 3 show the setup as installed on the test engine.
Figure 2: Toothed wheel and Sensor assembly Figure 3: Toothed wheel bolted with crank pulley bolts.
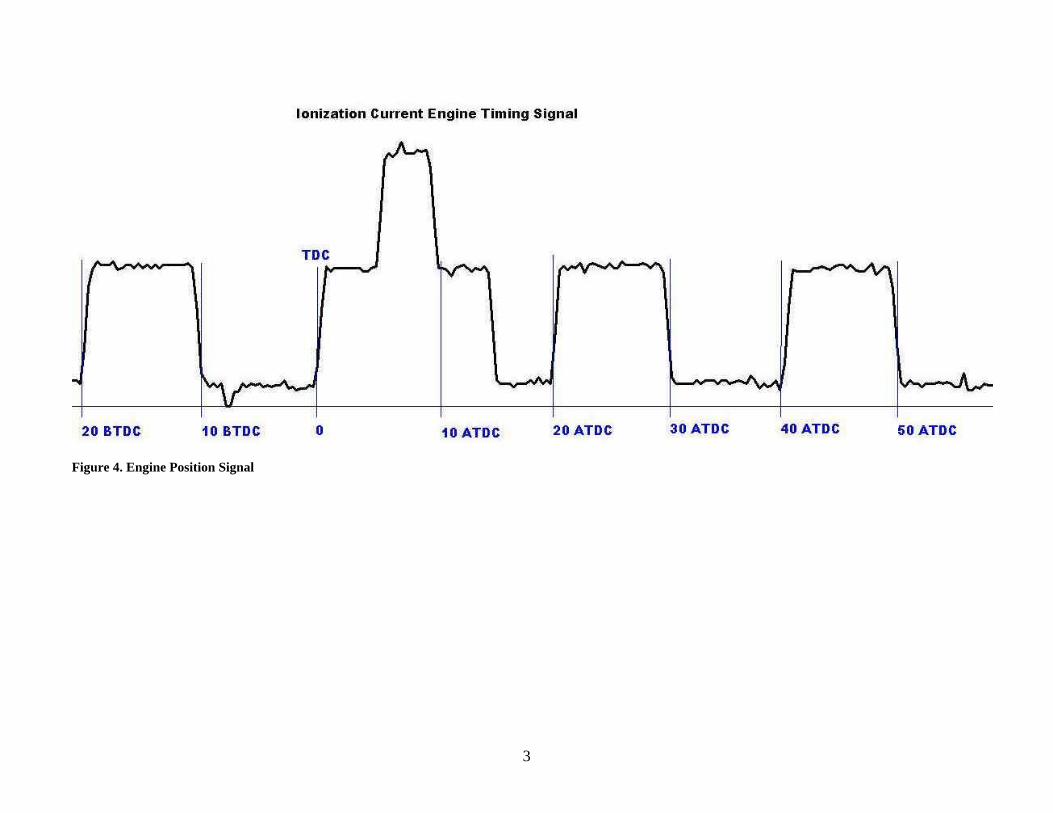
This set of hardware would give a pulse every 20 degrees of engine rotation with a unique pulse being delivered at TDC. Since both the sensor assembly and toothed wheel are bolted to the engine, vibration of the engine in regards to the test stand frame would not interfere with the signal developed.
Figure 4 shows the signal given off by this sensor assembly. It has been labeled and clearly shows the actual position of the engine as it rotates. If spark timing is labeled; ignition delay, combustion time and peak pressure can all be measured as to when they occurred in relation to the engines physical position as it rotates. Moreover if several plots are taken, one can see the consistency of the graphs and get an idea of how regular (or irregular) combustion may be.
3
Figure 4. Engine Position Signal

4
Test Scenarios:
In order to test the effects of the grooves on combustion two sets of tests were conducted. The first was a control test on a stock head. Then the test was repeated on a head with the Singh grooves. Both of these have been compared to see the effect of the grooves on combustion. Five distinct tests were conducted to put the engine in a number of different operation points. These tests were as follows:
1. Idle (900 rpm, transmission in neutral) 2. Light load, low RPM (2000 rpm, 4th gear ~ 16 ft lbs torque at load cell) 3. Light load, high RPM (4500 rpm, 4th gear ~ 17 ft lbs torque at load cell) 4. High load, moderate RPM (2500 rpm, 5th gear ~ 35 ft lbs torque at load cell) 5. High load, High RPM (3500 rpm, 5th gear ~ 42 ft lbs torque at load cell)
Additionally a second test at 2000 rpm was conducted using a setup that would saturate the intake air
with humidity causing a very high-octane air fuel mixture. By doing this, the effect of a raising the fuel octane can be compared against the stock and modified head and the combustion that takes place. Engine and test specifications are as follows:
1. Compression of the engine was kept the same for both heads (8.89:1). 2. Gasoline used was Citgo, 87 Octane, purchased within 2 days of the test. 3. Ambient conditions were 75 – 85 deg F, with 30-50% humidity (except humid test). 4. Base ignition timing on the engine was set to 6 degrees BTDC as per the manufacturers specs. 5. Ignition advance was achieved by a stock mechanical distributor with vacuum advance. Each test
point had the running ignition timing checked with a timing light and recorded for reference on the test graphs. The timing was read off the normal timing markings on the front engine cover.
6. Engine produces a max Torque of about 58 ft-lbs at 3300 rpm 7. Engine produces a max Power of about 49 HP at 4700 rpm
What follows are a set of the ionization current graphs. Each test point has 4 graphs associated with
it. The first 2 graphs are the raw data; all 20 plots overlaid on top of each other for the stock and modified head. The next two graphs are an average of all the good plots from the raw data. Since combustion is never the same from cycle to cycle and can vary quite a bit as an engine runs, there is a certain percentage of time where the captured graphs will not be the signature graphs presented at the beginning of the paper. On these averaged graphs, these non-ideal graphs have been filtered out, so that they do not skew the data. Additionally if there appears to be more than one grouping of data in the graphs, there will be averaged separately to display each tendency.

5
Test Notes:
Idle (900 rpm, transmission in neutral) Idle graphs somewhat erratic, hard to capture a good graph.

6
Test Notes:
Idle (900 rpm, transmission in neutral) Idle graphs somewhat erratic, easier to capture graphs than non-grooved head.

7

8
Notes: Peak pressure delayed significantly compared to stock head (~16 deg)
9
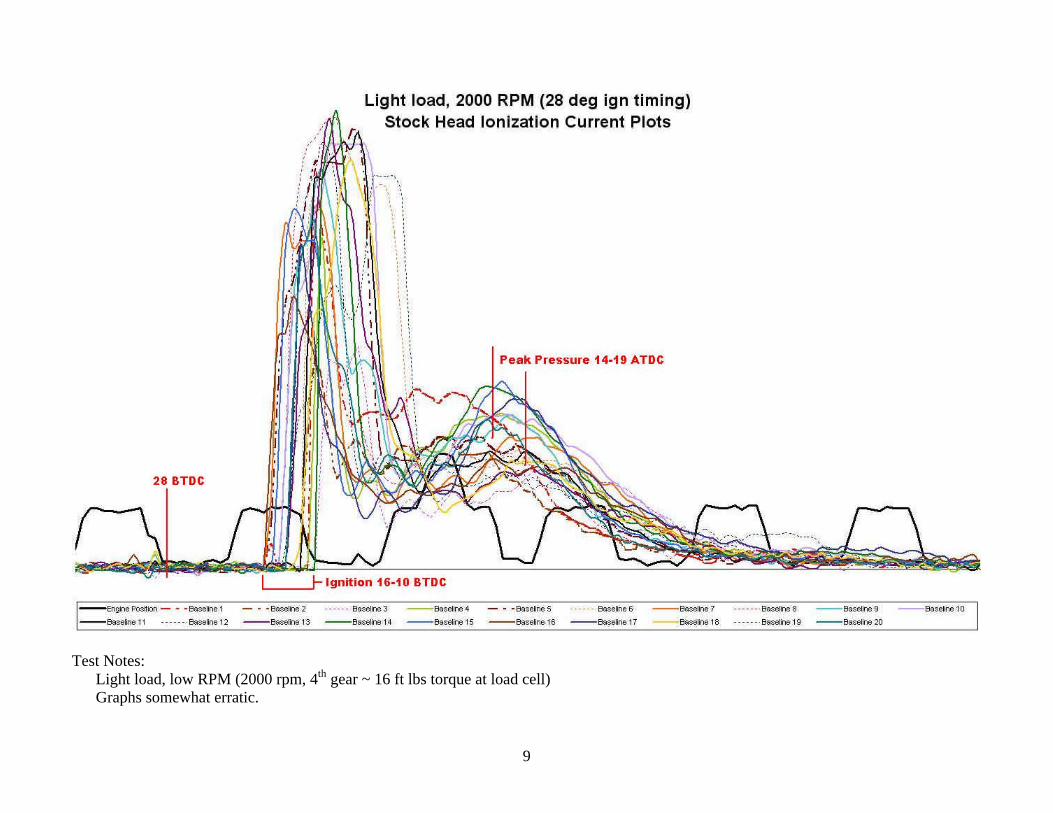
Test Notes:
Light load, low RPM (2000 rpm, 4th gear ~ 16 ft lbs torque at load cell) Graphs somewhat erratic.

10
Test Notes:
Light load, low RPM (2000 rpm, 4th gear ~ 16 ft lbs torque at load cell) Graphs more consistent than non-grooved.
11
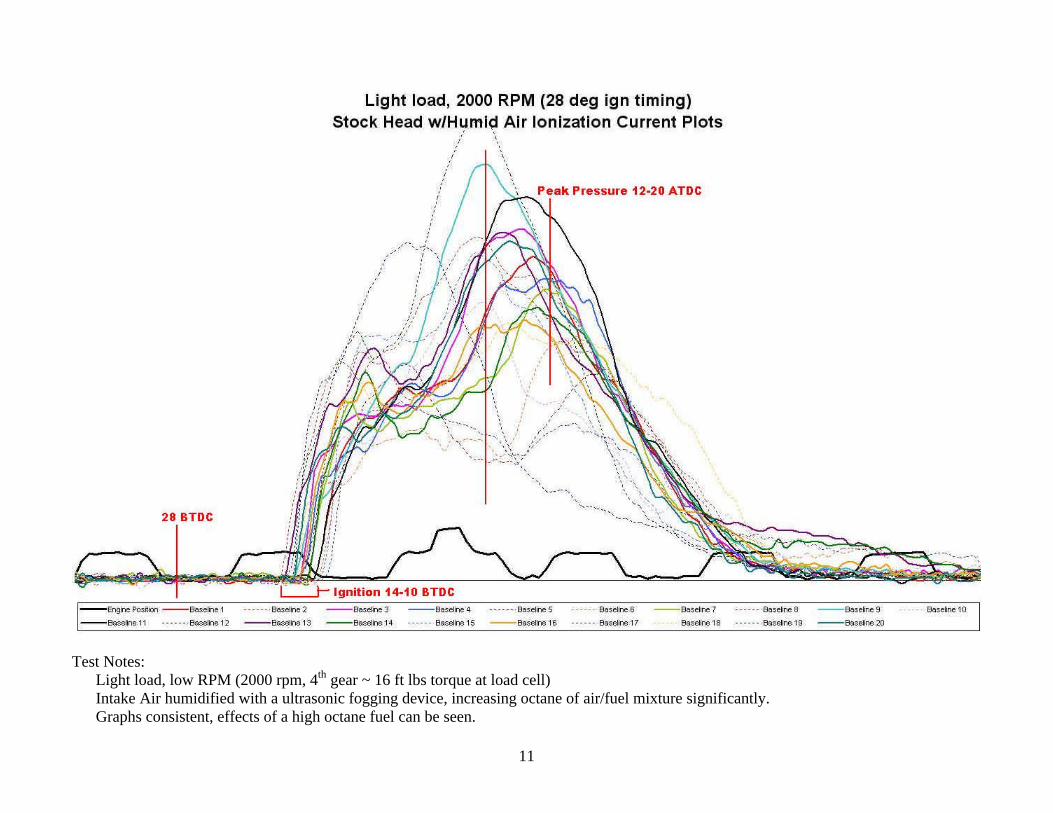
Test Notes:
Light load, low RPM (2000 rpm, 4th gear ~ 16 ft lbs torque at load cell) Intake Air humidified with a ultrasonic fogging device, increasing octane of air/fuel mixture significantly. Graphs consistent, effects of a high octane fuel can be seen.

12

13
Notes:
1. Peak pressure at the same point 2. Initial ignition less violent (smaller peak), more of a burn and less of an explosion (compared to stock head) 3. Peak pressure higher (larger second peak), since we have more current at this peak, we can infer that the peak pressure must be
higher (compared to stock head)

14
Notes: Compare to stock and grooved head. 1. Notice how high octane causes the ignition to dampen significantly and the peak pressure to rise. 2. The grooved ionization graph has similar characteristics (although much less extreme). 3. The grooves appear to cause the combustion to act like it would with a higher-octane fuel.

15
Test Notes:
Light load, high RPM (4500 rpm, 4th gear ~ 17 ft lbs torque at load cell) Graphs somewhat erratic.

16
Test Notes:
Light load, high RPM (4500 rpm, 4th gear ~ 17 ft lbs torque at load cell) Graphs somewhat erratic.

17

18
Notes: 1. Combustion much less violent (lower ignition peak) and more of a burn than explosion. 2. Pressure peak about the same as stock head.

19
Test Notes:
High load, moderate RPM (2500 rpm, 5th gear ~ 35 ft lbs torque at load cell) Graphs somewhat erratic.

20
Test Notes:
High load, moderate RPM (2500 rpm, 5th gear ~ 35 ft lbs torque at load cell) Graphs less erratic than non-grooved. Seem to fall into 2 distinct peak pressure patterns.

21

22
Notes: 1. Combustion much less violent (lower ignition peak) and more of a burn than explosion as compared to stock head. 2. Pressure peak slightly lower in second grouping.

23
Test Notes:
High load, High RPM (3500 rpm, 5th gear ~ 42 ft lbs torque at load cell) Graphs erratic.

24
Test Notes:
High load, High RPM (3500 rpm, 5th gear ~ 42 ft lbs torque at load cell) Graphs erratic.

25

26
Notes:
1. Ignition peak not affected to a large degree. 2. Peak pressure not affected to a large degree.

27
Analysis: The nature of combustion is an erratic event as can be seen by the variety of baseline graphs. Each combustion event is slightly different than the last and this contributes to a unique ionization graphs. Trends in graphs are more important to look at rather than each individual graph. In order to get a good sample set of graphs, 20 graphs were recorded which were a normal cross section of the various graphs for a cylinder over time. By examining all the graphs one can see the relative regularity or irregularity of the combustion process. The spark timing was measured manually with the aid of a timing light and recorded. For a clearer picture of what was happening, the regular combustion graphs were averaged into one of two trends and plotted as a second set of graphs. This helped to identify areas of interest. Idle (900 rpm) test: Examination of the stock and grooved idle graphs show the following differences:
1. Combustion delayed in grooved head (by about 3-5 degrees) 2. Peak pressure points more erratic and delayed in grooved head 3. Peak pressure point did seem to be delayed significantly (15 degrees or so).
2000 rpm light load test: Examination of the stock and grooved 2000 rpm graphs show the following differences:
1. Combustion slightly delayed in grooved graphs (2 deg) 2. Peak pressure point happens over a wider range of points 3. Combustion not as quick, less of an explosion and more of a burn on grooved head.
Combustion part of graph is smaller while peak pressure larger. A larger peak pressure should give us more torque at this point.
4. If compared to humid graph, groove seems to act in a way similar to higher octane air/fuel mixture. Fuel in all tests was 87 octane Citgo gas, summer blend.
4500 rpm light load test: Examination of the stock and grooved 4500 rpm graphs show the following differences:
1. Combustion slightly delayed in grooved graphs (4 deg). This is hard to see in averaged graphs as there is such a spread of ignition points that they average out to about the same as the stock head.
2. Peak pressure point happens over a wider range of points 3. Combustion not as quick, less of an explosion and more of a burn on grooved head.
Combustion part of graph is smaller. Peak pressure in this case is about the same on both heads.
2500 rpm high load test:
Examination of the stock and grooved 2500 rpm graphs show the following differences: 1. Combustion slightly delayed in grooved graphs (3 deg) 2. Peak pressure point seems to happens over 2 distinct areas (around 7 and 14 BTDC) 3. Combustion not as quick, more of a burn and less of an explosion on grooved head.
Combustion part of graph is slightly smaller while peak pressure is slightly larger. 3500 rpm high load test: Examination of the stock and grooved 3500 rpm graphs show the following differences:
1. Combustion about the same in both graphs 2. Peak pressure point happens slightly sooner in grooved (2 deg)

28
Changes in combustion are not drastic with the grooves, however as one looks at the data there are some interesting things to note:
1. The time from the spark plug firing to when the air fuel mixture reaches full combustion seems slightly delayed in most cases. While not to a large extent, there is a slightly different reaction point of the air fuel mixture to the spark plug firing.
2. Combustion seems inhibited, similar to the effects of a higher-octane fuel where the burn is slower and more controlled. A comparison with the stock head with a humid air fuel mix shows how the grooved head begins to affect the combustion and peak pressure graph in the same way as this high-octane mixture. This can been seen by the smaller second peak on most of the non-idle graphs.
3. The grooved head does seem to show less stability of the combustion process in this case where the peak pressure point is not as regular and falls over a wider range ATDC. This could be caused by the design of the combustion chamber itself and may need some optimization to work with the unique turbulence from the added groove.

29
References on Ionization Current: Delphi Ionization Current Systems http://delphi.com/manufacturers/auto/powertrain/gas/ignsys/ionized/ James Murray and Alex Smith 23 July 2003 http://www.jsm-net.demon.co.uk/ion/ Spark-Advance Control by Ion-Sensing and Interpretation; by Lars Eriksson, PhD Student http://www.fs.isy.liu.se/~larer/Projects/main.html DIY ion sensing ignition subsystem, by Ville Vartiovaara http://www.aces.edu/~parmega/efi/temp/DIY-Ion-Sensing.pdf Cylinder Pressure & Ionization Current Modeling for Spark Ignited Engines, by Ingemar Andersson http://www.vehicular.isy.liu.se/Publications/Lic/02_LIC_962_IA.pdf Spark Advance Modeling and Control; by Lars Eriksson http://www.max-boost.co.uk/max-boost/resources/docs/99_PhD_580_LE.pdf


