27
Ionizing Radiation Exposure of the Population of the United States David A. Schauer Executive Director
Ionizing Radiation Exposure of the Population of the
United States
David A. SchauerExecutive Director
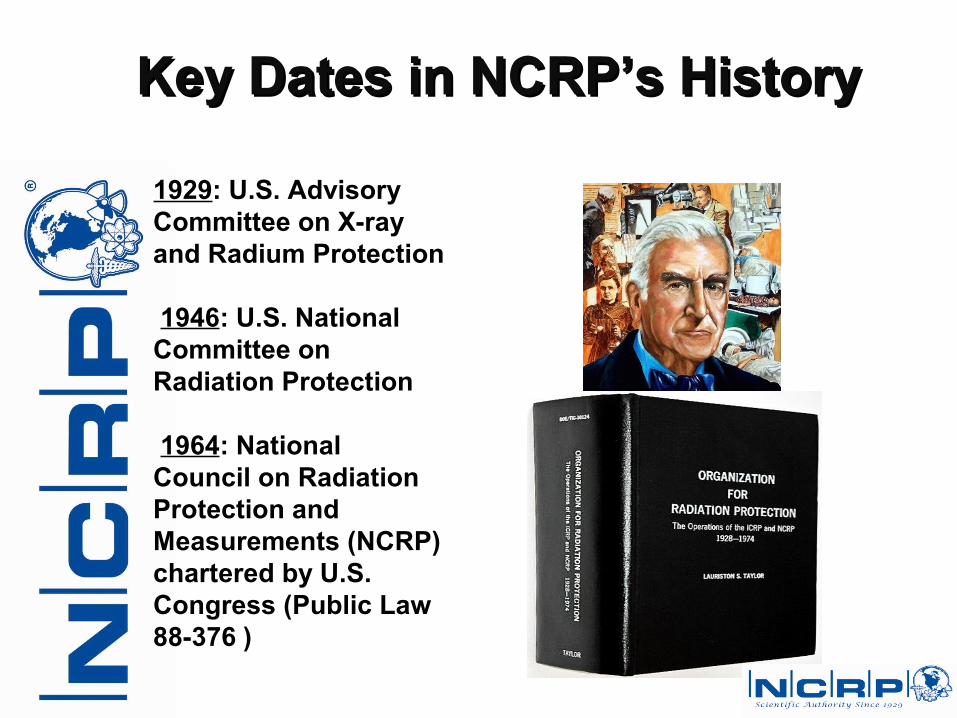
1929: U.S. Advisory Committee on X-ray and Radium Protection 1946: U.S. National Committee on Radiation Protection 1964: National Council on Radiation Protection and Measurements (NCRP) chartered by U.S. Congress (Public Law 88-376 )
Lauriston Sale Taylor(June 1, 1902 – Nov. 26, 2004)
Key Dates in NCRP’s HistoryKey Dates in NCRP’s History
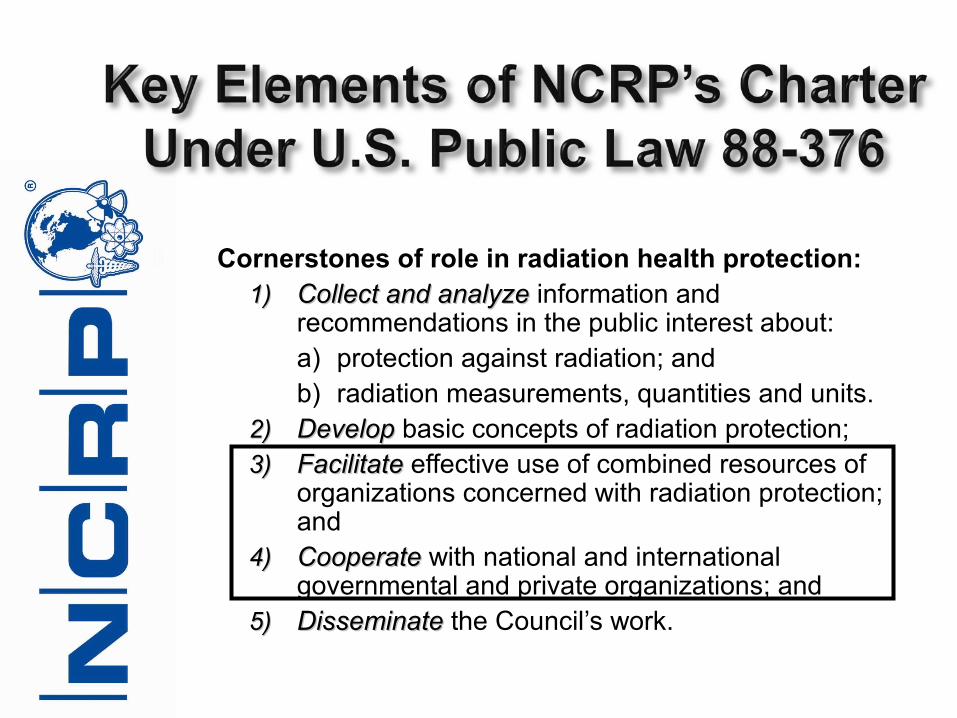
Cornerstones of role in radiation health protection:1)1) Collect and analyzeCollect and analyze information and
recommendations in the public interest about:a) protection against radiation; andb) radiation measurements, quantities and units.
2)2) DevelopDevelop basic concepts of radiation protection;3)3) FacilitateFacilitate effective use of combined resources of
organizations concerned with radiation protection; and
4)4) CooperateCooperate with national and international governmental and private organizations; and
5)5) Disseminate Disseminate the Council’s work.

Overview of NCRP Reports on Population Dose in the United States
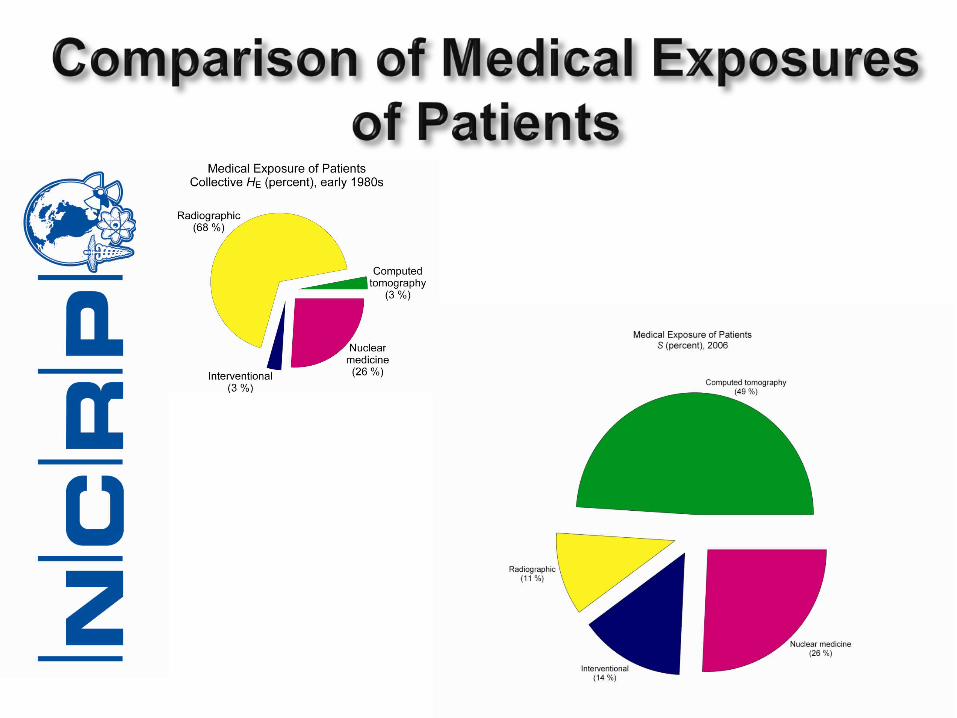
Medical Exposures of Patients• Computed Tomography• Conventional Radiography and Fluoroscopy• Interventional Fluoroscopy• Nuclear Medicine
Occupational Exposure from Medical Procedures
Summary
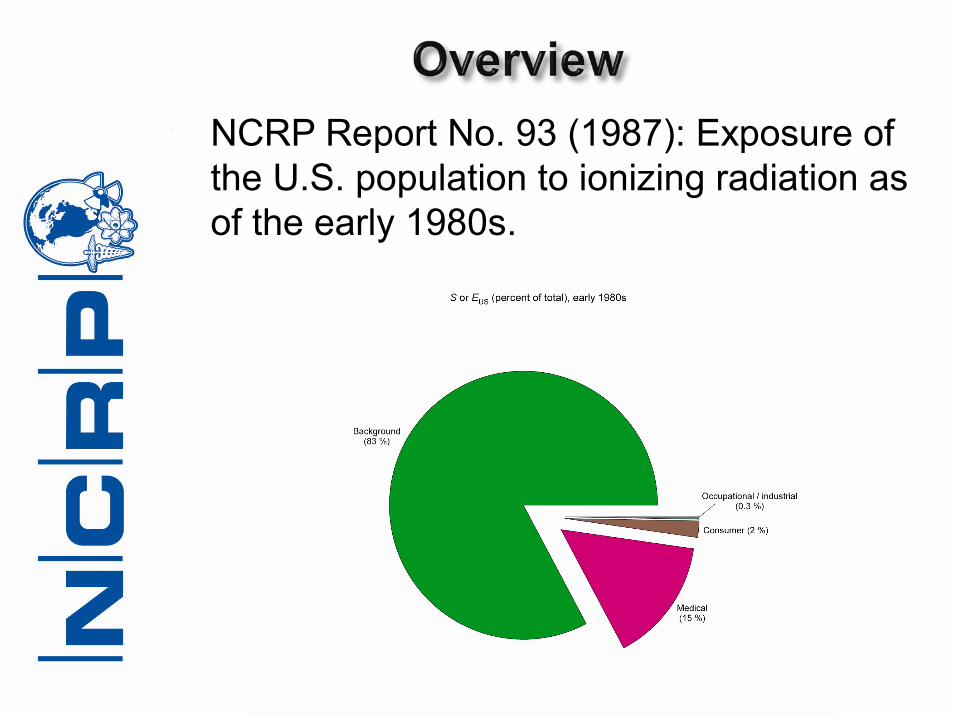
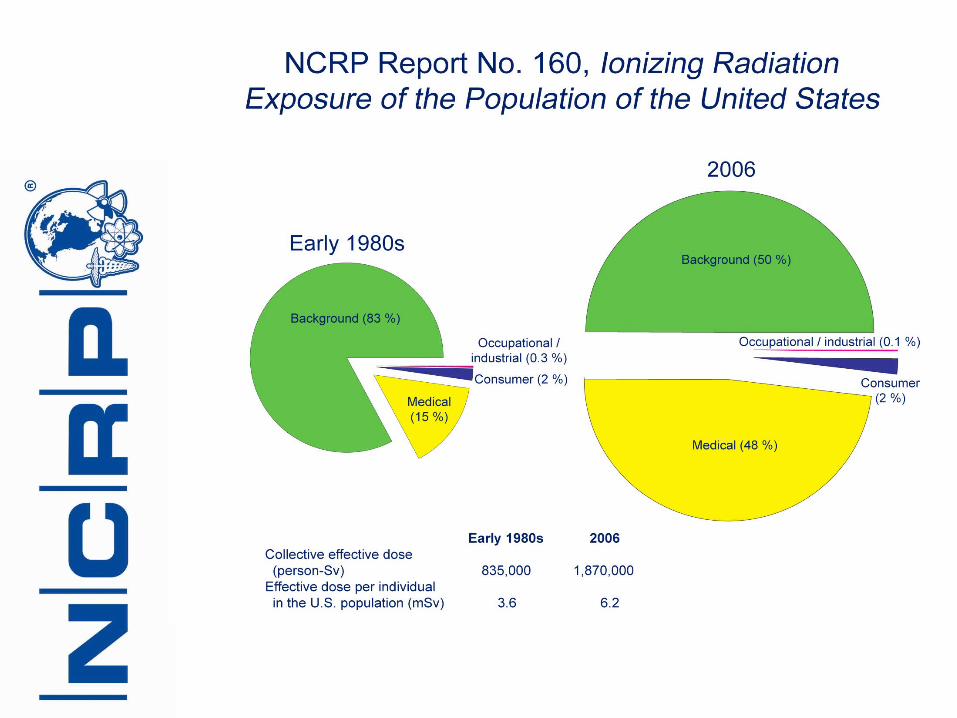
• NCRP Report No. 93 (1987): Exposure of the U.S. population to ionizing radiation as of the early 1980s.
• NCRP Report No. 160 (2009) Exposure of the U.S. population in 2006• Main source of data on the estimates of the
number of procedures:• commercial market benchmark reports by IMV• reports were supplemented by Medicare,
Veterans Administration and a Large National Employer Plan.
• NCRP Report No. 160 (2009), cont.• Effective doses for procedures were derived by a variety of
methods, each of which is described in the respective discussion for the subcategories of medical exposure.• CT, data on dose length product and age and body region specific
conversion coefficients were utilized;• conventional radiography and fluoroscopy, a published survey of
effective dose was applied;• interventional fluoroscopy, data on KAP and protocol specific
dose conversion coefficients were utilized; and• nuclear medicine, data on dose conversion coefficients
expressed as effective dose per unit administered activity were utilized.
• Data reported as:• collective effective dose (S) (person-Sv);
• and effective dose per individual in the U.S. population (EUS) (mSv).

Category Effective Dose per Scan
(mSv)
Head 2
Chest 7
Abdomen & pelvis 10
Extremity 0.1
Virtual colonography 10
Whole-body screening 10
Calcium scoring 2
Angiography – Head 5
Angiography – Heart 20
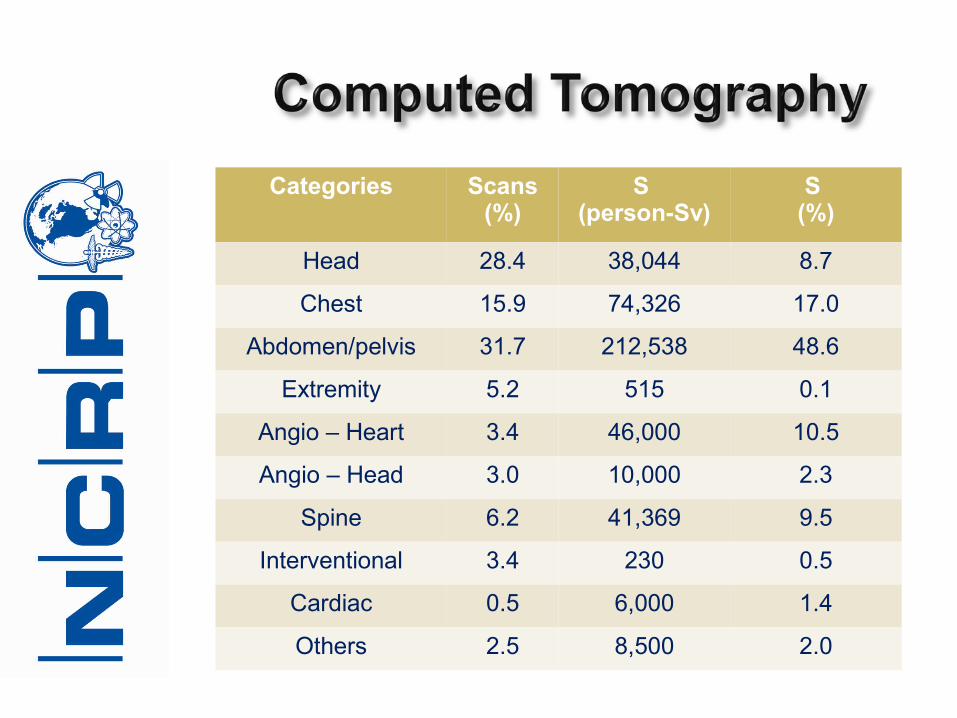
Categories Scans (%)
S (person-Sv)
S (%)
Head 28.4 38,044 8.7
Chest 15.9 74,326 17.0
Abdomen/pelvis 31.7 212,538 48.6
Extremity 5.2 515 0.1
Angio – Heart 3.4 46,000 10.5
Angio – Head 3.0 10,000 2.3
Spine 6.2 41,369 9.5
Interventional 3.4 230 0.5
Cardiac 0.5 6,000 1.4
Others 2.5 8,500 2.0
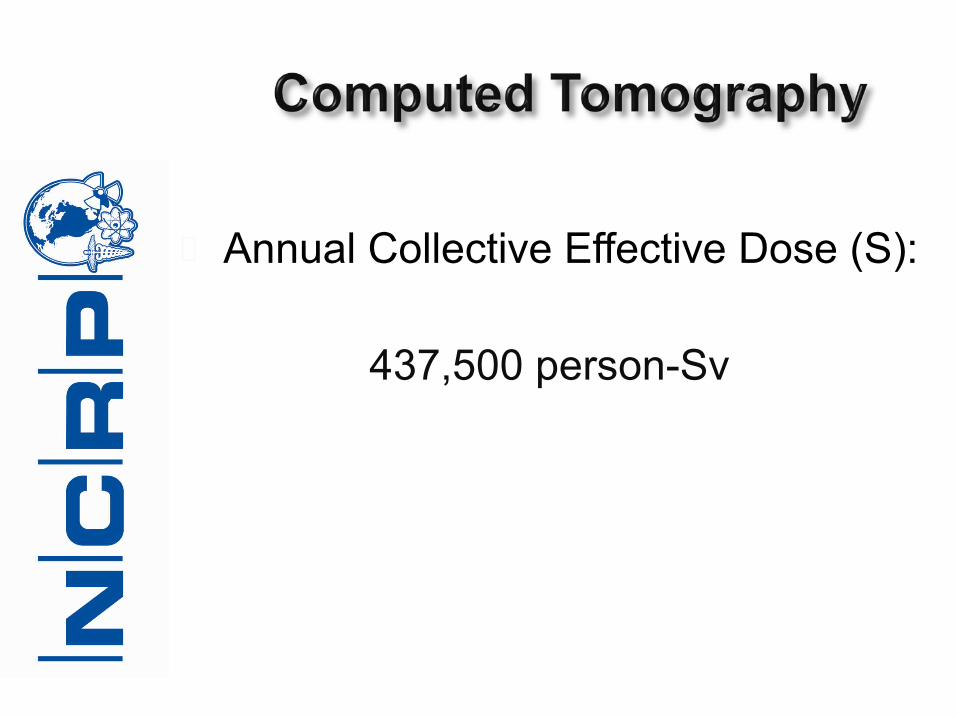
Annual Collective Effective Dose (S):
437,500 person-Sv

Examination Effective Dose (mSv)
No. Exams(1000)
S (person-Sv)
S (%)
Chest 0.1 128,944 12,894 12.8
Breast 0.18 (0.42) 34,500 6,210 (14,490) 6.2
Cervical Spine 0.2 5,800 1,160 1.2
Thoracic Spine 1.0 2,590 2,590 2.6
Lumbar Spine 1.5 11,197 16,796 16.7
Upper GI 6.0 4,044 24,264 24.1
Abdomen 0.7 14,964 10,475 10.4
Barium Enema 8.0 656 5,248 5.2
IVP 3.0 1,180 3,540 3.5
Pelvis & Hip 0.6 – 0.7 19,963 13,156 13.1
Other exams 0.005 – 1.7 58,131 1,613 0.7
Dental 0.005 (0.21) 500,000 2,528 (10,500) 2.8

Annual Collective Effective Dose (S):
100,500 person-Sv
(116,800 person-Sv using ICRP 2007 weighting factors for breast and
dental exposures)

Annual Collective Effective Dose (S):
128,400 person-Sv
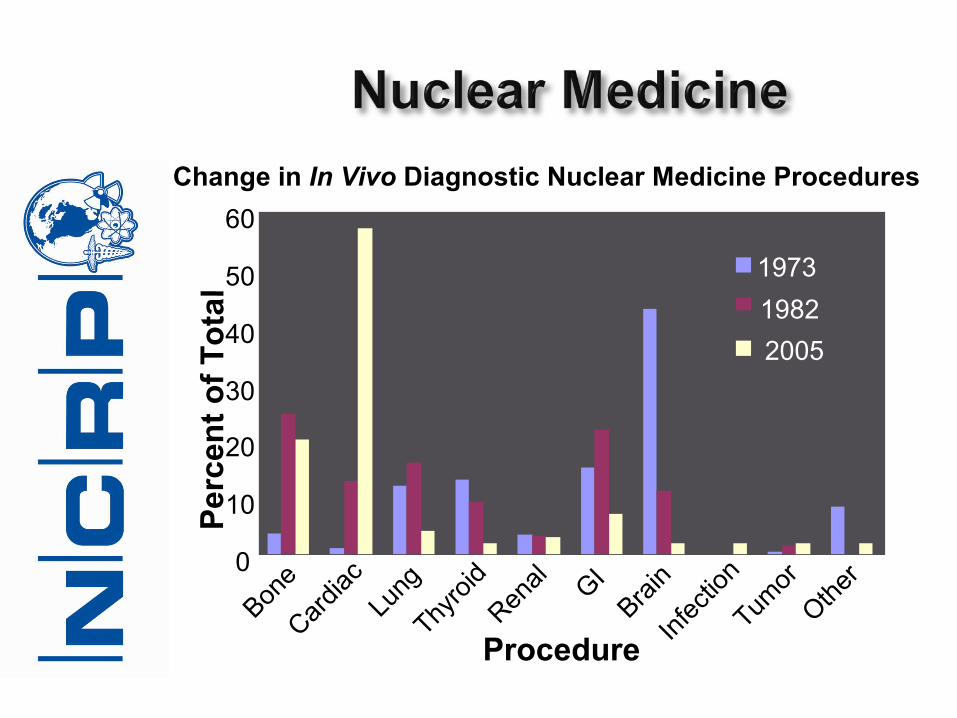
Change in In Vivo Diagnostic Nuclear Medicine Procedures
0
10
20
30
40
50
60
Bone
Cardia
cLu
ng
Thyro
id
Renal GI
Brain
Infe
ction
Tumor
Other
Procedure
Per
cen
t o
f T
ota
l
1973
1982
2005
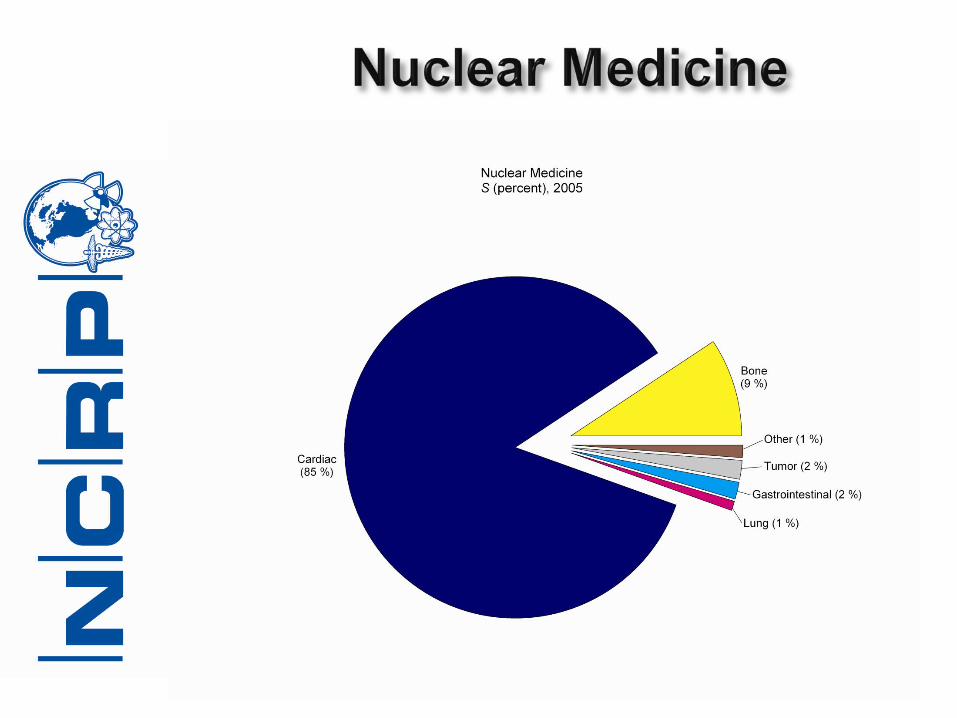

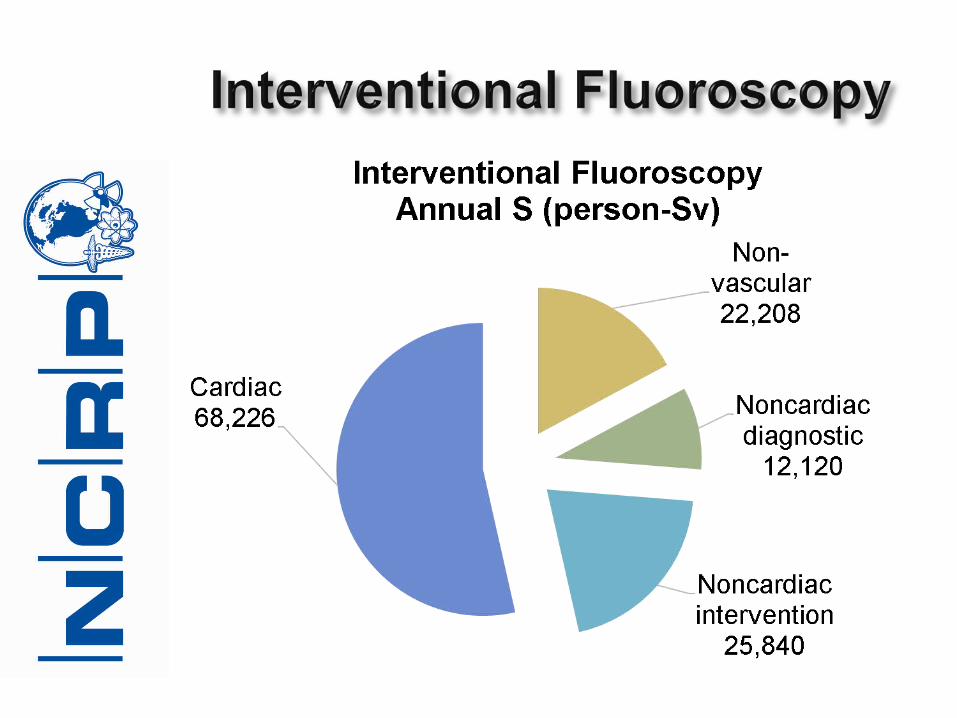
Annual Collective Effective Dose (S):
220,500 person-Sv

Six subcategories grouped by the nature of employment and associated type of source: medical; medical; aviation; commercial nuclear power; industry and commerce; education and research; and government, DOE and military.
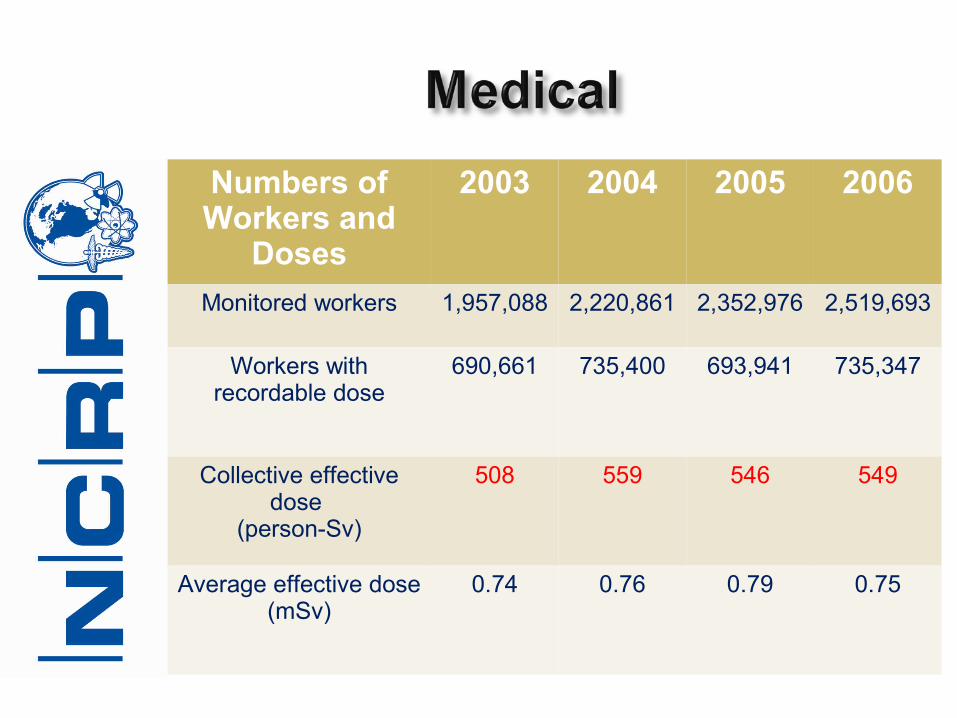
Numbers of Workers and
Doses
2003 2004 2005 2006
Monitored workers 1,957,088 2,220,861 2,352,976 2,519,693
Workers with recordable dose
690,661 735,400 693,941 735,347
Collective effective dose
(person-Sv)
508 559 546 549
Average effective dose (mSv)
0.74 0.76 0.79 0.75


ExposureCategory
S(person-Sv)
EUS
(mSv)
Background 933,000 3.11
Medical 899,000 3.00
Consumer, etc.
39,000 0.13
Industrial, etc.
1,000 0.003
Occupational 1,400 0.005
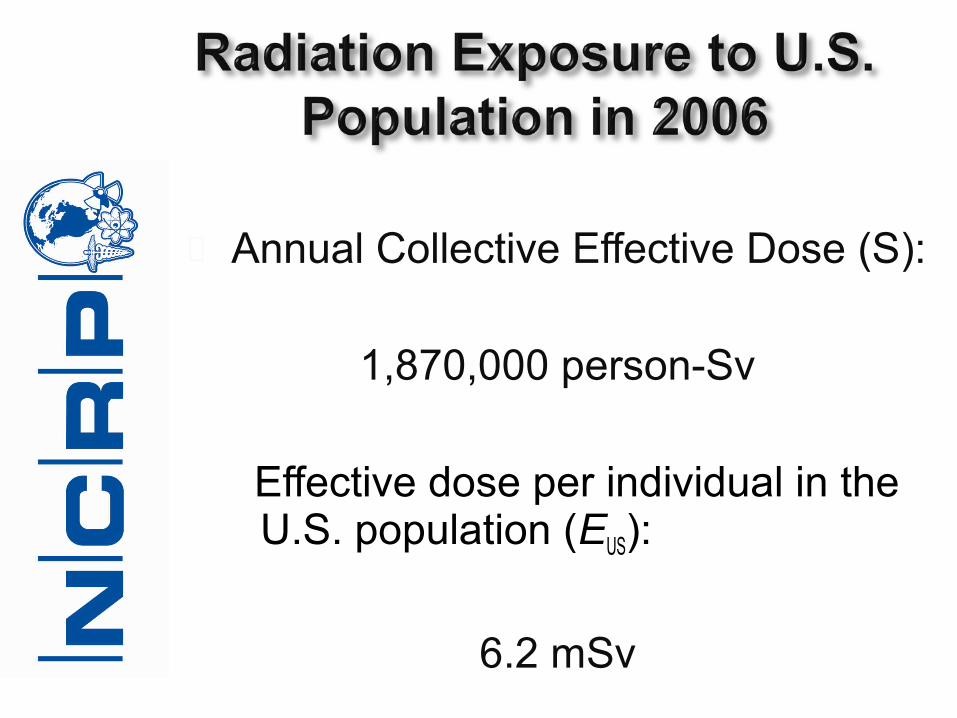
Annual Collective Effective Dose (S):
1,870,000 person-Sv
Effective dose per individual in the U.S. population (EUS):
6.2 mSv

Informing a Wider AudienceInforming a Wider Audience(Scientific American – May 2011)(Scientific American – May 2011)
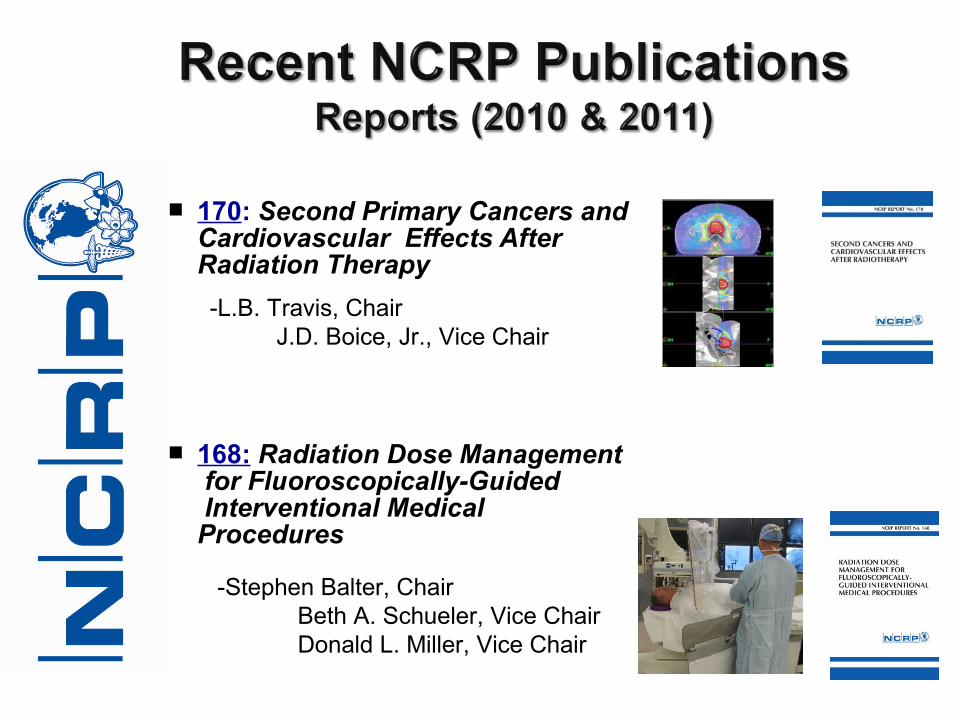
170: Second Primary Cancers and Cardiovascular Effects After Radiation Therapy
168: Radiation Dose Management for Fluoroscopically-Guided Interventional Medical Procedures
-L.B. Travis, Chair J.D. Boice, Jr., Vice Chair
-Stephen Balter, Chair Beth A. Schueler, Vice Chair Donald L. Miller, Vice Chair


