MMi Dashboard www.mmiprices.com Page 1/6 Iron Ore Price Indices Exchange Traded Contracts Freight Rates Steel Price Steel Price Inventory Levels MMi Daily Iron Ore Index Report 3 0.48% February 7th, 2020 Iron Ore Port Stock (FOT Qingdao) IOPI62 62% Fe Fines RMB/t 634 4 0.51% February 7th, 2020 781 Iron Ore Port Stock (FOT Qingdao) IOPI65 65% Fe Fines RMB/t 8 1.47% February 7th, 2020 554 Iron Port Stock (FOT Qingdao) IOPI58 58% Fe Fines RMB/t 0.35 0.42% February 7th, 2020 83.10 Iron Ore Seaborne (CFR Qingdao) IOSI62 62% Fe Fines USD/dmt 0.50 0.51% February 7th, 2020 Iron Ore Seaborne (CFR Qingdao) IOSI65 65% Fe Fines USD/dmt 98.90 -69 -7.84% Week Ending February 7th, 2019 811 Iron Ore Port Stock (FOT Qingdao) IOPLI 62.5% Fe Lump RMB/t -3.00 -0.51% February 7th, 2020 (3pm close) DCE Iron Ore 62% Fines 587.00 I2005 (May) RMB/t 0.50 0.62% February 7th, 2020 (5.30 pm Print) March'20 USD/dmt SGX Iron Ore (CFR Qingdao) 62% Fe Fines 80.71 21.00 0.64% February 7th, 2020 (3pm close) SHFE Rebar RB2005 (May) RMB/t 3325 -0.10 -0.66% February 6th, 2020 14.33 C3, Tubarao - Qingdao USD/t -0.05 -0.85% February 6th, 2020 C5, W. Australia - Qingdao USD/t 5.83 0 0.00% Week Ending January 17th, 2019 Steel Rebar (China Domestic) RMB/t 3750 1.96 1.71% Week Ending February 7th, 2020 Iron Ore Inventory at Chinese Ports (35) million tonnes 116.36 1.34 12.60% Week Ending January 17th, 2019 Steel Inventory in China million tonnes 11.95 -20 -0.51% Week Ending January 17th, 2019 Steel HRC (China Domestic) RMB/t 3880 February 7th, 2020 February 7th, 2020
Transcript
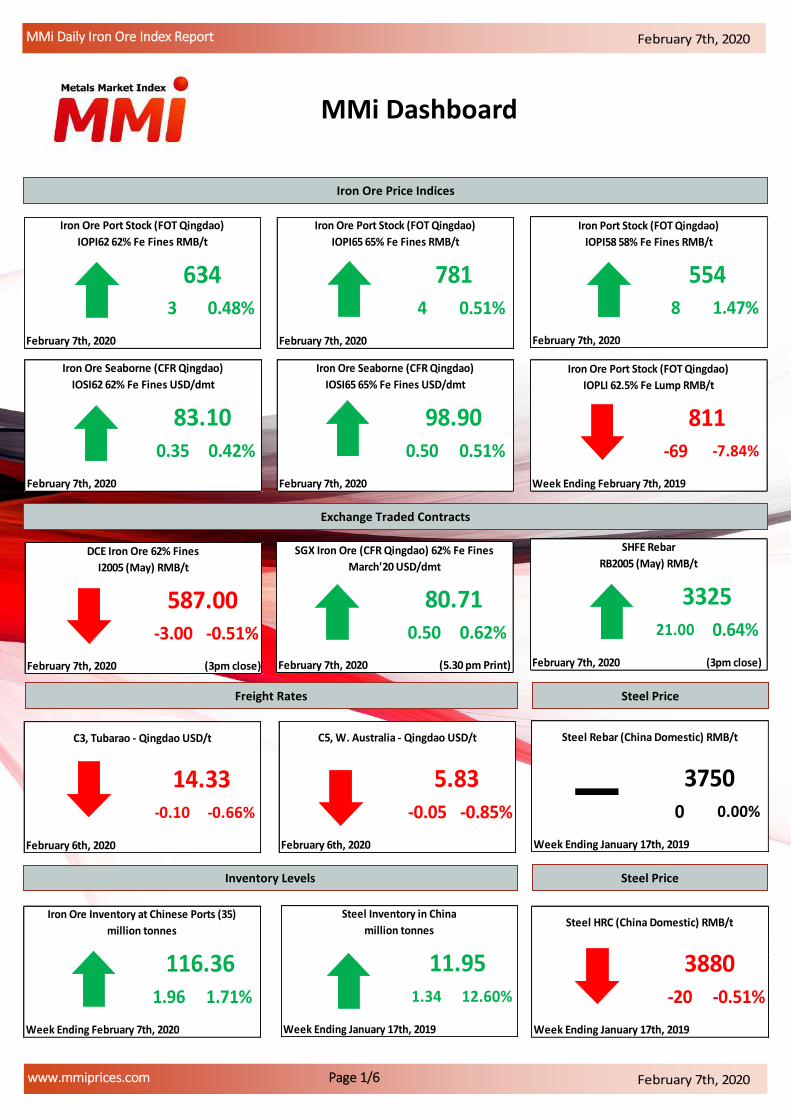
MMi Dashboard
www.mmiprices.com Page 1/6
Iron Ore Price Indices
Exchange Traded Contracts
Freight Rates Steel Price
Steel Price Inventory Levels
MMi Daily Iron Ore Index Report
3 0.48%
February 7th, 2020
Iron Ore Port Stock (FOT Qingdao)
IOPI62 62% Fe Fines RMB/t
6344 0.51%
February 7th, 2020
781
Iron Ore Port Stock (FOT Qingdao)
IOPI65 65% Fe Fines RMB/t
8 1.47%
February 7th, 2020
554
Iron Port Stock (FOT Qingdao)
IOPI58 58% Fe Fines RMB/t
0.35 0.42%
February 7th, 2020
83.10
Iron Ore Seaborne (CFR Qingdao)
IOSI62 62% Fe Fines USD/dmt
0.50 0.51%
February 7th, 2020
Iron Ore Seaborne (CFR Qingdao)
IOSI65 65% Fe Fines USD/dmt
98.90-69 -7.84%
Week Ending February 7th, 2019
811
Iron Ore Port Stock (FOT Qingdao)
IOPLI 62.5% Fe Lump RMB/t
-3.00 -0.51%
February 7th, 2020 (3pm close)
DCE Iron Ore 62% Fines
587.00
I2005 (May) RMB/t
0.50 0.62%
February 7th, 2020 (5.30 pm Print)
March'20 USD/dmt
SGX Iron Ore (CFR Qingdao) 62% Fe Fines
80.7121.00 0.64%
February 7th, 2020 (3pm close)
SHFE Rebar
RB2005 (May) RMB/t
3325
-0.10 -0.66%
February 6th, 2020
14.33
C3, Tubarao - Qingdao USD/t
-0.05 -0.85%
February 6th, 2020
C5, W. Australia - Qingdao USD/t
5.830 0.00%
Week Ending January 17th, 2019
Steel Rebar (China Domestic) RMB/t
3750
1.96 1.71%
Week Ending February 7th, 2020
Iron Ore Inventory at Chinese Ports (35)
million tonnes
116.361.34 12.60%
Week Ending January 17th, 2019
Steel Inventory in China
million tonnes
11.95-20 -0.51%
Week Ending January 17th, 2019
Steel HRC (China Domestic) RMB/t
3880
February 7th, 2020
February 7th, 2020
MMi Daily Iron Ore Index Report
IRON ORE PORT STOCK INDEX (IOPI)
IRON ORE PORT LUMP INDEX (IOPLI)
IRON ORE DOMESTIC CONCENTRATE SPOT PRICE ASSESSMENTS AND COMPOSITE INDEX
MARKET COMMENTARY
SMM data showed that iron ore stocks across 35 Chinese ports totalled 116.36 million mt as of February 7, up 1.96 million mt
from pre-holiday levels, but 12.76 million mt lower than a year ago. Daily average deliveries from the 35 ports decreased
364,000 mt from pre-holiday levels to 2.55 million mt this week. Staff at most companies worked at home due to the epidemic.
Sharp decline in iron ore prices in the spot and futures markets side-lined traders. Steel mills in Shandong and south China
showed little buying interest due to transportation restrictions. Daily average deliveries from Jingtang port, Tangshan recovered
to over 300,000 mt after the transport ban was lifted on February 1, while daily average deliveries from Caofeidian port
remained around 200,000 mt.
COPYRIGHT METALS MARKET INDEX, ALL RIGHTS RESERVED
Open positions ('000 lots) 56.11 0.29 0.51% 132.53 7.83 6.27%
Day Low 579.5 5.0 0.87% 78.11 0.76 0.98%
Day High 591.5 -2.0 -0.34% 80.81 0.55 0.69%
DCE (RMB/WMT) SGX (USD/DMT)
Feb 7th 3.00 pm close Feb 7th, 5.30 pm
COPYRIGHT METALS MARKET INDEX, ALL RIGHTS RESERVED
CHINESE STEEL MILL PROFITABILITY
CHINESE STEEL MILL PROFITABILITY
STEEL SPOT MARKET PRICES—CHINA
MMi Daily Iron Ore Index Report
www.mmiprices.com Page 5/6
CHINESE STEEL MILL PROFITABILITY
CHINESE STEEL INVENTORIES
February 7th, 2020
February 7th, 2020
Steel Spot Market RMB/tonne
Product 17/1/2020 Change Change %
3,750.0 0 0.00%
3,830.0 0 0.00%
3,880.0 -20 -0.51%
4,470.0 0 0.00%
3,870.0 0 0.00%
4,590.0 0 0.00%
6,900.0 0 0.00%
GI ST02Z 1.0mm*1000*C
ReBar HRB400 ɸ18mm
Wirerod Q300 ɸ6.5mm
HRC Q235/SS400 5.5mm*1500*C
CRC SPCC/ST12 1.0mm*1250*2500
Medium & Heavy Plate Q235B 20mm
Colour Coated Plate
0
2
4
6
8
10
12
14
16
18
mil
lion
mt
Total Social Steel Inventory Total Steel Inventory at Steel Mills
0
200
400
600
800
1,000
1,200
RMB/
tonn
e
Rebar Profit for BOF Mill HRC Profit for BOF Mill
Category Price Change (WoW)
97.00 1.90 Mmi CFR Equivalent index for 1st Feb
1,960 0 2nd grade met coke, Tangshan, incl. tax
2,290 0 steel scrap (6mm) in Zhangjiagang, exl. tax
3,089 14 Q234, incl. tax
3,322 14 calculated based on theoretical w eight, incl. tax
358 -54 based on Shanghai prices, incl. tax
3,406 15 based on actual w eight, incl. tax
474 -35 based on Shanghai prices, incl. tax
Note: 1. Costs in the table are caluclated based on todays market prices and facout our management, sales, financial and depreciations fees.
2. The cost refers to average cost in the industry based on SM M 's survey of small, medium and large mills in China
Hot-rolled coil cost - Blast furnace
Hot-rolled coil proft - Blast furnace
Rebar cost - Blast furnace
Rebar profit - Blast furnace
Note
MMi (Fe 62%), USD/mt exluding tax
Coke
Steel Scrap
Billet Cost
SMM Tracking of Steel Mill P&L - Rebar and Hot-rolled Coil (RMB/tonne)
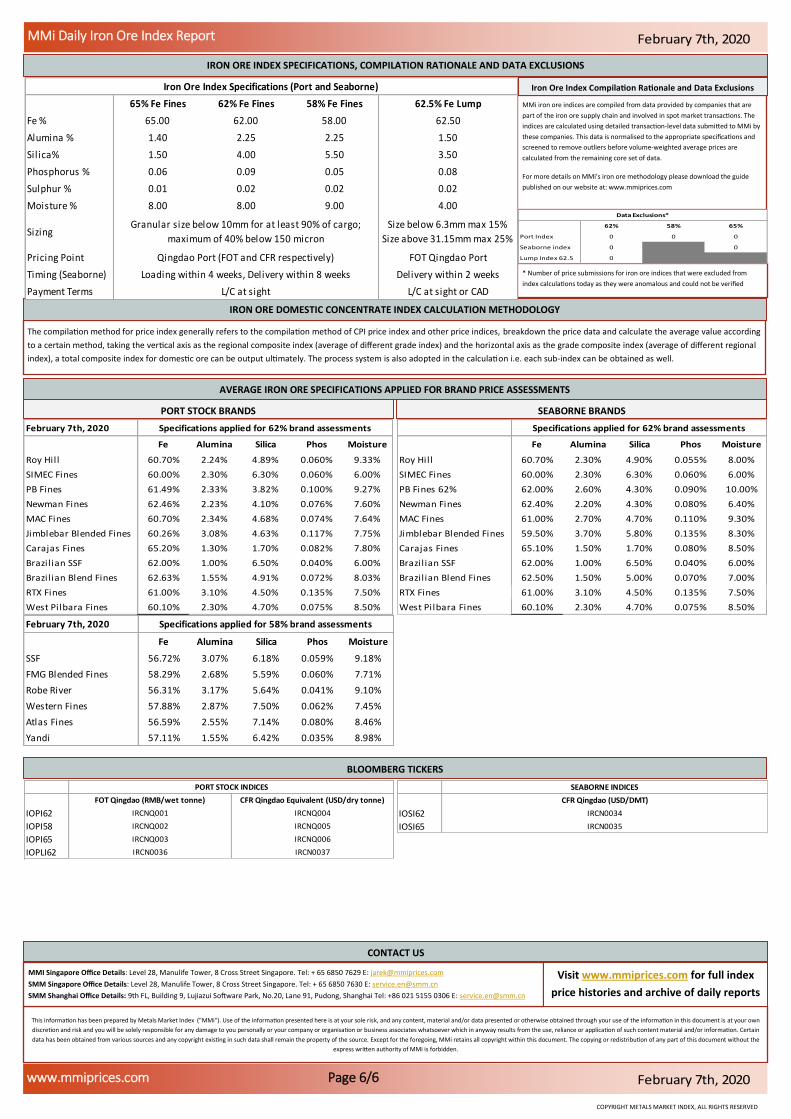
IRON ORE INDEX SPECIFICATIONS, COMPILATION RATIONALE AND DATA EXCLUSIONS
The compilation method for price index generally refers to the compilation method of CPI price index and other price indices, breakdown the price data and calculate the average value according
to a certain method, taking the vertical axis as the regional composite index (average of different grade index) and the horizontal axis as the grade composite index (average of different regional
index), a total composite index for domestic ore can be output ultimately. The process system is also adopted in the calculation i.e. each sub-index can be obtained as well.
IRON ORE DOMESTIC CONCENTRATE INDEX CALCULATION METHODOLOGY
MMi iron ore indices are compiled from data provided by companies that are
part of the iron ore supply chain and involved in spot market transactions. The
indices are calculated using detailed transaction-level data submitted to MMi by
these companies. This data is normalised to the appropriate specifications and
screened to remove outliers before volume-weighted average prices are
calculated from the remaining core set of data.
For more details on MMi's iron ore methodology please download the guide
published on our website at: www.mmiprices.com
This information has been prepared by Metals Market Index ("MMi"). Use of the information presented here is at your sole risk, and any content, material and/or data presented or otherwise obtained through your use of the information in this document is at your own
discretion and risk and you will be solely responsible for any damage to you personally or your company or organisation or business associates whatsoever which in anyway results from the use, reliance or application of such content material and/or information. Certain
data has been obtained from various sources and any copyright existing in such data shall remain the property of the source. Except for the foregoing, MMi retains all copyright within this document. The copying or redistribution of any part of this document without the