41
IOR-EOR potential in Mexico 1 Dr. Edgar Rangel German II Seminario Latinoamericano y del Caribe de Petróleo y Gas Montevideo, Uruguay July 2012
IOR-EOR potential in Mexico
1
Dr. Edgar Rangel German II Seminario Latinoamericano y del Caribe
de Petróleo y Gas Montevideo, Uruguay
July 2012

The Mexican National Hydrocarbon Commission
• Created by law in 2008.
• According to the Law of the National Hydrocarbons Commission (CNH):
• The CNH should ensure that E&P projects are carried out under the following basis*:
2
“The CNH has the fundamental objective to regulate and supervise the exploration and extraction of hydrocarbons…” (Art. 2)
Increase recovery, obtaining the maximum hydrocarbon volume
Optimize restitution of hydrocarbon reserves
The use of right technology
The environmental protection and sustainability of natural resources
Observe industrial safety.
Minimize flaring and venting of gas and hydrocarbons.
* Article 3 - CNH Law

CNH’s duties*
3
To contribute with technical elements for hydrocarbon policy
To participate in restitution of reserves policy and assess, quantify and verify reserves.
POLICY
To supervise, check, monitor and certify the fulfillment of dispositions.
SUPERVISION
To establish evaluation processes related to operative efficiency.
*Article 4 – CNH Law
To identify technical proposals to optimize recovery factors.
Technical opinion on land assignation or cancelation for exploration and production activities.
OPERATION To establish technical guidelines for projects.
To sanction projects and to establish limits.
To obtain, analyze and keep information and statistics up to date. To establish a petroleum public registry.
INFORMATION
To issue and establish Official Standards.

Government body
Composición de la CNH
4
Commissioner Commissioner
Commissioner
President
Commissioner Commissioner
Presidency
Executive Secretary
Auditing unit
Legal DG*
Hydrocarbons DG
Supervision and Control
DG*
Standardization DG*
Operation DG
* Not yet established
Each Commissioner is responsible for specific affairs

World hydrocarbons resources
• From some 7 to 8 trillion barrels of conventional oil, 3.3 trillion barrels are considered technically recoverable, and 1 trillion have already been produced.
• Seven trillion of non-conventional (heavy oil, bitumen, oil sands, and oil shales). Estimated technically recoverable quantities vary from 1 trillion to 3 trillion barrels; roughly 0.01 trillion barrels have been produced to date.
5
Source: IEA
• From some 7 to 8 trillion barrels of conventional oil, 3.3 trillion barrels are considered technically recoverable, and 1 trillion have already been produced.
• Seven trillion of non-conventional (heavy oil, bitumen, oil sands, and oil shales). Estimated technically recoverable quantities vary from 1 trillion to 3 trillion barrels; roughly 0.01 trillion barrels have been produced to date.

Sources of energy
Source: International Energy Agency (IEA) . World Energy Outlook 2011.
Forecasts for 2035
Hydrocarbons (and in general fossil fuels) will be highly needed in the long term; however, there have not been many discoveries of
supergiant or giant fields, and probably there will not be…
6
16% 25% 22% 11% 27%
24% 27% 23% 7% 18%
30% 27% 23% 6% 14%
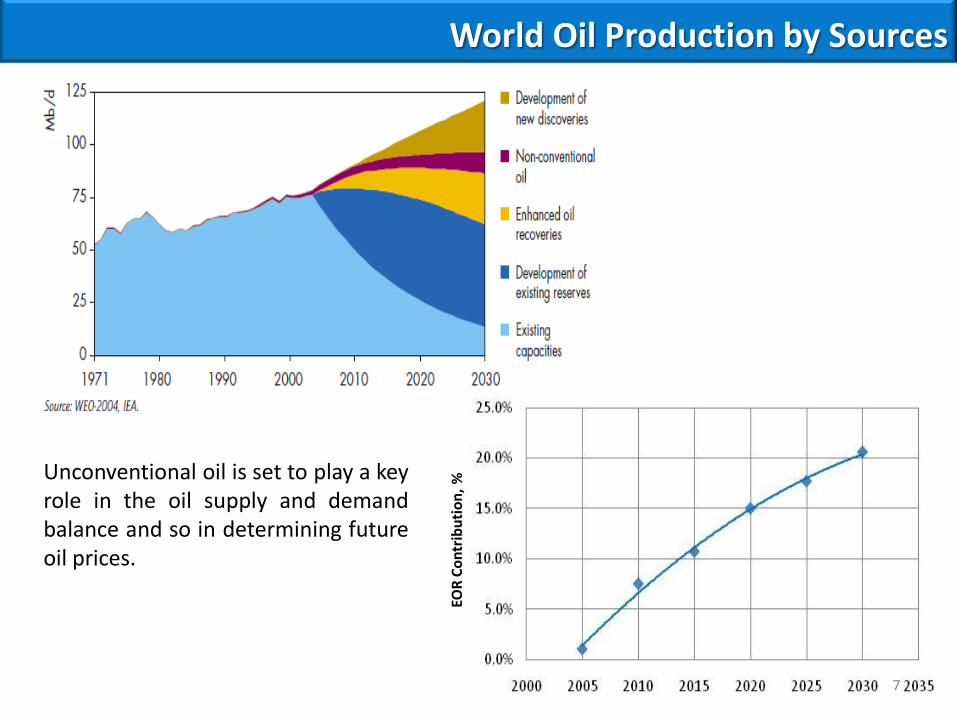
World Oil Production by Sources
EOR
Co
ntr
ibu
tio
n,
% Unconventional oil is set to play a key
role in the oil supply and demand balance and so in determining future oil prices.
7

Volume of Hydrocarbons in Mexico
Cumulative Production
14% (39,695 mmb)
Proved Reserve
(10,025 mmb)
Remaining Volume
79% (216,219mmb)
Prospective Volume*
7% (18,621 mmb)
Mexico Oil Volumes, RF=15.5% Volumes reported at January
2012 Oil
[mmb] Gas
[mmmcf]
Original Hydrocarbon in Place 255,913 257,484
Cumulative Production 39,695 69,255
Proved Reserve 10,025 17,224
Remaining Volume 216,219 188,228
Prospective Volume (@ 2010) 18,621 29,763
(10%_RV+1P)/1P 3.2 2.1
If we could recover 10% of the remaining oil in place, we can triple the proved reserve (1P).
8

Mexico’s Proved Reserves (Oil Equivalent)
1P, By Region
1P, By Asset
9

Oil Resources and Oil Recovery Factors of the Fields in Mexico
0.01
0.10
1.00
10.00
100.00
1,000.00
10,000.00
100,000.00
0% 10% 20% 30% 40% 50% 60%
Rem
ain
ing
Oil
in P
lace
, mm
b
Recovery Efficiency, % OOIP
• Numerous multi-billion barrel potential EOR projects
• Some will require both reservoir technology and completion technology
10

Some quick definitions…
Enhanced Oil Recovery
(EOR)
Methods that require external sources of energy or
injection of fluids (and/or materials) to recover oil that
cannot be produced by conventional methods (like
Primary or
Secondary recovery).
Improved Oil Recovery (IOR) In addition to EOR methods, IOR also includes the application and optimization of a wide range of advanced techniques such as reservoir characterization, reservoir management, and infill drilling.
11

Incremental Recovery Efficiency…
% Thermal Chemical Solvents
60-65 Steam Drive
(~0.5 bl per barrel)
55-60 SAGD(~3 bl per
barrel)50-55
45-50 Combustion(10 mcf of
air per barrel)
40-45
35-40
30-35 Cyclic Steam
Injection(~2 barrels consumed per barrel)
Alkaline /Surfactant/
Polymer(35-45 lb of chemical per barrel )
25-30Micellar-Polymer
–surfactant-(15-25 lb of
surfactant per barrel )
20-25
15-20 Miscible (4~10 mcf per barrel)
10-15 Polymer(1 lb of
polymerper
barrel )5-10 Immiscible
(~ 10 mcf per barrel)
12

Breaking an old paradigm…
Primary Recovery
Rock-fluid expansion
Solution gas drive Aquifer drive Gas cap drive
Gravity Drainage +Artificial lift systems
Secondary Recovery
Water drive
Pressure maintenance (immiscible gas injection)
Tertiary Recovery
Any method applied after
secondary recovery: Miscible Thermal Chemical
Others
We must break a historical paradigm that prescribes that recovery methods should follow a chronological order. Oil field development plans must include any necessary
recovery method, at any given stage, and in any given order, to maximize recovery efficiency
IOR + EOR 13

Mexico’s largest oil field Cantarell (NFR): carbonate, highly fractured
oil matrix-fracture distribution Given the nature of this reservoir, most of the
production has come from the fracture system.
Large vugs
Highly fractured reservoir (fractures with huge permeability)
Tight matrix (very low permeability)
The EOR strategy for Cantarell is to expel the oil from the matrix by means of miscible and
chemical - surfactant/polymer flooding, taking advantage of existing gravity drainage.
Cantarell’s Akal reservoir
14
Cantarell: From 2.183 mmmbpd in 2003 to 450 mmbpd today (260,000 of Akal). KMZ: 860 mmbpd.
62%
38%
90%
10%
1979 2012

Mexico’s largest deposit Chicontepec (sandstone-clay): huge volume, difficult to extract
Some calculations show that this deposit might be about 80 billion barrels of crude oil in-situ. Turbidite-type of deposit. Interbedded sand and clay bodies. Continuity of the sands not well understood. Wells reach Pb very soon after production.
The EOR strategy for Chicontepec should include an aggressive piloting program to test CO2, water and WAG methods.
Eventually combined with IOR.
Chicontepec
• Tight oil reservoirs • Light to heavy oil • Very complex geology • Reservoir pressure very close to
bubble point pressure • Requires effective fracturing 15

Description of technical analysis based on theoretical concepts
• In order to evaluate the potential applicability of the EOR methods, the CNH gathered a database with the characteristics of all the reservoirs in Mexico.
• This database incorporates information of fluid properties, petrophysical properties, rock characteristics, and some technical information commonly not used as solution gas-oil ratio, and some others non-technical as geographic location (onshore, offshore, etc.), all these information could permit to define the integral complexity of the reservoirs.
• It was incorporated the learning analysis of the well-known O&GJ data base 2010, which considers more than 200 EOR projects, reported by international oil companies.
16

Remaining Oil Volume by reservoir in Mexico
0
2,000
4,000
6,000
8,000
10,000
12,000
14,000
16,000
18,000
20,000
0.0%
20.0%
40.0%
60.0%
80.0%
100.0%
120.0%
0 10 20 30 40 50 60 70 80 Number of reservoir ranking
Remaining Oil in Place
% Remaining Oil Volume Remaining Oil Volume, mmb
Rem
ain
ing
oil
volu
me,
mm
b
% R
em
ain
ing
Oil
Vo
lum
e
About 80% of the remaining oil is in 80 reservoirs,
and near 90 % is in 130 reservoirs. 17

Oil Resources and Oil Recovery Factors of the main reservoirs in Mexico
The oil production of the country comes mainly from carbonate rocks, but there are many sandstone rock type reservoirs with huge
potential waiting for EOR-IOR technologies 18

General analysis of the data
Sandstone type :
• Wide range of depths (650-
5000m), mainly with low
viscosities.
• API: 20-45°API (Except; 10°API)
• Viscosity: 0.3-10cP (Except; ~100
y ~1000cP )
• Rsi: the most less 100m3/m3.
Carbonates:
• Wide range of depths (400-
6000m), nevertheless most of
them shallow.
• Wide range of densities: 8 -
~45°API
• Wide range of viscosities: ~0.02 –
~350cP
• Wide range of Rsi: ~10 - ~650
m3/m3
Sandstone type Carbonates 19
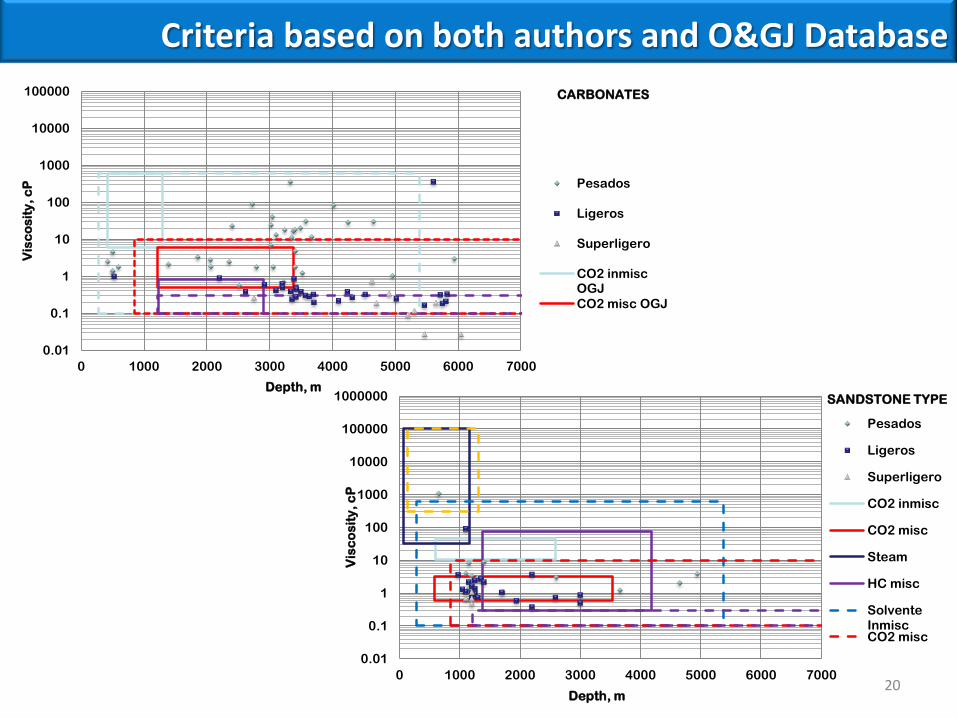
Criteria based on both authors and O&GJ Database
0.01
0.1
1
10
100
1000
10000
100000
0 1000 2000 3000 4000 5000 6000 7000
Vis
co
sit
y,
cP
Depth, m
CARBONATES
Pesados
Ligeros
Superligero
CO2 inmiscOGJ
CO2 misc OGJ
0.01
0.1
1
10
100
1000
10000
100000
1000000
0 1000 2000 3000 4000 5000 6000 7000
Vis
co
sit
y,
cP
Depth, m
SANDSTONE TYPE
Pesados
Ligeros
Superligero
CO2 inmisc
CO2 misc
Steam
HC misc
SolventeInmiscCO2 misc
20

Description of the O&GJ database statistical analysis
• The O&GJ database considers more than 200 EOR projects, 12 different EOR technologies, that were carried out in 9 countries and developed by a total of 44 oil companies.
• It considers fluid and rock properties like; porosity, permeability, depth, oil density and viscosity, temperature, and initial fluid saturations.
• After analyzing the information of the O&GJ DB, it was established that the independent variable for the linear regression model would be:
(Sat_i – Sat_f)/ Sas_i
• Data mining techniques were applied to obtain significant information about the relevant parameters that describe better the field EOR experience of the international oil companies.
21

Linear regression model
=== Cross-validation ===
=== Summary ===
Correlation coefficient 0.9756
Mean absolute error 0.0379
Root mean squared error 0.0545
Relative absolute error 17.29%
Root relative squared error 21.73%
Total Number of Instances 131
The explanation power of the proposed model has a correlation coefficient of 97% and
consequently the predicted values are no-considerable deviated from the actual ones.
22
• Linear regression model
• Classification and Regression Trees (CART)
Bifurcates data recursively in critical values of the explaining variables,
partitioning them in heterogeneous groups which are homogeneous within.
y = (Sat Inic – Sat Fin)/Sat Inic
Si n=18
n=26n=87
Non=113
Hydrocarbon miscible
Sat Start(%)
n=131
y=.77y=.45
y=.51 y=.27
y=.50
<79 >=79
n=19n=7
Permeability(mD)
y=.43 y=.21
>=815<815n=54n=33
Depth(mts)
y=.69
<1850y=.40
>=1850
n=18n=36
Permeability(mD)
y=.45
<26 >=26y=.31
n=21n=15
Gravity(oAPI)
y=.52
<32.5>=32.5
y=.40
n=9n=12
Porosity(%)
y=.34
<15.25y=.48
>=15.25
n=26n=7
Temperature(oF)
y=.56>=83.5
y=.72
<83.5

Cluster analysis
• Projects are grouped according their Euclidean distance with the cluster center.
• These centroids (mean) are recalculated and new values for the centers are obtained.
• This iteration continues until the projects are assigned to the same clusters and their centroid are stabilized.
y
x
Total Cluster1 Cluster2
Proyectos_# 131 65 66
Porosity_% 23 12 34
Permeability_mD 1,176 337 2,003
Depth_mts 3,856 6,227 1,521
Gravity_API 25 37 13
Viscosity_cp 2,138 1 4,242
Temperature_F 126 147 105
Satur Start_% 64 58 70
Satur end_% 32 25 39
CO2 immiscible 2% 2% 2%
CO2 miscible 29% 58% 0%
Combustion 7% 12% 2%
Hot water 2% 0% 3%
Hydrocarbon miscible 14% 28% 0%
Polymer 1% 0% 2%
Steam 47% 0% 92%
Dolo. 28% 57% 0%
Dolo./LS. 8% 17% 0%
Dolo./Tripol.itic chert 1% 2% 0%
LS 4% 8% 0%
S 49% 11% 86%
Tripol. 3% 6% 0%
US 7% 0% 14%23

Scoring (Naive Bayes)
P>50%
There are 4 cases that the model misclassify, that’s it a precision of 82%!
It uses the frequency of discrete variables and assumes that continuous ones are distributed normally. In addition, the explanatory variables are independent (Naive?)
The following are the projects that the model assigns a probability of having a change in saturation above 50%:
24

Scoring (Naive Bayes), cont…
These are the projects with a probability of less than 50% of having a change in saturation above 50%
P<50%
Just 2 success cases that are misclassified (1%)!! 25
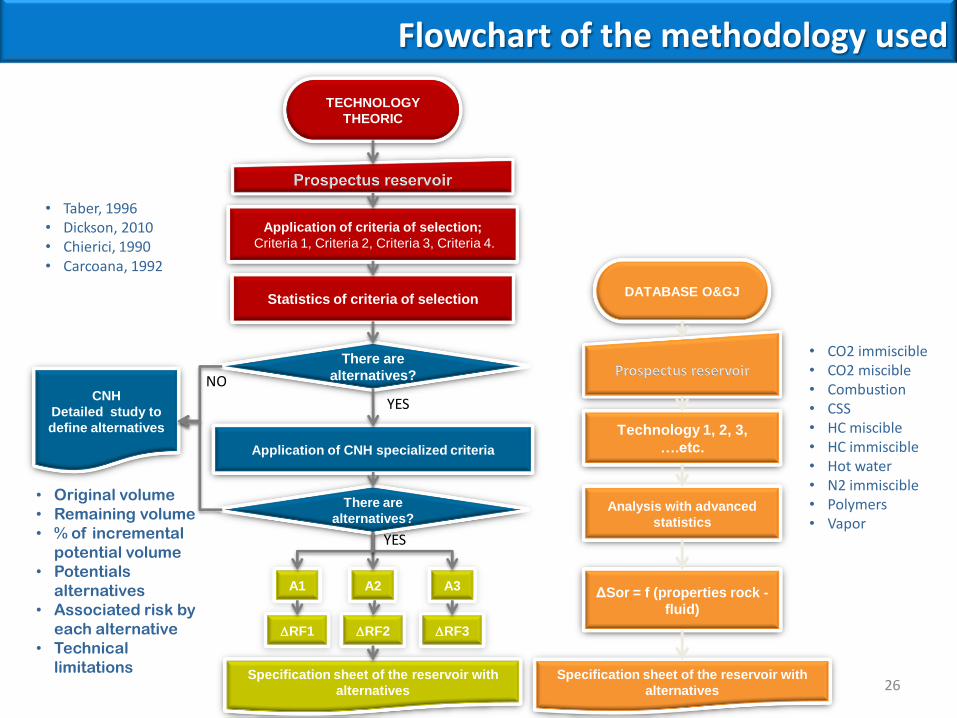
Flowchart of the methodology used
TECHNOLOGY
THEORIC
There are
alternatives?
CNH
Detailed study to
define alternatives
Application of CNH specialized criteria
A1
A2
A3
DRF1
DRF2
DRF3
Specification sheet of the reservoir with
alternatives
Application of criteria of selection;
Criteria 1, Criteria 2, Criteria 3, Criteria 4.
Statistics of criteria of selection
There are
alternatives?
DATABASE O&GJ
ΔSor = f (properties rock -
fluid)
Specification sheet of the reservoir with
alternatives
Technology 1, 2, 3,
….etc.
Analysis with advanced
statistics
• Taber, 1996 • Dickson, 2010 • Chierici, 1990 • Carcoana, 1992
• Original volume
• Remaining volume
• % of incremental
potential volume
• Potentials
alternatives
• Associated risk by
each alternative
• Technical
limitations
• CO2 immiscible • CO2 miscible • Combustion • CSS • HC miscible • HC immiscible • Hot water • N2 immiscible • Polymers • Vapor
YES
NO
YES
26

Mexico’s remaining oil by reservoir
• 19 at Ku-Maloob-Zaap / 31,979 MMB.
• 17 at Poza Rica-Altamira / 18,176 MMB.
• 12 at Abkatún-Pol-Chuc / 9,547 MMB.
• 14 at Litoral Tabasco / 7,295 MMB.
• 8 at Cantarell / 21,762 MMB.
• 7 at Samaria-Luna / 6,814 MMB.
• 4 at Macuspana-Muspac / 2,027 MMB.
• 5 at Bellota-Jujo / 4,883 MMB.
• The 90% of the remaining oil volume (188,093MMB), is in 129 reservoirs. • We need to develop a Strategy for Fractured Carbonates and for Chicontepec’s reservoirs
43 sandstone type / 85,611 MMB
86 carbonates/ 102,482 MMB Miscible hydrocarbons, Miscible CO2 and Immiscible gas
• 28 at ATG / 78,448 MMB Combustion, Immiscible gas, SP, ASP, Alkaline, Miscible CO2 and steam
• 6 at Cinco Presidentes / 2,757 MMB Miscible hydrocarbons, Miscible CO2 , Immiscible gas, Combustion, SP, ASP and Alkaline.
• 2 at Cantarrell / 1,267 MMB Miscible hydrocarbons, Miscible CO2 and Immiscible gas
• 4 at Ku-Maloob-Zaap / 1,957 MMB Miscible CO2 and Immiscible gas.
• 2 at Litoral Tabasco/ 535 MMB Miscible hydrocarbons, Miscible CO2 and Immiscible gas
• 1 at Samaria-Luna / 647 MMB Steam
46%
54%
Siliciclasticos Carbonatos
27

Results
Assets
Original
volume
(mmb)
Remaining
volume
(mmb)
Volume to be
recovered
with
pessimistic
method
(mmb)
Volume to be
recovered
with
optimistic
method
(mmb)
Average of
Volume to be
recovered
(mmb)
10%
Recovered
(mmb)
Ku-Maloob-Zaap 37450 33936 1076 2872 1974 3394
Carbonates 35469 31979 978 1991 1485 3198
Heavy 35469 31979 978 1991 1485 3198
Sandstone type 1981 1957 98 881 489 196
Heavy 1981 1957 98 881 489 196
Cantarell 36884 23028 1215 2497 1856 2303
Carbonates 35480 21762 1088 2244 1666 2176
Light 784 680 34 136 85 68
Heavy 34696 21082 1054 2108 1581 2108
Sandstone type 1404 1267 127 253 190 127
Heavy 1404 1267 127 253 190 127
Poza Rica-Altamira 22247 18176 581 1667 1124 1818
Carbonates 22247 18176 581 1667 1124 1818
Light 7654 5568 253 1013 633 557
Heavy 14593 12608 327 655 491 1261
Abkatún-Pol-Chuc 14882 9547 477 1763 1120 955
Carbonates 14882 9547 477 1763 1120 955
Light 13420 8086 404 1617 1011 809
Heavy 1461 1461 73 146 110 146 28

Results (Cont.)
Assets Original volume
(mmb)
Remaining
volume (mmb)
Volume to be
recovered with
pessimistic
method (mmb)
Volume to be
recovered with
optimistic
method (mmb)
Average of
Volume to be
recovered (mmb)
10% Recovered
(mmb)
Litoral de
Tabasco 8147 7830 406 1565 985 783
Carbonates 7607 7295 365 1396 880 730
Light 3695 3455 173 691 432 345
Heavy 1231 1231 62 183 122 123
Extralight 2681 2609 130 522 326 261
Sandstone type 540 535 41 170 105 53
Light 255 250 13 113 63 25
Heavy 284 284 28 57 43 28
Samaria-Luna 10697 7461 373 1783 1078 746
Carbonates 10048 6814 341 1363 852 681
Light 6380 4144 207 829 518 414
Extralight 3668 2669 133 534 334 267
Sandstone type 649 647 32 421 227 65
Heavy 649 647 32 421 227 65
Bellota-Jujo 6571 4883 244 977 610 488
Carbonates 6571 4883 244 977 610 488
Light 5046 3776 189 755 472 378
Extralight 1526 1107 55 221 138 111
Cinco
Presidentes 3621 2757 138 1020 579 276
Sandstone type 3621 2757 138 1020 579 276
Light 3621 2757 138 1020 579 276
Macuspana-
Muspac 2999 2027 101 405 253 203
Carbonates 2999 2027 101 405 253 203
Light 2535 1736 87 347 217 174
Extralight 465 291 15 58 36 29
Gran Total 143498 109645 4611 14550 9581 10964 29

CO2 availability resources in the USA, 2008
30

Estimation of the CO2 demand for the RMNE reservoirs that don’t match the screening criteria
Assets Field Reservoir Remaining Oil
mmb
Oil Volume by EOR_CO2 mmb (5%)
Demand of CO2 mmcfd
5%
Cantarell Akal BTPKJ 18,053 903 1,236 Ku-Maloob-Zaap Maloob BTPK 5,651 283 387 Ku-Maloob-Zaap Zaap BTPK 3,627 181 248 Ku-Maloob-Zaap Kayab BTPK 3,314 166 227 Ku-Maloob-Zaap Ayatsil BTPK 3,172 159 217 Ku-Maloob-Zaap Pit BTPK 2,554 128 175 Ku-Maloob-Zaap Ku BTPK 1,992 100 136 Cantarell Nohoch BTPK 1,401 70 96 Cantarell Sihil BTPK-22g 969 48 66 Ku-Maloob-Zaap Tson BTPK 963 48 66 Ku-Maloob-Zaap Tekel BTPKS 926 46 63 Ku-Maloob-Zaap Chapabil BTPK 834 42 57 Ku-Maloob-Zaap Pohp BTPK 823 41 56 Cantarell Ek BTPK 781 39 53 Ku-Maloob-Zaap Maloob JSK 668 33 46
Ku-Maloob-Zaap Bacab JSK 505 25 35 Ku-Maloob-Zaap Zaap JSK 471 24 32 Ku-Maloob-Zaap Baksha BTPK 450 22 31 Ku-Maloob-Zaap Pohp JSK 443 22 30 Cantarell Balam BTPKS 432 22 30 31

Demand of CO2 and recoverable volume
0
50
100
150
200
250
Región Norte y Sur sin ATG
Volumen por EOR_CO2 mmb (5%) Demanda de CO2 mmpcd (5%)
32

Demand of CO2 and recoverable volume
0
50
100
150
200
250
Región Noreste y Suroeste
Volumen por EOR_CO2 mmb (5%) Demanda de CO2 mmpcd (5%)
33

EOR and Infrastructure
• The infrastructure for transportation of gas and CO2 is a critical factor for EOR projects to be successful.
• In the US, companies supplies approximately 1.3 bcfd of CO2 through 2,000 Km. of pipelines.
• CO2 is transported from the south-western Colorado to western Texas where it is injected.
The existing infrastructure has
capacity of close to 4bcfd, which is
sufficient to satisfy the current and
future demands of industry.

EOR and Infrastructure
35
• In Mexico the main constraint to execute the potential of EOR is the limited pipeline insfrastructure.
Projected Capacity Current capacity
8 new pipeline: • Additional: 4.774 km. • To be increased to the national pipeline
network: 38%Expected • Completion: 2018
Even with this additional capacity, the Mexican infrastructure
will be insufficient

Final Remarks
90% of the remaining oil volume in Mexico (188 billion bbls) can be divided in 46% for sandstone type and 54% for carbonates.
Excluding the PATG project reservoirs from a rough estimation, and considering a criteria of 10% of the remaining oil volume from each reservoir can be recoverable and a maximum rate of extraction Reserves/Production of 20 years, it can be seen that the reserves could double the proven reserves 1P and increase the oil production up to one million barrels per day.
The world is moving rapidly towards IOR/EOR. EOR will be a very important component of the world’s future oil production, and it will be significant in Mexico too.
Mexico’s EOR potential is promising, but it must include an aggressive program of piloting and development of advanced technology.
We are working on establishing a national EOR strategy that will help define a better project portfolio for the country.
There are several aspects (besides technical) that need to be resolved in order to have a successful EOR project.
36

IOR-EOR potential
Remaining Oil
In Place
135 billion bbls
81 billion bbls
EOR @
5% ROIP
6.8 billion bbls
4 billion bbls
Maximum
Production Rate
@ R/P = 20 years
1.5 million bopd
The IOR-EOR potential seems very promising
37

Thanks!
38

IOR/EOR Methods
By means of IOR / EOR methods, recovery efficiencies can increase up to 60 to 70% 39

Screening criteria for EOR methods (Taber 1983; and Lake 1992)
40

Costs of the EOR Methods
RECOVERY PROCESS
Capital Investment Operating expenses
$ per bbl of oil produced daily
$/bbl
EOR
-Thermal recovery 8,000-2,5000 15-25
-Miscible injection 10,000-25,000 10-30+
-Chemical injection
-Polymers 10,000-30,000 10-20
-Polymers surfactants 15,000-30,000 20-50+
WATER INJECTION 1,000-5,000 2-10
CONVENTIONAL PRODUCTION METHODS
-Middle East 500-3,000 1
-Outside OPEC countries 3,000-12,000 8
GLOBAL AVERAGE 4,000-8,000 5
Capital investment and operating costs are U.S. dollars of 1988 (CHIERICCI)
41


