44
Iowa’s Economy: Its Strengths, Concerns, and Outlook Dave Swenson Department of Economics Iowa State University

Iowa’s Economy: Its Strengths, Concerns, and Outlook
Dave SwensonDepartment of Economics
Iowa State University

What I’ll cover
• The national situation• Iowa• Farm economy challenges•Metro / micro and regional challenges•Outlook and concerns / discussion?

Nationally, expansion is continuing and is now the longest on record

Real GDP is also rising consistently

In terms of day‐to‐day importance, personal consumption spending matters the most

Real wages are up

Unemployment is at a historic low

Prime labor force participation rates have not recovered to pre‐recession levels

The ratio of new job openings to the number of unemployed has inverted
‐
2,000
4,000
6,000
8,000
10,000
12,000
14,000
16,000
18,000
Prime labor force participation rates have not recovered to pre‐recession levels
Total Unemployed Total Nonfarm Job Openings

Comparison of unemployed and job openings by industry

‐168,830
‐52,992
2,876
32,451
36,215
81,436
191,834
194,396
224,012
259,742
267,116
316,496
443,801
489,751
661,526
813,322
932,371
1,113,036
1,299,199
1,832,244
21 Mining, quarrying, and oil and gas extraction
99 Unclassified
22 Utilities
11 Agriculture, forestry, fishing and hunting
42 Wholesale trade
51 Information
53 Real estate and rental and leasing
55 Management of companies and enterprises
61 Educational services
81 Other services, except public administration
71 Arts, entertainment, and recreation
52 Finance and insurance
44‐45 Retail trade
31‐33 Manufacturing
56 Administrative and waste services
48‐49 Transportation and warehousing
54 Professional and technical services
23 Construction
72 Accommodation and food services
62 Health care and social assistance
Change in U.S. Payroll Job Demand by Major Sector, 2014 to 2018

Overall National SummaryStrengths
• Consistent job growth, though showing signs of slowing
• Improved wages – some exceptions• Inflation is low• Costs of borrowing are reasonable• Tax cuts initially boosted consumption – but those effects are over
• Federal Reserve is actively engaged
Weaknesses• Labor force participation can improve
• Significant fraction of the labor force still has stagnant wages
• Is inflation too low? Especially wage inflation?
• Disappointing recovery in manufacturing jobs –still down 1.4 million from the pre‐recession peak – plus an ongoing output decline of late
• Housing costs rising much faster than wages
• Consumer sentiment has dropped• Compounding trade antagonisms have delayed investment, slowed potential growth, and have been particularly disruptive in specific industries

Wildcards
• Final resolution of trade disruptions – is China merely running out the clock?• Will a global slowdown – China, EU, Germany affect the U.S.?• Will coronavirus further destabilize growth prospects? For how long?• What else out there gives us pause?• Why didn’t business investments increase after the 2018 tax cuts?• Given the rapid run‐up in deficit spending under this administration, will the federal debt, and most explicitly, U.S. debt service payments begin to slow economic growth?
• Labor constraints are likely impinging growth. Are our immigration laws in alignment with our labor needs?
• Is there a looming recession ‐‐ stagnation? Especially worrying signs in manufacturing• What does any of this mean for Iowa?
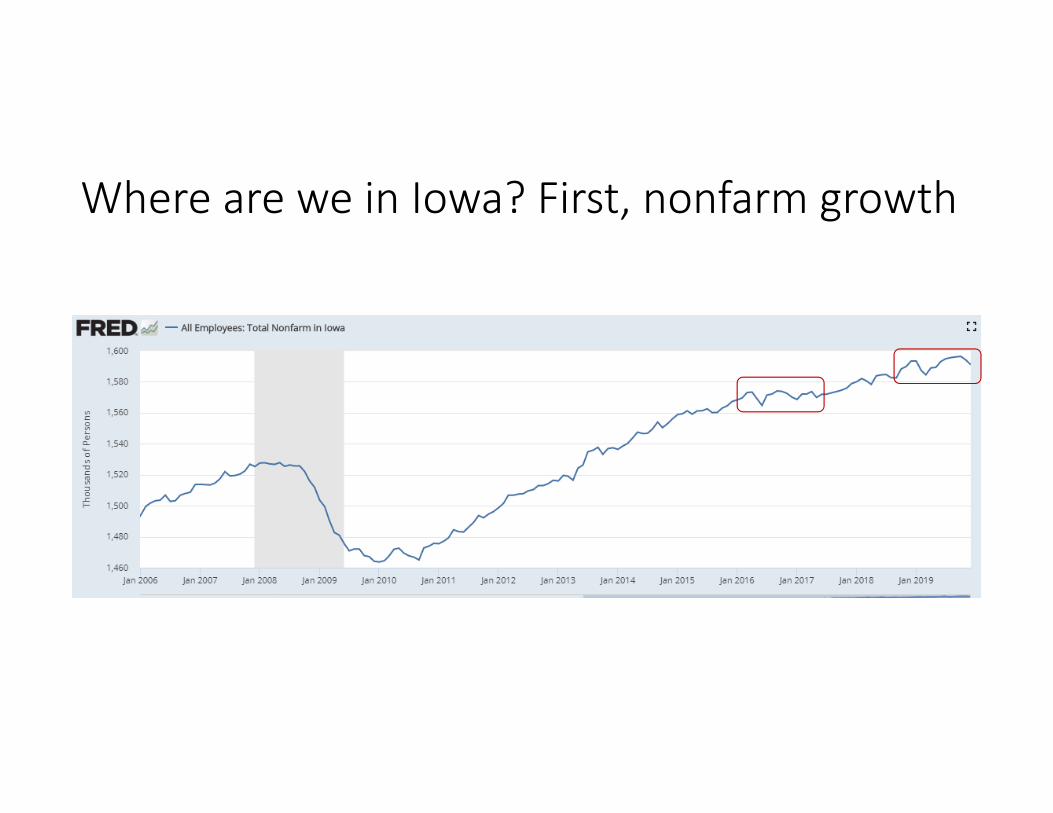
Where are we in Iowa? First, nonfarm growth

Our recovery compared to the U.S.

Comparing Manufacturing to all Nonfarm Jobs in Iowa

I recently issued a report on Iowa’s economic performance the last decade• Iowa’s post‐recession economy, though beginning recovery sooner, grew much slower than neighboring states, than the Plains region, and the nation.
• Between 2010 and 2018, Iowa ranked • last among all of its bordering neighbors, • last among all of the Plains states, and • 6th worst nationally in its rate of job growth
• A point was raised in the news article that, as Iowa didn’t contract as much from the Great Recession, its expected growth would be less. So I checked to make sure that I was not “misleading” readers.


0.90
0.95
1.00
1.05
1.10
1.15
Jan‐10 Jan‐11 Jan‐12 Jan‐13 Jan‐14 Jan‐15 Jan‐16 Jan‐17 Jan‐18 Jan‐19
Index of Payroll Job Growth for Iowa and Its Neighboring States, January 2010 = 1.0. Twelve Month Moving Average
Illinois Iowa Minnesota Missouri Nebraska South Dakota Wisconsin

A different comparison of Iowa with its neighbors
0.920.940.960.981.001.021.041.061.081.101.121.14
Jan2011
Jan2012
Jan2013
Jan2014
Jan2015
Jan2016
Jan2017
Jan2018
Jan2019
Iowa Manufacturing Job Growth Compared to its Neighboring States: 12 Month Moving Average. January 2011 = 1.0
IA Neighbors
0.940.960.981.001.021.041.061.081.101.12
Index of Job Change in Iowa Compared to its Neighboring States, 2010 to 2019. Twelve Month Moving Average, January 2010 = 1.0
Iowa Iowa's Neighbors

Iowa comparative wages and salaries had improved, but in recent quarters, have ebbed
70.0%
75.0%
80.0%
85.0%
90.0%
Qtr12008
Qtr12009
Qtr12010
Qtr12011
Qtr12012
Qtr12013
Qtr12014
Qtr12015
Qtr12016
Qtr12017
Qtr12018
Qtr12019
Iowa Average Weekly Wage & Salary as a Percent of the U.S. Average: 4 Quarter Moving Average

‐3,631
‐2,910
‐2,668
‐1,972
‐92
‐60
261
789
1,396
1,538
1,849
2,289
2,987
3,579
4,088
4,371
5,286
5,730
6,749
51 Information
42 Wholesale trade
56 Administrative and waste services
81 Other services, except public administration
22 Utilities
44‐45 Retail trade
21 Mining, quarrying, and oil and gas extraction
53 Real estate and rental and leasing
55 Management of companies and enterprises
11 Agriculture, forestry, fishing and hunting
61 Educational services
71 Arts, entertainment, and recreation
23 Construction
72 Accommodation and food services
52 Finance and insurance
48‐49 Transportation and warehousing
54 Professional and technical services
31‐33 Manufacturing
62 Health care and social assistance
Change in Iowa Payroll Job Demand, 2014 to 2018

‐50.0% ‐30.0% ‐10.0% 10.0% 30.0% 50.0% 70.0%
Durable goods manufacturing Nondurable goods manufacturing
Construction Information
Wholesale trade Farm employment
Government and government enterprises Utilities
Retail trade Other services (except government)
Administrative and support and waste management… Ag services, forestry and fishery
Finance and insurance Professional, scientific, and technical services
Real estate and rental and leasing Accommodation and food services Health care and social assistance
Arts, entertainment, and recreation Educational services
Mining, quarrying, and oil and gas extraction Management of companies and enterprises
Transportation and warehousing
U.S. and Iowa Rates of Job Growth, 2007 to 2018, by Major Industry
U.S. Change Iowa Change

Iowa’s Farm Sector

Iowa farm income performance has been affected by robust supplies and made worse by trade disruptions, but Market Facilitation Payments have offset much of those losses
$‐
$1,000
$2,000
$3,000
$4,000
$5,000
$6,000
$7,000
$8,000
$9,000
In M
illions of C
onstan
t $
Iowa Real Farm Proprietor Incomes, Data Annualized as 4 Qtr. Moving Average Through 2019Q3 Constant Amounts

Overall, Iowa’s share of U.S. agricultural income had declined markedly until MFPs significantly improved that ratio
0.0%
2.0%
4.0%
6.0%
8.0%
10.0%
12.0%
Iowa Farm Proprietor Incomes as a Percentage of U.S. Total. Annualized Data, 4 Qtr Moving Average

Soybeans exports are a big part of this story

Re‐emerging concerns about farmer solvency
https://www.fb.org/market‐intel/the‐verdict‐is‐in‐farm‐bankruptcies‐up‐in‐2019

Metro, Micro, and the remainder of the state

Metropolitan and Micropolitan Areas

Urban and rural changes over the past decade

109%
118%
98%
80%
85%
90%
95%
100%
105%
110%
115%
120%
125%
Jan2002
Jan2003
Jan2004
Jan2005
Jan2006
Jan2007
Jan2008
Jan2009
Jan2010
Jan2011
Jan2012
Jan2013
Jan2014
Jan2015
Jan2016
Jan2017
Jan2018
Jan2019
Index of Payroll Employment Change by Level of Urbanization, January 2002 through June 2019. 2002 = 100
(12 Month Moving Average)
Iowa Metros Balance of the State

(7,956)
(1,141)
(29)
101
117
717
1,514
2,422
3,054
5,562
6,720
6,991
10,434
12,623
12,990
13,071
13,925
30,659
Information
Wholesale trade
Admin, support and waste mangt. services
Farm employment
Manufacturing
All Other
Retail trade
Other services (except government)
Arts, entertainment, and recreation
Construction
Management of companies and enterprises
Educational services
Accommodation and food services
Real estate and rental and leasing
Government and government enterprises
Professional, scientific, and technical services
Finance and insurance
Health care and social assistance
Iowa Metropolitan Employment Changes by Selected Industries, 2007 to 2018

(12,910)
(5,957)
(5,636)
(4,779)
(3,200)
(2,902)
(2,839)
(2,180)
(1,847)
(1,705)
(1,593)
(1,426)
(242)
(108)
1,088
4,035
6,532
19,623
Health care and social assistance
Retail trade
Manufacturing
Government and government enterprises
Construction
Farm employment
Other services (except government)
Accommodation and food services
Professional, scientific, and technical services
Information
Wholesale trade
Admin, support and waste mangt. services
Arts, entertainment, and recreation
Educational services
Management of companies and enterprises
Finance and insurance
Real estate and rental and leasing
All Other
Iowa Nonmetropolitan Employment Changes by Selected Industries, 2007 to 2018

0.90
0.95
1.00
1.05
1.10
1.15
1.20
1.25
Jan2011
Jan2012
Jan2013
Jan2014
Jan2015
Jan2016
Jan2017
Jan2018
Jan2019
Index of Iowa Metropolitan Job Growth: 12 Month Moving Average, January 2011 = 1.0
Iowa Ames Cedar Rapids
Des Moines Dubuque Iowa city
Sioux City Waterloo Balance of State*

9.2%
2.9%
0.9%0.4% 0.3%
‐0.5%
‐1.8% ‐1.8%‐2.4% ‐2.7% ‐3.0% ‐3.1%
‐4.2%‐5.0% ‐5.3%
3.5%
Iowa Micropolitan Area Population Change, 2010 to 2018
State of Iowa

Labor Supply

0.0
2.0
4.0
6.0
8.0
10.0
12.0
Unemployment Rates in Iowa and the U.S.
Iowa U.S.

0.94
0.96
0.98
1.00
1.02
1.04
1.06
1.08
1.10
Index of the Iowa and the U.S. Labor Forces, 12 Month Moving Averages, January 2007 = 1.0
Iowa U.S.

1.04
1.10
0.95
0.98
0.80
0.85
0.90
0.95
1.00
1.05
1.10
1.15
Jan2007
Jan2008
Jan2009
Jan2010
Jan2011
Jan2012
Jan2013
Jan2014
Jan2015
Jan2016
Jan2017
Jan2018
Jan2019
Index of the Iowa Labor Force by Level of Urbanization, 12 Month Moving Averages, January 2007 = 1.0
Iowa Metros Micros Balance of State

Outlook
• Iowa has not performed as well as its neighbors, and despite comparatively strong manufacturing growth, weakness in the ag economy and in the rest of the world demand for what Iowa exports are concerns
• Both of these factors have disproportionate impacts on Iowa’s nonmetropolitan regions
• The ag supply chain, however, is baked in. No matter, land will be put into production ‐‐ those linkages will endure – those foundations are stable
• Plus, in the short run, market facilitation payments (MFPs) have improved farm balance sheets
• Most of Iowa’s metropolitan economies have more cyclical resiliency because of their industrial mixes – they are composed of growing industrial sectors – but half of them are not growing at the state average

Outlook Continued
• Nonetheless, Iowa’s overall economy has structural vulnerabilities to the business cycle and to trade tension dynamics that are, as a potential fraction of GDP, greater than nearly any other state
• Recent improvement in the state’s labor supply is welcome news, and may be due in part to demand‐induced wage improvements.
• Iowa’s micropolitan cities and many of the cities between 5,000 and 10,000 are not thriving, and most are in need of substantial assistance for planning, infrastructure, and community development
• These communities, too, will continue to hinder the state’s overall growth prospects

Concerns
1. Trade policies and tactics as implemented (excluding USMCA) will continue to hit Iowa hard
2. Iowa agriculture, as it has evolved, requires federal policy (ethanol), disaster (drought), and special attention (MFPs) to maintain stability
3. Accumulating indexes tell us that manufacturing output is slowing and moving into contraction territory. Iowa’s durable manufacturing is doubly exposed
4. National retail sales numbers suggest slowed consumption5. Midwestern economies are at a strong disadvantage in terms of capital
investment – if the economy stalls, that will worsen6. Not sure this administration possesses the administrative expertise to
effectively weather a downturn7. Gap between comparative prosperity in metro areas and ongoing stress in
nonmetropolitan economy will worsen

Questions …..?Thank youWrite [email protected] for copies of these slides


