IPCC Fourth Assessment Report: IPCC Fourth Assessment Report: the science behind the impacts the science behind the impacts R Sari Kovats R Sari Kovats “ “ Climate Climate change and challenges for public health change and challenges for public health – – priorities for priorities for EU action EU action Brussels, 2 October 2007 Brussels, 2 October 2007
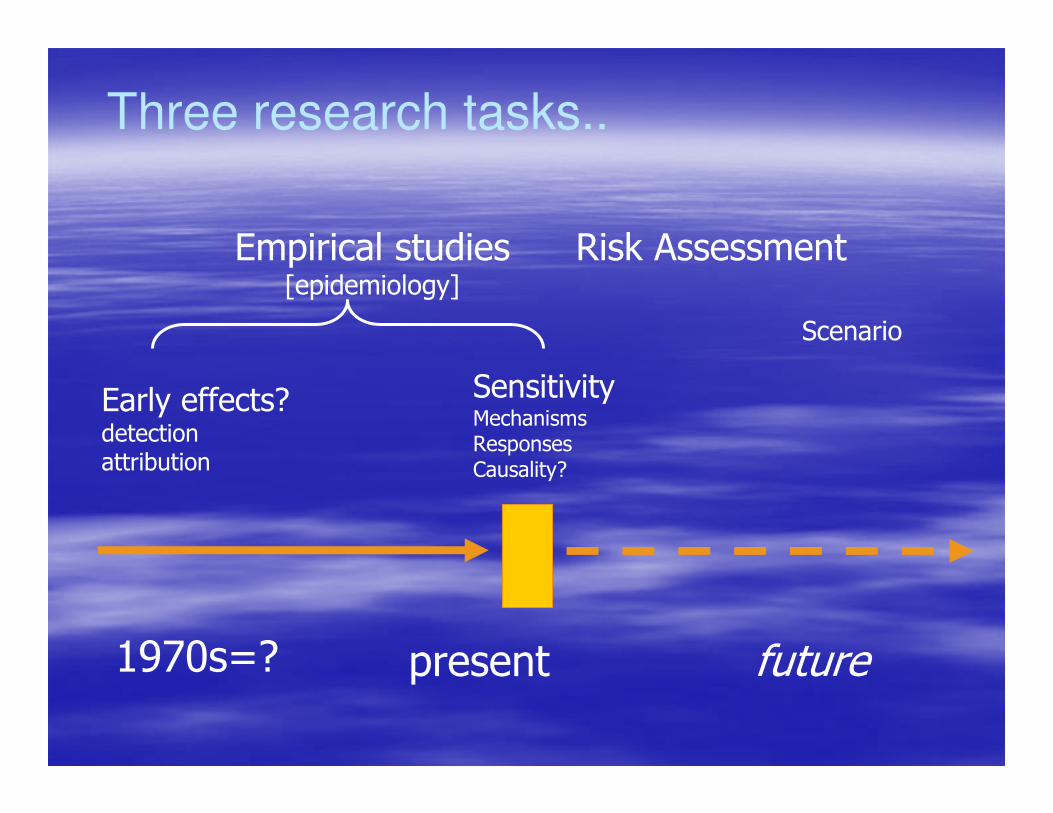
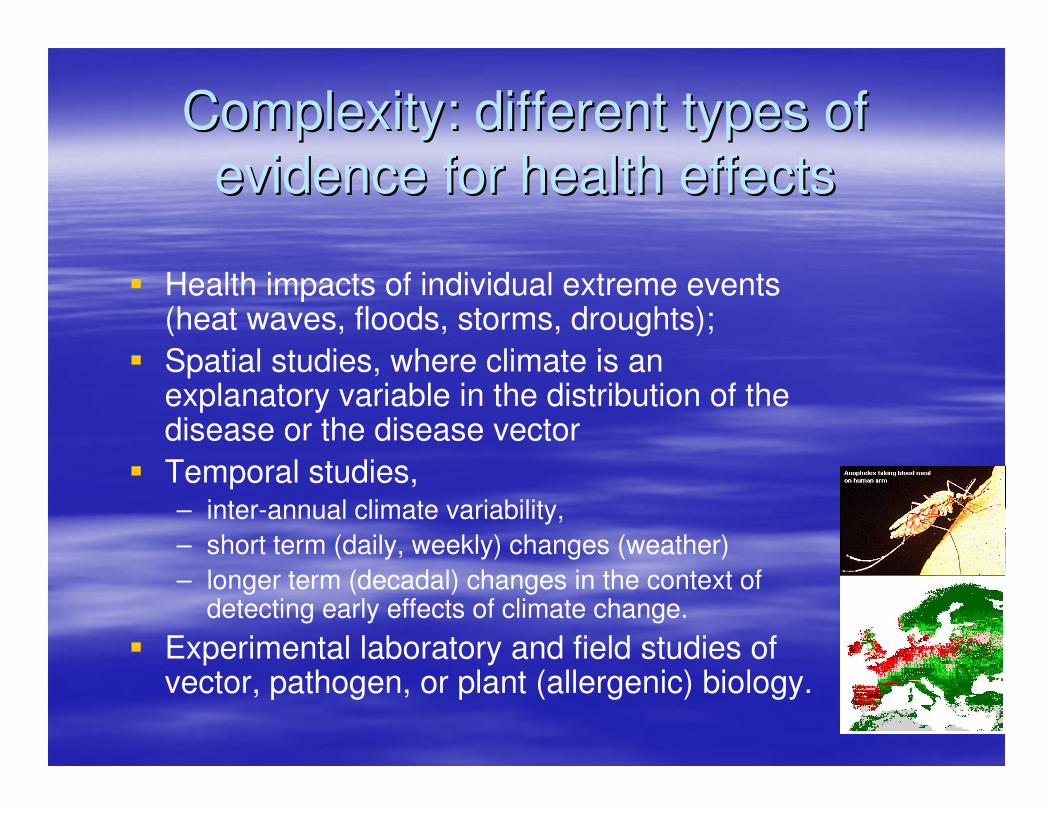
– longer term (decadal) changes in the context of detecting early effects of climate change.
� Experimental laboratory and field studies of vector, pathogen, or plant (allergenic) biology.
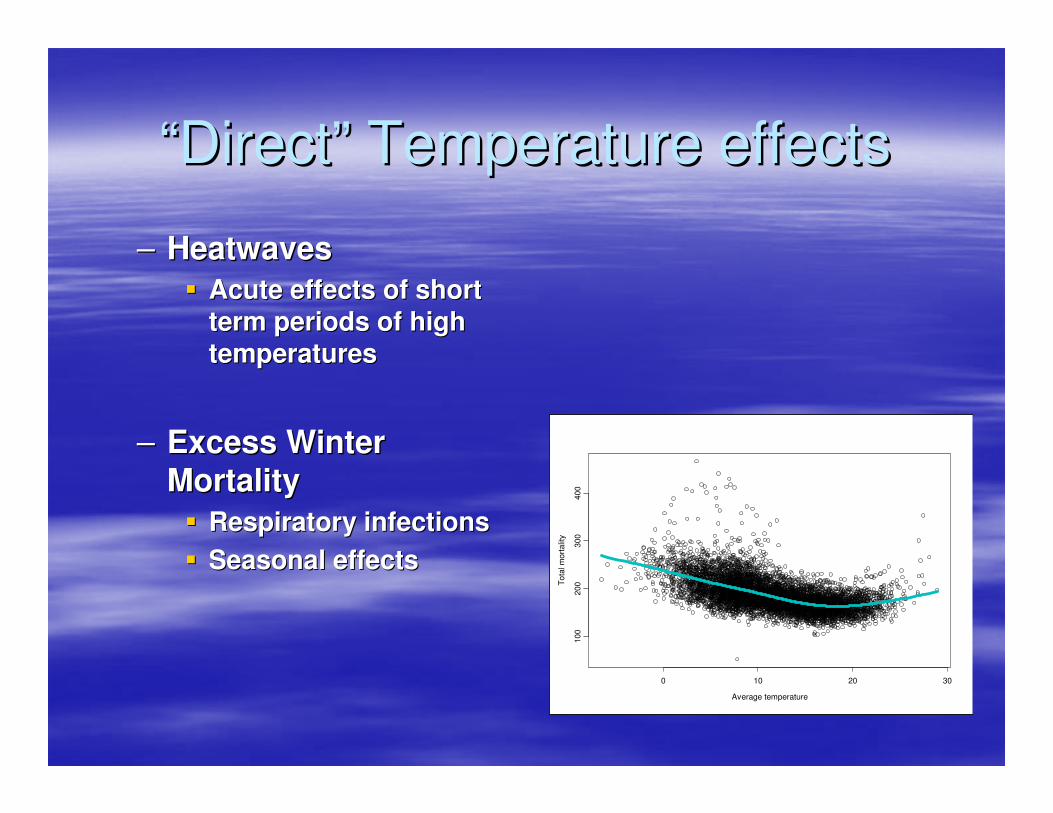
““DirectDirect”” Temperature effectsTemperature effects
–– HeatwavesHeatwaves
�� Acute effects of short Acute effects of short
term periods of high term periods of high
temperaturestemperatures
–– Excess Winter Excess Winter
MortalityMortality
�� Respiratory infectionsRespiratory infections
�� Seasonal effectsSeasonal effects
Average temperature
Tota
l m
ort
alit
y
0 10 20 30
100
200
300
400
20
40
60
80
10
0T
ota
l m
ort
alit
y
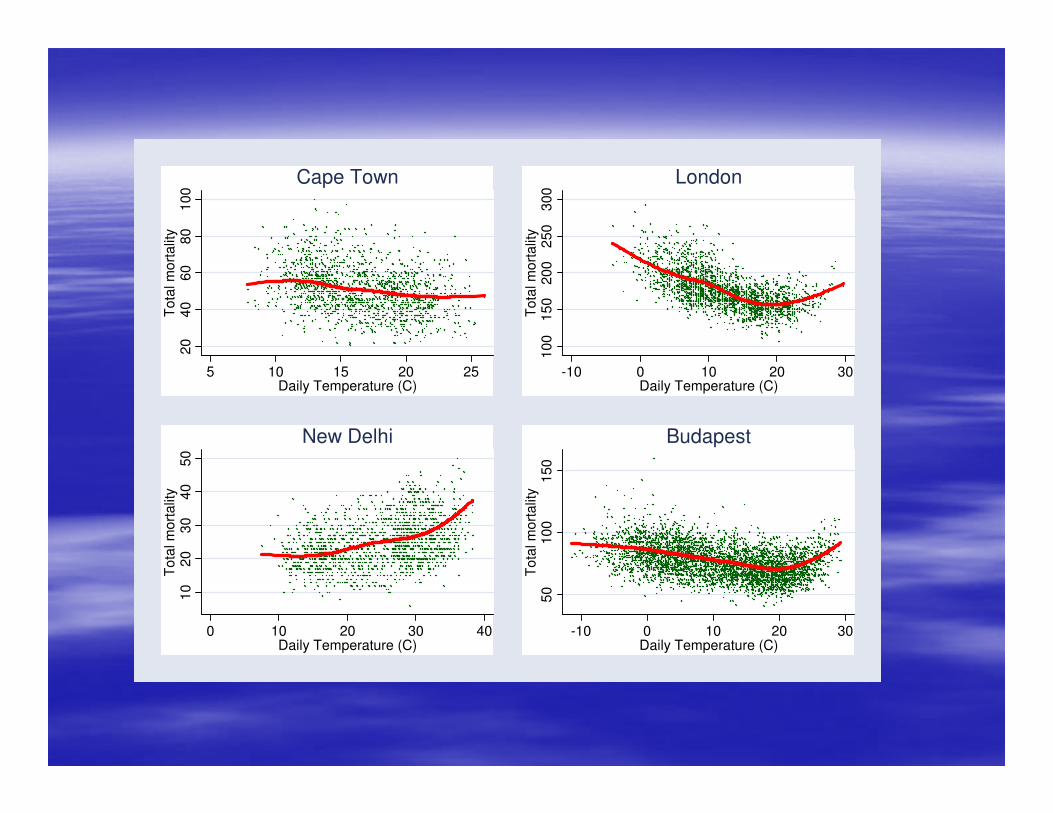
5 10 15 20 25Daily Temperature (C)
Cape Town
10
01
50
20
02
50
30
0T
ota
l m
ort
alit
y
-10 0 10 20 30Daily Temperature (C)
London1
02
03
04
05
0T
ota
l m
ort
alit
y
0 10 20 30 40Daily Temperature (C)
New Delhi
50
10
01
50
To
tal m
ort
alit
y
-10 0 10 20 30Daily Temperature (C)
Budapest
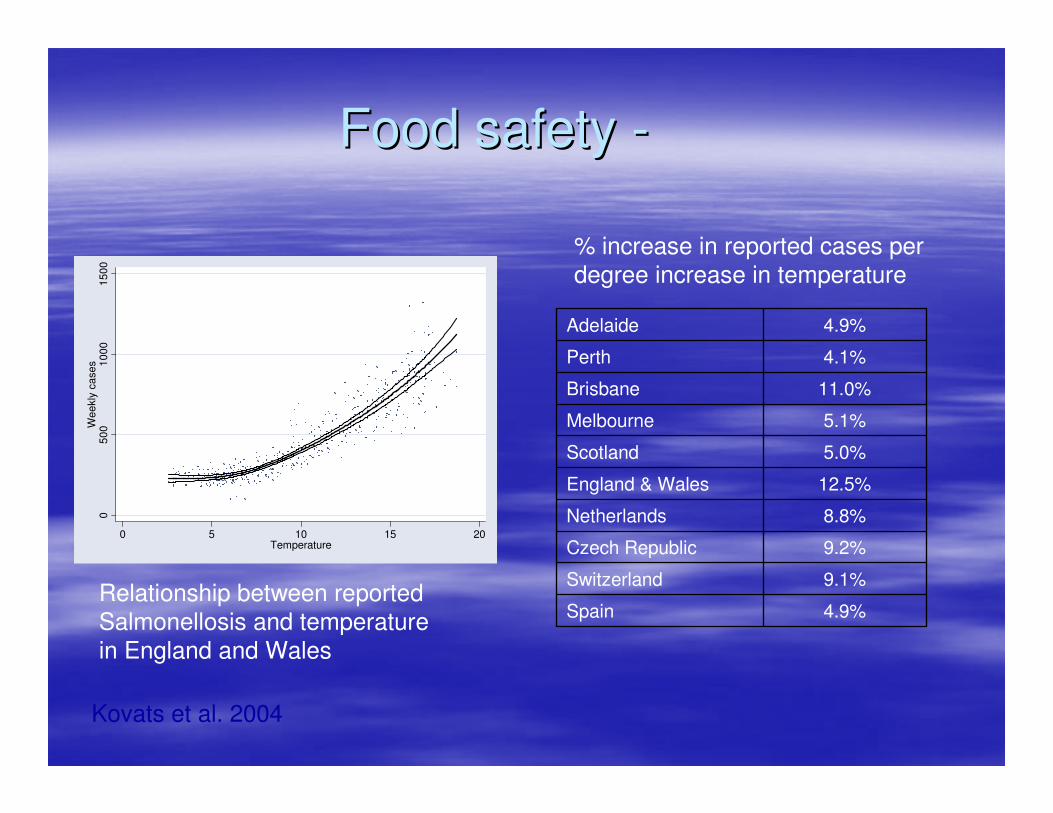
Food safety Food safety --0
50
01
00
01
50
0W
ee
kly
ca
se
s
0 5 10 15 20Temperature
Kovats et al. 2004
4.9%Spain
9.1%Switzerland
9.2%Czech Republic
8.8%Netherlands
12.5%England & Wales
5.0%Scotland
5.1%Melbourne
11.0%Brisbane
4.1%Perth
4.9%Adelaide
% increase in reported cases per degree increase in temperature
Relationship between reported
Salmonellosis and temperature in England and Wales
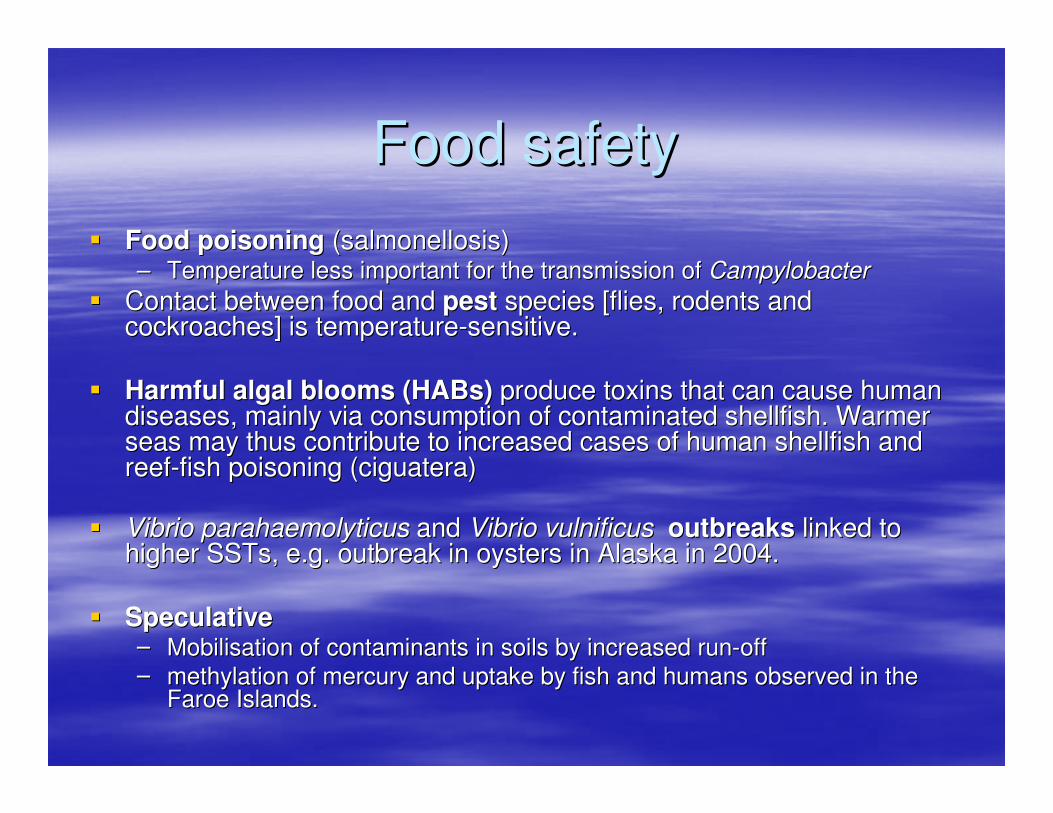
Food safetyFood safety
�� Food poisoningFood poisoning ((salmonellosissalmonellosis) ) –– Temperature less important for the transmission of Temperature less important for the transmission of CampylobacterCampylobacter
�� Contact between food and Contact between food and pestpest species [flies, rodents and species [flies, rodents and cockroaches] is temperaturecockroaches] is temperature--sensitive. sensitive.
�� Harmful algal blooms (Harmful algal blooms (HABsHABs)) produce toxins that can cause human produce toxins that can cause human diseases, mainly via consumption of contaminated shellfish. Warmdiseases, mainly via consumption of contaminated shellfish. Warmer er seas may thus contribute to increased cases of human shellfish aseas may thus contribute to increased cases of human shellfish and nd reefreef--fish poisoning (ciguatera) fish poisoning (ciguatera)
�� VibrioVibrio parahaemolyticusparahaemolyticus and and VibrioVibrio vulnificusvulnificus outbreaksoutbreaks linked to linked to higher SSTs, e.g. outbreak in oysters in Alaska in 2004.higher SSTs, e.g. outbreak in oysters in Alaska in 2004.
�� SpeculativeSpeculative–– Mobilisation of contaminants in soils by increased runMobilisation of contaminants in soils by increased run--offoff
–– methylationmethylation of mercury and uptake by fish and humans observed in the of mercury and uptake by fish and humans observed in the FaroeFaroe Islands.Islands.
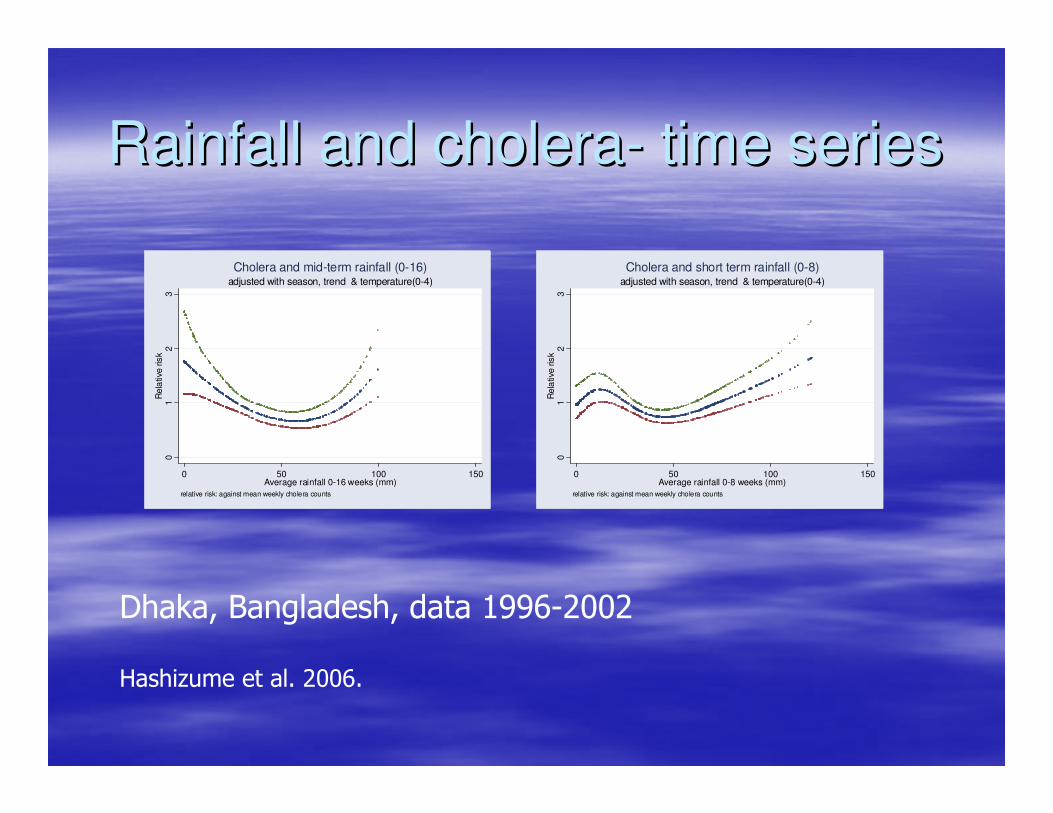
Rainfall and choleraRainfall and cholera-- time seriestime series
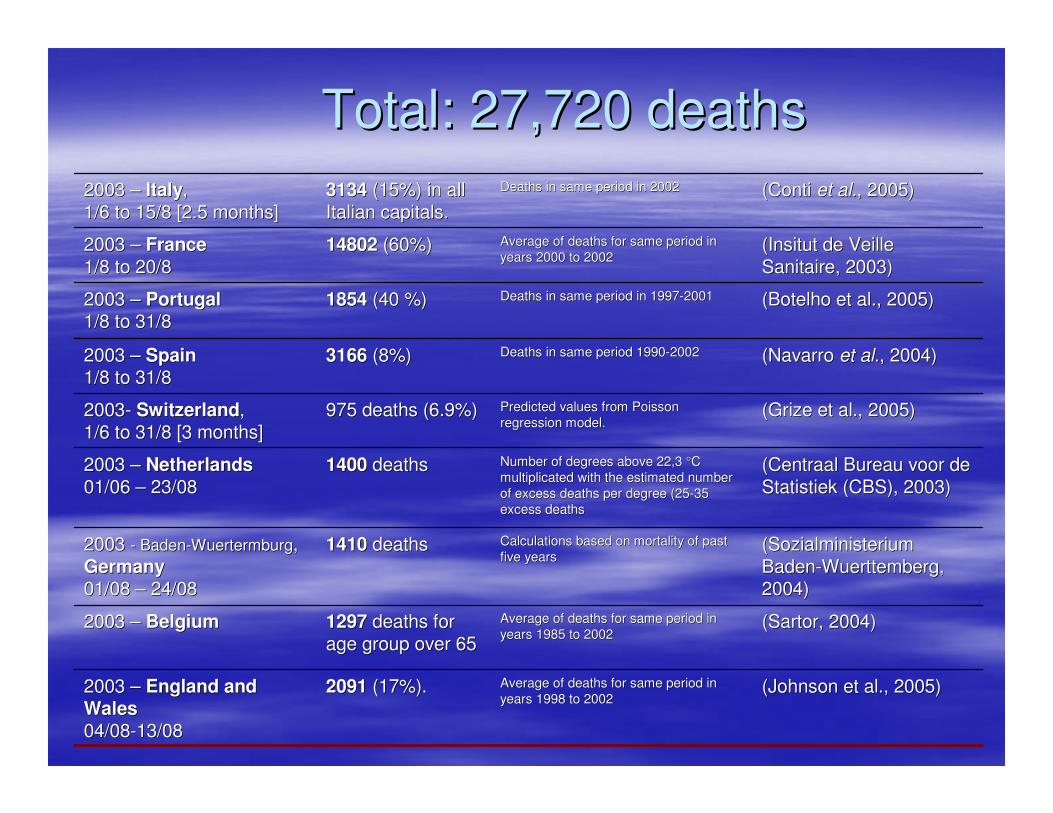
(Navarro(Navarro et al.et al., 2004), 2004)Deaths in same period 1990Deaths in same period 1990--2002200231663166 (8%)(8%)2003 2003 –– SpainSpain
1/8 to 31/81/8 to 31/8
((BotelhoBotelho et al., 2005)et al., 2005)Deaths in same period in 1997Deaths in same period in 1997--2001200118541854 (40 %)(40 %)2003 2003 –– PortugalPortugal
1/8 to 31/81/8 to 31/8
((InsitutInsitut de de VeilleVeille
SanitaireSanitaire, 2003), 2003)
Average of deaths for same period in Average of deaths for same period in
years 2000 to 2002 years 2000 to 2002 1480214802 (60%)(60%)2003 2003 –– FranceFrance
1/8 to 20/81/8 to 20/8
(Conti(Conti et al.et al., 2005), 2005)Deaths in same period in 2002Deaths in same period in 200231343134 (15%) in all (15%) in all
Italian capitals.Italian capitals.2003 2003 –– ItalyItaly, ,
1/6 to 15/8 [2.5 months]1/6 to 15/8 [2.5 months]
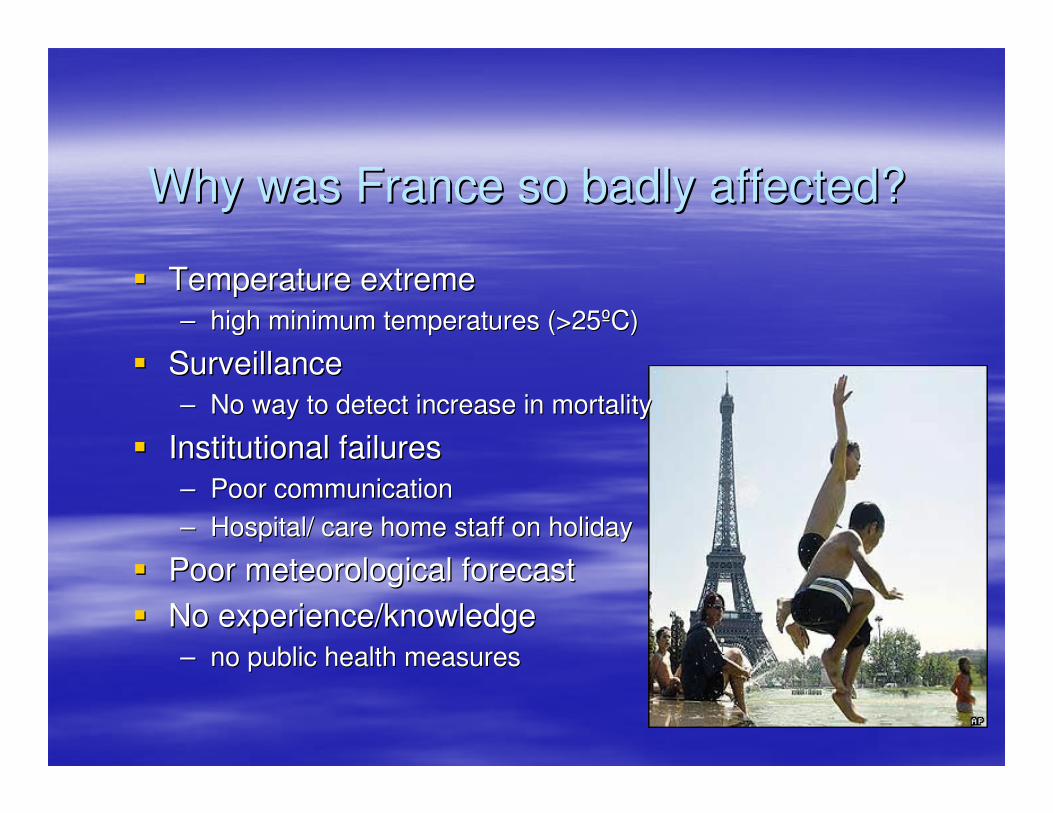
Why was France so badly affected?Why was France so badly affected?
�� Temperature extremeTemperature extreme
–– high minimum temperatures (>25high minimum temperatures (>25ººC)C)
�� SurveillanceSurveillance
–– No way to detect increase in mortalityNo way to detect increase in mortality
�� Institutional failuresInstitutional failures
–– Poor communicationPoor communication
–– Hospital/ care home staff on holidayHospital/ care home staff on holiday
–– no public health measuresno public health measures
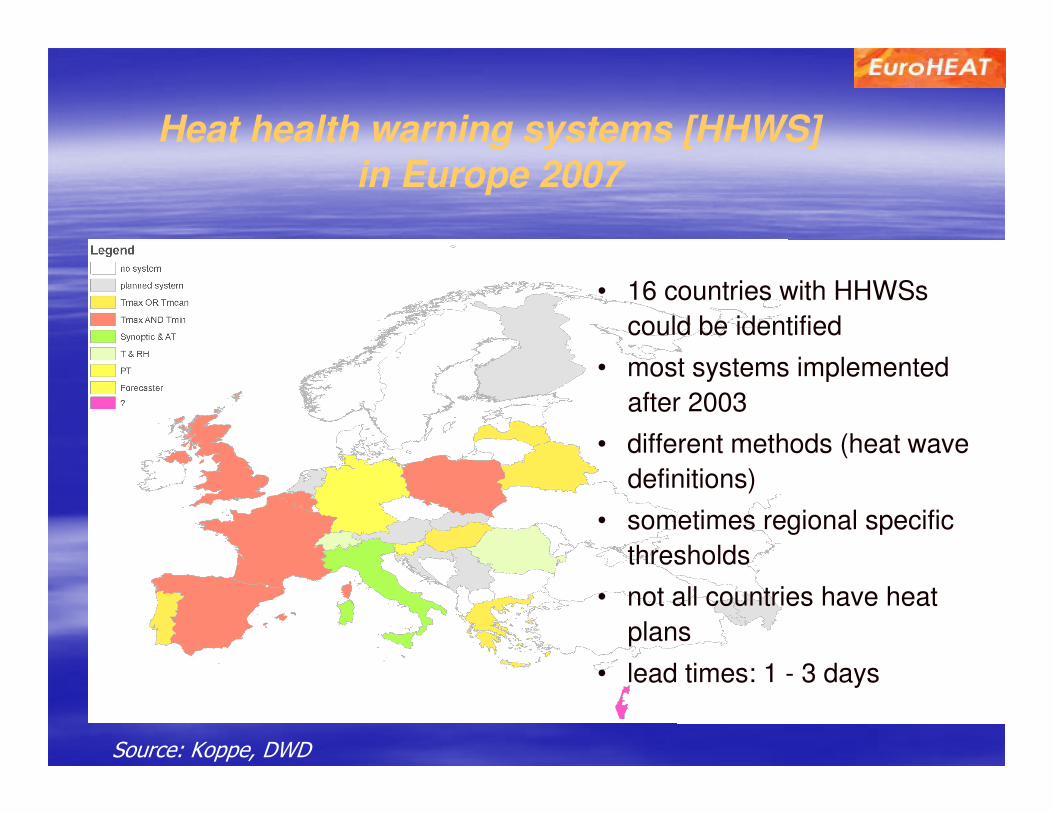
Heat health warning systems [HHWS]
in Europe 2007
• 16 countries with HHWSs
could be identified
• most systems implemented
after 2003
• different methods (heat wave
definitions)
• sometimes regional specific
thresholds
• not all countries have heat
plans
• lead times: 1 - 3 days
Source: Koppe, DWD
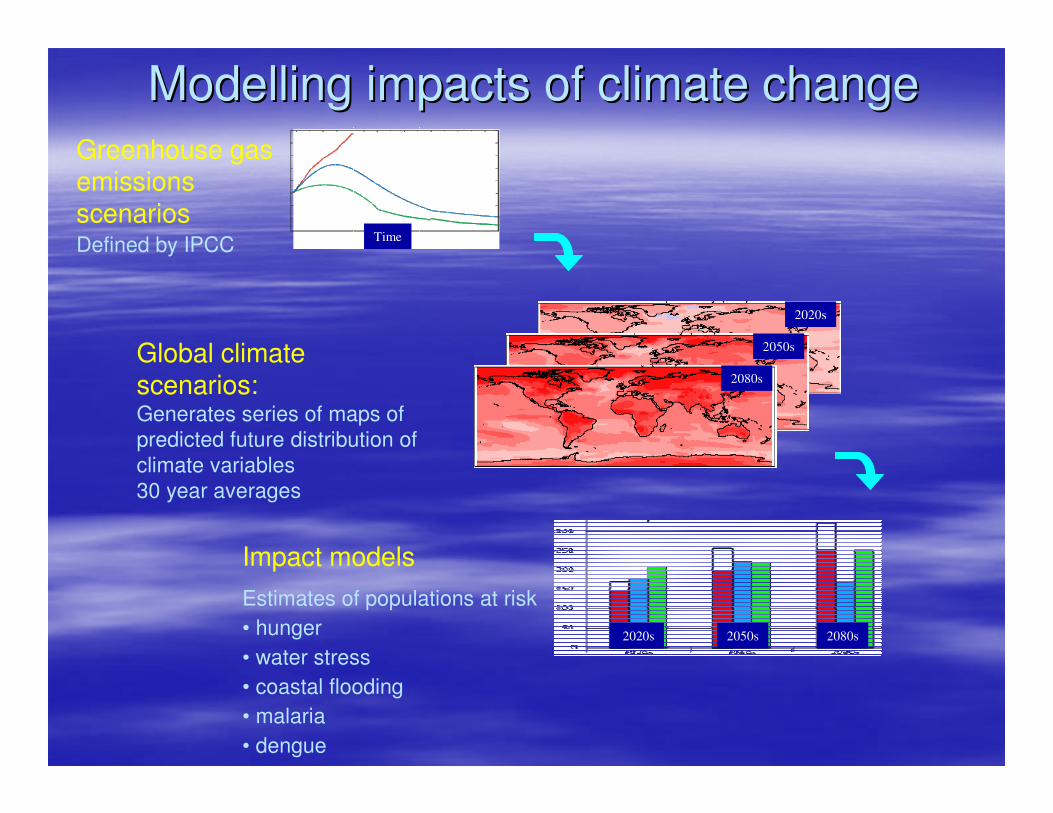
Impact models
Estimates of populations at risk
• hunger
• water stress
• coastal flooding
• malaria
• dengue
Greenhouse gas emissions scenariosDefined by IPCC
Global climate scenarios:Generates series of maps of
predicted future distribution of
climate variables
30 year averages
2020s
2050s
2080s
Time
2050 2100
2020s 2050s 2080s
Modelling impacts of climate changeModelling impacts of climate change
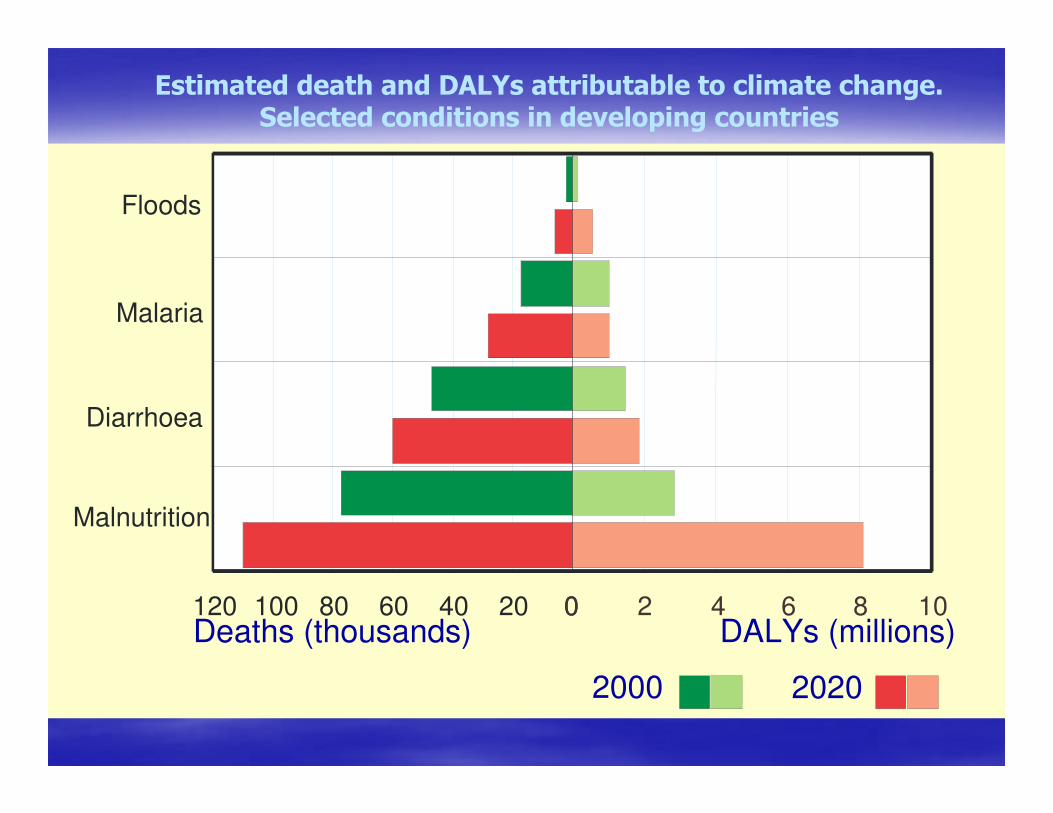
Deaths (thousands) DALYs (millions)
2000 2020
Estimated death and DALYs attributable to climate change.Selected conditions in developing countries
Floods
Malaria
Diarrhoea
Malnutrition
020406080100120 0 2 4 6 8 10
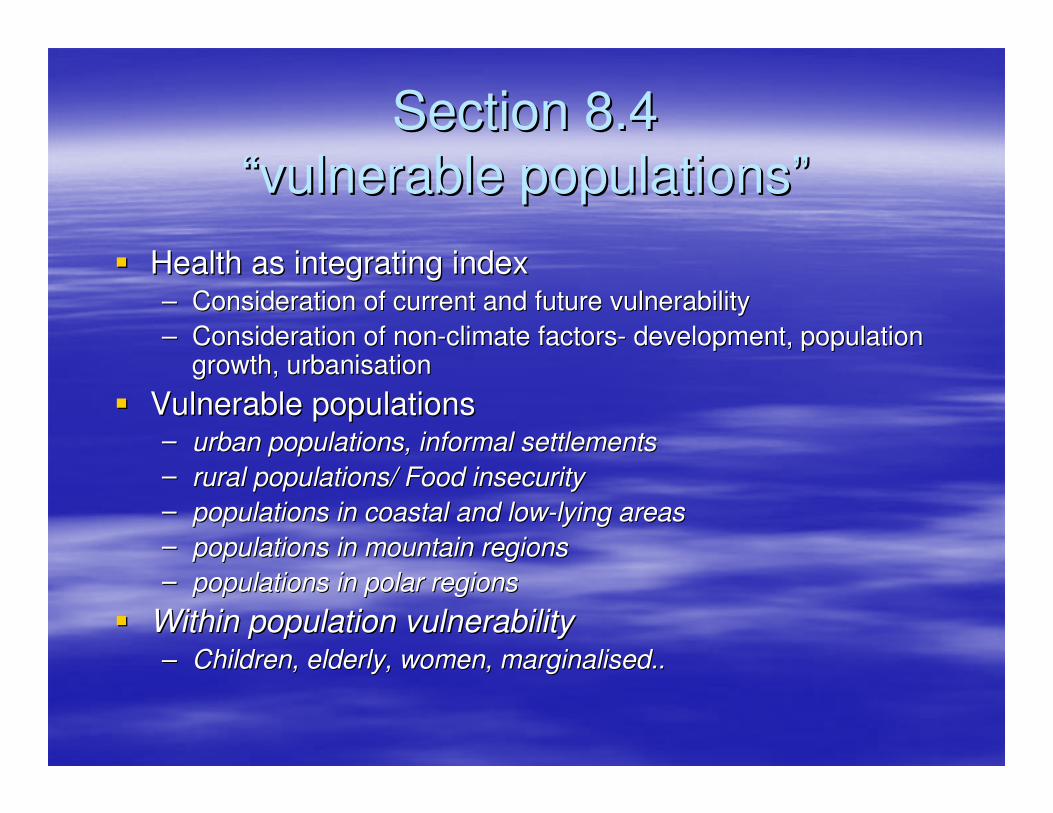
Section 8.4Section 8.4
““vulnerable populationsvulnerable populations””
�� Health as integrating indexHealth as integrating index–– Consideration of current and future vulnerability Consideration of current and future vulnerability
–– Consideration of nonConsideration of non--climate factorsclimate factors-- development, population development, population growth, urbanisationgrowth, urbanisation
–– populations in coastal and lowpopulations in coastal and low--lying areaslying areas
–– populations in mountain regionspopulations in mountain regions
–– populations in polar regionspopulations in polar regions
�� Within population vulnerabilityWithin population vulnerability–– Children, elderly, women, marginalised..Children, elderly, women, marginalised..
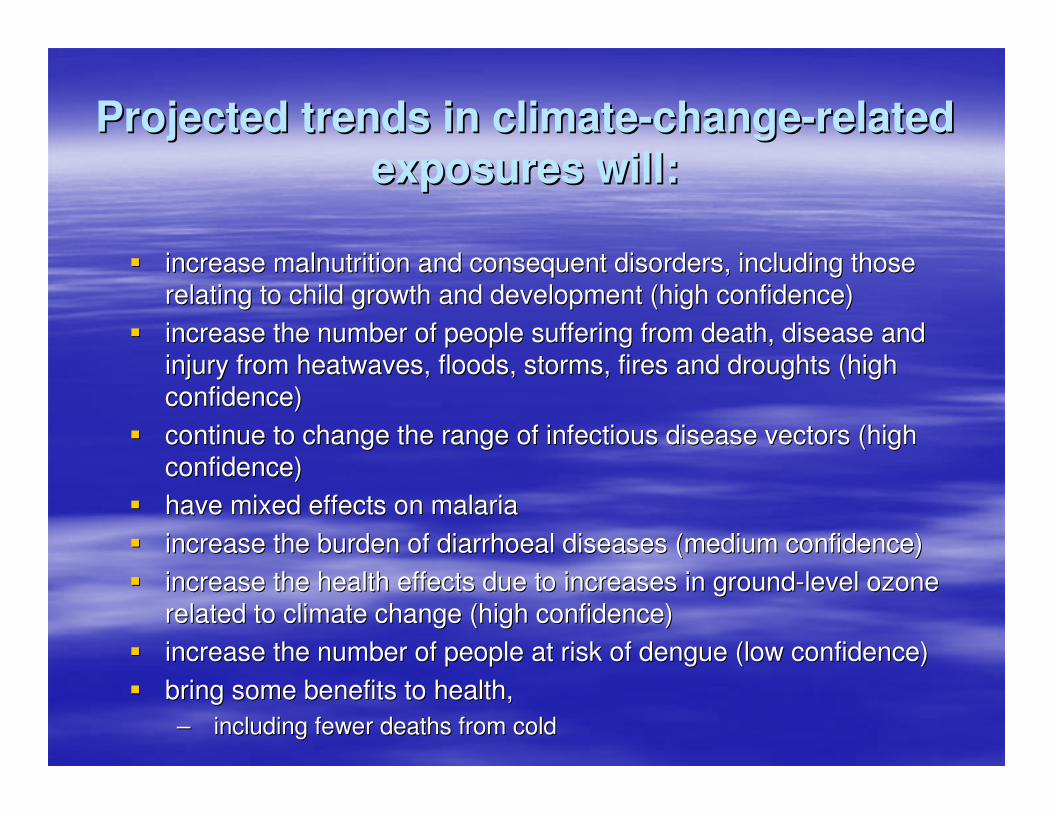
Projected trends in climateProjected trends in climate--changechange--related related
exposures will:exposures will:
�� increase malnutrition and consequent disorders, including those increase malnutrition and consequent disorders, including those
relating to child growth and development (high confidence) relating to child growth and development (high confidence)
�� increase the number of people suffering from death, disease and increase the number of people suffering from death, disease and
injury from injury from heatwavesheatwaves, floods, storms, fires and droughts (high , floods, storms, fires and droughts (high
confidence) confidence)
�� continue to change the range of infectious disease vectors (highcontinue to change the range of infectious disease vectors (high
confidence) confidence)
�� have mixed effects on malariahave mixed effects on malaria
�� increase the burden of diarrhoeal diseases (medium confidence) increase the burden of diarrhoeal diseases (medium confidence)
�� increase the health effects due to increases in groundincrease the health effects due to increases in ground--level ozone level ozone
related to climate change (high confidence) related to climate change (high confidence)
�� increase the number of people at risk of dengue (low confidence)increase the number of people at risk of dengue (low confidence)
�� bring some benefits to health,bring some benefits to health,
–– including fewer deaths from coldincluding fewer deaths from cold
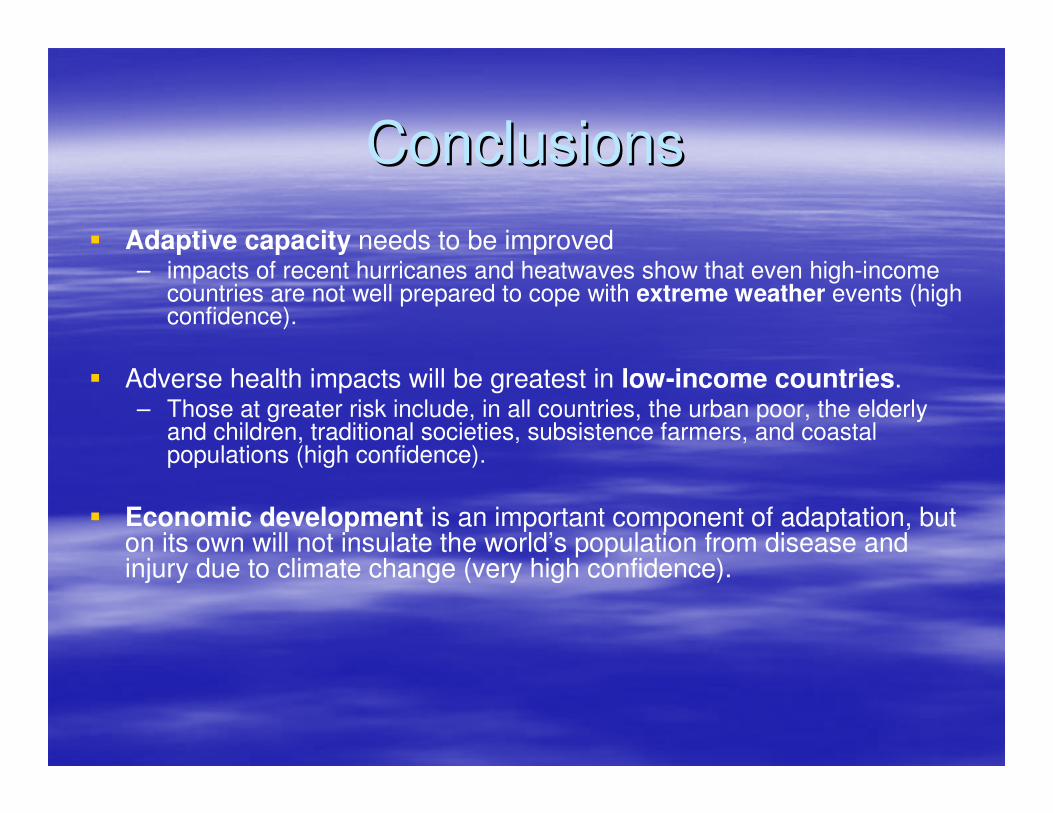
ConclusionsConclusions
� Adaptive capacity needs to be improved– impacts of recent hurricanes and heatwaves show that even high-income
countries are not well prepared to cope with extreme weather events (high confidence).
� Adverse health impacts will be greatest in low-income countries. – Those at greater risk include, in all countries, the urban poor, the elderly
and children, traditional societies, subsistence farmers, and coastal populations (high confidence).
� Economic development is an important component of adaptation, but on its own will not insulate the world’s population from disease and injury due to climate change (very high confidence).


![Interpretive sign on the refuge...Intergovernmental Panel on Climate Change (IPCC). 2007. IPCC Fourth Assessment Report: Climate Change 2007. Geneva, Switzerland. 104 pp. [Online]](https://static.documents.pub/doc/80x56/5ff962462284725c33048434/interpretive-sign-on-the-refuge-intergovernmental-panel-on-climate-change-ipcc.jpg)


