Contribution of Working Group III to the Fourth Assessment Report of the Intergovernmental Panel on Climate Change Technical Summary Authors: Terry Barker (UK), Igor Bashmakov (Russia), Lenny Bernstein (USA), Jean E. Bogner (USA), Peter Bosch (The Netherlands), Rutu Dave (The Netherlands), Ogunlade Davidson (Sierra Leone), Brian S. Fisher (Australia), Sujata Gupta (India), Kirsten Halsnæs (Denmark), BertJan Heij (The Netherlands), Suzana Kahn Ribeiro (Brazil), Shigeki Kobayashi (Japan), Mark D. Levine (USA), Daniel L. Martino (Uruguay), Omar Masera (Mexico), Bert Metz (The Netherlands), Leo Meyer (The Netherlands), Gert-Jan Nabuurs (The Netherlands), Adil Najam (Pakistan), Nebojsa Nakicenovic (Austria/Montenegro), Hans-Holger Rogner (Germany), Joyashree Roy (India), Jayant Sathaye (USA), Robert Schock (USA), Priayadarshi Shukla (India), Ralph E. H. Sims (New Zealand), Pete Smith (UK), Dennis A. Tirpak (USA), Diana Urge-Vorsatz (Hungary), Dadi Zhou (PR China) Review Editor: Mukiri wa Githendu (Kenya) This Technical Summary should be cited as: Barker T., I. Bashmakov, L. Bernstein, J. E. Bogner, P. R. Bosch, R. Dave, O. R. Davidson, B. S. Fisher, S. Gupta, K. Halsnæs, G.J. Heij, S. Kahn Ribeiro, S. Kobayashi, M. D. Levine, D. L. Martino, O. Masera, B. Metz, L. A. Meyer, G.-J. Nabuurs, A. Najam, N. Nakicenovic, H. -H. Rogner, J. Roy, J. Sathaye, R. Schock, P. Shukla, R. E. H. Sims, P. Smith, D. A. Tirpak, D. Urge-Vorsatz, D. Zhou, 2007: Technical Summary. In: Climate Change 2007: Mitigation. Contribution of Working Group III to the Fourth Assessment Report of the Intergovernmental Panel on Climate Change [B. Metz, O. R. Davidson, P. R. Bosch, R. Dave, L. A. Meyer (eds)], Cambridge University Press, Cambridge, United Kingdom and New York, NY, USA.
Transcript
Contribution of Working Group III to the
Fourth Assessment Report of the
Intergovernmental Panel on Climate Change
Technical Summary
Authors:Terry Barker (UK), Igor Bashmakov (Russia), Lenny Bernstein (USA), Jean E. Bogner (USA), Peter Bosch (The Netherlands),
Rutu Dave (The Netherlands), Ogunlade Davidson (Sierra Leone), Brian S. Fisher (Australia), Sujata Gupta (India),
Mark D. Levine (USA), Daniel L. Martino (Uruguay), Omar Masera (Mexico), Bert Metz (The Netherlands), Leo Meyer (The Netherlands),
Gert-Jan Nabuurs (The Netherlands), Adil Najam (Pakistan), Nebojsa Nakicenovic (Austria/Montenegro), Hans-Holger Rogner (Germany),
Joyashree Roy (India), Jayant Sathaye (USA), Robert Schock (USA), Priayadarshi Shukla (India), Ralph E. H. Sims (New Zealand),
Pete Smith (UK), Dennis A. Tirpak (USA), Diana Urge-Vorsatz (Hungary), Dadi Zhou (PR China)
Review Editor:Mukiri wa Githendu (Kenya)
This Technical Summary should be cited as: Barker T., I. Bashmakov, L. Bernstein, J. E. Bogner, P. R. Bosch, R. Dave, O. R. Davidson, B. S. Fisher, S. Gupta, K. Halsnæs,
G.J. Heij, S. Kahn Ribeiro, S. Kobayashi, M. D. Levine, D. L. Martino, O. Masera, B. Metz, L. A. Meyer, G.-J. Nabuurs, A. Najam,
N. Nakicenovic, H. -H. Rogner, J. Roy, J. Sathaye, R. Schock, P. Shukla, R. E. H. Sims, P. Smith, D. A. Tirpak, D. Urge-Vorsatz,
D. Zhou, 2007: Technical Summary. In: Climate Change 2007: Mitigation. Contribution of Working Group III to the Fourth Assessment
Report of the Intergovernmental Panel on Climate Change [B. Metz, O. R. Davidson, P. R. Bosch, R. Dave, L. A. Meyer (eds)],
Cambridge University Press, Cambridge, United Kingdom and New York, NY, USA.
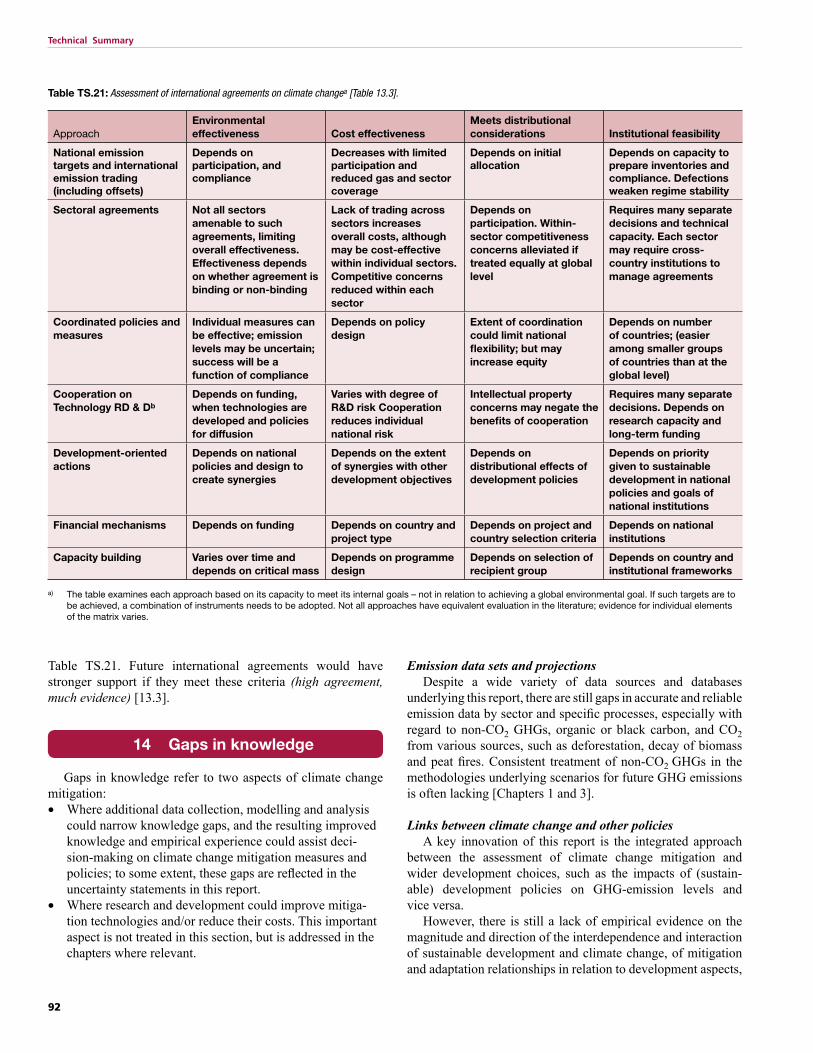
13 Policies, instruments and cooperative agreements .......................................................... 87
14 Gaps in Knowledge ........................................... 92
27
Technical Summary
1 Introduction
Structure of the report, the rationale behind it, therole of cross-cutting themes and framing issues
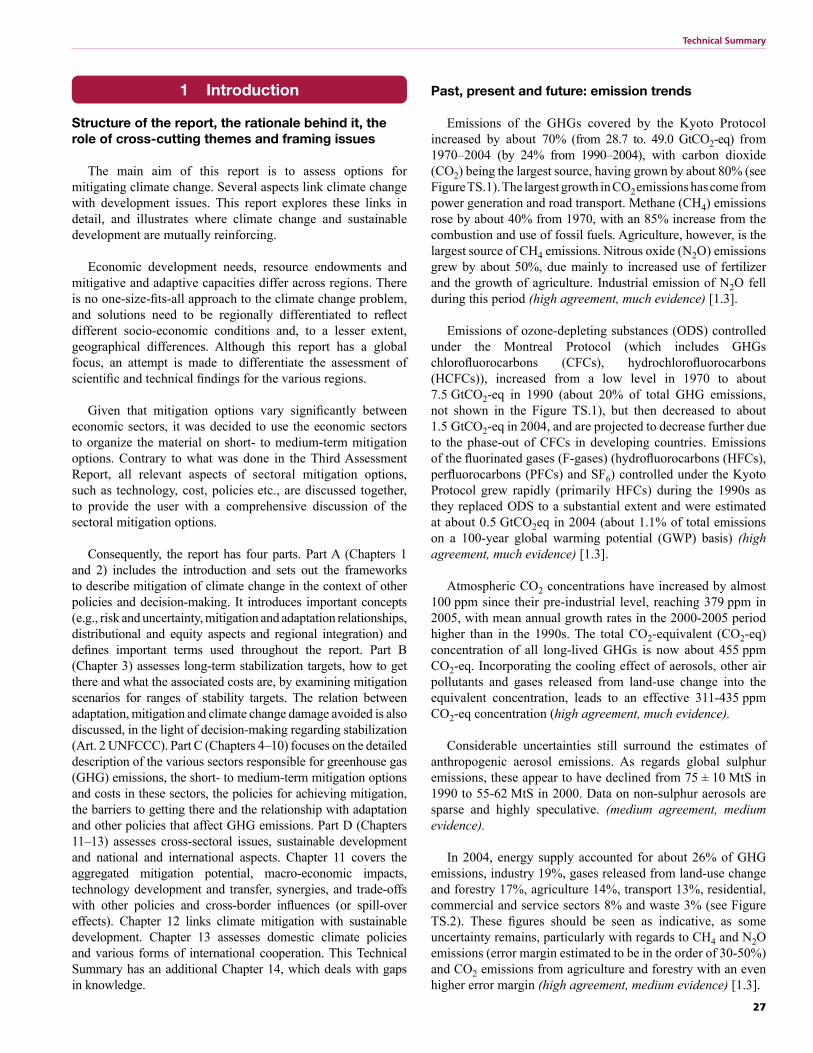
The main aim of this report is to assess options for mitigating climate change. Several aspects link climate change with development issues. This report explores these links in detail, and illustrates where climate change and sustainable development are mutually reinforcing.
Economic development needs, resource endowments and mitigative and adaptive capacities differ across regions. There is no one-size-fits-all approach to the climate change problem, and solutions need to be regionally differentiated to reflect different socio-economic conditions and, to a lesser extent, geographical differences. Although this report has a global focus, an attempt is made to differentiate the assessment of scientific and technical findings for the various regions.
Given that mitigation options vary significantly between economic sectors, it was decided to use the economic sectors to organize the material on short- to medium-term mitigation options. Contrary to what was done in the Third Assessment Report, all relevant aspects of sectoral mitigation options, such as technology, cost, policies etc., are discussed together, to provide the user with a comprehensive discussion of the sectoral mitigation options.
Consequently, the report has four parts. Part A (Chapters 1 and 2) includes the introduction and sets out the frameworks to describe mitigation of climate change in the context of other policies and decision-making. It introduces important concepts (e.g., risk and uncertainty, mitigation and adaptation relationships, distributional and equity aspects and regional integration) and defines important terms used throughout the report. Part B (Chapter 3) assesses long-term stabilization targets, how to get there and what the associated costs are, by examining mitigation scenarios for ranges of stability targets. The relation between adaptation, mitigation and climate change damage avoided is also discussed, in the light of decision-making regarding stabilization (Art. 2 UNFCCC). Part C (Chapters 4–10) focuses on the detailed description of the various sectors responsible for greenhouse gas (GHG) emissions, the short- to medium-term mitigation options and costs in these sectors, the policies for achieving mitigation, the barriers to getting there and the relationship with adaptation and other policies that affect GHG emissions. Part D (Chapters 11–13) assesses cross-sectoral issues, sustainable development and national and international aspects. Chapter 11 covers the aggregated mitigation potential, macro-economic impacts, technology development and transfer, synergies, and trade-offs with other policies and cross-border influences (or spill-over effects). Chapter 12 links climate mitigation with sustainable development. Chapter 13 assesses domestic climate policies and various forms of international cooperation. This Technical Summary has an additional Chapter 14, which deals with gaps in knowledge.
Past, present and future: emission trends
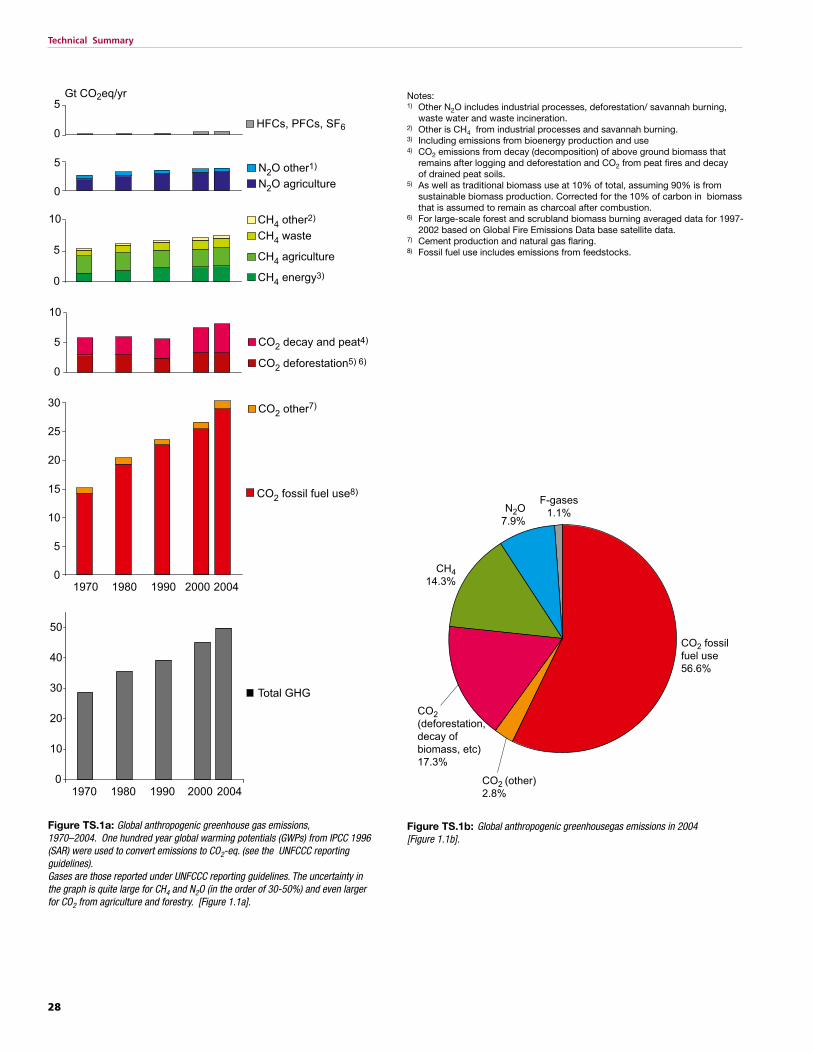
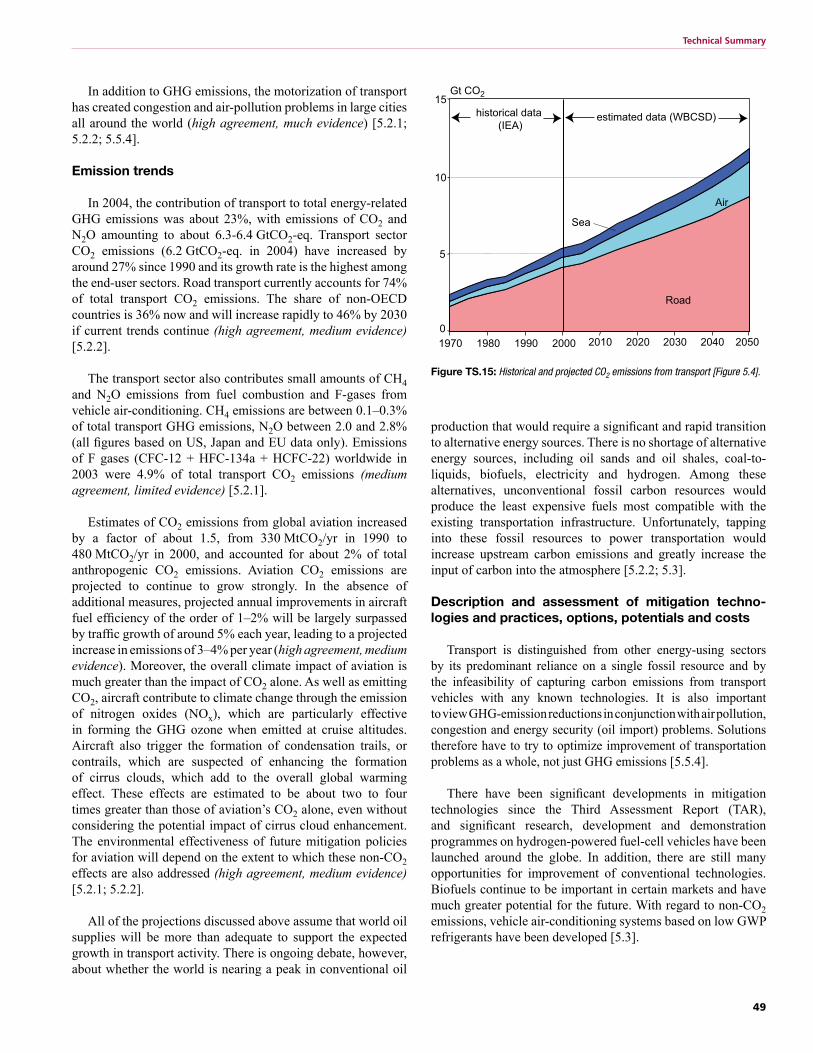
Emissions of the GHGs covered by the Kyoto Protocol increased by about 70% (from 28.7 to. 49.0 GtCO2-eq) from 1970–2004 (by 24% from 1990–2004), with carbon dioxide (CO2) being the largest source, having grown by about 80% (see Figure TS.1). The largest growth in CO2 emissions has come from power generation and road transport. Methane (CH4) emissions rose by about 40% from 1970, with an 85% increase from the combustion and use of fossil fuels. Agriculture, however, is the largest source of CH4 emissions. Nitrous oxide (N2O) emissions grew by about 50%, due mainly to increased use of fertilizer and the growth of agriculture. Industrial emission of N2O fell during this period (high agreement, much evidence) [1.3].
Emissions of ozone-depleting substances (ODS) controlled under the Montreal Protocol (which includes GHGs chlorofluorocarbons (CFCs), hydrochlorofluorocarbons (HCFCs)), increased from a low level in 1970 to about 7.5 GtCO2-eq in 1990 (about 20% of total GHG emissions, not shown in the Figure TS.1), but then decreased to about 1.5 GtCO2-eq in 2004, and are projected to decrease further due to the phase-out of CFCs in developing countries. Emissions of the fluorinated gases (F-gases) (hydrofluorocarbons (HFCs), perfluorocarbons (PFCs) and SF6) controlled under the Kyoto Protocol grew rapidly (primarily HFCs) during the 1990s as they replaced ODS to a substantial extent and were estimated at about 0.5 GtCO2eq in 2004 (about 1.1% of total emissions on a 100-year global warming potential (GWP) basis) (high agreement, much evidence) [1.3].
Atmospheric CO2 concentrations have increased by almost 100 ppm since their pre-industrial level, reaching 379 ppm in 2005, with mean annual growth rates in the 2000-2005 period higher than in the 1990s. The total CO2-equivalent (CO2-eq) concentration of all long-lived GHGs is now about 455 ppm CO2-eq. Incorporating the cooling effect of aerosols, other air pollutants and gases released from land-use change into the equivalent concentration, leads to an effective 311-435 ppm CO2-eq concentration (high agreement, much evidence).
Considerable uncertainties still surround the estimates of anthropogenic aerosol emissions. As regards global sulphur emissions, these appear to have declined from 75 ± 10 MtS in 1990 to 55-62 MtS in 2000. Data on non-sulphur aerosols are sparse and highly speculative. (medium agreement, medium evidence).
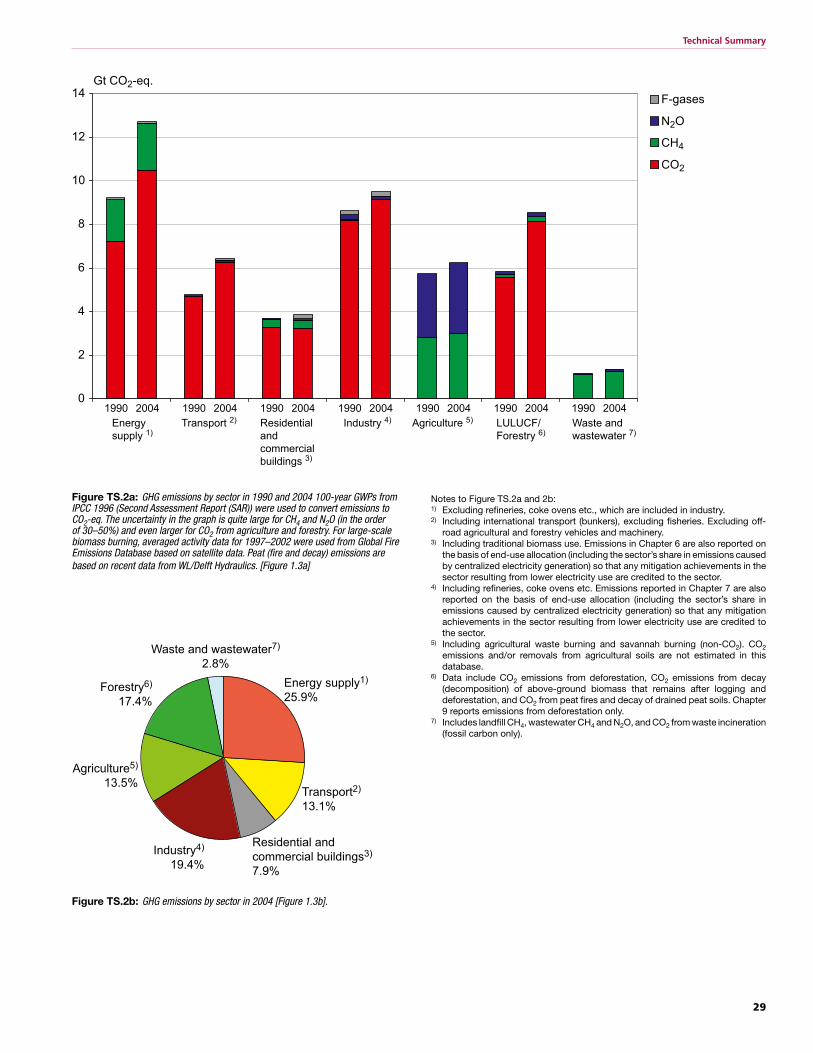
In 2004, energy supply accounted for about 26% of GHG emissions, industry 19%, gases released from land-use change and forestry 17%, agriculture 14%, transport 13%, residential, commercial and service sectors 8% and waste 3% (see Figure TS.2). These figures should be seen as indicative, as some uncertainty remains, particularly with regards to CH4 and N2O emissions (error margin estimated to be in the order of 30-50%) and CO2 emissions from agriculture and forestry with an even higher error margin (high agreement, medium evidence) [1.3].
28
Technical Summary
Notes:1) Other N2O includes industrial processes, deforestation/ savannah burning,
waste water and waste incineration.2) Other is CH4 from industrial processes and savannah burning.3) Including emissions from bioenergy production and use4) CO2 emissions from decay (decomposition) of above ground biomass that
remains after logging and deforestation and CO2 from peat fires and decay of drained peat soils.
5) As well as traditional biomass use at 10% of total, assuming 90% is from sustainable biomass production. Corrected for the 10% of carbon in biomass that is assumed to remain as charcoal after combustion.
6) For large-scale forest and scrubland biomass burning averaged data for 1997-2002 based on Global Fire Emissions Data base satellite data.
7) Cement production and natural gas flaring.8) Fossil fuel use includes emissions from feedstocks.
0
5
10
15
20
25
30
1970 1980 1990 2000 2004
CO2 fossil fuel use8)
0
5
10
CO2 other7)
CO2 decay and peat4)
CO2 deforestation5) 6)
0
5
10
CH4 waste
CH4 other2)
CH4 agriculture
CH4 energy3)
0
5 N2O other1)
N2O agriculture
0
5Gt CO2eq/yr
HFCs, PFCs, SF6
0
10
20
30
40
50
1970 1980 1990 2000 2004
Total GHG
CO2 fossil fuel use56.6%
CO2 (deforestation,decay of biomass, etc)17.3%
CH414.3%
N2O7.9%
F-gases1.1%
CO2 (other)2.8%
Figure TS.1a: Global anthropogenic greenhouse gas emissions, 1970–2004. One hundred year global warming potentials (GWPs) from IPCC 1996 (SAR) were used to convert emissions to CO2-eq. (see the UNFCCC reporting guidelines). Gases are those reported under UNFCCC reporting guidelines. The uncertainty in the graph is quite large for CH4 and N2O (in the order of 30-50%) and even larger for CO2 from agriculture and forestry. [Figure 1.1a].
Figure TS.1b: Global anthropogenic greenhousegas emissions in 2004 [Figure 1.1b].
29
Technical Summary
Figure TS.2a: GHG emissions by sector in 1990 and 2004 100-year GWPs from IPCC 1996 (Second Assessment Report (SAR)) were used to convert emissions to CO2-eq. The uncertainty in the graph is quite large for CH4 and N2O (in the order of 30–50%) and even larger for CO2 from agriculture and forestry. For large-scale biomass burning, averaged activity data for 1997–2002 were used from Global Fire Emissions Database based on satellite data. Peat (fire and decay) emissions are based on recent data from WL/Delft Hydraulics. [Figure 1.3a]
Figure TS.2b: GHG emissions by sector in 2004 [Figure 1.3b].
Notes to Figure TS.2a and 2b: 1) Excluding refineries, coke ovens etc., which are included in industry.2) Including international transport (bunkers), excluding fisheries. Excluding off-
road agricultural and forestry vehicles and machinery. 3) Including traditional biomass use. Emissions in Chapter 6 are also reported on
the basis of end-use allocation (including the sector’s share in emissions caused by centralized electricity generation) so that any mitigation achievements in the sector resulting from lower electricity use are credited to the sector.
4) Including refineries, coke ovens etc. Emissions reported in Chapter 7 are also reported on the basis of end-use allocation (including the sector’s share in emissions caused by centralized electricity generation) so that any mitigation achievements in the sector resulting from lower electricity use are credited to the sector.
5) Including agricultural waste burning and savannah burning (non-CO2). CO2 emissions and/or removals from agricultural soils are not estimated in this database.
6) Data include CO2 emissions from deforestation, CO2 emissions from decay (decomposition) of above-ground biomass that remains after logging and deforestation, and CO2 from peat fires and decay of drained peat soils. Chapter 9 reports emissions from deforestation only.
7) Includes landfill CH4, wastewater CH4 and N2O, and CO2 from waste incineration (fossil carbon only).
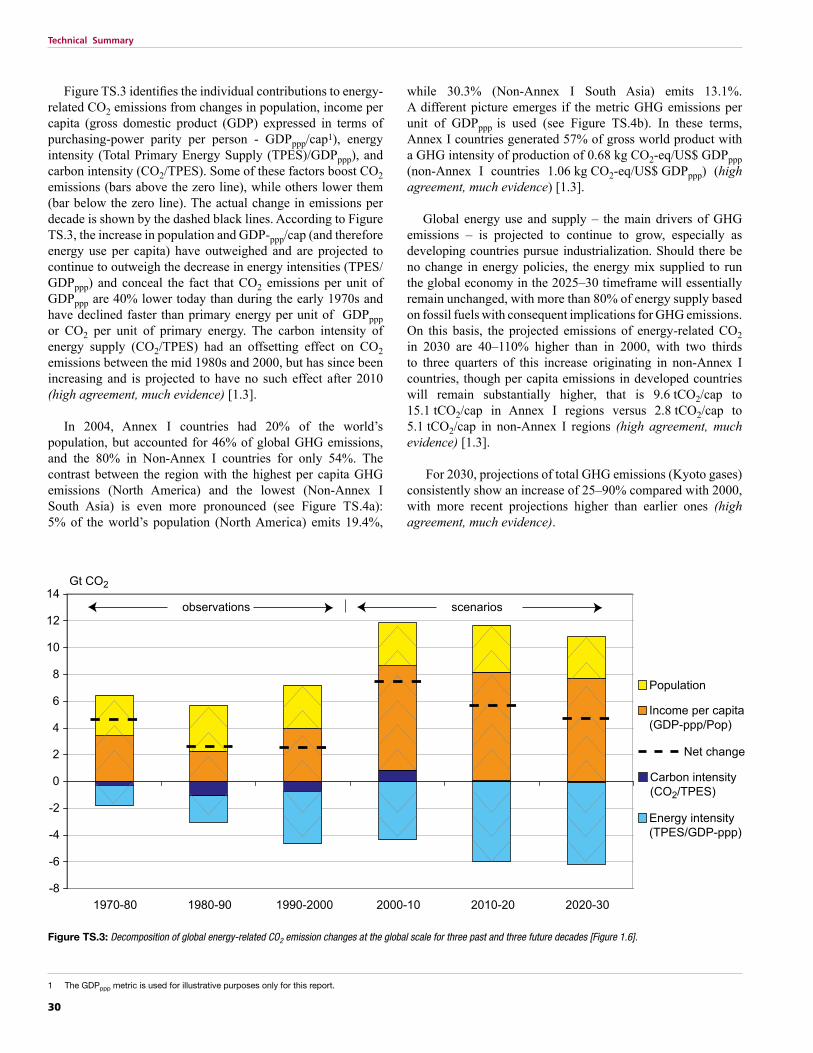
Figure TS.3 identifies the individual contributions to energy-related CO2 emissions from changes in population, income per capita (gross domestic product (GDP) expressed in terms of purchasing-power parity per person - GDPppp/cap1), energy intensity (Total Primary Energy Supply (TPES)/GDPppp), and carbon intensity (CO2/TPES). Some of these factors boost CO2 emissions (bars above the zero line), while others lower them (bar below the zero line). The actual change in emissions per decade is shown by the dashed black lines. According to Figure TS.3, the increase in population and GDP-ppp/cap (and therefore energy use per capita) have outweighed and are projected to continue to outweigh the decrease in energy intensities (TPES/GDPppp) and conceal the fact that CO2 emissions per unit of GDPppp are 40% lower today than during the early 1970s and have declined faster than primary energy per unit of GDPppp or CO2 per unit of primary energy. The carbon intensity of energy supply (CO2/TPES) had an offsetting effect on CO2 emissions between the mid 1980s and 2000, but has since been increasing and is projected to have no such effect after 2010 (high agreement, much evidence) [1.3].
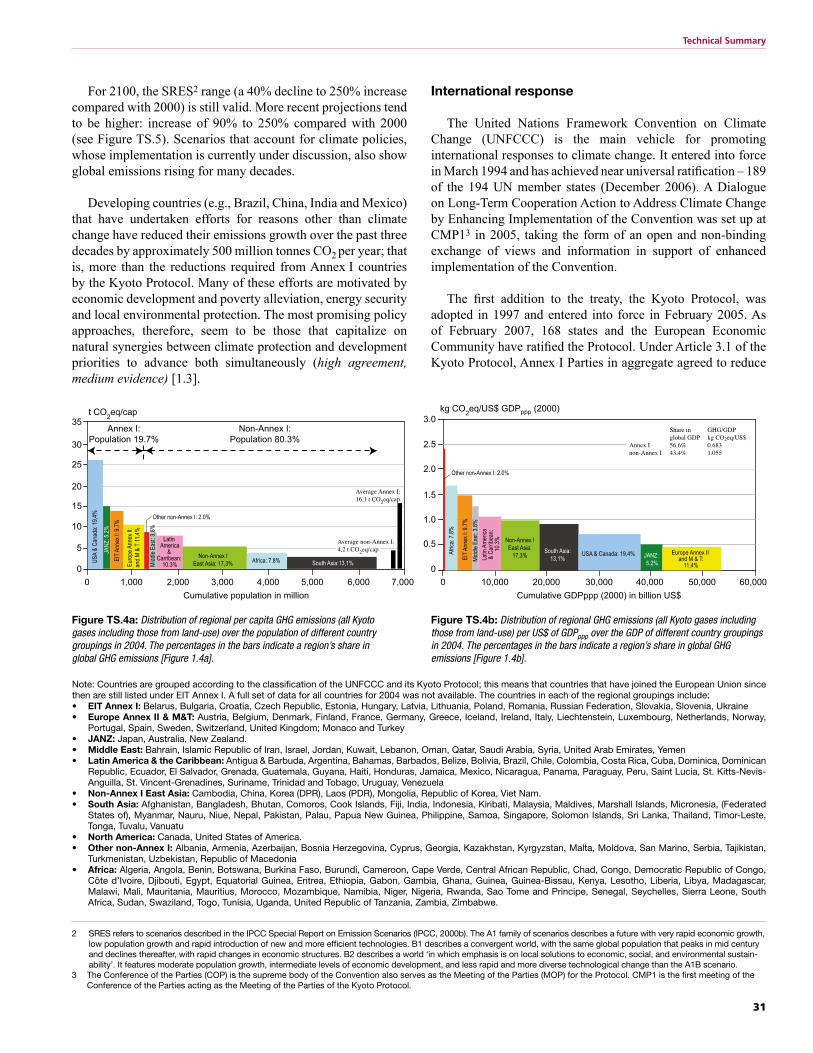
In 2004, Annex I countries had 20% of the world’s population, but accounted for 46% of global GHG emissions, and the 80% in Non-Annex I countries for only 54%. The contrast between the region with the highest per capita GHG emissions (North America) and the lowest (Non-Annex I South Asia) is even more pronounced (see Figure TS.4a): 5% of the world’s population (North America) emits 19.4%,
while 30.3% (Non-Annex I South Asia) emits 13.1%. A different picture emerges if the metric GHG emissions per unit of GDPppp is used (see Figure TS.4b). In these terms, Annex I countries generated 57% of gross world product with a GHG intensity of production of 0.68 kg CO2-eq/US$ GDPppp (non-Annex I countries 1.06 kg CO2-eq/US$ GDPppp) (high agreement, much evidence) [1.3].
Global energy use and supply – the main drivers of GHG emissions – is projected to continue to grow, especially as developing countries pursue industrialization. Should there be no change in energy policies, the energy mix supplied to run the global economy in the 2025–30 timeframe will essentially remain unchanged, with more than 80% of energy supply based on fossil fuels with consequent implications for GHG emissions. On this basis, the projected emissions of energy-related CO2 in 2030 are 40–110% higher than in 2000, with two thirds to three quarters of this increase originating in non-Annex I countries, though per capita emissions in developed countries will remain substantially higher, that is 9.6 tCO2/cap to 15.1 tCO2/cap in Annex I regions versus 2.8 tCO2/cap to 5.1 tCO2/cap in non-Annex I regions (high agreement, much evidence) [1.3].
For 2030, projections of total GHG emissions (Kyoto gases) consistently show an increase of 25–90% compared with 2000, with more recent projections higher than earlier ones (high agreement, much evidence).
1 The GDPppp metric is used for illustrative purposes only for this report.
Figure TS.3: Decomposition of global energy-related CO2 emission changes at the global scale for three past and three future decades [Figure 1.6].
-8
-6
-4
-2
0
2
4
6
8
10
12
14
1970-80 1980-90 1990-2000 2000-10 2010-20 2020-30
Gt CO2
Carbon intensity(CO2/TPES)
Energy intensity(TPES/GDP-ppp)
Income per capita(GDP-ppp/Pop)
Population
Net change
observations scenarios
31
Technical Summary
International response
The United Nations Framework Convention on Climate Change (UNFCCC) is the main vehicle for promoting international responses to climate change. It entered into force in March 1994 and has achieved near universal ratification – 189 of the 194 UN member states (December 2006). A Dialogue on Long-Term Cooperation Action to Address Climate Change by Enhancing Implementation of the Convention was set up at CMP13 in 2005, taking the form of an open and non-binding exchange of views and information in support of enhanced implementation of the Convention.
The first addition to the treaty, the Kyoto Protocol, was adopted in 1997 and entered into force in February 2005. As of February 2007, 168 states and the European Economic Community have ratified the Protocol. Under Article 3.1 of the Kyoto Protocol, Annex I Parties in aggregate agreed to reduce
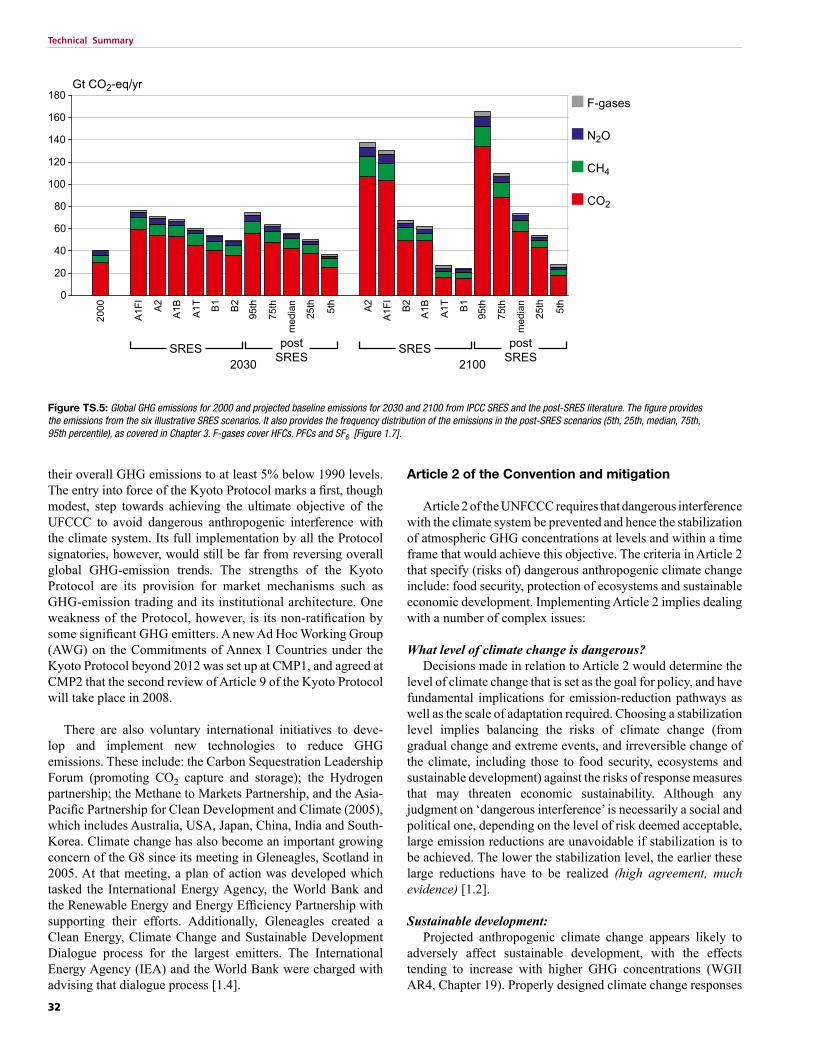
For 2100, the SRES2 range (a 40% decline to 250% increase compared with 2000) is still valid. More recent projections tend to be higher: increase of 90% to 250% compared with 2000 (see Figure TS.5). Scenarios that account for climate policies, whose implementation is currently under discussion, also show global emissions rising for many decades.
Developing countries (e.g., Brazil, China, India and Mexico) that have undertaken efforts for reasons other than climate change have reduced their emissions growth over the past three decades by approximately 500 million tonnes CO2 per year; that is, more than the reductions required from Annex I countries by the Kyoto Protocol. Many of these efforts are motivated by economic development and poverty alleviation, energy security and local environmental protection. The most promising policy approaches, therefore, seem to be those that capitalize on natural synergies between climate protection and development priorities to advance both simultaneously (high agreement, medium evidence) [1.3].
Figure TS.4a: Distribution of regional per capita GHG emissions (all Kyoto gases including those from land-use) over the population of different country groupings in 2004. The percentages in the bars indicate a region’s share in global GHG emissions [Figure 1.4a].
Figure TS.4b: Distribution of regional GHG emissions (all Kyoto gases including those from land-use) per US$ of GDPppp over the GDP of different country groupings in 2004. The percentages in the bars indicate a region’s share in global GHG emissions [Figure 1.4b].
Note: Countries are grouped according to the classification of the UNFCCC and its Kyoto Protocol; this means that countries that have joined the European Union since then are still listed under EIT Annex I. A full set of data for all countries for 2004 was not available. The countries in each of the regional groupings include: • EIT Annex I: Belarus, Bulgaria, Croatia, Czech Republic, Estonia, Hungary, Latvia, Lithuania, Poland, Romania, Russian Federation, Slovakia, Slovenia, Ukraine• Europe Annex II & M&T: Austria, Belgium, Denmark, Finland, France, Germany, Greece, Iceland, Ireland, Italy, Liechtenstein, Luxembourg, Netherlands, Norway,
Portugal, Spain, Sweden, Switzerland, United Kingdom; Monaco and Turkey• JANZ: Japan, Australia, New Zealand.• Middle East: Bahrain, Islamic Republic of Iran, Israel, Jordan, Kuwait, Lebanon, Oman, Qatar, Saudi Arabia, Syria, United Arab Emirates, Yemen• Latin America & the Caribbean: Antigua & Barbuda, Argentina, Bahamas, Barbados, Belize, Bolivia, Brazil, Chile, Colombia, Costa Rica, Cuba, Dominica, Dominican
Republic, Ecuador, El Salvador, Grenada, Guatemala, Guyana, Haiti, Honduras, Jamaica, Mexico, Nicaragua, Panama, Paraguay, Peru, Saint Lucia, St. Kitts-Nevis-Anguilla, St. Vincent-Grenadines, Suriname, Trinidad and Tobago, Uruguay, Venezuela
• Non-Annex I East Asia: Cambodia, China, Korea (DPR), Laos (PDR), Mongolia, Republic of Korea, Viet Nam.• South Asia: Afghanistan, Bangladesh, Bhutan, Comoros, Cook Islands, Fiji, India, Indonesia, Kiribati, Malaysia, Maldives, Marshall Islands, Micronesia, (Federated
States of), Myanmar, Nauru, Niue, Nepal, Pakistan, Palau, Papua New Guinea, Philippine, Samoa, Singapore, Solomon Islands, Sri Lanka, Thailand, Timor-Leste, Tonga, Tuvalu, Vanuatu
• North America: Canada, United States of America.• Other non-Annex I: Albania, Armenia, Azerbaijan, Bosnia Herzegovina, Cyprus, Georgia, Kazakhstan, Kyrgyzstan, Malta, Moldova, San Marino, Serbia, Tajikistan,
Turkmenistan, Uzbekistan, Republic of Macedonia• Africa: Algeria, Angola, Benin, Botswana, Burkina Faso, Burundi, Cameroon, Cape Verde, Central African Republic, Chad, Congo, Democratic Republic of Congo,
Côte d’Ivoire, Djibouti, Egypt, Equatorial Guinea, Eritrea, Ethiopia, Gabon, Gambia, Ghana, Guinea, Guinea-Bissau, Kenya, Lesotho, Liberia, Libya, Madagascar, Malawi, Mali, Mauritania, Mauritius, Morocco, Mozambique, Namibia, Niger, Nigeria, Rwanda, Sao Tome and Principe, Senegal, Seychelles, Sierra Leone, South Africa, Sudan, Swaziland, Togo, Tunisia, Uganda, United Republic of Tanzania, Zambia, Zimbabwe.
2 SRES refers to scenarios described in the IPCC Special Report on Emission Scenarios (IPCC, 2000b). The A1 family of scenarios describes a future with very rapid economic growth, low population growth and rapid introduction of new and more efficient technologies. B1 describes a convergent world, with the same global population that peaks in mid century and declines thereafter, with rapid changes in economic structures. B2 describes a world ‘in which emphasis is on local solutions to economic, social, and environmental sustain-ability’. It features moderate population growth, intermediate levels of economic development, and less rapid and more diverse technological change than the A1B scenario.
3 The Conference of the Parties (COP) is the supreme body of the Convention also serves as the Meeting of the Parties (MOP) for the Protocol. CMP1 is the first meeting of the Conference of the Parties acting as the Meeting of the Parties of the Kyoto Protocol.
their overall GHG emissions to at least 5% below 1990 levels. The entry into force of the Kyoto Protocol marks a first, though modest, step towards achieving the ultimate objective of the UFCCC to avoid dangerous anthropogenic interference with the climate system. Its full implementation by all the Protocol signatories, however, would still be far from reversing overall global GHG-emission trends. The strengths of the Kyoto Protocol are its provision for market mechanisms such as GHG-emission trading and its institutional architecture. One weakness of the Protocol, however, is its non-ratification by some significant GHG emitters. A new Ad Hoc Working Group (AWG) on the Commitments of Annex I Countries under the Kyoto Protocol beyond 2012 was set up at CMP1, and agreed at CMP2 that the second review of Article 9 of the Kyoto Protocol will take place in 2008.
There are also voluntary international initiatives to deve- lop and implement new technologies to reduce GHG emissions. These include: the Carbon Sequestration Leadership Forum (promoting CO2 capture and storage); the Hydrogen partnership; the Methane to Markets Partnership, and the Asia-Pacific Partnership for Clean Development and Climate (2005), which includes Australia, USA, Japan, China, India and South-Korea. Climate change has also become an important growing concern of the G8 since its meeting in Gleneagles, Scotland in 2005. At that meeting, a plan of action was developed which tasked the International Energy Agency, the World Bank and the Renewable Energy and Energy Efficiency Partnership with supporting their efforts. Additionally, Gleneagles created a Clean Energy, Climate Change and Sustainable Development Dialogue process for the largest emitters. The International Energy Agency (IEA) and the World Bank were charged with advising that dialogue process [1.4].
Article 2 of the Convention and mitigation
Article 2 of the UNFCCC requires that dangerous interference with the climate system be prevented and hence the stabilization of atmospheric GHG concentrations at levels and within a time frame that would achieve this objective. The criteria in Article 2 that specify (risks of) dangerous anthropogenic climate change include: food security, protection of ecosystems and sustainable economic development. Implementing Article 2 implies dealing with a number of complex issues:
What level of climate change is dangerous? Decisions made in relation to Article 2 would determine the
level of climate change that is set as the goal for policy, and have fundamental implications for emission-reduction pathways as well as the scale of adaptation required. Choosing a stabilization level implies balancing the risks of climate change (from gradual change and extreme events, and irreversible change of the climate, including those to food security, ecosystems and sustainable development) against the risks of response measures that may threaten economic sustainability. Although any judgment on ‘dangerous interference’ is necessarily a social and political one, depending on the level of risk deemed acceptable, large emission reductions are unavoidable if stabilization is to be achieved. The lower the stabilization level, the earlier these large reductions have to be realized (high agreement, much evidence) [1.2].
Sustainable development: Projected anthropogenic climate change appears likely to
adversely affect sustainable development, with the effects tending to increase with higher GHG concentrations (WGII AR4, Chapter 19). Properly designed climate change responses
0
20
40
60
80
100
120
140
160
180F-gases
N2O
CH4
CO2
Gt CO2-eq/yr
A1F
I
2000 A
2
A1B
A1T B
1
B2
95th
75th
med
ian
25th
5th
2030SRES post
SRES
A1F
I
A2
A1B
A1T B
1
B2
95th
75th
med
ian
25th
5th
2100SRES post
SRES
Figure TS.5: Global GHG emissions for 2000 and projected baseline emissions for 2030 and 2100 from IPCC SRES and the post-SRES literature. The figure provides the emissions from the six illustrative SRES scenarios. It also provides the frequency distribution of the emissions in the post-SRES scenarios (5th, 25th, median, 75th, 95th percentile), as covered in Chapter 3. F-gases cover HFCs, PFCs and SF6 [Figure 1.7].
33
Technical Summary
can be an integral part of sustainable development and the two can be mutually reinforcing. Mitigation of climate change can conserve or enhance natural capital (ecosystems, the environment as sources and sinks for economic activities) and prevent or avoid damage to human systems and, thereby contribute to the overall productivity of capital needed for socio-economic development, including mitigative and adaptive capacity. In turn, sustainable development paths can reduce vulnerability to climate change and reduce GHG emissions (medium agreement, much evidence) [1.2].
Distributional issues: Climate change is subject to a very asymmetric distribution
of present emissions and future impacts and vulnerabilities. Equity can be elaborated in terms of distributing the costs of mitigation or adaptation, distributing future emission rights and ensuring institutional and procedural fairness. Because the industrialized nations are the source of most past and current GHG emissions and have the technical and financial capability to act, the Convention places the heaviest burden for the first steps in mitigating climate change on them. This is enshrined in the principle of ‘common but differentiated responsibilities’ (high agreement, much evidence) [1.2].
Timing: Due to the inertia of both climate and socio-economic
systems, the benefits of mitigation actions initiated now may result in significant avoided climate change only after several decades. This means that mitigation actions need to start in the short term in order to have medium- and longer-term benefits and to avoid lock-in of carbon-intensive technologies (high agreement, much evidence) [1.2].
Mitigation and adaptation: Adaptation and mitigation are two types of policy response
to climate change, which can be complementary, substitutable or independent of each other. Irrespective of the scale of mitigation measures, adaptation measures will be required anyway, due to the inertia in the climate system. Over the next 20 years or so, even the most aggressive climate policy can do little to avoid warming already ‘loaded’ into the climate system. The benefits of avoided climate change will only accrue beyond that time. Over longer time frames, beyond the next few decades, mitigation investments have a greater potential to avoid climate change damage and this potential is larger than the adaptation options that can currently be envisaged (medium agreement, medium evidence) [1.2].
Risk and uncertainty: An important aspect in the implementation of Article 2 is
the uncertainty involved in assessing the risk and severity of climate change impacts and evaluating the level of mitigation action (and its costs) needed to reduce the risk. Given this uncertainty, decision-making on the implementation of Article 2 would benefit from the incorporation of risk-management principles. A precautionary and anticipatory risk-management approach would incorporate adaptation and
preventive mitigation measures based on the costs and benefits of avoided climate change damage, taking into account the (small) chance of worst-case outcomes (medium agreement, medium evidence) [1.2].
2 Framing issues
Climate change mitigation and sustainable development
There is a two-way relationship between climate change and development. On the one hand vulnerability to climate change is framed and strongly influenced by development patterns and income levels. Decisions about technology, investment, trade, poverty, community rights, social policies or governance, which may seem unrelated to climate policy, may have profound impacts on emissions, the extent of mitigation required, and the cost and benefits that result [2.2.3].
On the other hand, climate change itself, and adaptation and mitigation policies could have significant positive impacts on development in the sense that development can be made more sustainable. This leads to the notion that climate change policies can be considered 1) in their own right (‘climate first’); or 2) as an integral element of sustainable-development policies (‘development first’). Framing the debate as a sustainable development problem rather than a solely environmental one may better address the needs of countries, while acknowledging that the driving forces for emissions are linked to the underlying development path [2.2.3].
Development paths evolve as a result of economic and social transactions, which are influenced by government policies, private sector initiatives and by the preferences and choices of consumers. These include a broad number of policies related to nature conservation, legal frameworks, property rights, rule of law, taxes and regulation, production, security and safety of food, consumption patterns, human and institutional capacity building efforts, R&D, financial schemes, technology transfer, energy efficiency and energy options. These policies do not usually emerge and become implemented as part of a general development-policy package, but are normally targeted towards more specific policy goals like air-pollution standards, food security and health issues, GHG-emission reduction, income generation by specific groups,or development of industries for green technologies. However, significant impacts can arise from such policies on sustainability and greenhouse mitigation and the outcomes of adaptation. The strong relationship between mitigation of climate change and development applies in both developed and developing countries. Chapter 12 and to some extent Chapters 4–11 address these issues in more detail [2.2.5; 2.2.7].
Emerging literature has identified methodological approaches to identify, characterize and analyze the interactions between sustainable development and climate change responses. Several
34
Technical Summary
significant problems in identifying, measuring and quantifying the many variables that are important inputs to any decision-support analysis framework – particularly impacts on natural systems and human health that do not have a market value, and for which all approaches are simplifications of the reality (high agreement, much evidence) [2.3.7].
When many decision makers with different value systems are involved in a decision, it is helpful to be as clear as possible about the value judgments underpinning any analytic outcomes they are expected to draw on. This can be particularly difficult and subtle where analysis aims to illuminate choices associated with high levels of uncertainty and risk (medium agreement, medium evidence) [2.3.2; 2.3.7].
Integrated assessments can inform decision makers of the relationship between geophysical climate change, climate-impact predictions, adaptation potentials and the costs of emission reductions and the benefits of avoided climate change damage. These assessments have frameworks to deal with incomplete or imprecise data.
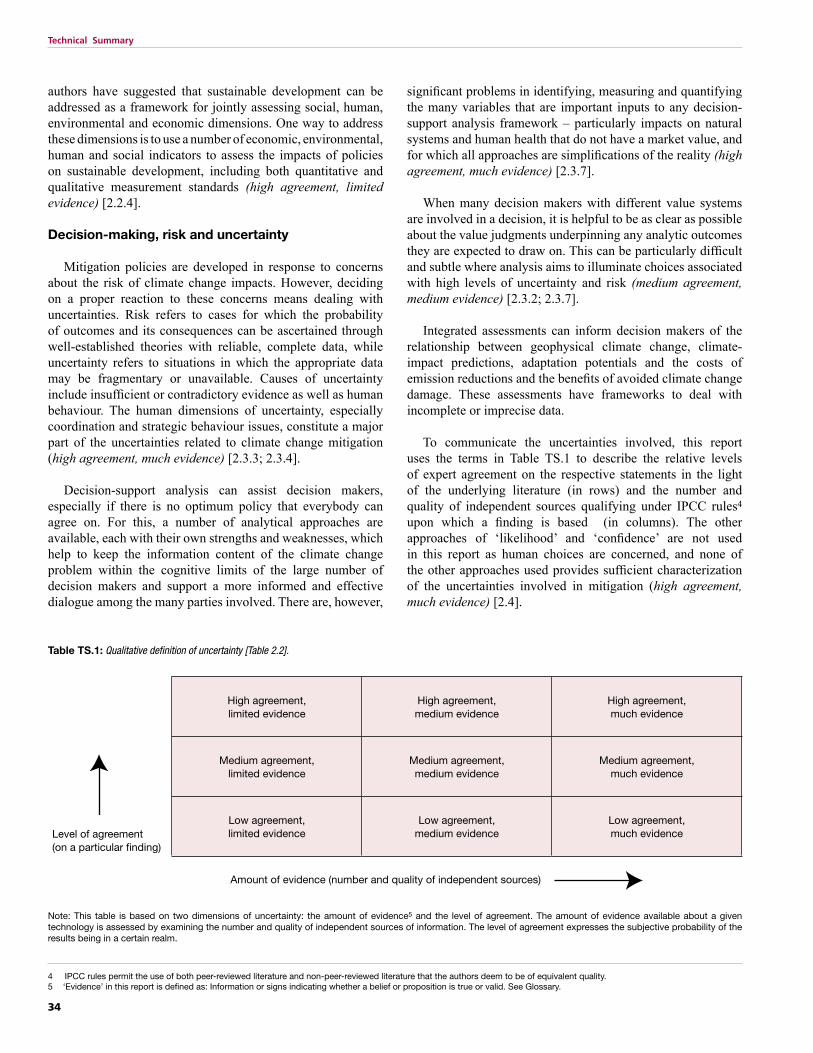
To communicate the uncertainties involved, this report uses the terms in Table TS.1 to describe the relative levels of expert agreement on the respective statements in the light of the underlying literature (in rows) and the number and quality of independent sources qualifying under IPCC rules4 upon which a finding is based (in columns). The other approaches of ‘likelihood’ and ‘confidence’ are not used in this report as human choices are concerned, and none of the other approaches used provides sufficient characterization of the uncertainties involved in mitigation (high agreement, much evidence) [2.4].
Level of agreement (on a particular finding)
High agreement,limited evidence
High agreement,medium evidence
High agreement,much evidence
Medium agreement, limited evidence
Medium agreement,medium evidence
Medium agreement,much evidence
Low agreement,limited evidence
Low agreement,medium evidence
Low agreement,much evidence
Amount of evidence (number and quality of independent sources)
4 IPCC rules permit the use of both peer-reviewed literature and non-peer-reviewed literature that the authors deem to be of equivalent quality. 5 ‘Evidence’ in this report is defined as: Information or signs indicating whether a belief or proposition is true or valid. See Glossary.
authors have suggested that sustainable development can be addressed as a framework for jointly assessing social, human, environmental and economic dimensions. One way to address these dimensions is to use a number of economic, environmental, human and social indicators to assess the impacts of policies on sustainable development, including both quantitative and qualitative measurement standards (high agreement, limited evidence) [2.2.4].
Decision-making, risk and uncertainty
Mitigation policies are developed in response to concerns about the risk of climate change impacts. However, deciding on a proper reaction to these concerns means dealing with uncertainties. Risk refers to cases for which the probability of outcomes and its consequences can be ascertained through well-established theories with reliable, complete data, while uncertainty refers to situations in which the appropriate data may be fragmentary or unavailable. Causes of uncertainty include insufficient or contradictory evidence as well as human behaviour. The human dimensions of uncertainty, especially coordination and strategic behaviour issues, constitute a major part of the uncertainties related to climate change mitigation (high agreement, much evidence) [2.3.3; 2.3.4].
Decision-support analysis can assist decision makers, especially if there is no optimum policy that everybody can agree on. For this, a number of analytical approaches are available, each with their own strengths and weaknesses, which help to keep the information content of the climate change problem within the cognitive limits of the large number of decision makers and support a more informed and effective dialogue among the many parties involved. There are, however,
Table TS.1: Qualitative definition of uncertainty [Table 2.2].
Note: This table is based on two dimensions of uncertainty: the amount of evidence5 and the level of agreement. The amount of evidence available about a given technology is assessed by examining the number and quality of independent sources of information. The level of agreement expresses the subjective probability of the results being in a certain realm.
35
Technical Summary
Costs, benefits, concepts including private and social cost perspectives and relationships with other decision-making frameworks
There are different ways of defining the potential for miti-gation and it is therefore important to specify what potential is meant. ‘Potential’ is used to express the degree of GHG reduction that can be achieved by a mitigation option with a given cost per tonne of carbon avoided over a given period, compared with a baseline or reference case. The measure is usually expressed as million tonnes carbon- or CO2-equivalent emissions avoided compared with baseline emissions [2.4.3].
Market potential is the mitigation potential based on private costs and private discount rates6, which might be expected to occur under forecast market conditions, including policies and measures currently in place, noting that barriers limit actual uptake.
Economic potential is the amount of GHG mitigation, which takes into account social costs and benefits and social discount rates7 assuming that market efficiency is improved by policies and measures and barriers are removed. However, current bottom-up and top-down studies of economic potential have limitations in considering life-style choices and in including all externalities such as local air pollution.
Technical potential is the amount by which it is possible to reduce GHG emissions by implementing a technology or practice that has already been demonstrated. There is no specific reference to costs here, only to ‘practical constraints’, although implicit economic considerations are taken into account in some cases. (high agreement, much evidence) [2.4.3].
Studies of market potential can be used to inform policy makers about mitigation potential with existing policies and barriers, while studies of economic potentials show what might be achieved if appropriate new and additional policies were put into place to remove barriers and include social costs and benefits. The economic potential is therefore generally greater than the market potential.
Mitigation potential is estimated using different types of approaches. There are two broad classes – “bottom-up” and “top-down” approaches, which primarily have been used to assess the economic potential: • Bottom-up studies are based on assessment of mitigation
options, emphasizing specific technologies and regulations. They are typically sectoral studies taking the macro-economy as unchanged. Sector estimates have been aggregated, as in the TAR, to provide an estimate of global mitigation potential for this assessment.
• Top-down studies assess the economy-wide potential of mitigation options. They use globally consistent frameworks
and aggregated information about mitigation options and capture macro-economic and market feedbacks.
Bottom-up studies in particular are useful for the assessment of specific policy options at sectoral level, e.g. options for improving energy efficiency, while top-down studies are useful for assessing cross-sectoral and economy-wide climate change policies, such as carbon taxes and stabilization policies. Bottom-up and top-down models have become more similar since the TAR as top-down models have incorporated more technological mitigation options (see Chapter 11) and bottom-up models have incorporated more macroeconomic and market feedbacks as well as adopting barrier analysis into their model structures.
Mitigation and adaptation relationships; capacities and policies
Climate change mitigation and adaptation have some common elements, they may be complementary, substitutable, independent or competitive in dealing with climate change, and also have very different characteristics and timescales [2.5].
Both adaptation and mitigation make demands on the capacity of societies, which are intimately connected to social and economic development. The responses to climate change depend on exposure to climate risk, society’s natural and man-made capital assets, human capital and institutions as well as income. Together these will define a society’s adaptive and mitigative capacities. Policies that support development and those that enhance its adaptive and mitigative capacities may, but need not, have much in common. Policies may be chosen to have synergetic impacts on the natural system and the socio-economic system but difficult trade-offs may sometimes have to be made. Key factors that determine the capacity of individual stakeholders and societies to implement climate change mitigation and adaptation include: access to resources; markets; finance; information, and a number of governance issues (medium agreement, limited evidence) [2.5.2].
Distributional and equity aspects
Decisions on climate change have large implications for local, national, inter-regional and intergenerational equity, and the application of different equity approaches has major implications for policy recommendations as well as for the distribution of the costs and benefits of climate policies [2.6].
Different approaches to social justice can be applied to the evaluation of the equity consequences of climate change policies. As the IPCC Third Assessment Report (TAR) suggested, given strong subjective preferences for certain equity principles among different stakeholders, it is more effective to look for practical approaches that combine equity principles. Equity approaches vary from traditional economic approaches to rights-
6 Private costs and discount rates reflect the perspective of private consumers and companies; see Glossary for a fuller description.7 Social costs and discount rates reflect the perspective of society. Social discount rates are lower than those used by private investors; see Glossary for a fuller description.
36
Technical Summary
based approaches. An economic approach would be to assess welfare losses and gains to different groups and the society at large, while a rights-based approach would focus on rights, for example, in terms of emissions per capita or GDP allowed for all countries, irrespective of the costs of mitigation or the mitigative capacity. The literature also includes a capability approach that puts the emphasis on opportunities and freedom, which in terms of climate policy can be interpreted as the capacity to mitigate or to adapt or to avoid being vulnerable to climate change (medium agreement, medium evidence) [2.6.3].
Technology research, development, deployment, diffusion and transfer
The pace and cost of any response to climate change concerns will also depend critically on the cost, performance, and availability of technologies that can lower emissions in the future, although other factors such as growth in wealth and population are also highly important [2.7].
Technology simultaneously influences the size of the climate change problem and the cost of its solution. Technology is the broad set of competences and tools covering know-how, experience and equipment, used by humans to produce services and transform resources. The principal role of technology in mitigating GHG emissions is in controlling the social cost of limiting the emissions. Many studies show the significant economic value of the improvements in emission-mitigating technologies that are currently in use and the development and deployment of advanced emission-mitigation technologies (high agreement, much evidence) [2.7.1].
A broad portfolio of technologies can be expected to play a role in meeting the goal of the UNFCCC and managing the risk of climate change, because of the need for large emission reductions, the large variation in national circumstances and
the uncertainty about the performance of individual options. Climate policies are not the only determinant of technological change. However, a review of future scenarios (see Chapter 3) indicates that the overall rate of change of technologies in the absence of climate policies might be as large as, if not larger than, the influence of the climate policies themselves (high agreement, much evidence) [2.7.1].
Technological change is particularly important over the long-term time scales characteristic of climate change. Decade- or century-long time scales are typical for the lags involved between technological innovation and widespread diffusion and of the capital turnover rates characteristic of long-lived energy capital stock and infrastructures.
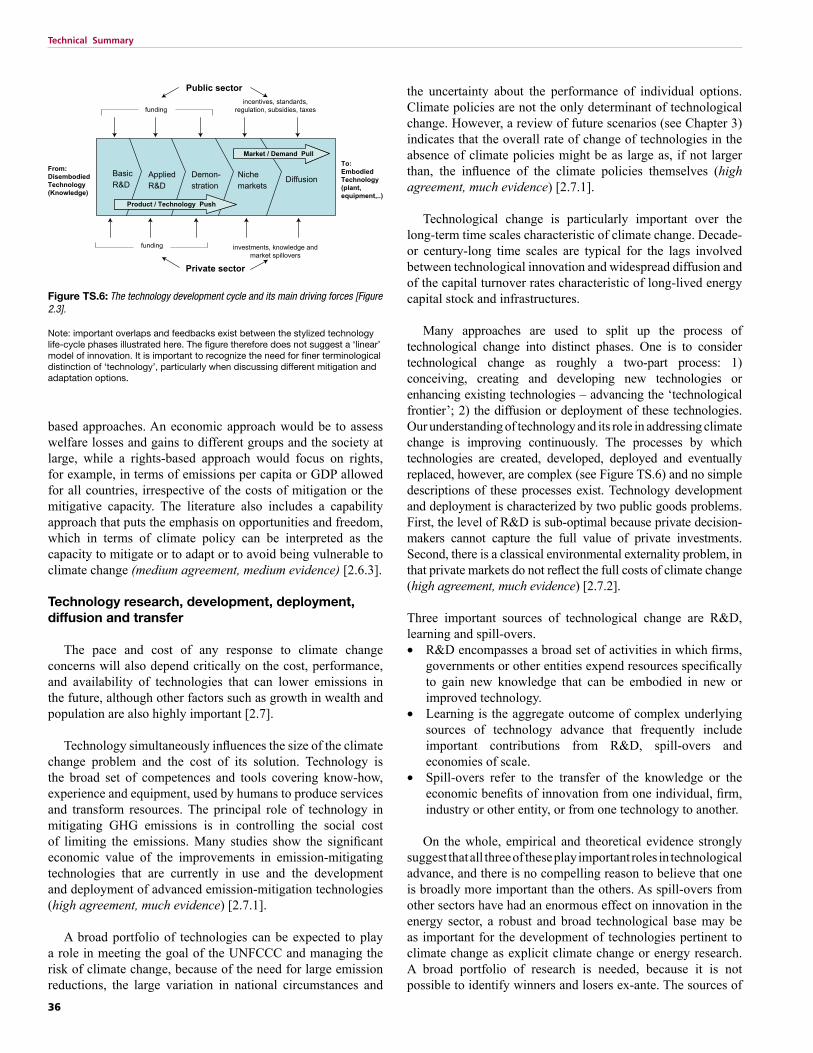
Many approaches are used to split up the process of technological change into distinct phases. One is to consider technological change as roughly a two-part process: 1) conceiving, creating and developing new technologies or enhancing existing technologies – advancing the ‘technological frontier’; 2) the diffusion or deployment of these technologies. Our understanding of technology and its role in addressing climate change is improving continuously. The processes by which technologies are created, developed, deployed and eventually replaced, however, are complex (see Figure TS.6) and no simple descriptions of these processes exist. Technology development and deployment is characterized by two public goods problems. First, the level of R&D is sub-optimal because private decision-makers cannot capture the full value of private investments. Second, there is a classical environmental externality problem, in that private markets do not reflect the full costs of climate change (high agreement, much evidence) [2.7.2].
Three important sources of technological change are R&D, learning and spill-overs.• R&D encompasses a broad set of activities in which firms,
governments or other entities expend resources specifically to gain new knowledge that can be embodied in new or improved technology.
• Learning is the aggregate outcome of complex underlying sources of technology advance that frequently include important contributions from R&D, spill-overs and economies of scale.
• Spill-overs refer to the transfer of the knowledge or the economic benefits of innovation from one individual, firm, industry or other entity, or from one technology to another.
On the whole, empirical and theoretical evidence strongly suggest that all three of these play important roles in technological advance, and there is no compelling reason to believe that one is broadly more important than the others. As spill-overs from other sectors have had an enormous effect on innovation in the energy sector, a robust and broad technological base may be as important for the development of technologies pertinent to climate change as explicit climate change or energy research. A broad portfolio of research is needed, because it is not possible to identify winners and losers ex-ante. The sources of
Figure TS.6: The technology development cycle and its main driving forces [Figure 2.3].
Note: important overlaps and feedbacks exist between the stylized technology life-cycle phases illustrated here. The figure therefore does not suggest a ‘linear’ model of innovation. It is important to recognize the need for finer terminological distinction of ‘technology’, particularly when discussing different mitigation and adaptation options.
37
Technical Summary
technological change are frequently subsumed under the general drivers ‘supply push’ (e.g., via R&D) or ‘demand pull’ (e.g., via learning). These are, however, not simply substitutes, but may have highly complementary interactions (high agreement, much evidence) [2.7.2].
On technology transfer, the main findings of the IPCC Special Report on Methodological and Technological Issues of Technology Transfer (2000) remain valid: that a suitable enabling environment needs to be created in host and recipient countries (high agreement, much evidence) [2.7.3].
Regional Dimensions
Climate change studies have used various different regional definitions, depending on the character of the problem considered and differences in methodological approaches. The multitude of possible regional representations hinders the comparability and transfer of information between the various types of studies done for specific regions and scales. This report largely has chosen a pragmatic ways of analysing regional information and presenting findings [2.8].
3 Issues related to mitigation
in the long-term context
Baseline scenario drivers
Population projections are now generally lower than in the IPCC Special Report on Emission Scenarios (SRES), based on new data indicating that birth rates in many parts of the world have fallen sharply. So far, these new population projections have not been implemented in many of the new emissions scenarios in the literature. The studies that have incorporated them result in more or less the same overall emissions levels, due to changes in other driving factors such as economic growth (high agreement, much evidence) [3.2.1].
Economic growth perspectives have not changed much. There is a considerable overlap in the GDP numbers published, with a slight downwards shift of the median of the new scenarios by about 7% compared with the median in the pre-SRES scenario literature. The data suggest no appreciable change in the distribution of GDP projections. Economic growth projections for Africa, Latin America and the Middle East are lower than in the SRES scenarios (high agreement, much evidence) [3.2.1].
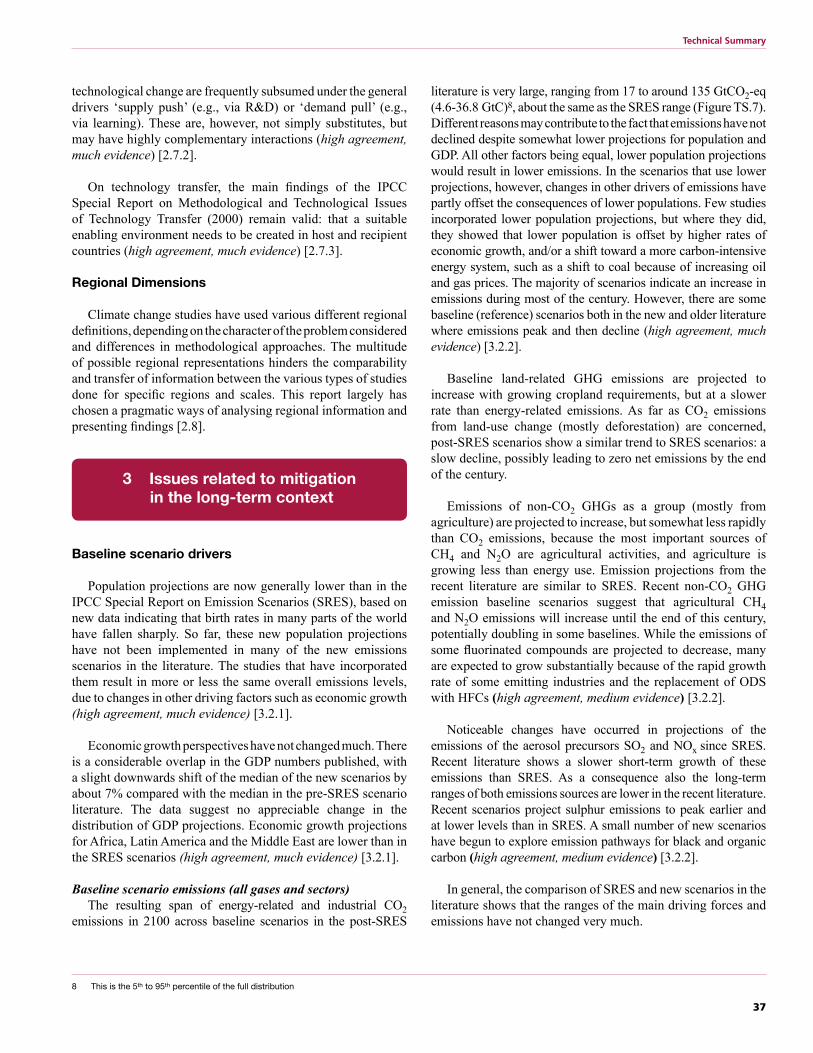
Baseline scenario emissions (all gases and sectors)The resulting span of energy-related and industrial CO2
emissions in 2100 across baseline scenarios in the post-SRES
literature is very large, ranging from 17 to around 135 GtCO2-eq (4.6-36.8 GtC)8, about the same as the SRES range (Figure TS.7). Different reasons may contribute to the fact that emissions have not declined despite somewhat lower projections for population and GDP. All other factors being equal, lower population projections would result in lower emissions. In the scenarios that use lower projections, however, changes in other drivers of emissions have partly offset the consequences of lower populations. Few studies incorporated lower population projections, but where they did, they showed that lower population is offset by higher rates of economic growth, and/or a shift toward a more carbon-intensive energy system, such as a shift to coal because of increasing oil and gas prices. The majority of scenarios indicate an increase in emissions during most of the century. However, there are some baseline (reference) scenarios both in the new and older literature where emissions peak and then decline (high agreement, much evidence) [3.2.2].
Baseline land-related GHG emissions are projected to increase with growing cropland requirements, but at a slower rate than energy-related emissions. As far as CO2 emissions from land-use change (mostly deforestation) are concerned, post-SRES scenarios show a similar trend to SRES scenarios: a slow decline, possibly leading to zero net emissions by the end of the century.
Emissions of non-CO2 GHGs as a group (mostly from agriculture) are projected to increase, but somewhat less rapidly than CO2 emissions, because the most important sources of CH4 and N2O are agricultural activities, and agriculture is growing less than energy use. Emission projections from the recent literature are similar to SRES. Recent non-CO2 GHG emission baseline scenarios suggest that agricultural CH4 and N2O emissions will increase until the end of this century, potentially doubling in some baselines. While the emissions of some fluorinated compounds are projected to decrease, many are expected to grow substantially because of the rapid growth rate of some emitting industries and the replacement of ODS with HFCs (high agreement, medium evidence) [3.2.2].
Noticeable changes have occurred in projections of the emissions of the aerosol precursors SO2 and NOx since SRES. Recent literature shows a slower short-term growth of these emissions than SRES. As a consequence also the long-term ranges of both emissions sources are lower in the recent literature. Recent scenarios project sulphur emissions to peak earlier and at lower levels than in SRES. A small number of new scenarios have begun to explore emission pathways for black and organic carbon (high agreement, medium evidence) [3.2.2].
In general, the comparison of SRES and new scenarios in the literature shows that the ranges of the main driving forces and emissions have not changed very much.
8 This is the 5th to 95th percentile of the full distribution
38
Technical Summary
GDP metrics For long-term scenarios, economic growth is usually reported
in the form of growth in GDP or gross national product (GNP). To get a meaningful comparison of the real size of economic activities over time and between countries, GDP is reported in constant prices taken from a base year.
The choice of the conversion factor, Market Exchange Rate (MER) or Purchasing Power Parity (PPP), depends on the type of analysis being undertaken. However, when it comes to calculating emissions (or other physical measures like energy), the choice between MER and PPP-based representations of GDP should not matter, since emission intensity will change (in a compensating manner) when the GDP numbers change. Thus, if a consistent set of metrics is employed, the choice of metric should not appreciably affect the final emission level. A number of new studies in the literature concur that the actual choice of exchange rates does not itself have an appreciable effect on long-term emission projections. In the case of SRES, the emissions trajectories are the same whether economic activities in the four scenario families are measured in MER or PPP.
There are studies that find some differences in emission levels between PPP and MER-based estimates. These results depend critically on convergence assumptions, among other things. In some of the short-term scenarios (with a horizon to 2030) a bottom-up approach is taken where assumptions about productivity growth and investment/saving decisions are the main drivers of growth in the models. In long-term scenarios, a top-down approach is more commonly used where the actual growth rates are more directly prescribed on the basis of convergence or other assumptions about long-term growth potentials. Different results can also be due to inconsistencies in adjusting the metrics of energy efficiency improvement when moving from MER to PPP-based calculations.
Evidence from the limited number of new PPP-based studies indicates that the choice of metric for GDP (MER or PPP) does not appreciably affect the projected emissions, when the metrics are used consistently. The differences, if any, are small compared with the uncertainties caused by assumptions on other parameters, for example, technological change. The debate clearly shows, however, the need for modellers to be more transparent in explaining conversion factors as well as taking care in making assumptions on exogenous factors (high agreement, much evidence) [3.2.1].
Stabilization scenarios
A commonly used target in the literature is stabilization of CO2 concentrations in the atmosphere. If more than one GHG is studied, a useful alternative is to formulate a GHG-concentration target in terms of CO2-equivalent concentration or radiative forcing, thereby weighting the concentrations of the different gases by their radiative properties. Another option is to stabilize or target global mean temperature. The advantage of radiative-forcing targets over temperature targets is that the calculation of radiative forcing does not depend on climate sensitivity. The disadvantage is that a wide range of temperature impacts is possible for each radiative-forcing level. Temperature targets, on the other hand, have the important advantage of being more directly linked to climate change impacts. Another approach is to calculate the risks or the probability of exceeding particular values of global annual mean temperature rise since pre-industrial times for specific stabilization or radiative-forcing targets.
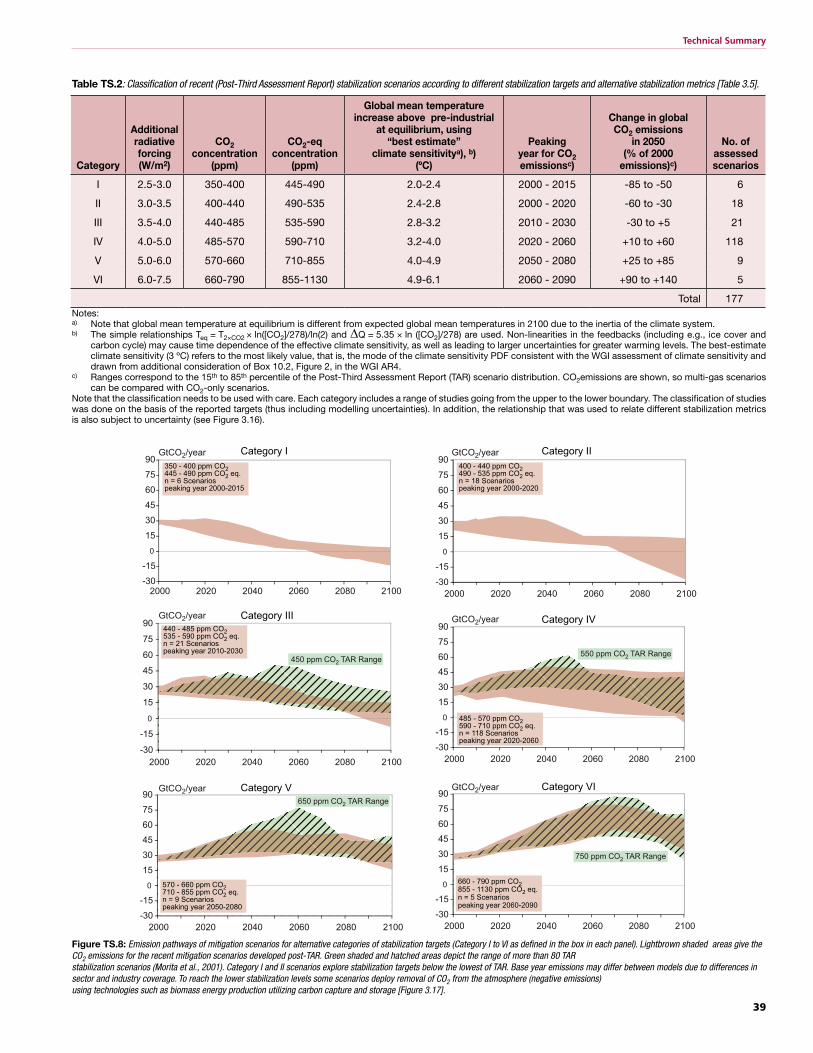
There is a clear and strong correlation between the CO2-equivalent concentrations (or radiative forcing) and the CO2-only concentrations by 2100 in the published studies, because CO2 is the most important contributor to radiative forcing. Based on this relationship, to facilitate scenario comparison and assessment, stabilization scenarios (both multi-gas and CO2-only studies) have been grouped into different categories that vary in the stringency of the targets (Table TS.2).
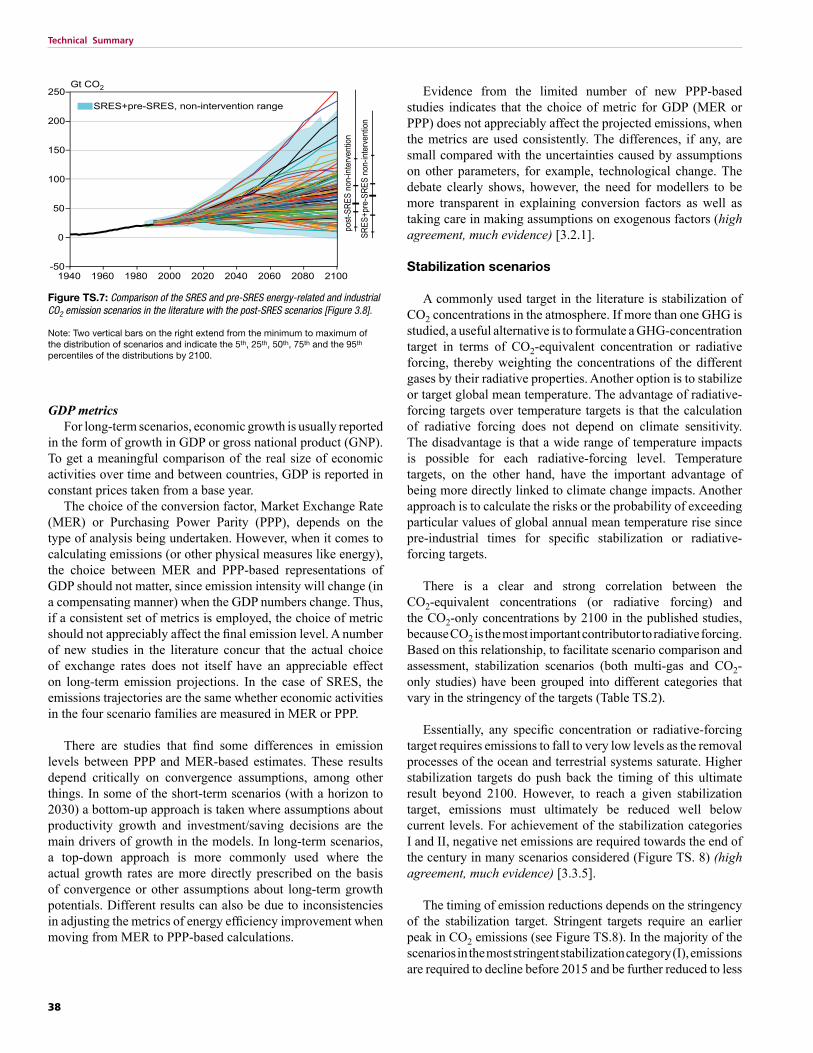
Essentially, any specific concentration or radiative-forcing target requires emissions to fall to very low levels as the removal processes of the ocean and terrestrial systems saturate. Higher stabilization targets do push back the timing of this ultimate result beyond 2100. However, to reach a given stabilization target, emissions must ultimately be reduced well below current levels. For achievement of the stabilization categories I and II, negative net emissions are required towards the end of the century in many scenarios considered (Figure TS. 8) (high agreement, much evidence) [3.3.5].
The timing of emission reductions depends on the stringency of the stabilization target. Stringent targets require an earlier peak in CO2 emissions (see Figure TS.8). In the majority of the scenarios in the most stringent stabilization category (I), emissions are required to decline before 2015 and be further reduced to less
1940 1960 1980 2000 2020 2040 2060 2080 2100-50
0
50
100
150
200
250
post
-SR
ES
non
-inte
rven
tion
SR
ES
+pre
-SR
ES
non
-inte
rven
tion
Gt CO2
SRES+pre-SRES, non-intervention range
Figure TS.7: Comparison of the SRES and pre-SRES energy-related and industrial CO2 emission scenarios in the literature with the post-SRES scenarios [Figure 3.8].
Note: Two vertical bars on the right extend from the minimum to maximum of the distribution of scenarios and indicate the 5th, 25th, 50th, 75th and the 95th percentiles of the distributions by 2100.
39
Technical Summary
Category
Additional radiative forcing(W/m2)
CO2 concentration
(ppm)
CO2-eq concentration
(ppm)
Global mean temperature increase above pre-industrial
at equilibrium, using “best estimate”
climate sensitivitya), b)(ºC)
Peaking year for CO2 emissionsc)
Change in global CO2 emissions
in 2050 (% of 2000
emissions)c)
No. of assessed scenarios
I 2.5-3.0 350-400 445-490 2.0-2.4 2000 - 2015 -85 to -50 6
II 3.0-3.5 400-440 490-535 2.4-2.8 2000 - 2020 -60 to -30 18
III 3.5-4.0 440-485 535-590 2.8-3.2 2010 - 2030 -30 to +5 21
IV 4.0-5.0 485-570 590-710 3.2-4.0 2020 - 2060 +10 to +60 118
V 5.0-6.0 570-660 710-855 4.0-4.9 2050 - 2080 +25 to +85 9
VI 6.0-7.5 660-790 855-1130 4.9-6.1 2060 - 2090 +90 to +140 5
Total 177Notes:a) Note that global mean temperature at equilibrium is different from expected global mean temperatures in 2100 due to the inertia of the climate system.b) The simple relationships Teq = T2×CO2 × ln([CO2]/278)/ln(2) and ΔQ = 5.35 × ln ([CO2]/278) are used. Non-linearities in the feedbacks (including e.g., ice cover and
carbon cycle) may cause time dependence of the effective climate sensitivity, as well as leading to larger uncertainties for greater warming levels. The best-estimate climate sensitivity (3 ºC) refers to the most likely value, that is, the mode of the climate sensitivity PDF consistent with the WGI assessment of climate sensitivity and drawn from additional consideration of Box 10.2, Figure 2, in the WGI AR4.
c) Ranges correspond to the 15th to 85th percentile of the Post-Third Assessment Report (TAR) scenario distribution. CO2emissions are shown, so multi-gas scenarios can be compared with CO2-only scenarios.
Note that the classification needs to be used with care. Each category includes a range of studies going from the upper to the lower boundary. The classification of studies was done on the basis of the reported targets (thus including modelling uncertainties). In addition, the relationship that was used to relate different stabilization metrics is also subject to uncertainty (see Figure 3.16).
Table TS.2: Classification of recent (Post-Third Assessment Report) stabilization scenarios according to different stabilization targets and alternative stabilization metrics [Table 3.5].
Figure TS.8: Emission pathways of mitigation scenarios for alternative categories of stabilization targets (Category I to VI as defined in the box in each panel). Lightbrown shaded areas give the CO2 emissions for the recent mitigation scenarios developed post-TAR. Green shaded and hatched areas depict the range of more than 80 TAR stabilization scenarios (Morita et al., 2001). Category I and II scenarios explore stabilization targets below the lowest of TAR. Base year emissions may differ between models due to differences in sector and industry coverage. To reach the lower stabilization levels some scenarios deploy removal of CO2 from the atmosphere (negative emissions) using technologies such as biomass energy production utilizing carbon capture and storage [Figure 3.17].
-30
-15
0
15
30
45
60
75
90
2000 2020 2040 2060 2080 2100
450 ppm CO2 TAR Range
-30
-15
0
15
30
45
60
75
90
2000 2020 2040 2060 2080 2100
-30
-15
0
15
30
45
60
75
90
2000 2020 2040 2060 2080 2100
650 ppm CO2 TAR Range
-30
-15
0
15
30
45
60
75
90
2000 2020 2040 2060 2080 2100
-30
-15
0
15
30
45
60
75
90
2000 2020 2040 2060 2080 2100-30
-15
0
15
30
45
60
75
90
2000 2020 2040 2060 2080 2100
GtCO2/year
GtCO2/year
GtCO2/year
GtCO2/year
GtCO2/year
GtCO2/year
550 ppm CO2 TAR Range
750 ppm CO2 TAR Range
440 - 485 ppm CO2535 - 590 ppm CO2 eq.n = 21 Scenariospeaking year 2010-2030
570 - 660 ppm CO2710 - 855 ppm CO2 eq.n = 9 Scenariospeaking year 2050-2080
485 - 570 ppm CO2590 - 710 ppm CO2 eq.n = 118 Scenariospeaking year 2020-2060
400 - 440 ppm CO2490 - 535 ppm CO2 eq.n = 18 Scenariospeaking year 2000-2020
350 - 400 ppm CO2445 - 490 ppm CO2 eq.n = 6 Scenariospeaking year 2000-2015
Category I
Category III
Category V
Category II
Category IV
Category VI
660 - 790 ppm CO2855 - 1130 ppm CO2 eq.n = 5 Scenariospeaking year 2060-2090
40
Technical Summary
than 50% of today’s emissions by 2050. For category III, global emissions in the scenarios generally peak around 2010–2030, followed by a return to 2000 levels on average around 2040. For category IV, the median emissions peak around 2040 (Figure TS.9) (high agreement, much evidence).
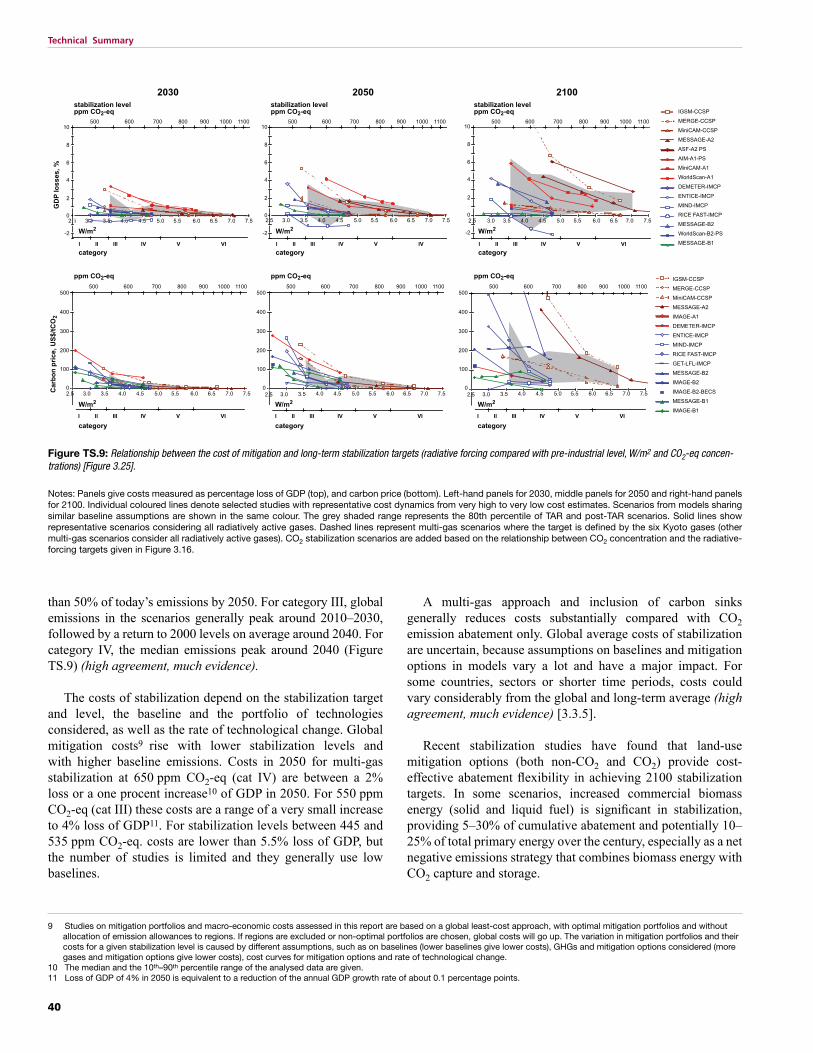
The costs of stabilization depend on the stabilization target and level, the baseline and the portfolio of technologies considered, as well as the rate of technological change. Global mitigation costs9 rise with lower stabilization levels and with higher baseline emissions. Costs in 2050 for multi-gas stabilization at 650 ppm CO2-eq (cat IV) are between a 2% loss or a one procent increase10 of GDP in 2050. For 550 ppm CO2-eq (cat III) these costs are a range of a very small increase to 4% loss of GDP11. For stabilization levels between 445 and 535 ppm CO2-eq. costs are lower than 5.5% loss of GDP, but the number of studies is limited and they generally use low baselines.
A multi-gas approach and inclusion of carbon sinks generally reduces costs substantially compared with CO2 emission abatement only. Global average costs of stabilization are uncertain, because assumptions on baselines and mitigation options in models vary a lot and have a major impact. For some countries, sectors or shorter time periods, costs could vary considerably from the global and long-term average (high agreement, much evidence) [3.3.5].
Recent stabilization studies have found that land-use
mitigation options (both non-CO2 and CO2) provide cost-effective abatement flexibility in achieving 2100 stabilization targets. In some scenarios, increased commercial biomass energy (solid and liquid fuel) is significant in stabilization, providing 5–30% of cumulative abatement and potentially 10–25% of total primary energy over the century, especially as a net negative emissions strategy that combines biomass energy with CO2 capture and storage.
Figure TS.9: Relationship between the cost of mitigation and long-term stabilization targets (radiative forcing compared with pre-industrial level, W/m2 and CO2-eq concen-trations) [Figure 3.25].
Notes: Panels give costs measured as percentage loss of GDP (top), and carbon price (bottom). Left-hand panels for 2030, middle panels for 2050 and right-hand panels for 2100. Individual coloured lines denote selected studies with representative cost dynamics from very high to very low cost estimates. Scenarios from models sharing similar baseline assumptions are shown in the same colour. The grey shaded range represents the 80th percentile of TAR and post-TAR scenarios. Solid lines show representative scenarios considering all radiatively active gases. Dashed lines represent multi-gas scenarios where the target is defined by the six Kyoto gases (other multi-gas scenarios consider all radiatively active gases). CO2 stabilization scenarios are added based on the relationship between CO2 concentration and the radiative-forcing targets given in Figure 3.16.
I II III IV V VI I II III IV V VI I II III IV V VI
I II III IV V VII II III IV V VI
I II III IV V IV I II III IV V VII
W/m2
category
W/m2
category
W/m2
category
W/m2
category
W/m2
category
W/m2
category
W/m2
category
W/m2
category
W/m2
category
II III IV V VI
0
100
200
300
400
500
0
100
200
300
400
500
0
100
200
300
400
500
2030 2050 2100
IGSM-CCSP
MERGE-CCSP
MiniCAM-CCSP
MESSAGE-A2
ASF-A2 PS
AIM-A1-PS
MiniCAM-A1
WorldScan-A1
DEMETER-IMCP
ENTICE-IMCP
MIND-IMCP
RICE FAST-IMCP
MESSAGE-B2
WorldScan-B2-PS
MESSAGE-B1
IGSM-CCSP
MERGE-CCSP
MiniCAM-CCSP
MESSAGE-A2
IMAGE-A1
DEMETER-IMCP
ENTICE-IMCP
MIND-IMCP
RICE FAST-IMCP
GET-LFL-IMCP
MESSAGE-B2
IMAGE-B2
IMAGE-B2-BECS
MESSAGE-B1
IMAGE-B1
IGSM-CCSP
MERGE-CCSP
MiniCAM-CCSP
MESSAGE-A2
IMAGE-A1
DEMETER-IMCP
ENTICE-IMCP
MIND-IMCP
RICE FAST-IMCP
GET-LFL-IMCP
MESSAGE-B2
IMAGE-B2
IMAGE-B2-BECS
MESSAGE-B1
IMAGE-B1
9 Studies on mitigation portfolios and macro-economic costs assessed in this report are based on a global least-cost approach, with optimal mitigation portfolios and without allocation of emission allowances to regions. If regions are excluded or non-optimal portfolios are chosen, global costs will go up. The variation in mitigation portfolios and their costs for a given stabilization level is caused by different assumptions, such as on baselines (lower baselines give lower costs), GHGs and mitigation options considered (more gases and mitigation options give lower costs), cost curves for mitigation options and rate of technological change.
10 The median and the 10th–90th percentile range of the analysed data are given.11 Loss of GDP of 4% in 2050 is equivalent to a reduction of the annual GDP growth rate of about 0.1 percentage points.
41
Technical Summary
The baseline choice is crucial in determining the nature and cost of stabilization. This influence is due mainly to different assumptions about technological change in the baseline scenarios. The role of technologies
Virtually all scenarios assume that technological and structural changes occur during this century, leading to relative reduction of emissions compared with the hypothetical case of attempting to ‘keep’ the emission intensities of GDP and economic structures the same as today (see Chapter 2, Section 2.9.1.3].
Baseline scenarios usually assume significant technological change and diffusion of new and advanced technologies. In mitigation scenarios there is additional technological change ‘induced’ through various policies and measures. Long-term stabilization scenarios highlight the importance of technology improvements, advanced technologies, learning by doing and endogenous technology change both for achieving the stabilization targets and for cost reduction. While the technology improvement and use of advanced technologies have been introduced in scenarios largely exogenously in most of the literature, new literature covers learning-by-doing and endogenous technological change. These newer scenarios show higher benefits of early action, as models assume that early
deployment of technologies leads to benefits of learning and cost reductions (high agreement, much evidence) [3.4].
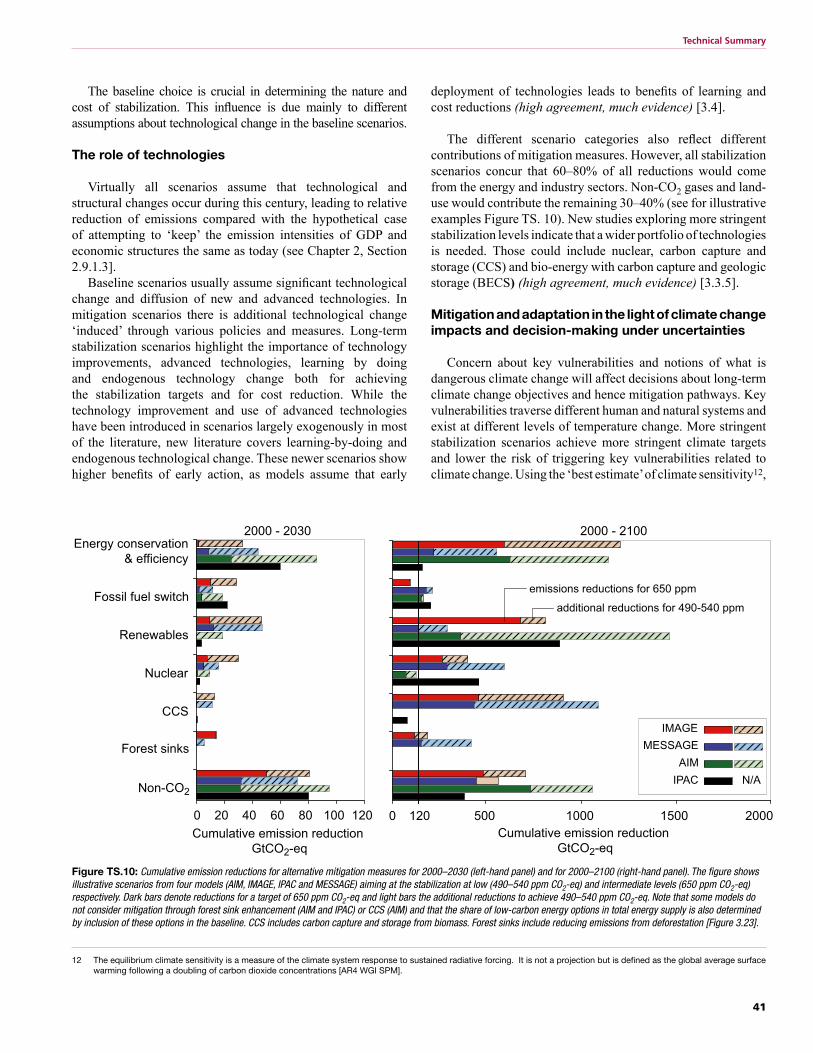
The different scenario categories also reflect different contributions of mitigation measures. However, all stabilization scenarios concur that 60–80% of all reductions would come from the energy and industry sectors. Non-CO2 gases and land-use would contribute the remaining 30–40% (see for illustrative examples Figure TS. 10). New studies exploring more stringent stabilization levels indicate that a wider portfolio of technologies is needed. Those could include nuclear, carbon capture and storage (CCS) and bio-energy with carbon capture and geologic storage (BECS) (high agreement, much evidence) [3.3.5].
Mitigation and adaptation in the light of climate change impacts and decision-making under uncertainties
Concern about key vulnerabilities and notions of what is dangerous climate change will affect decisions about long-term climate change objectives and hence mitigation pathways. Key vulnerabilities traverse different human and natural systems and exist at different levels of temperature change. More stringent stabilization scenarios achieve more stringent climate targets and lower the risk of triggering key vulnerabilities related to climate change. Using the ‘best estimate’ of climate sensitivity12,
12 The equilibrium climate sensitivity is a measure of the climate system response to sustained radiative forcing. It is not a projection but is defined as the global average surface warming following a doubling of carbon dioxide concentrations [AR4 WGI SPM].
Figure TS.10: Cumulative emission reductions for alternative mitigation measures for 2000–2030 (left-hand panel) and for 2000–2100 (right-hand panel). The figure shows illustrative scenarios from four models (AIM, IMAGE, IPAC and MESSAGE) aiming at the stabilization at low (490–540 ppm CO2-eq) and intermediate levels (650 ppm CO2-eq) respectively. Dark bars denote reductions for a target of 650 ppm CO2-eq and light bars the additional reductions to achieve 490–540 ppm CO2-eq. Note that some models do not consider mitigation through forest sink enhancement (AIM and IPAC) or CCS (AIM) and that the share of low-carbon energy options in total energy supply is also determined by inclusion of these options in the baseline. CCS includes carbon capture and storage from biomass. Forest sinks include reducing emissions from deforestation [Figure 3.23].
42
Technical Summary
normative and empirical assumptions that are not known with any certainty. Limited and early analytical results from integrated analyses of the costs and benefits of mitigation indicate that these are broadly comparable in magnitude, but do not as yet permit an unambiguous determination of an emissions pathway or stabilization level where benefits exceed costs. Integrated assessment of the economic costs and benefits of different mitigation pathways shows that the economically optimal timing and level of mitigation depends upon the uncertain shape and character of the assumed climate change damage cost curve. To illustrate this dependency: • if the climate change damage cost curve grows slowly and
regularly, and there is good foresight (which increases the potential for timely adaptation), later and less stringent mitigation is economically justified;
• alternatively if the damage cost curve increases steeply, or contains non-linearities (e.g. vulnerability thresholds or even small probabilities of catastrophic events), earlier and more stringent mitigation is economically justified (high agree- ment, much evidence) [3.6.1].
Linkages between short term and long term
For any chosen GHG-stabilization target, near-term decisions can be made regarding mitigation opportunities to help maintain a consistent emissions trajectory within a range of long-term stabilization targets. Economy-wide modelling of long-term global stabilization targets can help inform near-term mitigation choices. A compilation of results from short-and long-term models using scenarios with stabilization targets in the 3–5 W/m2 range (category II to III), reveals that in 2030, for carbon prices of less than 20 US$/tCO2-eq, emission reductions of in the
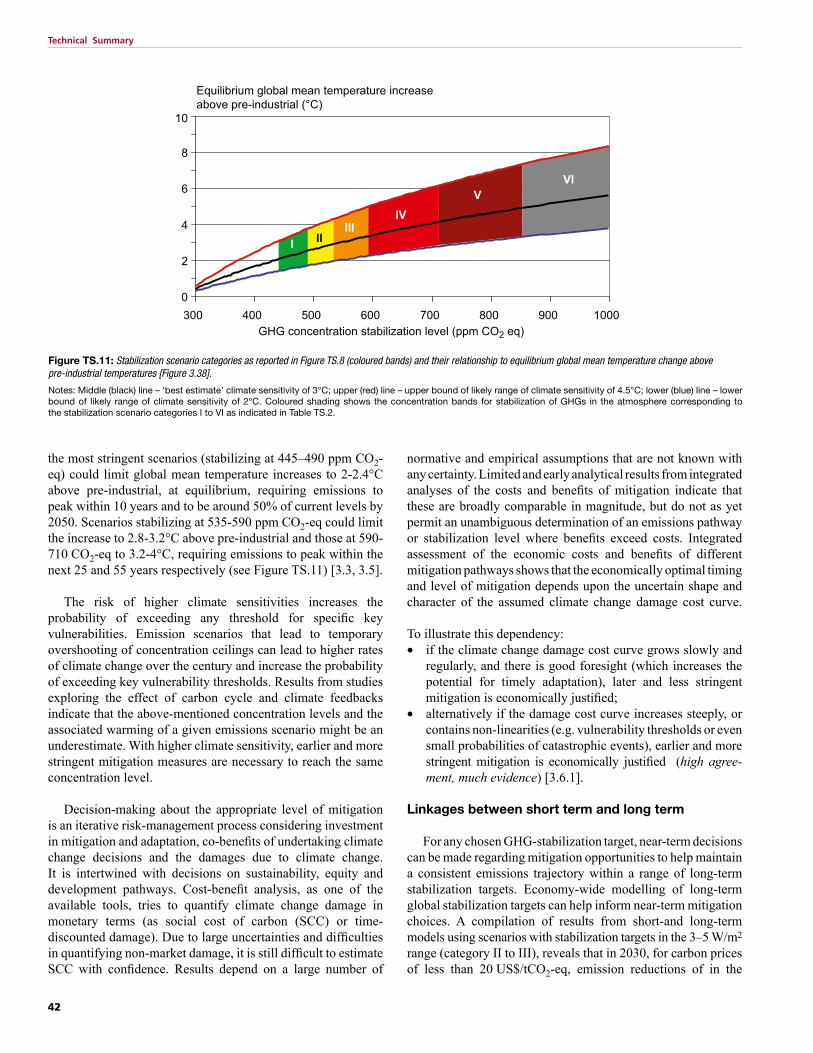
the most stringent scenarios (stabilizing at 445–490 ppm CO2-eq) could limit global mean temperature increases to 2-2.4°C above pre-industrial, at equilibrium, requiring emissions to peak within 10 years and to be around 50% of current levels by 2050. Scenarios stabilizing at 535-590 ppm CO2-eq could limit the increase to 2.8-3.2°C above pre-industrial and those at 590-710 CO2-eq to 3.2-4°C, requiring emissions to peak within the next 25 and 55 years respectively (see Figure TS.11) [3.3, 3.5].
The risk of higher climate sensitivities increases the probability of exceeding any threshold for specific key vulnerabilities. Emission scenarios that lead to temporary overshooting of concentration ceilings can lead to higher rates of climate change over the century and increase the probability of exceeding key vulnerability thresholds. Results from studies exploring the effect of carbon cycle and climate feedbacks indicate that the above-mentioned concentration levels and the associated warming of a given emissions scenario might be an underestimate. With higher climate sensitivity, earlier and more stringent mitigation measures are necessary to reach the same concentration level.
Decision-making about the appropriate level of mitigation is an iterative risk-management process considering investment in mitigation and adaptation, co-benefits of undertaking climate change decisions and the damages due to climate change. It is intertwined with decisions on sustainability, equity and development pathways. Cost-benefit analysis, as one of the available tools, tries to quantify climate change damage in monetary terms (as social cost of carbon (SCC) or time-discounted damage). Due to large uncertainties and difficulties in quantifying non-market damage, it is still difficult to estimate SCC with confidence. Results depend on a large number of
Figure TS.11: Stabilization scenario categories as reported in Figure TS.8 (coloured bands) and their relationship to equilibrium global mean temperature change above pre-industrial temperatures [Figure 3.38].
Notes: Middle (black) line – ‘best estimate’ climate sensitivity of 3°C; upper (red) line – upper bound of likely range of climate sensitivity of 4.5°C; lower (blue) line – lower bound of likely range of climate sensitivity of 2°C. Coloured shading shows the concentration bands for stabilization of GHGs in the atmosphere corresponding to the stabilization scenario categories I to VI as indicated in Table TS.2.
Equilibrium global mean temperature increase above pre-industrial (°C)
I IIIII
IV
VVI
43
Technical Summary
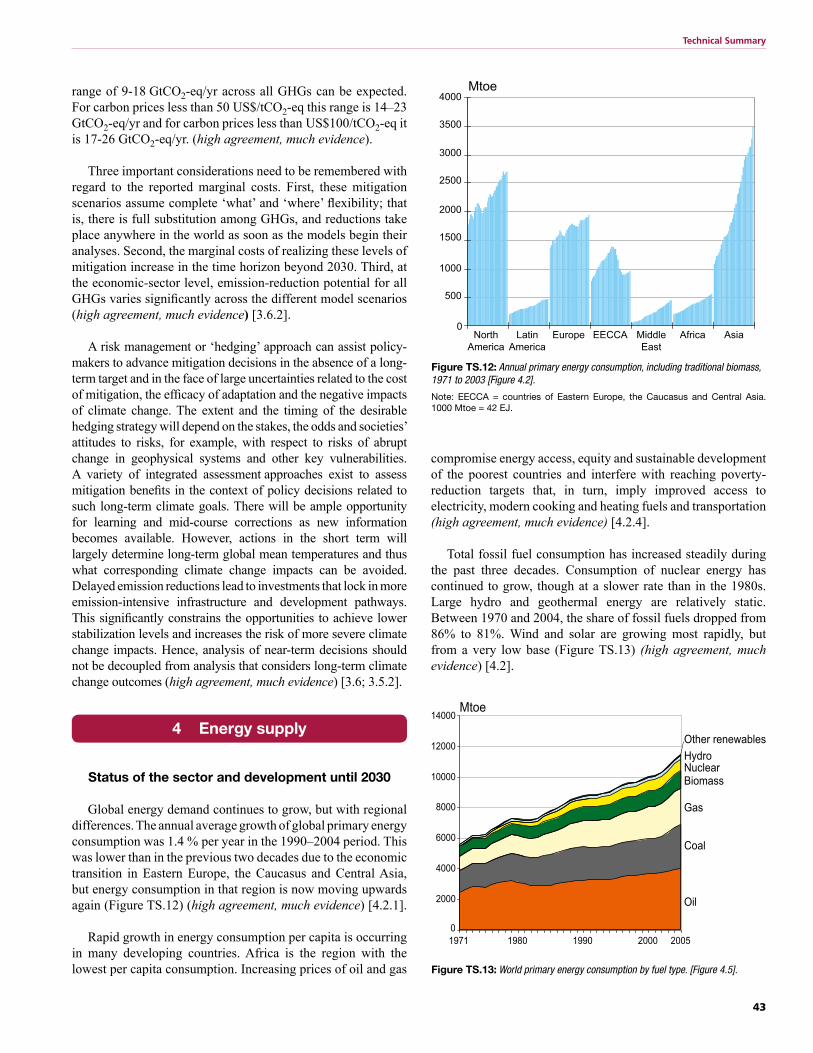
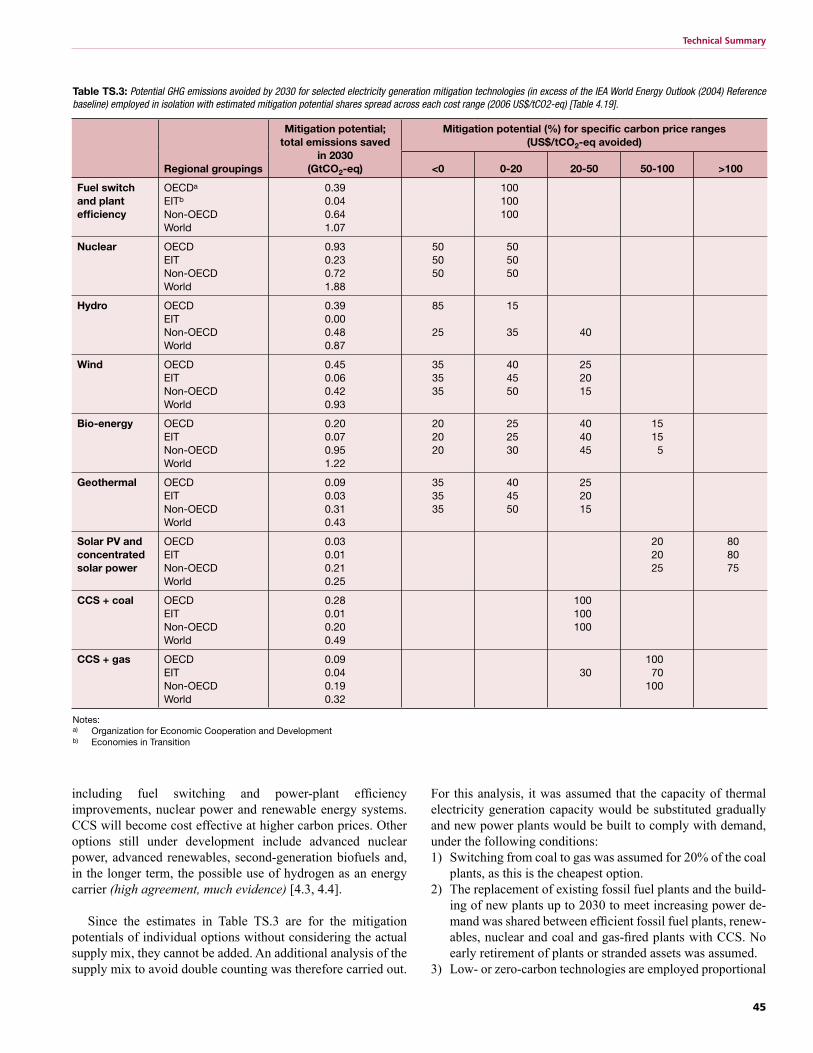
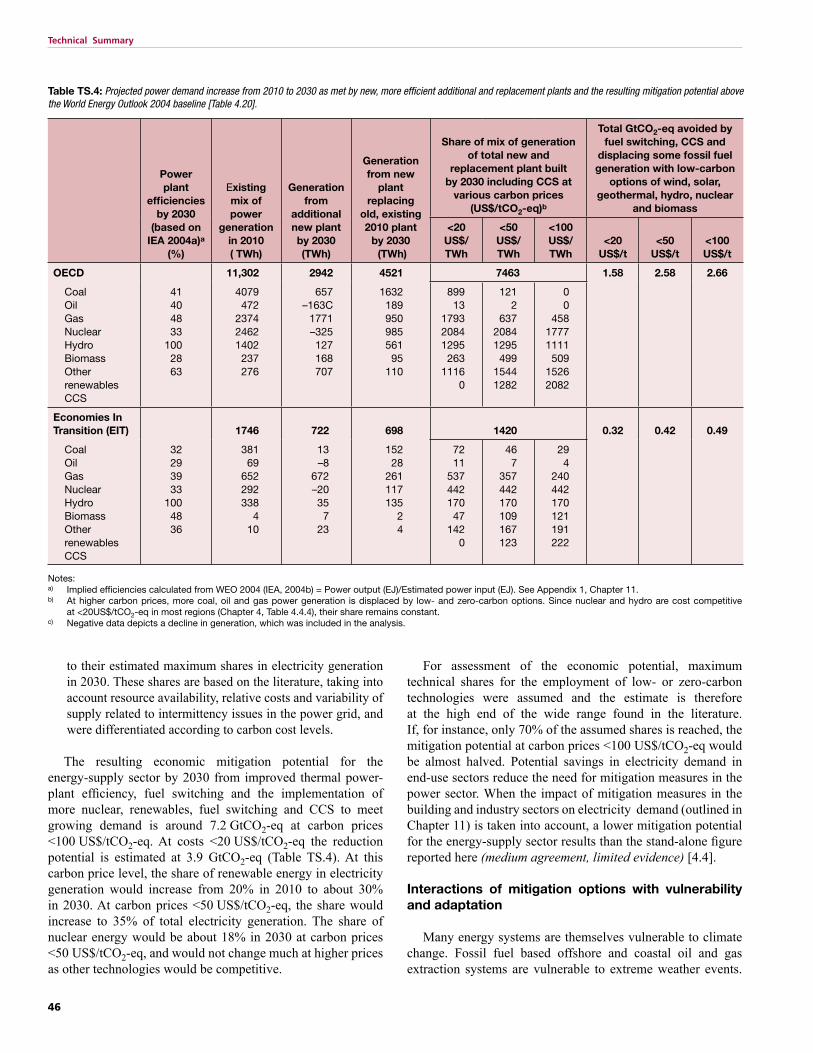
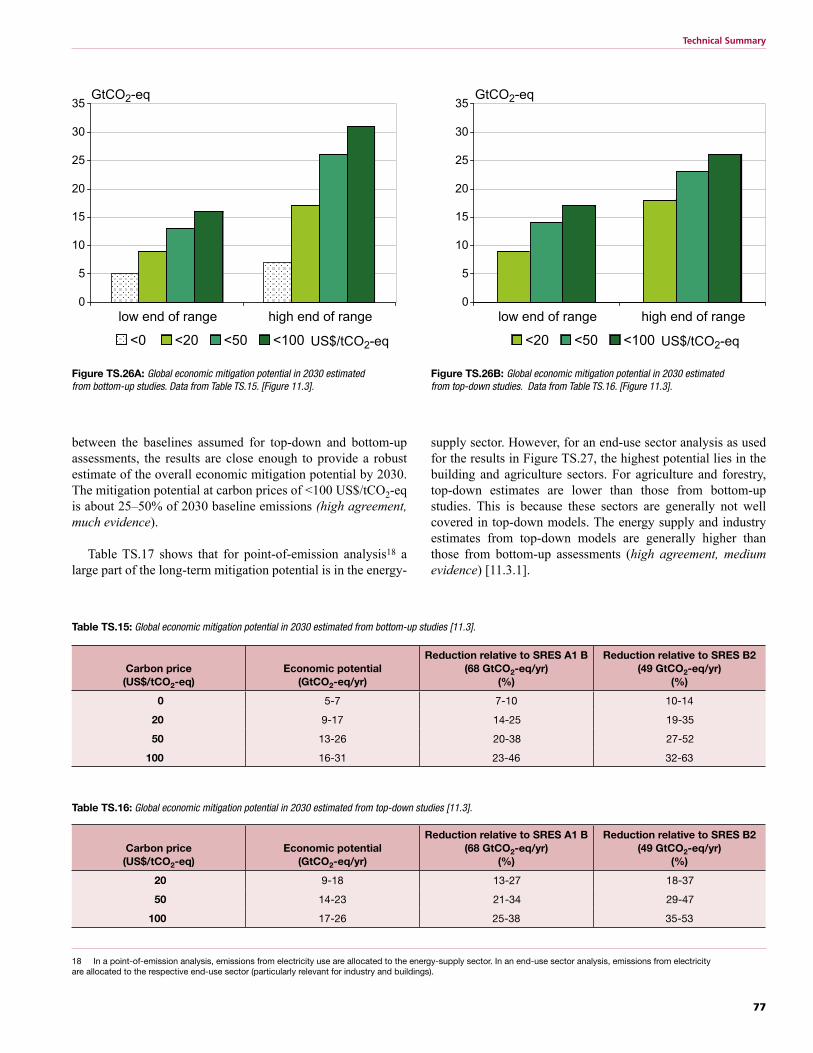
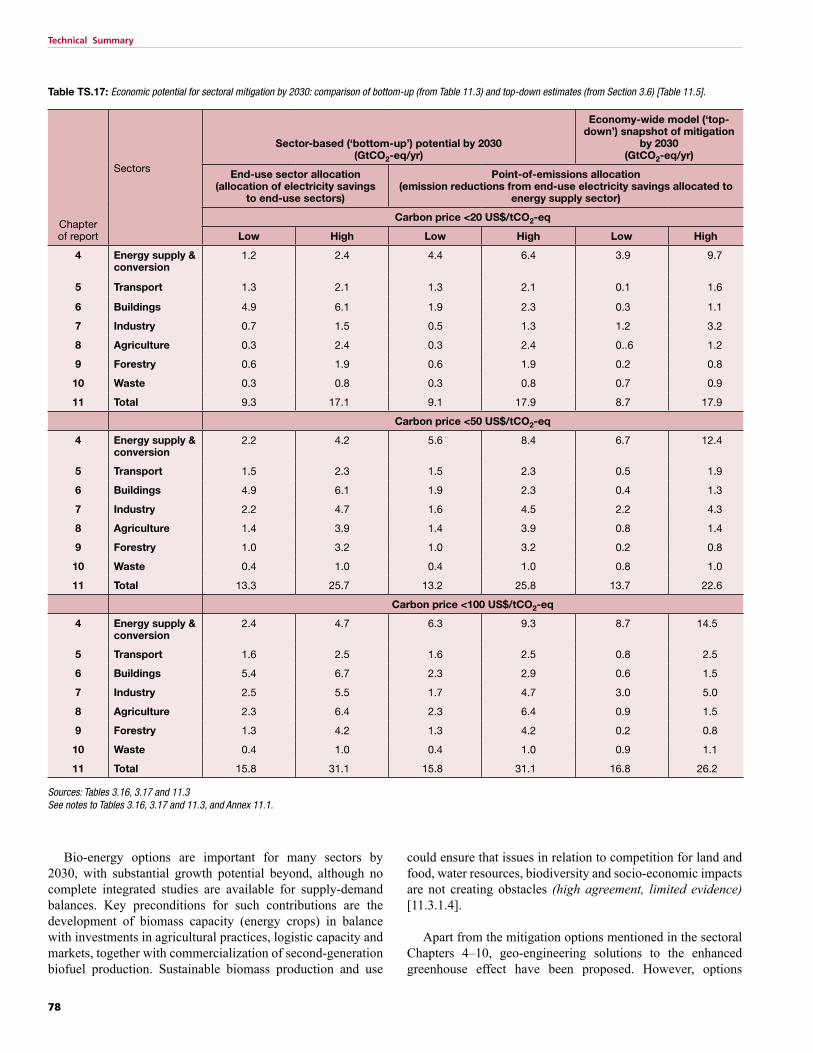
range of 9-18 GtCO2-eq/yr across all GHGs can be expected. For carbon prices less than 50 US$/tCO2-eq this range is 14–23 GtCO2-eq/yr and for carbon prices less than US$100/tCO2-eq it is 17-26 GtCO2-eq/yr. (high agreement, much evidence).
Three important considerations need to be remembered with regard to the reported marginal costs. First, these mitigation scenarios assume complete ‘what’ and ‘where’ flexibility; that is, there is full substitution among GHGs, and reductions take place anywhere in the world as soon as the models begin their analyses. Second, the marginal costs of realizing these levels of mitigation increase in the time horizon beyond 2030. Third, at the economic-sector level, emission-reduction potential for all GHGs varies significantly across the different model scenarios (high agreement, much evidence) [3.6.2].
A risk management or ‘hedging’ approach can assist policy-makers to advance mitigation decisions in the absence of a long-term target and in the face of large uncertainties related to the cost of mitigation, the efficacy of adaptation and the negative impacts of climate change. The extent and the timing of the desirable hedging strategy will depend on the stakes, the odds and societies’ attitudes to risks, for example, with respect to risks of abrupt change in geophysical systems and other key vulnerabilities. A variety of integrated assessment approaches exist to assess mitigation benefits in the context of policy decisions related to such long-term climate goals. There will be ample opportunity for learning and mid-course corrections as new information becomes available. However, actions in the short term will largely determine long-term global mean temperatures and thus what corresponding climate change impacts can be avoided. Delayed emission reductions lead to investments that lock in more emission-intensive infrastructure and development pathways. This significantly constrains the opportunities to achieve lower stabilization levels and increases the risk of more severe climate change impacts. Hence, analysis of near-term decisions should not be decoupled from analysis that considers long-term climate change outcomes (high agreement, much evidence) [3.6; 3.5.2].
4 Energy supply
Status of the sector and development until 2030
Global energy demand continues to grow, but with regional differences. The annual average growth of global primary energy consumption was 1.4 % per year in the 1990–2004 period. This was lower than in the previous two decades due to the economic transition in Eastern Europe, the Caucasus and Central Asia, but energy consumption in that region is now moving upwards again (Figure TS.12) (high agreement, much evidence) [4.2.1].
Rapid growth in energy consumption per capita is occurring in many developing countries. Africa is the region with the lowest per capita consumption. Increasing prices of oil and gas
compromise energy access, equity and sustainable development of the poorest countries and interfere with reaching poverty-reduction targets that, in turn, imply improved access to electricity, modern cooking and heating fuels and transportation (high agreement, much evidence) [4.2.4].
Total fossil fuel consumption has increased steadily during the past three decades. Consumption of nuclear energy has continued to grow, though at a slower rate than in the 1980s. Large hydro and geothermal energy are relatively static. Between 1970 and 2004, the share of fossil fuels dropped from 86% to 81%. Wind and solar are growing most rapidly, but from a very low base (Figure TS.13) (high agreement, much evidence) [4.2].
0
4000
3000
2000
1000
3500
2500
1500
500
Mtoe
AsiaAfricaMiddleEast
EECCAEuropeLatinAmerica
NorthAmerica
Figure TS.12: Annual primary energy consumption, including traditional biomass, 1971 to 2003 [Figure 4.2].
Note: EECCA = countries of Eastern Europe, the Caucasus and Central Asia. 1000 Mtoe = 42 EJ.
0
2000
4000
6000
8000
10000
12000
14000
1971 1980 1990 2000 2005
Mtoe
Other renewables
HydroNuclearBiomass
Gas
Coal
Oil
Figure TS.13: World primary energy consumption by fuel type. [Figure 4.5].
44
Technical Summary
Most business-as-usual (BAU) scenarios point to contin-ued growth of world population (although at lower rates than predicted decades ago) and GDP, leading to a significant growth in energy demand. High energy-demand growth rates in Asia (3.2% per year 1990–2004) are projected to continue and to be met mainly by fossil fuels (high agreement, much evidence) [4.2].
Absolute fossil fuel scarcity at the global level is not a significant factor in considering climate change mitigation. Conventional oil production will eventually peak, but it is uncertain exactly when and what the repercussions will be. The energy in conventional natural gas is more abundant than in conventional oil but, like oil, is not distributed evenly around the globe. In the future, lack of security of oil and gas supplies for consuming nations may drive a shift to coal, nuclear power and/or renewable energy. There is also a trend towards more efficient and convenient energy carriers (electricity, and liquid and gaseous fuels) instead of solids (high agreement, much evidence) [4.3.1].
In all regions of the world, emphasis on security of supply has grown since the Third Assessment Report (TAR). This is coupled with reduced investments in infrastructure, increased global demand, political instability in key areas and the threats of conflict, terrorism and extreme weather events. New energy infrastructure investments in developing countries and upgrades of capacity in developed countries opens a window of opportunity for exploiting the co-benefits of choices in the energy mix in order to lower GHG emissions from what they otherwise would be (high agreement, much evidence) [4.2.4; 4.1].
The conundrum for many governments has become how best to meet the ever growing demand for reliable energy services while limiting the economic costs to their constituents, ensuring energy security, reducing dependence on imported energy sources and minimizing emissions of the associated GHGs and other pollutants. Selection of energy-supply systems for each region of the world will depend on their development, existing infrastructure and the local comparative costs of the available energy resources (high agreement, much evidence) [4.1].
If fossil fuel prices remain high, demand may decrease temporarily until other hydrocarbon reserves in the form of oil sands, oil shales, coal-to-liquids, gas-to-liquids etc. become commercially viable. Should this happen, emissions will increase further as the carbon intensity increases, unless carbon dioxide capture and storage (CCS) is applied. Due to increased energy security concerns and recent increases in gas prices, there is growing interest in new, more efficient, coal-based power plants. A critical issue for future GHG emissions is how quickly new coal plants are going to be equipped with CCS technology, which will increase the costs of electricity. Whether building ‘capture ready’ plants is more cost-effective than retrofitting plants or building a new plant integrated with CCS
depends on economic and technical assumptions. Continuing high fossil fuel prices may also trigger more nuclear and/or renewable energy, although price volatility will be a disincentive for investors. Concerns about safety, weapons proliferation and waste remain as constraints for nuclear power. Hydrogen may also eventually contribute as an energy carrier with low carbon emissions, dependent on the source of the hydrogen and the successful uptake of CCS for hydrogen production from coal or gas. Renewable energy must either be used in a distributed manner or will need to be concentrated to meet the intensive energy demands of cities and industries, because, unlike fossil fuel sources, the sources of renewable energy are widely distributed with low energy returns per exploited area (medium agreement, medium evidence) [4.3].
If energy demand continues to grow along the current trajectory, an improved infrastructure and conversion system will, by 2030, require a total cumulative investment of over US$2005 20 trillion (20 x 1012). For comparison, the total capital investment by the global energy industry is currently around 300 billion US$ per year (300 x 109) (medium agreement, medium evidence) [4.1].
Global and regional emission trends
With the exception of the countries in Eastern Europe, the Caucasus and Central Asia (where emissions declined post-1990 but are now rising again) and Europe (currently stable), carbon emissions have continued to rise. Business-as-usual emissions to 2030 will increase significantly. Without effective policy actions, global CO2 emissions from fossil fuel combustion are predicted to rise at a minimum of more than 40%, from around 25 GtCO2-eq/yr (6.6 GtC-eq) in 2000 to 37-53 GtCO2-eq/yr (10-14 GtC-eq) by 2030 [4.2.3].
In 2004, emissions from power generation and heat supply alone were 12.7 GtCO2-eq (26% of total emissions) including 2.2 GtCO2eq from CH4. In 2030, according to the World Energy Outlook 2006 baseline, these will have increased to 17.7 GtCO2-eq. (high agreement, much evidence) [4.2.2].
Description and assessment of mitigation technologies and practices, options, potentials and costs in the electricity generation sector
The electricity sector has a significant mitigation potential using a range of technologies (Table TS.3). The economic potential for mitigation of each individual technology is based on what might be a realistic deployment expectation of the various technologies using all efforts, but given practical constraints on rate of uptake, public acceptance, capacity building and commercialization. Competition between options and the influence of end-use energy conservation and efficiency improvement is not included [4.4].
A wide range of energy-supply mitigation options are available and cost effective at carbon prices of <20US$/tCO2
45
Technical Summary
For this analysis, it was assumed that the capacity of thermal electricity generation capacity would be substituted gradually and new power plants would be built to comply with demand, under the following conditions:1) Switching from coal to gas was assumed for 20% of the coal
plants, as this is the cheapest option. 2) The replacement of existing fossil fuel plants and the build-
ing of new plants up to 2030 to meet increasing power de-mand was shared between efficient fossil fuel plants, renew-ables, nuclear and coal and gas-fired plants with CCS. No early retirement of plants or stranded assets was assumed.
3) Low- or zero-carbon technologies are employed proportional
Regional groupings
Mitigation potential; total emissions saved
in 2030 (GtCO2-eq)
Mitigation potential (%) for specific carbon price ranges (US$/tCO2-eq avoided)
<0 0-20 20-50 50-100 >100
Fuel switch and plant efficiency
OECDa
EITb
Non-OECDWorld
0.390.040.641.07
100100100
Nuclear OECDEITNon-OECDWorld
0.930.230.721.88
505050
505050
Hydro OECDEITNon-OECDWorld
0.390.000.480.87
85
25
15
35 40
Wind OECDEITNon-OECDWorld
0.450.060.420.93
353535
404550
252015
Bio-energy OECDEITNon-OECDWorld
0.200.070.951.22
202020
252530
404045
15155
Geothermal OECDEITNon-OECDWorld
0.090.030.310.43
353535
404550
252015
Solar PV and concentrated solar power
OECDEITNon-OECDWorld
0.030.010.210.25
202025
808075
CCS + coal OECDEITNon-OECDWorld
0.280.010.200.49
100100100
CCS + gas OECDEITNon-OECDWorld
0.090.040.190.32
3010070
100
Notes: a) Organization for Economic Cooperation and Developmentb) Economies in Transition
Table TS.3: Potential GHG emissions avoided by 2030 for selected electricity generation mitigation technologies (in excess of the IEA World Energy Outlook (2004) Reference baseline) employed in isolation with estimated mitigation potential shares spread across each cost range (2006 US$/tCO2-eq) [Table 4.19].
including fuel switching and power-plant efficiency improvements, nuclear power and renewable energy systems. CCS will become cost effective at higher carbon prices. Other options still under development include advanced nuclear power, advanced renewables, second-generation biofuels and, in the longer term, the possible use of hydrogen as an energy carrier (high agreement, much evidence) [4.3, 4.4].
Since the estimates in Table TS.3 are for the mitigation potentials of individual options without considering the actual supply mix, they cannot be added. An additional analysis of the supply mix to avoid double counting was therefore carried out.
46
Technical Summary
to their estimated maximum shares in electricity generation in 2030. These shares are based on the literature, taking into account resource availability, relative costs and variability of supply related to intermittency issues in the power grid, and were differentiated according to carbon cost levels.
The resulting economic mitigation potential for the energy-supply sector by 2030 from improved thermal power-plant efficiency, fuel switching and the implementation of more nuclear, renewables, fuel switching and CCS to meet growing demand is around 7.2 GtCO2-eq at carbon prices <100 US$/tCO2-eq. At costs <20 US$/tCO2-eq the reduction potential is estimated at 3.9 GtCO2-eq (Table TS.4). At this carbon price level, the share of renewable energy in electricity generation would increase from 20% in 2010 to about 30% in 2030. At carbon prices <50 US$/tCO2-eq, the share would increase to 35% of total electricity generation. The share of nuclear energy would be about 18% in 2030 at carbon prices <50 US$/tCO2-eq, and would not change much at higher prices as other technologies would be competitive.
For assessment of the economic potential, maximum technical shares for the employment of low- or zero-carbon technologies were assumed and the estimate is therefore at the high end of the wide range found in the literature. If, for instance, only 70% of the assumed shares is reached, the mitigation potential at carbon prices <100 US$/tCO2-eq would be almost halved. Potential savings in electricity demand in end-use sectors reduce the need for mitigation measures in the power sector. When the impact of mitigation measures in the building and industry sectors on electricity demand (outlined in Chapter 11) is taken into account, a lower mitigation potential for the energy-supply sector results than the stand-alone figure reported here (medium agreement, limited evidence) [4.4].
Interactions of mitigation options with vulnerability and adaptation
Many energy systems are themselves vulnerable to climate change. Fossil fuel based offshore and coastal oil and gas extraction systems are vulnerable to extreme weather events.
Power plant
efficiencies by 2030
(based on IEA 2004a)a
(%)
Existing mix of power
generation in 2010( TWh)
Generation from
additional new plant by 2030(TWh)
Generation from new
plant replacing
old, existing 2010 plant
by 2030 (TWh)
Share of mix of generation of total new and
replacement plant built by 2030 including CCS at
various carbon prices (US$/tCO2-eq)b
Total GtCO2-eq avoided by fuel switching, CCS and
displacing some fossil fuel generation with low-carbon
options of wind, solar, geothermal, hydro, nuclear
Notes: a) Implied efficiencies calculated from WEO 2004 (IEA, 2004b) = Power output (EJ)/Estimated power input (EJ). See Appendix 1, Chapter 11. b) At higher carbon prices, more coal, oil and gas power generation is displaced by low- and zero-carbon options. Since nuclear and hydro are cost competitive
at <20US$/tCO2-eq in most regions (Chapter 4, Table 4.4.4), their share remains constant.c) Negative data depicts a decline in generation, which was included in the analysis.
Table TS.4: Projected power demand increase from 2010 to 2030 as met by new, more efficient additional and replacement plants and the resulting mitigation potential above the World Energy Outlook 2004 baseline [Table 4.20].
47
Technical Summary
Cooling of conventional and nuclear power plants may become problematic if river waters are warmer. Renewable energy resources can also be affected adversely by climate change (such as solar systems impacted by changes in cloud cover; hydropower generation influenced by changes in river discharge, glaciers and snow melt; windpower influenced by changing wind velocity; and energy crop yields reduced by drought and higher temperatures). Some adaptation measures to climate change, like air-conditioning and water pumps use energy and may contribute to even higher CO2 emissions, and thus necessitate even more mitigation (high agreement, limited evidence) [4.5.5].
Effectiveness of and experience with climate policies, potentials, barriers, opportunities and implementation issues
The need for immediate short-term action in order to make any significant impact in the longer term has become apparent, as has the need to apply the whole spectrum of policy instruments, since no single instrument will enable a large-scale transition in energy-supply systems on a global basis. Large-scale energy conversion technologies have a life of several decades and hence a turnover of only 1–3% per year. That means that policy decisions taken today will affect the rate of deployment of carbon-emitting technologies for several decades. They will have profound consequences on development paths, especially in a rapidly developing world [4.1].
Economic and regulatory instruments have been employed. Approaches to encourage the greater uptake of low-carbon energy-supply systems include reducing fossil fuel subsidies and stimulating front-runners in specific technologies through active government involvement in market creation (such as in Denmark for wind energy and Japan with solar photovoltaic (PV)). Reducing fossil fuel subsidies has been difficult, as it meets resistance by vested interests. In terms of support for renewable-electricity projects, feed-in-tariffs have been more effective than green certificate trading systems based on quotas. However, with increasing shares of renewables in the power mix, the adjustment of such tariffs becomes an issue. Tradable permit systems and the use of the Kyoto flexible mechanisms are expected to contribute substantially to emission reductions (medium agreement, medium evidence) [4.5].
Integrated and non-climate policies and co-benefits of mitigation policies
Co-benefits of GHG mitigation in the energy supply sector can be substantial. When applying cost-effective energy-efficiency measures, there is an immediate economic benefit to consumers from lower energy costs. Other co-benefits in terms of energy supply security, technological innovation, air-pollution abatement and employment also typically result at the local scale. This is especially true for renewables which can reduce import dependency and in many cases minimize transmission
losses and costs. Electricity, transport fuels and heat supplied by renewable energy are less prone to price fluctuations, but in many cases have higher costs. As renewable energy technologies can be more labour-intensive than conventional technologies per unit of energy output, more employment will result. High investment costs of new energy system infrastructures can, however, be a major barrier to their implementation.
Developing countries that continue to experience high economic growth will require significant increases in energy services that are currently being met mainly by fossil fuels. Increasing access to modern energy services can have multiple benefits. Their use can help improve air quality, particularly in large urban areas, and lead to a decrease in GHG emissions. An estimated 2400 GW of new power plants plus the related infrastructure will need to be built in developing countries by 2030 to meet increased consumer demand, requiring an investment of around 5 trillion US$ (5 x 10¹²). If well directed, such large investments provide opportunities for sustainable development. The integration of development policies with GHG mitigation objectives can deliver the advantages mentioned above and contribute to development goals pertaining to employment, poverty and equity. Analysis of possible policies should take into account these co-benefits. However, it should be noted again that, in specific circumstances, pursuing air-pollution abatement or energy security aims can lead to more energy use and related GHG emissions.
Liberalization and privatization policies to develop free energy markets aim to provide greater competition and lower consumer prices but have not always been successful in this regard, often resulting in a lack of capital investment and scant regard for environmental impacts (high agreement, much evidence) [4.2.4; 4.5.2; 4.5.3; 4.5.4].
Technology research, development, diffusion and transfer
Investment in energy technology R&D has declined overall since the levels achieved in the late 1970s that resulted from the oil crisis. Between 1980 and 2002, public energy-related R&D investment declined by 50% in real terms. Current levels have risen, but may still be inadequate to develop the technologies needed to reduce GHG emissions and meet growing energy demand. Greater public and private investment will be required for rapid deployment of low-carbon energy technologies. Improved energy conversion technologies, energy transport and storage methods, load management, co-generation and community-based services will have to be developed (high agreement, limited evidence) [4.5.6].
Long-term outlook
Outlooks from both the IEA and World Energy Council project increases in primary energy demand of between 40 and 150% by 2050 over today’s demand, depending on the scenarios for popu-
48
Technical Summary
lation and economic growth and the rate of technology development. Electricity use is expected to grow by between 110 and 260%. Both organizations realize that business-as-usual scenarios are not sustainable. It is well accepted that even with good decision-making and co-operation between the public and private sectors, the necessary transition will take time and the sooner it is begun the lower the costs will be (high agreement, much evidence) [4.2.3].
5 Transport and its infrastructure
Status and development of the sector
Transport activity is increasing around the world as econo- mies grow. This is especially true in many areas of the developing world where globalization is expanding trade flows, and rising personal incomes are amplifying demand for motorized mobility. Current transportation activity is mainly driven by internal combustion engines powered by petroleum fuels (95% of the 83 EJ of world transport energy use in 2004). As a consequence, petroleum use closely follows the growth in transportation activity. In 2004, transport energy amounted to 26% of total world energy use. In the developed world, transport energy use continues to increase at slightly more than 1% per year;
passenger transport currently consumes 60–75% of total transport energy there. In developing countries, transport energy use is rising faster (3 to 5% per year) and is projected to grow from 31% in 2002 to 43% of world transport energy use by 2025 [5.2.1, 5.2.2].
Transport activity is expected to grow robustly over the next several decades. Unless there is a major shift away from current patterns of energy use, projections foresee a continued growth in world transportation energy use of 2% per year, with energy use and carbon emissions about 80% above 2002 levels by 2030 [5.2.2]. In developed economies, motor vehicle ownership approaches five to eight cars for every ten inhabitants (Figure TS.14). In the developing world, levels of vehicle ownership are much lower; non-motorized transport plays a significant role, and there is a greater reliance on two- and three-wheeled motorized vehicles and public transport. The motorization of transport in the developing world is, however, expected to grow rapidly in the coming decades. As incomes grow and the value of travellers’ time increases, travellers are expected to choose faster modes of transport, shifting from non-motorized to automotive, to air and high-speed rail. Increasing speed has generally led to greater energy intensity and higher GHG emissions.
Japan
USA
GermanyFrance
Korea
ChinaIndia0
100
200
300
400
500
600
700
800
900
0 5000 10000 15000 20000 25000 30000 35000
UK
Canada
Mexico
Belgium
Denmark
Italy
NetherlandsSpain
Sweden
Switzerland
Australia
Portugal
Greece
Turkey
Russia
Czech
HungaryPoland
Brazil
Argentina
Peru
Malaysia
Philippines
Saudi ArabiaSouth Africa
New Zealand
GDP per Capita (US$)
Vehicle Ownership/ 1000 Persons
5.2
Figure TS.14: Vehicle ownership and income per capita as a time line per country [Figure 5.2]. Note: data are for 1900–2002, but the years plotted vary by country, depending on data availability.
49
Technical Summary
In addition to GHG emissions, the motorization of transport has created congestion and air-pollution problems in large cities all around the world (high agreement, much evidence) [5.2.1; 5.2.2; 5.5.4].
Emission trends
In 2004, the contribution of transport to total energy-related GHG emissions was about 23%, with emissions of CO2 and N2O amounting to about 6.3-6.4 GtCO2-eq. Transport sector CO2 emissions (6.2 GtCO2-eq. in 2004) have increased by around 27% since 1990 and its growth rate is the highest among the end-user sectors. Road transport currently accounts for 74% of total transport CO2 emissions. The share of non-OECD countries is 36% now and will increase rapidly to 46% by 2030 if current trends continue (high agreement, medium evidence) [5.2.2].
The transport sector also contributes small amounts of CH4 and N2O emissions from fuel combustion and F-gases from vehicle air-conditioning. CH4 emissions are between 0.1–0.3% of total transport GHG emissions, N2O between 2.0 and 2.8% (all figures based on US, Japan and EU data only). Emissions of F gases (CFC-12 + HFC-134a + HCFC-22) worldwide in 2003 were 4.9% of total transport CO2 emissions (medium agreement, limited evidence) [5.2.1].
Estimates of CO2 emissions from global aviation increased by a factor of about 1.5, from 330 MtCO2/yr in 1990 to 480 MtCO2/yr in 2000, and accounted for about 2% of total anthropogenic CO2 emissions. Aviation CO2 emissions are projected to continue to grow strongly. In the absence of additional measures, projected annual improvements in aircraft fuel efficiency of the order of 1–2% will be largely surpassed by traffic growth of around 5% each year, leading to a projected increase in emissions of 3–4% per year (high agreement, medium evidence). Moreover, the overall climate impact of aviation is much greater than the impact of CO2 alone. As well as emitting CO2, aircraft contribute to climate change through the emission of nitrogen oxides (NOx), which are particularly effective in forming the GHG ozone when emitted at cruise altitudes. Aircraft also trigger the formation of condensation trails, or contrails, which are suspected of enhancing the formation of cirrus clouds, which add to the overall global warming effect. These effects are estimated to be about two to four times greater than those of aviation’s CO2 alone, even without considering the potential impact of cirrus cloud enhancement. The environmental effectiveness of future mitigation policies for aviation will depend on the extent to which these non-CO2 effects are also addressed (high agreement, medium evidence) [5.2.1; 5.2.2].
All of the projections discussed above assume that world oil supplies will be more than adequate to support the expected growth in transport activity. There is ongoing debate, however, about whether the world is nearing a peak in conventional oil
Figure TS.15: Historical and projected CO2 emissions from transport [Figure 5.4].
5.4
0
5
10
15
1970 1980 1990 2000 2010 2020 2030 2040 2050
historical data (IEA)
estimated data (WBCSD)
Air
Sea
Road
Gt CO2
production that would require a significant and rapid transition to alternative energy sources. There is no shortage of alternative energy sources, including oil sands and oil shales, coal-to-liquids, biofuels, electricity and hydrogen. Among these alternatives, unconventional fossil carbon resources would produce the least expensive fuels most compatible with the existing transportation infrastructure. Unfortunately, tapping into these fossil resources to power transportation would increase upstream carbon emissions and greatly increase the input of carbon into the atmosphere [5.2.2; 5.3].
Description and assessment of mitigation techno-logies and practices, options, potentials and costs
Transport is distinguished from other energy-using sectors by its predominant reliance on a single fossil resource and by the infeasibility of capturing carbon emissions from transport vehicles with any known technologies. It is also important to view GHG-emission reductions in conjunction with air pollution, congestion and energy security (oil import) problems. Solutions therefore have to try to optimize improvement of transportation problems as a whole, not just GHG emissions [5.5.4].
There have been significant developments in mitigation technologies since the Third Assessment Report (TAR), and significant research, development and demonstration programmes on hydrogen-powered fuel-cell vehicles have been launched around the globe. In addition, there are still many opportunities for improvement of conventional technologies. Biofuels continue to be important in certain markets and have much greater potential for the future. With regard to non-CO2 emissions, vehicle air-conditioning systems based on low GWP refrigerants have been developed [5.3].
50
Technical Summary
Road traffic: efficient technologies and alternative fuelsSince the TAR, the energy efficiency of road vehicles has
improved by the market success of cleaner directed-injection turbocharged (TDI) diesels and the continued market penetration of many incremental efficiency technologies; hybrid vehicles have also played a role, though their market penetration is currently small. Further technological advances are expected for hybrid vehicles and TDI diesel engines. A combination of these with other technologies, including materials substitution, reduced aerodynamic drag, reduced rolling resistance, reduced engine friction and pumping losses, has the potential to approximately double the fuel economy of ‘new’ light-duty vehicles by 2030, thereby roughly halving carbon emissions per vehicle mile travelled (note that this is only for a new car and not the fleet average) (medium agreement, medium evidence) [5.3.1].
Biofuels have the potential to replace a substantial part, but not all, petroleum use by transport. A recent IEA report estimated that the share of biofuels could increase to about 10% by 2030 at costs of 25 US$/tCO2-eq, which includes a small contribution from biofuels from cellulosic biomass. The potential strongly depends on production efficiency, the development of advanced techniques such as conversion of cellulose by enzymatic processes or by gasification and synthesis, costs, and competition with other uses of land. Currently the cost and performance of ethanol in terms of CO2 emissions avoided is unfavourable, except for production from sugarcane in low-
wage countries (Figure TS.16) (medium agreement, medium evidence) [5.3.1].
The economic and market potential of hydrogen vehicles remains uncertain. Electric vehicles with high efficiency (more than 90%), but low driving range and short battery life have a limited market penetration. For both options, the emissions are determined by the production of hydrogen and electricity. If hydrogen is produced from coal or gas with CCS (currently the cheapest way) or from biomass, solar, nuclear or wind energy, well-to-wheel carbon emissions could be nearly eliminated. Further technological advances and/or cost reductions would be required in fuel-cells, hydrogen storage, hydrogen or electricity production with low- or zero-carbon emissions, and batteries (high agreement, medium evidence) [5.3.1].
The total mitigation potential in 2030 of the energy-efficiency options applied to light duty vehicles would be around 0.7–0.8 GtCO2-eq in 2030 at costs lower than 100 US$/tCO2. Data are not sufficient to provide a similar estimate for heavy-duty vehicles. The use of current and advanced biofuels, as mentioned above, would give an additional reduction potential of another 600–1500 MtCO2-eq in 2030 at costs lower than 25 US$/tCO2 (low agreement, limited evidence) [5.4.2].
A critical threat to the potential for future reduction of CO2 emissions from use of fuel economy technologies is that
Figure TS.16: Comparison between current and future biofuel production costs versus gasoline and diesel ex-refinery (FOB) prices for a range of crude oil prices [Figure 5.9].Note: prices exclude taxes.
0
0.2
0.4
0.6
0.8
1.0
0 40 8020 60
Average crude oil price, US$/bbl
Ethanol Biodiesel
suga
r can
e
mai
ze
beet
whe
at
cellu
losi
c
vege
tabl
e oi
l
anim
al fa
t
Fish
er-T
rops
ch
syn
thes
is
2005
2030
Diesel
US $/l
Gasoline
5.9
51
Technical Summary
they can be used to increase vehicle power and size rather than to improve the overall fuel economy and reduce carbon emissions. The preference of the market for power and size has consumed much of the potential for GHG mitigation reduction achieved over the past two decades. If this trend continues, it will significantly diminish the GHG mitigation potential of the advanced technologies described above (high agreement, much evidence) [5.2; 5.3].
Air traffic The fuel efficiency of civil aviation can be improved
by a variety of means including technology, operation and management of air traffic. Technology developments might offer a 20% improvement in fuel efficiency over 1997 levels by 2015, with a 40–50% improvement likely by 2050. As civil aviation continues to grow at around 5% each year, such improvements are unlikely to keep carbon emissions from global air travel from increasing. The introduction of biofuels could mitigate some of aviation’s carbon emissions, if biofuels can be developed to meet the demanding specifications of the aviation industry, although both the costs of such fuels and the emissions from their production process are uncertain at this time (medium agreement, medium evidence) [5.3.3].
Aircraft operations can be optimized for energy use (with minimum CO2 emissions) by minimizing taxiing time, flying at optimal cruise altitudes, flying minimum-distance great-circle routes, and minimizing holding and stacking around airports. The GHG-reduction potential of such strategies has been estimated at 6–12%. More recently, researchers have begun to address the potential for minimizing the total climate impact of aircraft operations, including ozone impacts, contrails and nitrogen oxides emissions. The mitigation potential in 2030 for aviation is 280 MtCO2/yr at costs <100 US$/tCO2 (medium agreement, medium evidence) [5.4.2].
Marine transportSince the TAR, an International Maritime Organization
(IMO) assessment found that a combination of technical measures could reduce carbon emissions by 4–20% in older ships and 5–30% in new ships by applying state-of-the-art knowledge, such as hull and propeller design and maintenance. However, due to the long lifetime of engines, it will take decades before measures on existing ships are implemented on a significant scale. The short-term potential for operational measures, including route-planning and speed reduction, ranged from 1–40%. The study estimated a maximum reduction of emissions of the world fleet of about 18% by 2010 and 28% by 2020, when all measures were to be implemented. The data do not allow an estimate of an absolute mitigation potential figure and the mitigation potential is not expected to be sufficient to offset the growth in shipping activity over the same period (medium agreement, medium evidence) [5.3.4].
Rail transportThe main opportunities for mitigating GHG emissions
associated with rail transport are improving aerodynamics, reduction of train weight, introducing regenerative braking and on-board energy storage and, of course, mitigating the GHG emissions from electricity generation. There are no estimates available of total mitigation potential and costs [5.3.2].
Modal shifts and public transportProviding public transports systems and their related
infrastructure and promoting non-motorized transport can contribute to GHG mitigation. However, local conditions determine how much transport can be shifted to less energy-intensive modes. Occupancy rates and the primary energy sources of the transport modes further determine the mitigation potential [5.3.1].
The energy requirements of urban transport are strongly influenced by the density and spatial structure of the built environment, as well as by the location, extent and nature of the transport infrastructure. Large-capacity buses, light-rail transit and metro or suburban rail are increasingly being used for the expansion of public transport. Bus Rapid Transit systems have relatively low capital and operational costs, but it is uncertain if they can be implemented in developing countries with the same success as in South America. If the share of buses in passenger transport were to increase by 5–10%, then CO2 emissions would fall by 4-9% at costs in the order of US$ 60-70/tCO2 [5.3.1].
More than 30% of the trips made by cars in Europe are for less than 3 km and 50% for less than 5 km. Although the figures may differ for other continents, there is potential for mitigation by shifting from cars to non-motorized transport (walking and cycling), or preventing a growth of car transport at the expense of non-motorized transport. Mitigation potentials are highly dependent on local conditions, but there are substantial co-benefits in terms of air quality, congestion and road safety (high agreement, much evidence) [5.3.1].
Overall mitigation potential in the transport sectorThe overall potential and cost for CO2 mitigation can only be
partially estimated due to lack of data for heavy-duty vehicles, rail transport, shipping and modal split change/ public transport promotion. The total economic potential for improved efficiency of light-duty vehicles and aeroplanes and substituting biofuels for conventional fossil fuels, for a carbon price up to 100 US$/tCO2-eq, is estimated to be about 1600–2550 MtCO2. This is an underestimate of potential for mitigation in the transport sector (high agreement, medium evidence) [5.4.2].
52
Technical Summary
Effectiveness of and experience with climate policies, potentials, barriers and opportunities/implementation issues
Policies and measures for surface transportGiven the positive effects of higher population densities on
public transport use, walking, cycling and CO2 emissions, better integrated spatial planning is an important policy element in the transportation sector. There are some good examples for large cities in several countries. Transportation Demand Management (TDM) can be effective in reducing private vehicle travel if rigorously implemented and supported. Soft measures, such as the provision of information and the use of communication strategies and educational techniques have encouraged a change in personal behaviour leading to a reduction in the use of the car by 14% in an Australian city, 12% in a German city and 13% in a Swedish city (medium agreement, medium evidence) [5.5.1].
Fuel-economy standards or CO2 standards have been effec-tive in reducing GHG emissions, but so far, transport growth has overwhelmed their impact. Most industrialized and some developing countries have set fuel-economy standards for new light-duty vehicles. The forms and stringency of standards vary widely, from uniform, mandatory corporate average standards, through graduated standards by vehicle weight class or size, to voluntary industry-wide standards. Fuel economy standards have been universally effective, depending on their stringency, in improving vehicle fuel economy, increasing on-road fleet-average fuel economy and reducing fuel use and carbon emissions. In some countries, fuel-economy standards have been strongly opposed by segments of the automotive industry on a variety of grounds, ranging from economic efficiency to safety. The overall effectiveness of standards can be significantly enhanced if combined with fiscal incentives and consumer information (high agreement, much evidence) [5.5.1].
Taxes on vehicle purchase, registration, use and motor fuels, as well as road and parking pricing policies are important determinants of vehicle-energy use and GHG emissions. They are employed by different countries to raise general revenue, to partially internalize the external costs of vehicle use or to control congestion of public roads. An important reason for fuel or CO2 tax having limited effects is that price elasticities tend to be substantially smaller than the income elasticities of demand. In the long run, the income elasticity of demand is a factor 1.5–3 higher than the price elasticity of total transport demand, meaning that price signals become less effective with increasing incomes. Rebates on vehicle purchase and registration taxes for fuel-efficient vehicles have been shown to be effective. Road and parking pricing policies are applied in several cities, with marked effects on passenger car traffic (high agreement, much evidence) [5.5.1].
Many governments have introduced or are intending to implement policies to promote biofuels in national emission
abatement strategies. Since the benefit of biofuels for CO2 mitigation comes mainly from the well-to-tank part, incentives for biofuels are more effective climate policies if they are tied to entire well-to-wheels CO2 efficiencies. Thus preferential tax rates, subsidies and quotas for fuel blending should be calibrated to the benefits in terms of net CO2 savings over the entire well-to-wheel cycle associated with each fuel. In order to avoid the negative effects of biofuel production on sustainable development (e.g., biodiversity impacts), additional conditions could be tied to incentives for biofuels.
Policies and measures for aviation and marine transportIn order to reduce emissions from air and marine transport
resulting from the combustion of bunker fuels, new policy frameworks need to be developed. Both the International Civil Aviation Organization (ICAO) and IMO have studied options for limiting GHG emissions. However, neither has yet been able to devise a suitable framework for implementing policies. ICAO, however, has endorsed the concept of an open, international emission-trading system implemented through a voluntary scheme, or the incorporation of international aviation into existing emission-trading systems.
For aviation, both fuel or emission charges and trading would have the potential to reduce emissions considerably. The geographical scope (routes and operators covered), the amount of allowances to be allocated to the aviation sector and the coverage of non-CO2 climate impacts will be key design elements in determining the effectiveness of emissions trading for reducing the impacts of aviation on climate. Emission charges or trading would lead to an increase in fuel costs that will have a positive impact on engine efficiency [5.5.2].
Current policy initiatives in the shipping sector are mostly based on voluntary schemes, using indexes for the fuel effi-ciency of ships. Environmentally differentiated port dues are being used in a few places. Other policies to limit shipping emissions would be the inclusion of international shipping in international emissions-trading schemes, fuel taxes and regulatory instruments (high agreement, medium evidence) [5.5.2].
Integrated and non-climate policies affecting emissions of GHGs and co-benefits of GHG mitigation policies
Transport planning and policy have recently placed more weight on sustainable development aspects. This includes reducing oil imports, improved air quality, reducing noise pollution, increasing safety, reducing congestion and improving access to transport facilities. Such policies can have important synergies with reducing GHG emissions (high agreement, medium evidence) [5.5.4; 5.5.5].
53
Technical Summary
6 Residential and commercial buildings
Status of the sector and emission trends
In 2004, direct GHG emissions from the buildings sector (ex- cluding emissions from electricity use) were about 5 GtCO2-eq/yr (3 GtCO2-eq/yr CO2; 0.1 GtCO2-eq/yr N2O; 0.4 GtCO2-eq/yr CH4 and 1.5 GtCO2-eq/yr halocarbons). The last figure includes F-gases covered by the Montreal protocol and about 0.1–0.2 GtCO2-eq/yr of HFCs. As mitigation in this sector includes many measures aimed at saving electricity, the mitigation potential is generally calculated including electricity saving measures. For comparison, emission figures of the building sector are often presented including emissions from electricity use in the sector . When including the emissions from electricity use, energy-related CO2 emissions from the buildings sector were 8.6 Gt/yr, or 33% of the global total in 2004. Total GHG emissions, including the emissions from electricity use, are then estimated at 10.6 Gt CO2eq/yr (high agreement, medium evidence) [6.2].
Future carbon emissions from energy use in buildings The literature for the buildings sector uses a mixture of
baselines. Therefore, for this chapter, a building sector baseline was defined, somewhere between SRES B2 and A1B2, with 14.3 GtCO2-eq GHG emissions (including emissions from electricity use) in 2030. The corresponding emissions in the SRES B2 and A1B scenarios are 11.4 and 15.6 GtCO2. In the SRES B2 scenario (Figure TS.17), which is based on relatively lower economic growth, North America and Non-Annex I East Asia account for the largest portion of the increase in emissions. In the SRES A1B scenario, which shows rapid economic growth, all the CO2 emissions increase is in the developing world: Asia, Middle East and North Africa, Latin America, and Sub-Saharan Africa, in that order. Overall, average annual CO2 emission growth between 2004 and 2030 is 1.5% in Scenario B2 and
2.4% in Scenario A1B (high agreement, medium evidence) [6.2, 6.3].
Mitigation technologies and practices
Measures to reduce GHG emissions from buildings fall into one of three categories: 1) reducing energy consumption13 and embodied energy in buildings; 2) switching to low-carbon fuels, including a higher share of renewable energy; 3) controlling emissions of non-CO2 GHG gases. Many current technologies allow building energy consumption to be reduced through better thermal envelopes14, improved design methods and building operations, more efficient equipment,and reductions in demand for energy services. The relative importance of heating and cooling depends on climate and thus varies regionally, while the effectiveness of passive design techniques also depends on climate, with important distinctions between hot-humid and hot-arid regions. Occupant behaviour, including avoiding unnecessary operation of equipment and adaptive rather than invariant temperature standards for heating and cooling, is also a significant factor in limiting building energy use (high agreement, much evidence) [6.4].
Mitigation potential of the building sectorSubstantial CO2 emission reduction from energy use in
buildings can be achieved over the coming years compared with projected emissions. The considerable experience in a wide variety of technologies, practices and systems for energy efficiency and an equally rich experience with policies and programmes that promote energy efficiency in buildings lend considerable confidence to this view. A significant portion of these savings can be achieved in ways that reduce life-cycle costs, thus providing reductions in CO2 emissions that have a net negative cost (generally higher investment cost but lower operating cost) (high agreement, much evidence) [6.4; 6.5].
13 This counts all forms of energy use in buildings, including electricity. 14 The term ‘thermal envelope’ refers to the shell of a building as a barrier to unwanted heat or mass transfer between the interior of the building and outside.
Figure TS.17: CO2 emissions (GtCO2) from buildings including emissions from the use of electricity, 1971–2030 [Figure 6.2].
Note: Dark red – historic emissions; light red – projection according to SRES B2 scenario. EECCA=Countries of Eastern Europe, the Caucasus and Central Asia.
World
0
4
8
12
1971 2000 2030
Latin America
0
2
1971 2000 2030
Sub Saharan Africa
0
2
1971 2000 2030
1971 2000 2030
Middle East &North Africa
0
2
1971 2000 2030
Non-Annex ISouth Asia
0
2
1971 2000 2030
Non-Annex IEast Asia
0
2
4
1971 2000 2030
EECCA
0
2
1971 2000 2030
Central &Eastern Europe
0
2
1971 2000 2030
Western Europe
0
2
1971 2000 2030
North America
0
2
4
1971 2000 2030
Pacific OECD
0
2
54
Technical Summary
These conclusions are supported by a survey of 80 studies (Table TS.5), which show that efficient lighting technologies are among the most promising GHG-abatement measures in buildings in almost all countries, in terms of both cost-effectiveness and potential savings. By 2020, approximately 760 Mt of CO2 emissions can be abated by the adoption of least life-cycle cost lighting systems globally, at an average cost of -160 US$/tCO2 (i.e., at a net economic benefit). In terms of the size of savings, improved insulation and district heating in the colder climates and efficiency measures related to space cooling and ventilation in the warmer climates come first in almost all studies, along with cooking stoves in developing countries. Other measures that rank high in terms of savings potential are solar water heating, efficient appliances and energy-management systems.
As far as cost effectiveness is concerned, efficient cooking stoves rank second after lighting in developing countries, while the measures in second place in the industrialized countries
differ according to climatic and geographic region. Almost all the studies examining economies in transition (typically in cooler climates) found heating-related measures to be the most cost effective, including insulation of walls, roofs, windows and floors, as well as improved heating controls for district heating. In developed countries, appliance-related measures are typically identified as the most cost-effective, with upgrades of cooling-related equipment ranking high in warmer climates. Air-conditioning savings can be more expensive than other efficiency measures but can still be cost-effective, because they tend to displace more expensive peak power.
In individual new buildings, it is possible to achieve 75% or more energy savings compared with recent current practice, generally at little or no extra cost. Realizing these savings requires an integrated design process involving architects, engineers, contractors and clients, with full consideration of opportunities for passively reducing the energy demands of buildings [6.4.1].
Economic region
Countries/country groups reviewed for region
Potential as % of national baseline for buildingsb
Measures covering the largest potential
Measures providing the cheapest mitigation options
Developed countries
USA, EU-15, Canada, Greece, Australia, Republic of Korea, United Kingdom, Germany, Japan
Technical:21%-54%c
Economic (<US$ 0/tCO2-eq):12%-25%d
Market:15%-37%
1. Shell retrofit, inc. insulation, esp. windows and walls;
2. Space heating systems;3. Efficient lights, especially
shift to compact fluorescent lamps (CFL) and efficient ballasts.
1. Appliances such as efficient TVs and peripherals (both on-mode and standby), refrigerators and freezers, ventilators and air-conditioners;
2. Water heating equipment;3. Lighting best practices.
Economies in Transition
Hungary, Russia, Poland, Croatia, as a group: Latvia, Lithuania, Estonia, Slovakia, Slovenia, Hungary, Malta, Cyprus, Poland, the Czech Republic
Technical:26%-47%e
Economic (<US$ 0/tCO2eq):13%-37%f
Market:14%
1. Pre- and post- insulation and replacement of building components, esp. windows;
2. Efficient lighting, esp. shift to CFLs;
3. Efficient appliances such as refrigerators and water heaters.
1. Efficient lighting and its controls;
2. Water and space heating control systems;
3. Retrofit and replacement of building components, esp. windows.
Developing countries
Myanmar, India, Indonesia, Argentine, Brazil, China, Ecuador, Thailand, Pakistan, South Africa
1. Efficient lights, esp. shift to CFLs, light retrofit, and kerosene lamps;
2. Various types of improved cooking stoves, esp. biomass stoves, followed by LPG and kerosene stoves;
3. Efficient appliances such as air-conditioners and refrigerators.
1. Improved lights, esp. shift to CFLs light retrofit, and efficient kerosene lamps;
2. Various types of improved cooking stoves, esp. biomass based, followed by kerosene stoves;
3. Efficient electric appliances such as refrigerators and air-conditioners.
Table TS.5: GHG emissions reduction potential for the buildings stock in 2020a [Table 6.2].
Notes: a) Except for EU-15, Greece, Canada, India, and Russia, for which the target year was 2010, and Hungary, Ecuador and South Africa, for which the target was 2030.b) The fact that the market potential is higher than the economic potential for developed countries is explained by limitation of studies considering only one type
of potential, so information for some studies likely having higher economic potential is missing.c) Both for 2010, if the approximate formula of Potential 2020 = 1 – ( 1 – Potential 2010)20/10 is used to extrapolate the potential as percentage of the baseline into
the future (the year 2000 is assumed as a start year), this interval would be 38%–79%.d) Both for 2010, if suggested extrapolation formula is used, this interval would be 22%–44%.e) The last figure is for 2010, corresponds to 72% in 2020 if the extrapolation formula is used.f) The first figure is for 2010, corresponds to 24% in 2020 if the extrapolation formula is used.g) The last figure is for 2030, corresponds to 38% in 2020 if the suggested extrapolation formula is applied to derive the intermediate potential.
55
Technical Summary
Addressing GHG mitigation in buildings in developing countries is of particular importance. Cooking stoves can be made to burn more efficiently and combust particles more completely, thus benefiting village dwellers through improved indoor-air quality, while reducing GHG emissions. Local sources of improved, low GHG materials can be identified. In urban areas, and increasingly in rural ones, there is a need for all the modern technologies used in industrialized countries to reduce GHG emissions [6.4.3].
Emerging areas for energy savings in commercial buildings include the application of controls and information technology to continuously monitor, diagnose and communicate faults in commercial buildings (‘intelligent control’); and systems approaches to reduce the need for ventilation, cooling, and dehumidification. Advanced windows, passive solar design, techniques for eliminating leaks in buildings and ducts, energy-efficient appliances, and controlling standby and idle power consumption as well as solid-state lighting are also important in both residential and commercial sectors (high agreement, much evidence) [6.5].
Occupant behaviour, culture and consumer choice and use of technologies are major determinants of energy use in buildings and play a fundamental role in determining CO2 emissions. However, the potential reduction through non-technological options is rarely assessed and the potential leverage of policies over these is poorly understood (high agreement, medium evidence).
There are opportunities to reduce direct emissions of fluorinated gases in the buildings sector significantly through the global application of best practices and recovery methods, with mitigation potential for all F-gases of 0.7 GtCO2-eq in 2015. Mitigation of halocarbon refrigerants mainly involves avoiding leakage from air conditioners and refrigeration equipment (e.g., during normal use, maintenance and at end of life) and reducing the use of halocarbons in new equipment. A key factor determining whether this potential will be realized is the costs associated with implementation of the measures to achieve the
emission reduction. These vary considerably, from a net benefit to 300 US$/tCO2-eq. (high agreement, much evidence) [6.5].
Mitigation potential of the building sectorThere is a global potential to reduce approximately 30%
of the projected baseline emissions from the residential and commercial sectors cost effectively by 2020 (Table TS.6). At least a further 3% of baseline emissions can be avoided at costs up to 20 US$/tCO2-eq and 4% more if costs up to 100 US$/tCO2-eq are considered. However, due to the large opportunities at low costs, the high-cost potential has only been assessed to a limited extent, and thus this figure is an underestimate. Using the global baseline emission projections for buildings15, these estimates represent a reduction of about 3.2, 3.6, and 4.0 Gtons of CO2-eq in 2020, at zero, 20 US$/tCO2-eq, and 100 US$/tCO2-eq, respectively (high agreement, much evidence) [6.5].
The real potential is likely to be higher, because not all end-use efficiency options were considered by the studies; non-technological options and their often significant co-benefits were omitted as were advanced integrated high-efficiency buildings. However, the market potential is much smaller than the economic potential.
Given limited information for 2030, the 2020 findings for the economic potential to 2030 have been extrapolated to enable comparisons with other sectors. The estimates are given in Table TS.7. Extrapolation of the potentials to 2030 suggests that, globally, about 4.5, 5.0 and 5.6 GtCO2-eq/yr could be reduced at costs of <0, <20 and <100 US$/tCO2-eq respectively. This is equivalent to 30, 35, and 40% of the projected baseline emissions. These figures are associated with significantly lower levels of certainty than the 2020 ones due to very limited research available for 2030 (medium agreement, low evidence).
The outlook for the long-term future, assuming options in the building sector with a cost up to US$ 25/tCO2-eq, identifies a potential of about 7.7 GtCO2eq reductions in 2050.
World regions
Baseline emissions
in 2020
CO2 mitigation potentials as share of the baseline CO2 emission projections in cost categories in 2020
(costs in US$/tCO2-eq)
CO2 mitigation potentials in absolute values in cost categories in 2020, GtCO2-eq
(costs in US$/tCO2-eq)
GtCO2-eq <0 0-20 20-100 <100 <0 0-20 20-100 <100
Globe 11.1 29% 3% 4% 36% 3.2 0.35 0.45 4.0
OECD (-EIT)
4.8 27% 3% 2% 32% 1.3 0.10 0.10 1.6
EIT 1.3 29% 12% 23% 64% 0.4 0.15 0.30 0.85
Non-OECD 5.0 30% 2% 1% 32% 1.5 0.10 0.05 1.6
Note: The aggregated global potential as a function of cost and region is based on 17 studies that reported potentials in detail as a function of costs.
Table TS.6: Global CO2 mitigation potential projections for 2020, as a function of costs [Table 6.3].
15 The baseline CO2 emission projections were calculated on the basis of the 17 studies used for deriving the global potential (if a study did not contain a baseline, projections from another national mitigation report were used).
56
Technical Summary
Interactions of mitigation options with vulnerability and adaptation
If the world experiences warming, energy use for heating in temperate climates will decline (e.g., Europe, parts of Asia and North America), and for cooling will increase in most world regions. Several studies indicate that, in countries with moderate climates, the increase in electricity for additional cooling will outweigh the decrease for heating, and in Southern Europe a significant increase in summer peak demand is expected. Depending on the generation mix in particular countries, the net effect of warming on CO2 emissions may be an increase even where overall demand for final energy declines. This causes a positive feedback loop: more mechanical cooling emits more GHGs, thereby exacerbating warming (medium agreement, medium evidence).
Investments in the buildings sector may reduce the overall cost of climate change by simultaneously addressing mitigation and adaptation. The most important of these synergies includes reduced cooling needs or energy use through measures such as application of integrated building design, passive solar construction, heat pumps with high efficiency for heating and cooling, adaptive window glazing, high-efficiency appli-ances emitting less waste heat, and retrofits including increased insulation, optimized for specific climates, and storm-proofing. Appropriate urban planning, including increasing green areas as well as cool roofs in cities, has proved to be an efficient way of limiting the ‘heat island’ effect, thereby reducing cooling needs and the likelihood of urban fires. Adaptive comfort, where occupants accept higher indoor (comfort) temperatures when the outside temperature is high, is now often incorporated in design considerations (high agreement, medium evidence) [6.9].
Effectiveness of and experience with policies for reducing CO2 emissions from energy use in buildings
Realizing such emissions reductions up to 2020 requires the rapid design, implementation and enforcement of strong policies promoting energy efficiency for buildings and equipment, renewable energy (where cost-effective), and advanced design techniques for new buildings (high agreement, much evidence) [6.5].
There are, however, substantial barriers that need to be overcome to achieve the high indicated negative and low cost mitigation potential. These include hidden costs, mismatches between incentives and benefits (e.g., between landlords and tenants), limitations in access to financing, subsidies on energy prices, as well as fragmentation of the industry and the design process. These barriers are especially strong and diverse in the residential and commercial sectors; overcoming them is therefore only possible through a diverse portfolio of policy instruments combined with good enforcement (high agreement, medium evidence).
A wide range of policies has been shown in many countries to be successful in cutting GHG emissions from buildings. Table TS.8 summarizes the key policy tools applied and compares them according to the effectiveness of the policy instrument, based on selected best practices. Most instruments reviewed can achieve significant energy and CO2 savings. In an evaluation of 60 policy evaluations from about 30 countries, the highest CO2 emission reductions were achieved through building codes, appliance standards and tax-exemption policies. Appliance standards, energy-efficiency obligations and quotas, demand-side management programmes and mandatory label-ling were found to be among the most cost-effective policy tools. Subsidies and energy or carbon taxes were the least cost-effective instrument. Information programmes are also cost
Mitigation option Region
Baseline projections
in 2030
Potential costs at below 100 US$/tCO2-eq
Potential in different cost categories
<0 US$/tCO2 0-20 US$/tCO2 20-100 US$/tCO2
Low High <0 US$/tC 0-73 US$/tC 73-367 US$/tC
Electricity savingsa)
OECDEITNon-OECD/EIT
3.40.404.5
0.750.151.7
0.950.202.4
0.850.201.9
0.00.00.1
0.00.00.1
Fuel savings
OECDEITNon-OECD/EIT
2.01.03.0
1.00.550.70
1.20.850.80
0.850.200.65
0.20.20.1
0.10.30.0
Total OECDEITNon-OECD/EITGlobal
5.41.47.5
14.3
1.80.702.44.8
2.21.13.26.4
1.70.402.54.5
0.20.20.10.5
0.10.30.00.7
Table TS.7: Global CO2 mitigation potential projections for 2030, as a function of cost, based on extrapolation from the 2020 numbers, in GtCO2 [Table 6.4].
Note: a) The absolute values of the potentials resulting from electricity savings in Table TS.8 and Chapter 11, Table 11.3 do not coincide due to application of different
baselines; however, the potential estimates as percentage of the baseline are the same in both cases. Also Table 11.3 excludes the share of emission reductions which is already taken into account by the energy supply sector, while Table TS.7 does not separate this potential.
57
Technical Summary
effective, particularly when they accompany most other policy measures (medium agreement, medium evidence) [6.8].
Policies and measures that aim at reducing leakage or discourage the use of refrigerants containing fluorine may reduce emissions of F-gases substantially in future years (high agreement, medium evidence) [6.8.4].
The limited overall impact of policies so far is due to several factors: 1) slow implementation processes; 2) the lack of regular
updating of building codes (requirements of many policies are often close to common practices, despite the fact that CO2-neutral construction without major financial sacrifices is already possible) and appliance standards and labelling; 3) inadequate funding; 4) insufficient enforcement. In developing countries and economies in transition, implementation of energy-efficiency policies is compromised by a lack of concrete implementation combined with poor or non-existent enforcement mechanisms. Another challenge is to promote GHG-abatement measures for the building shell of existing buildings due to the long time
Table TS.8: The impact and effectiveness of selected policy instruments aimed at mitigating GHG emissions in the buildings sector using best practices [Table 6.6].
Policy instrument
Emission reduction effectivenessa
Cost-effectivenessb
Special conditions for success, major strengths and limitations, co-benefits
Appliance standards High High Factors for success: periodic update of standards, independent control, information, communication and education.
Building codes High Medium No incentive to improve beyond target. Only effective if enforced.
Public leadership programmes, inc. procurement regulations
High High/Medium Can be used effectively to demonstrate new technologies and practices. Mandatory programmes have higher potential than voluntary ones. Factor for success: ambitious energy efficiency labelling and testing.
Energy efficiency obligations and quotas
High High Continuous improvements necessary: new EE measures, short term incentives to transform markets, etc.
Demand-side management programmes
High High Tend to be more cost-effective for commercial sector than for residences.
Energy performance contracting/ESCO supportC
High Medium Strength: no need for public spending or market intervention, co-benefit of improved competitiveness.
Energy efficiency certificate schemes
Medium Medium No long-term experience. Transaction costs can be high. Institutional structures needed. Profound interactions with existing policies. Benefits for employment.
Kyoto Protocol flexible mechanismsd
Low Low So far limited number of CDM &JI projects in buildings.
Taxation (on CO2 or fuels) Low Low Effect depends on price elasticity. Revenues can be earmarked for further efficiency. More effective when combined with other tools.
Tax exemptions/ reductions High High If properly structured, stimulate introduction of highly efficient equipment and new buildings.
Capital subsidies, grants, subsidised loans
High Low Positive for low-income households, risk of free-riders, may induce pioneering investments.
Labelling and certification programmes
Medium/High High Mandatory programmes more effective than voluntary ones. Effectiveness can be boosted by combination with other instruments and regular updates.
Voluntary and negotiated agreements
Medium/High Medium Can be effective when regulations are difficult to enforce. Effective if combined with financial incentives, and threat of regulation.
Education and information programmes
Low/Medium High More applicable in residential sector than commercial. Success condition: best applied in combination with other measures.
Mandatory audit and energy management requirement
High, but variable Medium Most effective if combined with other measures such as financial incentives.
Detailed billing and disclosure programmes
Medium Medium Success conditions: combination with other measures and periodic evaluation.
Notes: a) includes ease of implementation; feasibility and simplicity of enforcement; applicability in many locations; and other factors contributing to overall
magnitude of realized savings.b) Cost-effectiveness is related to specific societal cost per carbon emissions avoided. c) Energy service companies.d) Joint Implementation, Clean Development Mechanism, International Emissions Trading (includes the Green Investment Scheme).
58
Technical Summary
periods between regular building retrofits and the slow turnover of buildings in developed countries (high agreement, much evidence) [6.8].
Co-benefits and links to sustainable development
Energy efficiency and utilization of renewable energy in buildings offer synergies between sustainable development and GHG abatement. The most relevant of these for the least developed countries are safe and efficient cooking stoves that, while cutting GHG emissions, significantly reduce mortality and morbidity by reducing indoor air pollution. Safe and efficient cooking stoves also reduce the workload for women and children who typically gather the fuel for traditional stoves and decrease the demands on scarce natural resources. Reduction in outdoor air pollution is another significant co-benefit.
In general, in developed and developing countries, improved energy efficiency in buildings and the clean and efficient use of locally available renewable energy resources results in: • substantial savings in energy-related investment, since
efficiency is less costly than new supply;• funds freed up for other purposes, such as infrastructure
investments;• improved system reliability and energy security;• increased access to energy services;• reduced fuel poverty;• improvement of local environmental quality;• positive effects on employment, by creating new business
opportunities and through the multiplier effects of spending money saved on energy costs in another way.
There is increasing evidence that well-designed energy-efficient buildings often promote occupant productivity and health (high agreement, medium evidence) [6.9].
Support from industrialized countries for the development and implementation of policies to increase energy efficiency of buildings and equipment in developing countries and economies in transition could contribute substantially to reductions in the growth of CO2 emissions and improve the welfare of the population. Devoting international aid or other public and private funds aimed at sustainable development to energy efficiency and renewable energy initiatives in buildings can achieve a multitude of development objectives and result in long-lasting impacts. The transfer of knowledge, expertise and know-how from developed to developing countries can facilitate the adoption of photovoltaics (PV), including PV-powered light emitting diode-based (LED) lighting, high-insulation building materials, efficient appliances and lighting, integrated design, building energy-management systems, and solar cooling. However, capital financing will also be needed [6.8.3].
Technology research, development, deployment, diffusion and transfer
Although many practical and cost-effective technologies and practices are available today, research and development is needed in such areas as: high-performance control systems16; advanced window glazing; new materials for insulated panels; various systems to utilize passive and other renewable energy sources; phase-change materials to increase thermal storage; high-performance ground-source reversible heat pumps; integrated appliances and other equipment to use waste heat; novel cooling technologies, and the use of community-wide networks to supply heating, cooling and electricity to buildings. Demonstrations of these technologies and systems, and training of professionals, are necessary steps toward bringing those new technologies to market [6.8.3].
Long-term-outlook
Long-term GHG reduction in buildings needs to start soon because of the slow turnover of the building stock. To achieve large-scale savings in new buildings in the longer term, new approaches to integrated design and operation of buildings need to be taught, spread, and put into large-scale practice as soon as possible. Such training is currently not available for the majority of professionals in the building industry. Because of the important role of non-technological opportunities in buildings, ambitious GHG reductions may require a cultural shift towards a society that embraces climate protection and sustainable development among its fundamental values, leading to social pressure for building construction and use with much reduced environmental footprints (high agreement, medium evidence) [6.4.1; 6.8.1].
7 Industry
Status of the sector, development trends and implications
Energy-intensive industries, iron and steel, non-ferrous metals, chemicals and fertilizer, petroleum-refining, cement, and pulp and paper, account for about 85% of the industry sector’s energy consumption in most countries. Since energy use in other sectors grew faster, the sector’s share in global primary energy use declined from 40% in 1971 to 37% in 2004 [7.1.3].
Much of this energy-intensive industry is now located in developing countries. Overall, in 2003, developing countries accounted for 42% of global steel production, 57% of global nitrogen fertilizer production, 78% of global cement manufacture, and about 50% of global aluminium production. In 2004, developing countries accounted for 46% of final energy
16 Advanced control systems need to be created that permit the integration of all energy service functions in the design and subsequent operation of commercial buildings (‘intelligent control’).
59
Technical Summary
use by industry, developed country for 43% and economies in transition for 11%. Many facilities (for aluminium, cement and fertilizer industries) in developing nations are new and include the latest technology with lowest specific energy use. However, as in industrialized countries, many older, inefficient facilities remain. This creates a huge demand for investment in developing countries to improve energy efficiency and achieve emission reductions. The strong growth of energy-intensive industries during the 20th century is expected to continue as population and GDP increase [7.1.2; 7.1.3].
Though large-scale production dominates these energy-intensive industries globally, small- and medium-sized enterprises (SMEs) have significant shares in many developing countries. While regulations and international competition are moving large industrial enterprises towards the use of environmentally sound technology, SMEs may not have the economic or technical capacity to install the necessary control equipment or are slower to innovate. These SME limitations create special challenges for efforts to mitigate GHG emissions (high agreement, much evidence) [7.1.1].
Emission trends (global and regional)
Direct GHG emissions from industry are currently about 7.2 GtCO2-eq. As the mitigation options discussed in this chapter include measures aimed at reducing the industrial use of electricity, emissions including those from electricity use are important for comparison. Total industrial sector GHG emissions were about 12 GtCO2-eq in 2004, about 25% of the global total. CO2 emissions (including electricity use) from the industrial sector grew from 6.0 GtCO2 in 1971 to 9.9 GtCO2 in 2004. In 2004, developed nations accounted for 35% of total energy-related CO2 emissions, economies in transition for 11% and developing nations for 53% (see Figure TS.18). Industry also emits CO2 from non-energy uses of fossil fuels and from non-fossil fuel sources. In 2000,
these were estimated to total 1.7 GtCO2 (high agreement, much evidence) [7.1.3].
Industrial processes also emit other GHGs, including HFC-23 from the manufacture of HCFC-22; PFCs from aluminium smelting and semiconductor processing; SF6 from use in flat panel screens (liquid crystal display) and semi-conductors, magnesium die casting, electrical equipment, aluminium melting, and others, and CH4 and N2O from chemical industry sources and food-industry waste streams. Total emission from these sources was about 0.4 GtCO2-eq in 2000 (medium agreement, medium evidence) [7.1.3].
The projections for industrial CO2 emissions for 2030 under the SRES-B22 scenarios are around 14 GtCO2 (including electricity use) (see Figure TS.18). The highest average growth
Note: Emissions from refrigeration equipment used in industrial processes included; emissions from all other refrigeration and air-conditioning applications excluded.EECCA = the countries of Eastern Europe, the Caucasus and Central Asia.
World
2
6
10
14
1971 2000 2030
Middle East & North Africa
0
2
1971 2000 2030
1971 2000 2030
Sub Saharan Africa
0
21971 2000 2030
Latin America
0
2
1971 2000 2030
Non-Annex ISouth Asia
0
2
1971 2000 2030
Non-Annex IEast Asia
0
2
4
1971 2000 2030
EECCA
0
2
4
Central & Eastern Europe
0
2Western Europe
0
2
1971 2000 2030 1971 2000 2030 1971 2000 2030
North America
0
2
4
1971 2000 2030
Pacific OECD
0
2
Figure TS.18: Industrial sector energy-related CO2 emissions (GtCO2; including electricity use), 1971–2030. [Table 7.1, 7.2].
Note: Dark red – historic emissions; light red – projections according to SRES B2 scenario. Data extracted from Price et al. (2006).EECCA = Countries of Eastern Europe, the Caucasus and Central Asia.
rates in industrial-sector CO2 emissions are projected for developing countries. Growth in the regions of Central and Eastern Europe, the Caucasus and Central Asia, and Developing Asia is projected to slow in both scenarios for 2000–2030. CO2 emissions are expected to decline in the Pacific OECD, North America and Western Europe regions for B2 after 2010. For non-CO2 GHG emissions from the industrial sector, emissions by 2030 are projected to increase globally by a factor of 1.4, from 470 MtCO2-eq. (130 MtC-eq) in 1990 to 670 MtCO2-eq (180 MtC-eq.) in 2030 assuming no further action is taken to control these emissions. Mitigation efforts led to a decrease in non-CO2 GHG emissions between 1990 and 2000, and many programmes for additional control are underway (see Table TS.9) (high agreement, medium evidence) [7.1.3]. Description and assessment of mitigation technologies and practices, options and potentials, costs and sustainability
Historically, the industrial sector has achieved reductions in energy intensity and emission intensity through adoption of energy efficiency and specific mitigation technologies, particularly in energy-intensive industries. The aluminium industry reported >70% reduction in PFC-emission intensity over the period 1990–2004 and the ammonia industry reported that plants designed in 2004 have a 50% reduction in energy intensity compared with those designed in 1960. Continuing to modernize ammonia-production facilities around the world will result in further energy-efficiency improvements. Reductions in refining energy intensity have also been reported [7.4.2, 7.4.3, 7.4.4].
The low technical and economic capacity of SMEs pose challenges for the diffusion of sound environmental technology, though some innovative R&D is taking place in SMEs.
A wide range of measures and technologies have the potential to reduce industrial GHG emissions. These technologies can be grouped into the categories of energy efficiency, fuel switching, power recovery, renewables, feedstock change, product change and material efficiency (Table TS.10). Within each category, some technologies, such as the use of more efficient electric motors, are broadly applicable across all industries, while others, such as top-gas pressure recovery in blast furnaces, are process-specific.
Later in the period to 2030, there will be a substantial additional potential from further energy- efficiency improvements and application of Carbon Capture and Storage (CCS)17 and non-GHG process technologies. Examples of such new technologies that are currently in the R&D phase include inert electrodes for aluminium manufacture and hydrogen for metal production (high agreement, much evidence) [7.2, 7.3, 7.4].
Mitigation potentials and costs in 2030 have been estimated in an industry-by-industry assessment of energy-intensive industries and an overall assessment of other industries. The approach yielded mitigation potentials of about 1.1 GtCO2-eq at a cost of <20 US$/tCO2 (74 US$/tC-eq); about 3.5 GtCO2-eq at costs below <50 US$/tCO2 (180 US$/tC-eq); and about 4 GtCO2-eq/yr (0.60–1.4 GtC-eq/yr) at costs <US$100/tCO2-eq (<US$370/tC-eq) under the B2 scenario. The largest mitigation potentials are in the steel, cement and pulp and paper industries, and in the control of non-CO2 gases, and much of the potential is available at <50 US$/tCO2-eq (<US$ 180/tC-eq). Application of CCS technology offers a large additional potential, albeit at higher cost.
A recently completed global study for nine groups of technologies indicates a mitigation potential for the industrial sector of 2.5-3.0 GtCO2-eq/yr (0.68-0.82 GtC-eq/yr) in 2030 at costs of <25 US$/tCO2 (< 92US$/tC) (2004$). While the estimate of mitigation potential is in the range found in this assessment, the estimate of mitigation cost is significantly lower (medium agreement, medium evidence) [7.5].
Interaction of mitigation options with vulnerability and adaptation
Linkages between adaptation and mitigation in the industrial sector are limited. Many mitigation options (e.g., energy efficiency, heat and power recovery, recycling) are not vulnerable to climate change and therefore create no adaptation link. Others, such as fuels or feedstock switching (e.g. to biomass or other renewable energy sources) may be vulnerable to climate change [7.8].
Effectiveness of and experience with climate policies, potentials, barriers and opportunities/ implementation issues
Full use of available mitigation options is not being made in either industrialized or developing nations. In many areas of the world, GHG mitigation is not demanded by either the market or government regulation. In these areas, companies will invest in GHG mitigation to the extent that other factors provide a return for their investments. This return can be economic; for example, energy-efficiency projects that provide an economic pay-out, or can be in terms of achieving larger corporate goals, for example, a commitment to sustainable development. The economic potential as outlined above will only be realized if policies and regulations are in place. Relevant in this respect is that, as noted above, most energy-intensive industries are located in developing countries. Slow rate of capital stock turnover is also a barrier in many industries, as is the lack of the financial and technical resources needed to implement mitigation options, and limitations in the ability of industrial firms, particularly small and medium-sized enterprises, to
17 See IPCC Special Report on CO2 Capture and Storage
62
Technical Summary
access and absorb information about available options (high agreement, much evidence) [7.9.1].
Voluntary agreements between industry and government to reduce energy use and GHG emissions have been used since the early 1990s. Well-designed agreements, which set realistic targets and have sufficient government support, often as part of a larger environmental policy package, and a real threat of increased government regulation or energy/GHG taxes if targets are not achieved, can provide more than business-as-usual energy savings or emission reductions. Some have accelerated the application of best available technology and led to reductions in emissions compared with the baseline, particularly in countries with traditions of close cooperation between government and industry. However, the majority of voluntary agreements have not achieved significant emission reductions beyond business-as-usual. Corporations, sub-national governments, non-government organizations (NGOs) and civil groups are adopting a wide variety of voluntary actions, independent of government authorities, which may limit GHG emissions, stimulate innovative policies, and encourage the deployment of new technologies. By themselves, however, they generally have limited impact.
Policies that reduce the barriers to adoption of cost-effective, low-GHG emission technologies (e.g., lack of information, absence of standards and unavailability of affordable financing for first purchases of modern technology) can be effective. Many countries, both developed and developing, have financial schemes available to promote energy saving in industry. According to a World Energy Council survey, 28 countries provide some sort of grant or subsidy for industrial energy-efficiency projects. Fiscal measures are also frequently used to stimulate energy savings in industry. However, a drawback to financial incentives is that they are often also used by investors who would have made the investment without the incentive. Possible solutions to improve cost-effectiveness are to restrict schemes to specific target groups and/or techniques (selected lists of equipment, only innovative technologies), or use a direct criterion of cost-effectiveness [7.9.3].
Several national, regional or sectoral CO2 emissions trading systems either exist or are being developed. The further refinement of these trading systems could be informed by evidence that suggests that in some important aspects, participants from industrial sectors face a significantly different situation to those from the electricity sector. For instance, responses to carbon emission price in industry tend to be slower because of the more limited technology portfolio and absence of short-term fuel-switching possibilities, making predictable allocation mechanisms and stable price signals a more important issue for industry [7.9.4].
As noted in the TAR, industrial enterprises of all sizes are vulnerable to changes in government policy and consumer preferences. That is why a stable policy regime is so important for industry (high agreement, much evidence) [7.9].
Integrated and non-climate policies affecting emissions of greenhouse gases
Policies aimed at balancing energy security, environmental protection and economic development can have a positive or negative impact on mitigation. Sustainable development policies focusing on energy efficiency, dematerialization, and use of renewables support GHG mitigation objectives. Waste-management policies reduce industrial sector GHG emissions by reducing energy use through the re-use of products. Air-pollutant reduction measures can have synergy with GHG-emissions reduction when reduction is achieved by shifting to low-carbon fuels, but do not always reduce GHG emissions as many require the use of additional energy.
In addition to implementing the mitigation options discussed above, achieving sustainable development will require industrial development pathways that minimize the need for future mitigation (high agreement, medium evidence). Large companies have greater resources, and usually more incentives, to factor environmental and social considerations into their operations than small and medium enterprises (SMEs), but SMEs provide the bulk of employment and manufacturing capacity in many countries. Integrating SME development strategy into broader national strategies for development is consistent with sustainable development objectives. Energy-intensive industries are now committing to a number of measures towards human capital development, health and safety, community development etc., which are consistent with the goal of corporate social responsibility (high agreement, much evidence) [7.7; 7.8].
Co-benefits of greenhouse gas mitigation policies
The co-benefits of industrial GHG mitigation include: reduced emissions of air pollutants, and waste (which in turn reduce environmental compliance and waste disposal costs), increased production and product quality, lower maintenance and operating costs, an improved working environment, and other benefits such as decreased liability, improved public image and worker morale, and delaying or reducing capital expenditures. The reduction of energy use can indirectly contribute to reduced health impacts of air pollutants particularly where no air-pollution regulation exists (high agreement, much evidence) [7.10].
Technology research, development, deployment, diffusion and transfer
Commercially available industrial technology provides a very large potential to reduce GHG emissions. However, even with the application of this technology, many industrial processes would still require much more energy than the thermodynamic ideal, suggesting a large additional potential for energy-efficiency improvement and GHG mitigation potential. In addition, some industrial processes emit GHGs that are independent of heat and power use. Commercial technology to eliminate these emissions does not currently exist for some of
63
Technical Summary
these processes, for example, development of an inert electrode to eliminate process emissions from aluminium manufacture and the use of hydrogen to reduce iron and non-ferrous metal ores. These new technologies must also meet a host of other criteria, including cost competitiveness, safety and regulatory requirements, as well as winning customer acceptance. Industrial technology research, development, deployment and diffusion are carried out both by governments and companies, ideally in complementary roles. Because of the large economic risks inherent in technologies with GHG emission mitigation as the main purpose, government programmes are likely to be needed in order to facilitate a sufficient level of research and development. It is appropriate for governments to identify fundamental barriers to technology and find solutions to overcome these barriers, but companies should bear the risks and capture the rewards of commercialization.
In addition, government information, energy audits, reporting, and benchmarking programmes promote technology transfer and diffusion. The key factors determining private-sector technology deployment and diffusion are competitive advantage, consumer acceptance, country-specific characteristics, protection of intellectual property rights, and regulatory frameworks (medium agreement, medium evidence) [7.11].
Long-term outlook
Many technologies offer long-term potential for mitigating industrial GHG emissions, but interest has focused on three areas: biological processing, use of hydrogen and nanotechnology.
Given the complexity of the industrial sector, achieving low GHG emissions is the sum of many cross-cutting and individual sector transitions. Because of the speed of capital stock turnover in at least some branches of industry, inertia by ‘technology lock-in’ may occur. Retrofitting provides opportunities in the meantime, but basic changes in technology occur only when the capital stock is installed or replaced (high agreement, much evidence) [7.12].
8 Agriculture
Status of the sector, future trends in production and consumption, and implications
Technological developments have allowed remarkable progress in agricultural output per unit of land, increasing per capita food availability despite a consistent decline in per capita agricultural land area (high agreement, much evidence). However, progress has been uneven across the world, with rural poverty and malnutrition remaining in some countries. The share of animal products in the diet has increased progressively in developing countries, while remaining constant in the developed world (high agreement, much evidence).
Production of food and fibre has more than kept pace with the sharp increase in demand in a more populated world, so that the global average daily availability of calories per capita has increased, though with regional exceptions. However, this growth has been at the expense of increasing pressure on the environment and dwindling natural resources, and has not solved problems of food security and widespread child malnutrition in poor countries (high agreement, much evidence).
The absolute area of global arable land has increased to about 1400 Mha, an overall increase of 8% since the 1960s (5% decrease in developed countries and 22% increase in developing countries). This trend is expected to continue into the future, with a projected additional 500 Mha converted to agriculture from 1997–2020, mostly in Latin America and Sub-Saharan Africa (medium agreement, limited evidence).
Economic growth and changing lifestyles in some developing countries are causing a growing demand for meat and dairy products. From 1967–1997, meat demand in developing countries rose from 11 to 24 kg per capita per year, achieving an annual growth rate of more than 5% by the end of that period. Further increases in global meat demand (about 60% by 2020) are projected, mostly in developing regions such as South and Southeast Asia, and Sub-Saharan Africa (medium agreement, much evidence) [8.2].
Emission trends
For 2005, agriculture accounted for an estimated emission of 5.1 to 6.1 GtCO2-eq (10–12% of total global anthropogenic emissions of GHGs). CH4 contributed 3.3 GtCO2-eq and N2O 2.8 GtCO2-eq. Of global anthropogenic emissions in 2005, agriculture accounted for about 60% of N2O and about 50% of CH4 (medium agreement, medium evidence). Despite large annual exchanges of CO2 between the atmosphere and agricultural lands, the net flux is estimated to be approximately balanced, with net CO2 emissions of only around 0.04 GtCO2/yr (emissions from electricity and fuel use in agriculture are covered in the buildings and transport sector respectively) (low agreement, limited evidence) [8.3].
Trends in GHG emissions in agriculture are responsive to global changes: increases are expected as diets change and population growth increases food demand. Future climate change may eventually release more soil carbon (though the effect is uncertain as climate change may also increase soil carbon inputs through high production). Emerging technologies may permit reductions of emissions per unit of food produced, but absolute emissions are likely to grow (medium agreement, medium evidence).
Without additional policies, agricultural N2O and CH4 emissions are projected to increase by 35–60% and ~60%, respectively, to 2030, thus increasing more rapidly than the 14% increase of non-CO2 GHG observed from 1990 to 2005 (medium agreement, limited evidence) [8.3.2].
64
Technical Summary
Both the magnitude of the emissions and the relative importance of the different sources vary widely among world regions (Figure TS.19). In 2005, the group of five regions consisting mostly of non-Annex I countries were responsible for 74% of total agricultural emissions [8.3].
Mitigation technologies, practices, options, potentials and costs
Considering all gases, the economic potentials for agricultural mitigation by 2030 are estimated to be about 1600, 2700 and 4300 MtCO2-eq/yr at carbon prices of up to 20, 50 and 100 US$/tCO2-eq, respectively for a SRES B2 baseline (see Table TS.11) (medium agreement, limited evidence) [8.4.3].
Improved agricultural management can reduce net GHG emissions, often affecting more than one GHG. The effectiveness of these practices depends on factors such as climate, soil type and farming system (high agreement, much evidence).
About 90% of the total mitigation arises from sink enhancement (soil C sequestration) and about 10% from emission reduction (medium agreement, medium evidence). The most prominent mitigation options in agriculture (with potentials shown in Mt
CO2eq/yr for carbon prices up to 100 US$/tCO2-eq by 2030) are (see also Figure TS.20): • restoration of cultivated organic soils (1260) • improved cropland management (including agronomy,
nutrient management, tillage/residue management and water management (including irrigation and drainage) and set-aside / agro-forestry (1110)
• improved grazing land management (including grazing intensity, increased productivity, nutrient management, fire management and species introduction (810)
• restoration of degraded lands (using erosion control, organic amendments and nutrient amendments (690).
Lower, but still substantial mitigation potential is provided by: • rice management (210) • livestock management (including improved feeding
practices, dietary additives, breeding and other structural changes, and improved manure management (improved storage and handling and anaerobic digestion) (260) (medium agreement, limited evidence).
In addition, 770 MtCO2-eq/yr could be provided by 2030 by improved energy efficiency in agriculture. This amount is, however, for a large part included in the mitigation potential of buildings and transport [8.1; 8.4].
At lower carbon prices, low cost measures most similar to current practice are favoured (e.g., cropland management options), but at higher carbon prices, more expensive measures with higher mitigation potentials per unit area are favoured (e.g., restoration of cultivated organic / peaty soils; Figure TS.20) (medium agreement, limited evidence) [8.4.3].
GHG emissions could also be reduced by substitution of fossil fuels by energy production from agricultural feedstocks (e.g., crop residues, dung, energy crops), which are counted in energy end-use sectors (particularly energy supply and transport). There are no accurate estimates of future agricultural biomass supply, with figures ranging from 22 EJ/yr in 2025
Table TS.11: Estimates of global agricultural economic GHG mitigation potential (MtCO2-eq/yr) by 2030 under different assumed carbon prices for a SRES B2 baseline [Table 8.7].
Carbon price (US$/tCO2-eq)
Up to 20 Up to 50 Up to 100
OECD 330 (60-470)
540 (300-780)
870 (460-1280)
EIT 160 (30-240)
270 (150-390)
440 (230-640)
Non-OECD/EIT
1140 (210-1660)
1880 (1040-2740)
3050 (1610-4480)
Note: figures in brackets show standard deviation around the mean estimate, potential excluding energy-efficiency measures and fossil fuel offsets from bio-energy.
Figure TS.19: Historic and projected N2O and CH4 emissions (MtCO2-eq.) in the agricultural sector of ten world regions, 1990–2020 [Figure 8.2].
Note: EECCA=Countries of Eastern Europe, the Caucasus and Central Asia.
Middle East and North Africa
0
500
1990 2020
Non-Annex ISouth Asia
0
1000
1990 2020
Non-Annex IEast Asia
0
1000
2000
1990 2020
Latin America & The Caribbean
0
1000
2000
1990 2020
Sub-Saharan Africa
0
1000
1990 2020
EECCA
0
500
1990 2020Central and Eastern Europe
0
500
1990 2020
Western Europe
0
1000
1990 2020
OECD Pacific
0
500
1990 2020 World
0
4000
8000
1990 2020
OECD North America
0
1000
1990 2020
65
Technical Summary
to more than 400 EJ/yr in 2050. The actual contribution of agriculture to the mitigation potential by using bio-energy depends, however, on the relative prices of fuels and the balance of demand and supply. Top-down assessments that include assumptions on such a balance estimate the economic mitigation potential of biomass energy supplied from agriculture to be 70–1260 MtCO2-eq/yr at up to 20 US$/tCO2-eq, and 560–2320 MtCO2-eq/yr at up to 50 US$/tCO2-eq. There are no estimates for the additional potential from top-down models at carbon prices up to 100 US$/tCO2-eq, but the estimate for prices above 100 US$/tCO2-eq is 2720 MtCO2-eq/yr. These potentials represent mitigation of 5–80%, and 20–90% of all other agricultural mitigation measures combined, at carbon prices of up to 20, and up to 50 US$/tCO2-eq, respectively. Above the level where agricultural products and residues form the sole feedstock, bio-energy competes with other land-uses for available land, water and other resources The mitigation potentials of bio-energy and improved energy efficiency are not included in Table TS.11 or Figure TS.20, as the potential is counted in the user sectors, mainly transport and buildings, respectively (medium agreement, medium evidence) [8.4.4].
The estimates of mitigation potential in the agricultural sector are towards the lower end of the ranges indicated in the Second Assessment Report (SAR) and TAR. This is due mainly to the different time scales considered (2030 here versus 2050 in TAR). In the medium term, much of the mitigation potential is derived from removal of CO2 from the atmosphere and its
conversion to soil carbon, but the magnitude of this process will diminish as soil carbon approaches maximum levels, and long-term mitigation will rely increasingly on reducing emissions of N2O, CH4, and CO2 from energy use, the benefits of which persist indefinitely (high agreement, much evidence) [8.4.3].
Interactions of mitigation options with vulnerability and adaptation
Agricultural actions to mitigate GHGs could: a) reduce vulnerability (e.g. if soil carbon sequestration reduces the impacts of drought) or b) increase vulnerability (e.g., if heavy dependence on biomass energy makes energy supply more sensitive to climatic extremes). Policies to encourage mitigation and/or adaptation in agriculture may need to consider these interactions (medium agreement, limited evidence). Similarly, adaptation-driven actions may either a) favour mitigation (e.g., return of residues to fields to improve water-holding capacity will also sequester carbon) or b) hamper mitigation (e.g., use of more nitrogen fertilizer to overcome falling yields, leading to increased N2O emissions). Strategies that simultaneously increase adaptive capacity, reduce vulnerability and mitigate climate change are likely to present fewer adoption barriers than those with conflicting impacts. For example increasing soil organic matter content can both improve fertility and reduce the impact of drought, improving adaptive capacity, making agriculture less vulnerable to climate change, while also sequestering carbon (medium agreement, medium evidence) [8.5].
0
200
400
600
800
1000
1200
1400
restor
e cult
ivated
organ
ic so
ilscro
pland
manag
emen
t
grazin
g lan
d
manag
emen
tres
tore
degra
ded l
ands ric
e
manag
emen
tlive
stock
set-a
side,
LUC &
agrof
orestr
yman
ure
manag
emen
t
Mitigation measure
Mt CO2-eq/yr
up to 20 US$/tCO2-eq.up to 50 US$/tCO2-eq.up to 100 US$/tCO2-eq.
Figure TS.20: Potential for GHG agricultural mitigation in 2030 at a range of carbon prices for a SRES B2 baseline [Figure 8.9].Note: B2 scenario shown, though the pattern is similar for all SRES scenarios. Energy-efficiency measures (770 MtCO2-eq) are included in the mitigation potential of the buildings and energy sector.
66
Technical Summary
Effectiveness of climate policies: opportunities, barriers and implementation issues
Actual levels of GHG mitigation practices in the agricultural sector are below the economic potential for the measures reported above (medium agreement, limited evidence). Little progress in implementation has been made because of the costs of implementation and other barriers, including: pressure on agricultural land, demand for agricultural products, competing demands for water as well as various social, institutional and educational barriers (medium agreement, limited evidence). Soil carbon sequestration in European croplands, for instance, is likely to be negligible by 2010, despite significant economic potential. Many of these barriers will not be overcome without policy/economic incentives (medium agreement, limited evidence) [8.6].
Integrated and non-climate policies affecting emissions of greenhouse gases
The adoption of mitigation practices will often be driven largely by goals not directly related to climate change. This leads to varying mitigation responses among regions, and contributes to uncertainty in estimates of future global mitigation potential. Policies most effective at reducing emissions may be those that also achieve other societal goals. Some rural development policies undertaken to fight poverty, such as water management and agro-forestry, are synergistic with mitigation (medium agreement, limited evidence). For example, agro-forestry undertaken to produce fuel wood or to buffer farm incomes against climate variation may also increase carbon sequestration. In many regions, agricultural mitigation options are influenced most by non-climate policies, including macro-economic, agricultural and environmental policies. Such policies may be based on UN conventions (e.g., Biodiversity and Desertification), but are often driven by national or regional issues. Among the most beneficial non-climate policies are those that promote sustainable use of soils, water and other resources in agriculture since these help to increase soil carbon stocks and minimize resource (energy, fertilizer) waste (high agreement, medium evidence) [8.7].
Co-benefits of greenhouse gas mitigation policies
Some agricultural practices yield purely ‘win-win’ outcomes, but most involve trade-offs. Agro-ecosystems are inherently complex. The co-benefits and trade-offs of an agricultural practice may vary from place to place because of differences in climate, soil or the way the practice is adopted (high agreement, medium evidence).
In producing bio-energy, for example, if the feedstock is crop residues, soil organic matter may be depleted as less carbon is returned, thus reducing soil quality; conversely, if the feedstock is a densely-rooted perennial crop, soil organic matter may be replenished, thereby improving soil quality.
Many agricultural mitigation activities show synergy with the goals of sustainability. Mitigation policies that encourage efficient use of fertilizers, maintain soil carbon and sustain agricultural production are likely to have the greatest synergy with sustainable development (high agreement, medium evidence).
For example, increasing soil carbon can also improve food security and economic returns. Other mitigation options have less certain impacts on sustainable development. For example, the use of some organic amendments may improve carbon sequestration, but impacts on water quality may vary depending on the amendment. Co-benefits often arise from improved efficiency, reduced cost and environmental co-benefits. Trade-offs relate to competition for land, reduced agricultural productivity and environmental stresses (medium agreement, limited evidence) [8.4.5].
Technology research, development, deployment, diffusion and transfer
Many of the mitigation strategies outlined for the agriculture sector employ existing technology. For example, reduction in emissions per unit of production will be achieved by increases in crop yields and animal productivity. Such increases in productivity can occur through a wide range of practices − better management, genetically modified crops, improved cultivars, fertilizer-recom-mendation systems, precision agriculture, improved animal breeds, improved animal nutrition, dietary additives and growth promoters, improved animal fertility, bio-energy feed stocks, anaerobic slurry digestion and CH4 capture systems − all of which reflect existing technology (high agreement, much evidence). Some strategies involve new uses of existing technologies. For example, oils have been used in animal diets for many years to increase dietary energy content, but their role and feasibility as a CH4 suppressant is still new and not fully defined. For some technologies, more research and development will be needed [8.9].
Long-term outlook
Global food demand may double by 2050, leading to intensified production practices (e.g., increasing use of nitrogen fertilizer). In addition, projected increases in the consumption of livestock products will increase CH4 and N2O emissions if livestock numbers increase, leading to growing emissions in the baseline after 2030. (high agreement, medium evidence). Agricultural mitigation measures will help to reduce GHG emissions per unit of product, relative to the baseline. However, until 2030 only about 10% of the mitigation potential is related to CH4 and N2O. Deployment of new mitigation practices for livestock systems and fertilizer applications will be essential to prevent an increase in emissions from agriculture after 2030.
Projecting long-term mitigation potentials is also hampered by other uncertainties. For example, the effects of climate change are unclear: future climate change may reduce soil
67
Technical Summary
carbon-sequestration rates, or could even release soil carbon, though the effect is uncertain as climate change may also increase soil carbon inputs through higher plant production. Some studies have suggested that technological improvements could potentially counteract the negative impacts of climate change on cropland and grassland soil carbon stocks, making technological improvement a key factor in future GHG mitigation. Such technologies could, for example, act through increasing production, thereby increasing carbon returns to the soil and reducing the demand for fresh cropland. (high agreement, medium evidence) [8.10].
9 Forestry
Since the TAR, new mitigation estimates have become available from the local scale to the global scale. Major economic reviews and global assessments have become available. There is early research into the integration of mitigation and adaptation options and the linkages to sustainable development. There is increased attention on reducing emissions from deforestation as a low cost mitigation option, one that will have significant positive side effects. There is some evidence that climate change impacts can also constrain the mitigation potential of forests.
Status of the sector, development trends including production and consumption, and implications
Global forest cover is 3952 million ha (Table TS.12), about 30% of the world’s land area. Most relevant for the carbon cycle is that between 2000 and 2005 gross deforestation continued at a rate of 12.9 million ha/yr, mainly as a result of converting forests to agricultural land, but also due to expansion of settlements and infrastructure, often for logging. In the 1990s, gross deforestation was slightly higher, 13.1 million ha/yr. Due
to afforestation, landscape restoration and natural expansion of forests, the net loss of forest between 2000 and 2005 was 7.3 million ha/yr, with the largest losses in South America, Africa and Southeast Asia. This net rate of loss was lower than the 8.9 million ha/yr loss in the 1990s (medium agreement, medium evidence) [9.2.1].
Emission sources and sinks; trends
On the global scale, during the last decade of the 20th century, deforestation in the tropics and forest regrowth in the temperate zone and parts of the boreal zone remained the major factors responsible for CO2 emissions and removals, respectively (Table TS.12, Figure TS.21). Emissions from deforestation in the 1990s are estimated at 5.8 GtCO2/yr.
However, the extent to which the loss of carbon due to tropical deforestation is offset by expanding forest areas and accumulating woody biomass in the boreal and temperate zone is an area of disagreement between actual land observations and estimates using top-down models. The top-down methods based on inversion of atmospheric transport models estimate the net terrestrial carbon sink for the 1990s, the balance of sinks in northern latitudes and sources in the tropics, to be about 9.5 GtCO2. The new estimates are consistent with the increase previously found in the terrestrial carbon sink in the 1990s over the 1980s, but the new sink estimates and the rate of increase may be smaller than previously reported. The residual sink estimate resulting from inversion of atmospheric transport models is significantly higher than any global sink estimate based on land observations.
The growing understanding of the complexity of the effects of land-surface change on the climate system shows the importance of considering the role of surface albedo, the fluxes of sensible and latent heat, evaporation and other factors in formulating policy for climate change mitigation in the forest
Africa 635.412 -4.4 -4.0 241267 228067 222933 64957
Asia 571.577 -0.8 1.0 150700 130533 119533 47111
Europe a) 1001.394 0.9 0.7 154000 158033 160967 107264
North and Central America
705.849 -0.3 -0.3 150333 153633 155467 78582
Oceania 206.254 -0.4 -0.4 42533 41800 41800 7361
South America 831.540 -3.8 -4.3 358233 345400 335500 128944
World 3952.026 -8.9 -7.3 1097067 1057467 1036200 434219
Table TS.12: Estimates of forest area, net changes in forest area (negative numbers indicating decrease), carbon stock in living biomass and growing stock in 1990, 2000 and 2005 [Table 9.1].
Note: a) including whole Russian Federation.
68
Technical Summary
sector. Complex modelling tools are needed to fully consider the climatic effect of changing land surface and to manage carbon stocks in the biosphere, but are not yet available. The potential effect of projected climate change on the net carbon balance in forests remains uncertain [9.3; 9.4].
As even the current functioning of the biosphere is uncertain, projecting the carbon balance of the global forestry sector remains very difficult. Generally, there is a lack of widely accepted studies and thus a lack of baselines. Trends for development in non-OECD countries, and thus of the deforestation rate, are unclear. In OECD countries and in economies in transition, development of management trends, the wood market, and impacts of climate change remain unclear. Long-term models as reported in Chapter 3, show baseline CO2 emissions from land-use change and forestry in 2030 that are the same or slightly lower than in 2000 (medium agreement, medium evidence) [9.3; 9.4].
Description and assessment of mitigation technologies and practices, options and potentials, costs and sustainability
Terrestrial carbon dynamics are characterized by long periods of small rates of carbon uptake per hectare, interrupted by short periods of rapid and large releases of carbon during disturbances or harvest. While individual stands in a forest may be sources or sinks, the carbon balance of the forest is determined by the sum of the net balance of all stands.
Options available to reduce emissions by sources and/or increase removals by sinks in the forest sector are grouped into four general categories: • maintaining or increasing the forest area; • maintaining or increasing the site-level carbon density;• maintaining or increasing the landscape-level carbon
density and
• increasing off-site carbon stocks in wood products and enhancing product and fuel substitution.
Each mitigation activity has a characteristic time sequence of actions, carbon benefits and costs (Figure TS.22). Relative to a baseline, the largest short-term gains are always achieved through mitigation activities aimed at avoiding emissions (reduced deforestation or degradation, fire protection, slash burning, etc.).
Figure TS.22: Generalized summary of the options available in the forest sector and their type and timing of effects on carbon stocks and the timing of costs [Figure 9.4].
Notes: green = sink. EECCA =Countries of Eastern Europe, the Caucasus and Central Asia. Data averaged per 5-year period; year marks starting year of period.
USA
-1000
0
2000
4000
1855
1900
1995
0
2000
1855
1900
1995
Canada
0
2000
4000
1855
1900
1995
Latin Americaand Caribbean
0
2000
1855
1900
1995
Europe
0
2000
1855
1900
1995
North Africa & Middle East
0
2000
1855
1900
1995
Sub-SaharanAfrica
0
2000
1855
1900
1995
EECCA
0
2000
1855
1900
1995
Non-Annex I East Asia
0
2000
4000
1855
1900
1995
Non-Annex I South Asia
0
2000
1855
1900
1995
OECD Pacific
69
Technical Summary
All forest-management activities aimed at increasing site-level and landscape-level carbon density are common practices that are technically feasible, but the extent and area over which they can be implemented could be increased considerably. Economic considerations are typically the main constraint, because retaining additional carbon on site delays revenues from harvest.
In the long term, a sustainable forest-management strategy aimed at maintaining or increasing forest carbon stocks, while producing an annual yield of timber, fibre or energy from the forest, will generate the largest sustained mitigation benefit.
Regional modelling assessments
Bottom-up regional studies show that forestry mitigation options have the economic potential (at costs up to 100 US$/tCO2-eq) to contribute 1.3-4.2 MtCO2/yr (average 2.7 GtCO2/yr) in 2030 excluding bio-energy. About 50% can be achieved at a cost under 20 US$/tCO2 (1.6 GtCO2/yr) with large differences between regions. The combined effects of reduced deforestation and degradation, afforestation, forest management, agro-forestry and bio-energy have the potential to increase from the present to 2030 and beyond. This analysis assumes gradual implementation of mitigation activities starting now (medium agreement, medium evidence) [9.4.4].
Global top-down models predict mitigation potentials of 13.8 GtCO2-eq/yr in 2030 at carbon prices less than or equal to 100 US$/tCO2. The sum of regional predictions is 22% of this value for the same year. Regional studies tend to use more detailed data and consider a wider range of mitigation options, and thus may more accurately reflect regional circumstances and constraints than simpler, more aggregated global models. However, regional studies vary in model structure, coverage, analytical approach and assumptions (including baseline
assumptions). Further research is required to narrow the gap in the estimates of mitigation potential from global and regional assessments (medium agreement, medium evidence) [9.4.3].
The best estimate of the economic mitigation potential for the forestry sector at this stage therefore cannot be more certain than a range between 2.7 and 13.8 GtCO2/yr in 2030, for costs <100 US$/tCO2; for costs <20 US$/tCO2 the range is 1.6 to 5 GtCO2/yr. About 65% of the total mitigation potential (up to 100 US$/tCO2-eq) is located in the tropics and about 50% of the total could be achieved by reducing emissions from deforestation (low agreement, medium evidence).
Forestry can also contribute to the provision of bio-energy from forest residues. The potential of bio-energy, however, is counted in the power supply, transportation (biofuels), industry and building sectors (see Chapter 11 for an overview). Based on bottom-up studies of potential biomass supply from forestry, and assuming that all of that will be used (which depends entirely on the cost of forestry biomass compared with other sources) a contribution in the order of 0.4 GtCO2/yr could come from forestry.
Global top-down models are starting to provide insight on where and which of the carbon mitigation options can best be allocated on the globe (Figure TS.24).
0
500
1.000
1.500
2.000
2.500
3.000
3.500
Centra
l and
Sou
th
Amer
ica
Non-A
nnex
I Sou
th A
sia
OECD Nor
th A
mer
ica
Africa
Mt CO2-eq
Non-A
nnex
I Eas
t Asia
EIT co
untri
es
Europ
e
OECD Pac
ific
Midd
le Eas
t
top down
bottom up
Figure TS.23: Comparison of outcomes of economic mitigation potential at <100 US$/tCO2-eq in 2030 in the forestry sector, as based on top-down global models versus the regional modelling results [Figure 9.13].
Figure TS.24: Allocation of global afforestation activities as given by two global top-down models. Top: location of bio-energy and carbon plantations in the world in 2100; bottom: percentage of a grid cell afforested in 2100 [Figure 9.11].
Agriculture
Ext. grassland
Bio-energy Forest
C-Plantations
Ice
Tundra
Grass/Steppe
Desert
Agriculture
Ext. grassland
Bio-energy Forest
C-Plantations
Ice
Tundra
Grass/Steppe
Desert
70
Technical Summary
Interactions of mitigation options with vulnerability and adaptation
Mitigation activities for forestry can be designed to be compatible with adapting to climate change, maintaining bio-diversity and promoting sustainable development. Comparing environmental and social co-benefits and costs with the carbon benefit will highlight trade-offs and synergies and help promote sustainable development.
The literature on the interaction between forestry mitigation and climate change is in its infancy. Forests are likely to be impacted by climate change, which could reduce their mitigation potential. A primary management adaptation option is to reduce as many ancillary stresses on the forest as possible. Maintaining widely dispersed and viable populations of individual species minimizes the probability of localized catastrophic events causing species extinction. Formation of protected areas or nature reserves is an example of mitigation as well as adaptation. Protecting areas (with corridors) also leads to conservation of biodiversity, in turn reducing vulnerability to climate change.
Forestry-mitigation projects provide adaptation co-benefits for other sectors. Examples include agro-forestry reducing the vulnerability to drought of rain-fed crop income, mangroves reducing the vulnerability of coastal settlements, and shelter belts slowing desertification (medium agreement, medium evidence) [9.5].
Effectiveness of and experience with climate policies, potentials, barriers and opportunities/implementation issues
Forestry can make a very significant contribution to a low cost global mitigation portfolio that provides synergies with adaptation and sustainable development. Chapter 9 of this report identifies a whole set of options and policies to achieve this mitigation potential. However, this opportunity has so far not been taken because of the current institutional context, lack of incentives for forest managers and lack of enforcement of existing regulations. Without better policy instruments, only a small portion of this potential is likely to be realized.
Realization of the mitigation potential requires institutional capacity, investment capital, technology, R&D and transfer, as well as appropriate (international) policies and incentives. In many regions, their absence has been a barrier to implementation of forestry-mitigation activities. Notable exceptions exist, however, such as regional successes in reducing deforestation rates and implementing afforestation programmes (high agreement, much evidence).
Multiple and location-specific strategies are required to guide mitigation policies in the sector. The optimum choices depend on the current state of the forests, the dominant drivers of forest change, and the anticipated future dynamics of the forests within each region. Participation of all stakeholders and policy-makers
is necessary to promote mitigation projects and design an optimal mix of measures. Integration of mitigation in the forestry sector into land-use planning could be important in this respect.
Most existing policies to slow tropical deforestation have had minimal impact due to lack of regulatory and institutional capacity or countervailing profitability incentives. In addition to more dedicated enforcement of regulations, well-constructed carbon markets or other environmental service payment schemes may help overcome barriers to reducing deforestation by providing positive financial incentives for retaining forest cover.
There have been several proposals to operationalize activities post 2012, including market-based as well as non-market based approaches; for example, through a dedicated fund to voluntarily reduce emissions from deforestation. Policy measures such as subsidies and tax exemptions have been used successfully to encourage afforestation and reforestation both in developed and developing countries. Care must be taken, however, to avoid possible negative environmental and social impacts of large-scale plantation establishment.
Despite relative low costs and many potential positive side effects of afforestation and reforestation under the Clean Development Mechanism (CDM), not many project activities are yet being implemented due to a number of barriers, including the late agreement on and complexity of the rules governing afforestation and reforestation CDM project activities. The requirements for forestry mitigation projects to become viable on a larger scale include certainty over future commitments, streamlined and simplified rules, and reductions in transaction costs. Standardization of project assessment can play an important role in overcoming uncertainties among potential buyers, investors and project participants (high agreement, medium evidence) [9.6].
Forests and Sustainable Development
While the assessment in the forestry chapter identifies remaining uncertainties about the magnitude of the mitigation benefits and costs, the technologies and knowledge required to implement mitigation activities exist today. Forestry can make a significant and sustained contribution to a global mitigation portfolio, while also meeting a wide range of social, economic and ecological objectives. Important co-benefits can be gained by considering forestry mitigation options as an element of broader land-management plans.
Plantations can contribute positively, for example, to employment, economic growth, exports, renewable energy supply and poverty alleviation. In some instances, plantations may also lead to negative social impacts such as loss of grazing land and source of traditional livelihoods. Agro-forestry can produce a wide range of economic, social and environmental benefits; probably wider than large-scale afforestation. Since ancillary benefits tend to be local rather than global, identifying
71
Technical Summary
and accounting for them can reduce or partially compensate the costs of the mitigation measures (high agreement, medium evidence) [9.7].
Technology research, development, deployment, diffusion and transfer
The deployment, diffusion and transfer of technologies such as improved forest-management systems, forest practices and processing technologies including bio-energy, are key to improving the economic and social viability of the different mitigation options. Governments could play a critical role in providing targeted financial and technical support, promoting the participation of communities, institutions and NGOs (high agreement, much evidence) [9.8].
Long-term outlook
Uncertainties in the carbon cycle, the uncertain impacts of climate change on forests and its many dynamic feedbacks, time-lags in the emission-sequestration processes, as well as uncertainties in future socio-economic paths (e.g., to what extent deforestation can be substantially reduced in the coming decades) cause large variations in future carbon balance projections for forests.
Overall, it is expected that in the long-term, mitigation activities will help increase the carbon sink, with the net balance depending on the region. Boreal primary forests will either be small sources or sinks depending on the net effect of enhancement of growth versus a loss of soil organic matter and emissions from increased fires. Temperate forests will probably continue to be net carbon sinks, favoured also by enhanced forest growth due to climate change. In the tropical regions, human-induced land-use changes are expected to continue to drive the dynamics for decades. Beyond 2040, depending very particularly on the effectiveness of policies aimed at reducing forest degradation and deforestation, tropical forests may become net sinks, depending on the influence of climate change. Also, in the medium to long term, commercial bio-energy is expected to become increasingly important.
Developing optimum regional strategies for climate change mitigation involving forests will require complex analyses of the trade-offs (synergies and competition) in land-use between forestry and other land-uses, trade-offs between forest conservation for carbon storage and other environmental services such as biodiversity and watershed conservation and sustainable forest harvesting to provide society with carbon-containing fibre, timber and bio-energy resources, and trade-offs among utilization strategies of harvested wood products aimed at maximizing storage in long-lived products, recycling, and use for bio-energy [9.9].
10 Waste management
Status of the sector, development trends and implications
Waste generation is related to population, affluence and urbanization. Current global rates of post-consumer waste generation are estimated to be 900-1300 Mt/yr. Rates have been increasing in recent years, especially in developing countries with rapid population growth, economic growth and urbanization. In highly developed countries, a current goal is to decouple waste generation from economic driving forces such as GDP — recent trends suggest that per capita rates of post-consumer waste generation may be peaking as a result of recycling, re-use, waste minimization, and other initiatives (medium agreement, medium evidence) [10.1, 10.2].
Post-consumer waste is a small contributor to global GHG emissions (<5%), with landfill CH4 accounting for >50% of current emissions. Secondary sources of emissions are wastewater CH4 and N2O; in addition, minor emissions of CO2 result from incineration of waste containing fossil carbon. In general, there are large uncertainties with respect to quantification of direct emissions, indirect emissions and mitigation potentials for the waste sector, which could be reduced by consistent and coordinated data collection and analysis at the national level. There are currently no inventory methods for annual quantification of GHG emissions from waste transport, nor for annual emissions of fluorinated gases from post-consumer waste (high agreement, much evidence) [10.3].
It is important to emphasize that post-consumer waste constitutes a significant renewable energy resource that can be exploited through thermal processes (incineration and industrial co-combustion), landfill gas utilization and use of anaerobic digester biogas. Waste has an economic advantage in comparison to many biomass resources because it is regularly collected at public expense. The energy content of waste can be most efficiently exploited using thermal processes: during combustion, energy is obtained directly from biomass (paper products, wood, natural textiles, food) and from fossil carbon sources (plastics, synthetic textiles). Assuming an average heating value of 9 GJ/t, global waste contains >8 EJ of available energy, which could increase to 13 EJ (nearly 2% of primary energy demand) in 2030 (medium agreement, medium evidence) [10.1]. Currently, more than 130 million tonnes/yr of waste are combusted worldwide, which is equivalent to >1 EJ/yr. The recovery of landfill CH4 as a source of renewable energy was commercialized more than 30 years ago with a current energy value of >0.2 EJ/yr. Along with thermal processes, landfill gas and anaerobic digester gas can provide important local sources of supplemental energy (high agreement, much evidence) [10.1, 10.3].
72
Technical Summary
Because of landfill gas recovery and complementary measures (increased recycling and decreased landfilling through the implementation of alternative technologies), emissions of CH4 from landfills in developed countries have been largely stabilized. Choices for mature, large-scale waste management technologies to avoid or reduce GHG emissions compared with landfilling include incineration for waste-to-energy and biological processes such as composting or mechanical-biological treatment (MBT). However, in developing countries, landfill CH4 emissions are increasing as more controlled (anaerobic) landfilling practices are being implemented. This is especially true for rapidly urbanizing areas where engineered landfills provide a more environmentally acceptable waste-disposal strategy than open dumpsites by reducing disease vectors, toxic odours, uncontrolled combustion and pollutant emissions to air, water and soil. Paradoxically, higher GHG emissions occur as the aerobic production of CO2 (by burning and aerobic decomposition) is shifted to anaerobic production of CH4. To a large extent, this is the same transition to sanitary landfilling that occurred in many developed countries during 1950–1970. The increased CH4 emissions can be mitigated by accelerating the introduction of engineered gas recovery, aided by Kyoto mechanisms such as CDM and Joint Implementation (JI). As of late October 2006, landfill gas recovery projects accounted for 12% of the average annual Certified Emission Reductions (CERs) under CDM. In addition, alternative waste management strategies such as recycling and composting can be implemented in developing countries. Composting can provide an affordable, sustainable alternative to engineered landfills, especially where more labour-intensive, lower-technology strategies are applied to selected biodegradable waste streams (high agreement, medium evidence) [10.3].
Recycling, re-use and waste minimization initiatives, both public and private, are indirectly reducing GHG emissions by decreasing the mass of waste requiring disposal. Depending on regulations, policies, markets, economic priorities and local constraints, developed countries are implementing increasingly higher recycling rates to conserve resources, offset fossil fuel use, and avoid GHG generation. Quantification of global recycling rates is not currently possible because of varying baselines and definitions; however, local reductions of >50% have been achieved. Recycling could be expanded practically in many countries to achieve additional reductions. In developing countries, waste scavenging and informal recycling are common practices. Through various diversion and small-scale recycling activities, those who make their living from decentralized waste management can significantly reduce the mass of waste that requires more centralized solutions. Studies indicate that low-technology recycling activities can also generate significant employment through creative microfinance and other small-scale investments. The challenge is to provide safer, healthier working conditions than currently experienced by waste scavengers at uncontrolled dumpsites (medium agreement, medium evidence) [10.3].
For wastewater, only about 60% of the global population has sanitation coverage (sewerage). For wastewater treatment, almost 90% of the population in developed countries but less than 30% in developing countries has improved sanitation (including sewerage and waste water treatment, septic tanks, or latrines). In addition to GHG mitigation, improved sanitation and wastewater management provide a wide range of health and environmental co-benefits (high agreement, much evidence) [10.2, 10.3].
With respect to both waste and wastewater management in developing countries, two key constraints to sustainable development are the lack of financial resources and the selection of appropriate and truly sustainable technologies for a particular setting. It is a significant and costly challenge to implementing waste and wastewater collection, transport, recycling, treatment and residuals management in many developing countries. However, the implementation of sustainable waste and wastewater infrastructure yields multiple co-benefits to assist with the implementation of Millennium Development Goals (MDGs) via improved public health, conservation of water resources, and reduction of untreated discharges to air, surface water, groundwater, soils and coastal zones (high agreement, much evidence) [10.4].
Emission trends
With total 2005 emissions of approximately 1300 MtCO2-eq/yr, the waste sector contributes about 2–3% of total GHG emissions from Annex I and EIT countries and 4–5% from non-Annex I countries (see Table TS.13). For 2005–2020, business-as-usual (BAU) projections indicate that landfill CH4 will remain the largest source at 55–60% of the total. Landfill CH4 emissions are stabilizing and decreasing in many developed countries as a result of increased landfill gas recovery combined with waste diversion from landfills through recycling, waste minimization and alternative thermal and biological waste management strategies. However, landfill CH4 emissions are increasing in developing countries because of larger quantities of municipal solid waste from rising urban populations, increasing economic development and, to some extent, the replacement of open burning and dumping by engineered landfills. Without additional measures, a 50% increase in landfill CH4 emissions from 2005 to 2020 is projected, mainly from the Non-Annex I countries. Wastewater emissions of CH4 and N2O from developing countries are also rising rapidly with increasing urbanization and population. Moreover, because the wastewater emissions in Table TS.13 are based on human sewage only and are not available for all developing countries, these emissions are underestimated (high agreement, medium evidence) [10.1, 10.2, 10.3, 10.4].
73
Technical Summary
Description and assessment of mitigation technologies and practices, options and potentials, costs and sustainability
Existing waste management technologies can effectively mitigate GHG emissions from this sector – a wide range of mature, low- to high-technology, environmentally-effective strategies are commercially available to mitigate emissions and provide co-benefits for improved public health and safety, soil protection, pollution prevention and local energy supply. Collectively, these technologies can directly reduce GHG emissions (through landfill CH4 recovery and utilization, improved landfill practices, engineered wastewater management, utilization of anaerobic digester biogas) or avoid significant GHG generation (through controlled composting of organic waste, state-of-the-art incineration, expanded sanitation coverage). In addition, waste minimization, recycling and re-use represent an important and increasing potential for indirect reduction of GHG emissions through the conservation of raw materials, improved energy and resource efficiency and fossil fuel avoidance. For developing countries, environmentally responsible waste management at an appropriate level of technology promotes sustainable development and improves public health (high agreement, much evidence) [10.4].
Because waste management decisions are often made locally without concurrent quantification of GHG mitigation, the importance of the waste sector for reducing global GHG emissions has been underestimated (high agreement, medium evidence) [10.1; 10.4]. Flexible strategies and financial incen-tives can expand waste management options to achieve GHG mitigation goals – in the context of integrated waste management, local technology decisions are a function of many competing variables, including waste quantity and characteristics, cost and financing issues, regulatory constraints and infrastructure requirements, including available land area and collection/transportation considerations. Life-cycle assessment (LCA) can provide decision-support tools (high agreement, much evidence) [10.4].
Landfill CH4 emissions are directly reduced through engineered gas extraction and recovery systems consisting
of vertical wells and/or horizontal collectors. In addition, landfill gas offsets the use of fossil fuels for industrial or commercial process heating, onsite generation of electricity or as a feedstock for synthetic natural gas fuels. Commercial recovery of landfill CH4 has occurred at full scale since 1975 with documented utilization in 2003 at 1150 plants recovering 105 MtCO2–eq/yr. Because there are also many projects that flare gas without utilization, the total recovery is likely to be at least double this figure (high agreement, medium evidence) [10.1; 10.4]. A linear regression using historical data from the early 1980s to 2003 indicates a growth rate for landfill CH4 utilization of approximately 5% per year. In addition to landfill gas recovery, the further development and implementation of landfill ‘biocovers’ can provide an additional low cost, biological strategy to mitigate emissions since landfill CH4 (and non-methane volatile organic compounds (NMVOCs)) emissions are also reduced by aerobic microbial oxidation in landfill-cover soils (high agreement, much evidence) [10.4].
Incineration and industrial co-combustion for waste-to-energy
provide significant renewable energy benefits and fossil fuel offsets at >600 plants worldwide, while producing very minor GHG emissions compared with landfilling. Thermal processes with advanced emission controls are a proven technology but more costly than controlled landfilling with landfill gas recovery (high agreement, medium evidence) [10.4].
Controlled biological processes can also provide important GHG mitigation strategies, preferably using source-separated waste streams. Aerobic composting of waste avoids GHG generation and is an appropriate strategy for many developed and developing countries, either as a stand-alone process or as part of mechanical-biological treatment. In many developing countries, notably China and India, small-scale low-technology anaerobic digestion has also been practised for decades. Since higher-technology incineration and composting plants have proved unsustainable in a number of developing countries, lower-technology composting or anaerobic digestion can be implemented to provide sustainable waste management solutions (high agreement, medium evidence) [10.4].
For 2030, the total economic reduction potential for CH4 emissions from landfilled waste at costs of <20 US$/tCO2-eq
Table TS.13: Trends for GHG emissions from waste using 1996 and 2006 UNFCCC inventory guidelines, extrapolations and BAU projections (MtCO2-eq, rounded) [Table 10.3].
Note: a) wastewater emissions are underestimated - see text.
74
Technical Summary
ranges between 400 and 800 MtCO2-eq. Of this total, 300–500 MtCO2-eq/yr has negative cost (Table TS.14). For the long term, if energy prices continue to increase, there will be more profound changes in waste management strategies related to energy and materials recovery in both developed and developing countries. Thermal processes, which have higher unit costs than landfilling, become more viable as energy prices increase. Because landfills continue to produce CH4 for many decades, both thermal and biological processes are complementary to increased landfill gas recovery over shorter time frames (high agreement, limited evidence) [10.4].
For wastewater, increased levels of improved sanitation in developing countries can provide multiple benefits for GHG mitigation, improved public health, conservation of water resources and reduction of untreated discharges to water and soils. Historically, urban sanitation in developed countries has focused on centralized sewerage and wastewater treatment plants, which are too expensive for rural areas with low population density and may not be practical to implement in rapidly growing, peri-urban areas with high population density. It has been demonstrated that a combination of low cost technology with concentrated efforts for community acceptance, participation and management can successfully expand sanitation coverage. Wastewater is also a secondary water resource in countries with water shortages where water re-use and recyling could assist many developing and developed countries with irregular water supplies. These measures also encourage smaller wastewater treatment plants with reduced nutrient loads and proportionally lower GHG emissions. Estimates of global or regional mitigation costs and potentials for wastewater are not currently available (high agreement, limited evidence) [10.4].
Effectiveness of and experience with climate policies, potentials, barriers and opportunities/implementation issues
Because landfill CH4 is the dominant GHG from this sector, a major strategy is the implementation of standards that encourage or mandate landfill CH4 recovery. In developed countries, landfill CH4 recovery has increased as a result of direct regulations requiring landfill gas capture, voluntary measures including GHG-emissions credits trading and financial incentives (including tax credits) for renewable energy or green power. In developing countries, it is anticipated that landfill CH4 recovery will increase during the next two decades as controlled landfilling is phased in as a major waste disposal strategy. JI and the CDM have already proved to be useful mechanisms for external investment from industrialized countries, especially for landfill gas recovery projects where the lack of financing is a major impediment. The benefits are twofold: reduced GHG emissions with energy benefits from landfill CH4 plus upgraded landfill design and operations. Currently (late October 2006), under the CDM, the annual average CERs for the 33 landfill gas recovery projects constitute about 12% of the total. Most of these projects (Figure TS.25) are located in Latin-American countries (72% of landfill gas CERs), dominated by Brazil (9 projects; 48% of CERs) (high agreement, medium evidence) [10.4].
In the EU, landfill gas recovery is mandated at existing sites, while the landfilling of organic waste is being phased out via the landfill directive (1999/31/EC). This directive requires, by 2016, a 65% reduction relative to 1995 in the mass of biodegradable organic waste that is landfilled annually. As a result, post-consumer waste is being diverted to incineration and to mechanical and biological treatment (MBT) before landfilling to recover recyclables and reduce the organic carbon content. In 2002, EU waste-to-energy plants generated about 40 million GJ of electrical and 110 million GJ of thermal energy, while between 1990 and 2002, landfill CH4 emissions in the EU decreased by
Region
Projected emissions in 2030
(MtCO2-eq)
Total economic mitigation potential at <100 US$/tCO2-eq
(MtCO2-eq)
Economic mitigation potential (MtCO2-eq) at various cost categories
(US$/tCO2-eq)
<0 0-20 20-50 50-100
OECD 360 100-200 100-120 20-100 0-7 1
EIT 180 100 30-60 20-80 5 1-10
Non-OECD 960 200-700 200-300 30-100 0-200 0-70
Global 1500 400-1000 300-500 70-300 5-200 10-70
Notes:1) Costs and potentials for wastewater mitigation are not available. 2) Regional numbers are rounded to reflect the uncertainty in the estimates and may not equal global totals. 3) Landfill carbon sequestration not considered.4) The timing of measures limiting landfill disposal affects the annual mitigation potential in 2030. The upper limits assume that landfill disposal is limited in the
coming years to 15% of the waste generated globally. The lower limits reflect a more realistic timing for implementation of measures reducing landfill disposal.
Table TS.14: Ranges for economic mitigation potential for regional landfill CH4 emissions at various cost categories in 2030, see notes [Table 10.5].
75
Technical Summary
almost 30% due to the landfill directive and related national legislation (high agreement, much evidence) [10.4, 10.5].
Integrated and non-climate policies affecting emissions of greenhouse gases: GHG mitigation as the co-benefit of waste policies and regulations; role of sustainable development
GHG mitigation is often not the primary driver, but is itself a co-benefit of policies and measures in the waste sector that address broad environmental objectives, encourage energy recovery from waste, reduce use of virgin materials, restrict choices for ultimate waste disposal, promote waste recycling and re-use and encourage waste minimization. Policies and measures to promote waste minimization, re-use and recycling indirectly reduce GHG emissions from waste. These measures include Extended Producer Responsibility (EPR), unit pricing (or PAYT/‘Pay As You Throw’) and landfill taxes. Other measures include separate and efficient collection of recyclables together with both unit pricing and landfill tax systems. Some Asian countries are encouraging ‘circular economy’ or ‘sound material-cycle society’ as a new development strategy whose core concept is the circular (closed) flow of materials and the use of raw materials and energy through multiple phases. Because of limited data, differing baselines and other regional conditions, it is not currently possible to quantify the global effectiveness of these strategies in reducing GHG emissions (medium agreement, medium evidence) [10.5].
In many countries, waste and wastewater management policies are closely integrated with environmental policies
and regulations pertaining to air, water and soil quality as well as to renewable energy initiatives. Renewable-energy programmes include requirements for electricity generation from renewable sources, mandates for utilities to purchase power from small renewable providers, renewable energy tax credits, and green power initiatives, which allow consumers to choose renewable providers. In general, the decentralization of electricity generation capacity via renewables can provide strong incentives for electrical generation from landfill CH4 and thermal processes for waste-to-energy (high agreement, much evidence) [10.5].
Although policy instruments in the waste sector consist mainly of regulations, there are also economic measures in a number of countries to encourage particular waste management technologies, recycling and waste minimization. These include incinerator subsidies or tax exemptions for waste-to-energy. Thermal processes can most efficiently exploit the energy value of post-consumer waste, but must include emission controls to limit emissions of secondary air pollutants. Subsidies for the construction of incinerators have been implemented in several countries, usually combined with standards for energy efficiency. Tax exemptions for electricity generated by waste incinerators and for waste disposal with energy recovery have also been adopted (high agreement, much evidence) [10.5].
The co-benefits of effective and sustainable waste and wastewater collection, transport, recycling, treatment and disposal include GHG mitigation, improved public health, conservation of water resources and reductions in the discharge of untreated pollutants to air, soil, surface water and groundwater. Because there are many examples of abandoned waste and wastewater plants in developing countries, it must be stressed that a key aspect of sustainable development is the selection of appropriate technologies that can be sustained within the specific local infrastructure (high agreement, medium evidence) [10.5].
Technology research, development and diffusion
In general, the waste sector is characterized by mature technologies that require further diffusion in developing countries. Advances under development include:• Landfilling: Implementation of optimized gas collection
systems at an early stage of landfill development to increase long-term gas collection efficiency. Optimization of landfill biodegradation (bioreactors) to provide greater process control and shorter waste degradation lifetimes. Construction of landfill ‘biocovers’ that optimize microbial oxidation of CH4 and NMVOCs to minimize emissions.
• Biological processes: For developing countries, lower-technology, affordable sustainable composting and anaerobic digestion strategies for source-separated biodegradable waste.
• Thermal processes: Advanced waste-to-energy technologies that can provide higher thermal and electrical efficiencies
Brazil48%
Armenia16%
Argentina11%
Chile7%
China6%
Mexico3%
Tunesia3%
El Salvador2%
Projects <100,000 CER/yr3%
Costa Rica1%
Figure TS.25: Distribution of landfill gas CDM projects based on average annual CERs for registered projects late October, 2006 [Figure 10.9].Note: Includes 11 MtCO2-eq/yr CERs for landfill CH4 out of 91 MtCO2-eq/yr total. Projects <100,000 CERs/yr are located in Israel, Bolivia, Bangladesh and Malaysia.
76
Technical Summary
than current incinerators (10–20% net electrical efficiency). Increased implementation of industrial co-combustion using feedstocks from various waste fractions to offset fossil fuels. Gasification and pyrolysis of source-separated waste fractions in combination with improved, lower-cost separation technologies for production of fuels and feedstocks.
• Recycling, re-use, waste minimization, pre-treatment (impro-ved mechanical-biological treatment processes) Innovations in recycling technology and process improvements resulting in decreased use of virgin materials, energy conservation, and fossil fuel offsets. Development of innovative but low-technology recycling solutions for developing countries.
• Wastewater: New low-technology ecological designs for improved sanitation at the household and small community level, which can be implemented sustainably for efficient small-scale wastewater treatment and water conservation in both developed and developing countries (high agreement, limited evidence) [10.5; 10.6].
Long-term outlook, systems transitions
To minimize future GHG emissions from the waste sector, it is important to preserve local options for a wide range of integrated and sustainable management strategies. Furthermore, primary reductions in waste generation through recycling, re-use, and waste minimization can provide substantial benefits for the conservation of raw materials and energy. Over the long term, because landfills continue to produce CH4 for decades, landfill gas recovery will be required at existing landfills even as many countries change to non-landfilling technologies such as incineration, industrial co-combustion, mechanical-biological treatment, large-scale composting and anaerobic digestion. In addition, the ‘back-up’ landfill will continue to be a critical component of municipal solid waste planning. In developing countries, investment in improved waste and wastewater management confers significant co-benefits for public health and safety, environmental protection and infrastructure development.
11 Mitigation from a cross-sectoral
perspective
Mitigation options across sectors
While many of the technological, behavioural and policy options mentioned in Chapters 4–10 concern specific sectors, some technologies and policies reach across many sectors; for example, the use of biomass and the switch from high-carbon fuels to gas affect energy supply, transport, industry and buildings. Apart from potentials for common technologies, these examples also highlight possible competition for resources, such as finance and R&D support [11.2.1].
The bottom-up compilation of mitigation potentials by sector is complicated by interactions and spill-overs between
sectors, over time and over regions and markets. A series of formal procedures has been used to remove potential double counting, such as reduction of the capacity needed in the power sector due to electricity saving in industry and the buildings sector. An integration of sector potentials in this way is required to summarize the sectoral assessments of Chapters 4–10. The uncertainty of the outcome is influenced by issues of comparability of sector calculations, difference in coverage between the sectors (e.g., the transport sector) and the aggregation itself, in which only the main and direct sector interactions have been taken into account [11.3.1].
The top-down estimates were derived from stabilization scenarios, i.e., runs towards long-term stabilization of atmospheric GHG concentration [3.6].
Figure TS.26A and Table TS.15 show that the bottom-up assessments emphasize the opportunities for no-regrets options in many sectors, with a bottom-up estimate for all sectors by 2030 of about 6 GtCO2-eq at negative costs; that is, net benefits. A large share of the no-regrets options is in the building sector. The total for bottom-up low cost options (no-regrets and other options costing less than 20 US$/tCO2-eq) is around 13 GtCO2-eq (ranges are discussed below). There are additional bottom-up potentials of around 6 and 4 GtCO2-eq at additional costs of <50 and 100 US$/tCO2-eq respectively (medium agreement, medium evidence) [11.3.1].
There are several qualifications to these estimates in addition to those mentioned above. First, in the bottom-up estimates a set of emission-reduction options, mainly for co-generation, parts of the transport sector and non-technical options such as behavioural changes, are excluded because the available literature did not allow a reliable assessment. It is estimated that the bottom-up potentials are therefore underestimated by 10–15%. Second, the chapters identify a number of key sensitivities that have not been quantified, relating to energy prices, discount rates and the scaling-up of regional results for the agricultural and forestry options. Third, there is a lack of estimates for many EIT countries and substantial parts of the non-OECD/EIT region [11.3.1].
The estimates of potentials at carbon prices <20 US$/tCO2- eq are lower than the TAR bottom-up estimates that were evaluated for carbon prices <27 US$/tCO2-eq, due to better information in recent literature (high agreement, much evidence).
Figure TS.15 and Table TS.16 show that the overall bottom-up potentials are comparable with those of the 2030 results from top-down models, as reported in Chapter 3.
At the sectoral level, there are larger differences between bottom-up and top-down, mainly because the sector definitions in top-down models often differ from those in bottom-up assessments (table TS.17). Although there are slight differences
77
Technical Summary
between the baselines assumed for top-down and bottom-up assessments, the results are close enough to provide a robust estimate of the overall economic mitigation potential by 2030. The mitigation potential at carbon prices of <100 US$/tCO2-eq is about 25–50% of 2030 baseline emissions (high agreement, much evidence).
Table TS.17 shows that for point-of-emission analysis18 a large part of the long-term mitigation potential is in the energy-
supply sector. However, for an end-use sector analysis as used for the results in Figure TS.27, the highest potential lies in the building and agriculture sectors. For agriculture and forestry, top-down estimates are lower than those from bottom-up studies. This is because these sectors are generally not well covered in top-down models. The energy supply and industry estimates from top-down models are generally higher than those from bottom-up assessments (high agreement, medium evidence) [11.3.1].
Carbon price(US$/tCO2-eq)
Economic potential(GtCO2-eq/yr)
Reduction relative to SRES A1 B(68 GtCO2-eq/yr)
(%)
Reduction relative to SRES B2(49 GtCO2-eq/yr)
(%)
0 5-7 7-10 10-14
20 9-17 14-25 19-35
50 13-26 20-38 27-52
100 16-31 23-46 32-63
Carbon price(US$/tCO2-eq)
Economic potential(GtCO2-eq/yr)
Reduction relative to SRES A1 B(68 GtCO2-eq/yr)
(%)
Reduction relative to SRES B2(49 GtCO2-eq/yr)
(%)
20 9-18 13-27 18-37
50 14-23 21-34 29-47
100 17-26 25-38 35-53
Table TS.16: Global economic mitigation potential in 2030 estimated from top-down studies [11.3].
Table TS.15: Global economic mitigation potential in 2030 estimated from bottom-up studies [11.3].
18 In a point-of-emission analysis, emissions from electricity use are allocated to the energy-supply sector. In an end-use sector analysis, emissions from electricity are allocated to the respective end-use sector (particularly relevant for industry and buildings).
0
5
10
15
20
25
30
35
low end of range high end of range
US$/tCO2-eq
0
5
10
15
20
25
30
35
low end of range high end of range
<0 <20 <50 <100 US$/tCO2-eq<20 <50 <100
GtCO2-eq GtCO2-eq
Figure TS.26A: Global economic mitigation potential in 2030 estimated from bottom-up studies. Data from Table TS.15. [Figure 11.3].
Figure TS.26B: Global economic mitigation potential in 2030 estimated from top-down studies. Data from Table TS.16. [Figure 11.3].
78
Technical Summary
Bio-energy options are important for many sectors by 2030, with substantial growth potential beyond, although no complete integrated studies are available for supply-demand balances. Key preconditions for such contributions are the development of biomass capacity (energy crops) in balance with investments in agricultural practices, logistic capacity and markets, together with commercialization of second-generation biofuel production. Sustainable biomass production and use
could ensure that issues in relation to competition for land and food, water resources, biodiversity and socio-economic impacts are not creating obstacles (high agreement, limited evidence) [11.3.1.4].
Apart from the mitigation options mentioned in the sectoral Chapters 4–10, geo-engineering solutions to the enhanced greenhouse effect have been proposed. However, options
Chapter of report
Sectors
Sector-based (‘bottom-up’) potential by 2030(GtCO2-eq/yr)
Economy-wide model (‘top-down’) snapshot of mitigation
by 2030(GtCO2-eq/yr)
End-use sector allocation (allocation of electricity savings
to end-use sectors)
Point-of-emissions allocation (emission reductions from end-use electricity savings allocated to
energy supply sector)
Carbon price <20 US$/tCO2-eq
Low High Low High Low High
4 Energy supply & conversion
1.2 2.4 4.4 6.4 3.9 9.7
5 Transport 1.3 2.1 1.3 2.1 0.1 1.6
6 Buildings 4.9 6.1 1.9 2.3 0.3 1.1
7 Industry 0.7 1.5 0.5 1.3 1.2 3.2
8 Agriculture 0.3 2.4 0.3 2.4 0..6 1.2
9 Forestry 0.6 1.9 0.6 1.9 0.2 0.8
10 Waste 0.3 0.8 0.3 0.8 0.7 0.9
11 Total 9.3 17.1 9.1 17.9 8.7 17.9
Carbon price <50 US$/tCO2-eq
4 Energy supply & conversion
2.2 4.2 5.6 8.4 6.7 12.4
5 Transport 1.5 2.3 1.5 2.3 0.5 1.9
6 Buildings 4.9 6.1 1.9 2.3 0.4 1.3
7 Industry 2.2 4.7 1.6 4.5 2.2 4.3
8 Agriculture 1.4 3.9 1.4 3.9 0.8 1.4
9 Forestry 1.0 3.2 1.0 3.2 0.2 0.8
10 Waste 0.4 1.0 0.4 1.0 0.8 1.0
11 Total 13.3 25.7 13.2 25.8 13.7 22.6
Carbon price <100 US$/tCO2-eq
4 Energy supply & conversion
2.4 4.7 6.3 9.3 8.7 14.5
5 Transport 1.6 2.5 1.6 2.5 0.8 2.5
6 Buildings 5.4 6.7 2.3 2.9 0.6 1.5
7 Industry 2.5 5.5 1.7 4.7 3.0 5.0
8 Agriculture 2.3 6.4 2.3 6.4 0.9 1.5
9 Forestry 1.3 4.2 1.3 4.2 0.2 0.8
10 Waste 0.4 1.0 0.4 1.0 0.9 1.1
11 Total 15.8 31.1 15.8 31.1 16.8 26.2
Sources: Tables 3.16, 3.17 and 11.3See notes to Tables 3.16, 3.17 and 11.3, and Annex 11.1.
Table TS.17: Economic potential for sectoral mitigation by 2030: comparison of bottom-up (from Table 11.3) and top-down estimates (from Section 3.6) [Table 11.5].
79
Technical Summary
to remove CO2 directly from the air, for example, by iron fertilization of the oceans, or to block sunlight, remain largely speculative and may have a risk of unknown side effects. Blocking sunlight does not affect the expected escalation in atmospheric CO2 levels, but could reduce or eliminate the associated warming. This disconnection of the link between CO2 concentration and global temperature could have beneficial consequences, for example, in increasing the productivity of agriculture and forestry (in as far as CO2 fertilization is effective), but they do not mitigate or address other impacts such as further acidification of the oceans. Detailed cost estimates for these options have not been published and they are without a clear institutional framework for implementation (medium agreement, limited evidence) [11.2.2].
Mitigation costs across sectors and macro-economic costs
The costs of implementing the Kyoto Protocol are estimated to be much lower than the TAR estimates due to US rejection of the Protocol. With full use of the Kyoto flexible mechanisms, costs are estimated at less than 0.05% of Annex B (without US) GDP (TAR Annex B: 0.1–1.1%). Without flexible mechanisms,
costs are now estimated at less than 0.1% (TAR 0.2–2%) (high agreement, much evidence) [11.4].
Modelling studies of post-2012 mitigation have been assessed in relation to their global effects on CO2 abatement by 2030, the carbon prices required and their effects on GDP or GNP (for the long-term effects of stabilization after 2030 see Chapter 3). For Category IV19 pathways (stabilization around 650 ppm CO2-eq) with CO2 abatement less than 20% below baseline and up to 25 US$/tCO2 carbon prices, studies suggest that gross world product would be, at worst, some 0.7% below baseline by 2030, consistent with the median of 0.2% and the 10–90 percentile range of –0.6 to 1.2% for the full set of scenarios given in Chapter 3.
Effects are more uncertain for the more stringent Category III pathways (stabilization around 550 ppm CO2-eq) with CO2 abatement less than 40% and up to 50 US$/tCO2 carbon prices, with most studies suggesting costs less than 1% of global gross world product, consistent with the median of 0.6% and the 10–90 percentile range of 0 to 2.5% for the full set in Chapter 3. Again, the estimates are heavily dependent on approaches and assumptions. The few studies with baselines that require
Figure TS.27: Estimated sectoral economic potential for global mitigation for different regions as a function of carbon price in 2030 from bottom-up studies,
compared to the respective baselines assumed in the sector assessments. A full explanation of the derivation of this figure is found in Section 11.3. Notes:1. The ranges for global economic potentials as assessed in each sector are shown by vertical lines. The ranges are based on end-use allocations of emissions,
meaning that emissions of electricity use are counted towards the end-use sectors and not to the energy supply sector.2. The estimated potentials have been constrained by the availability of studies particularly at high carbon price levels.3. Sectors used different baselines. For industry the SRES B2 baseline was taken, for energy supply and transport the WEO 2004 baseline was used; the building
sector is based on a baseline in between SRES B2 and A1B; for waste, SRES A1B driving forces were used to construct a waste specific baseline, agriculture and forestry used baselines that mostly used B2 driving forces.
4. Only global totals for transport are shown because international aviation is included [5.4].5. Categories excluded are: non-CO2 emissions in buildings and transport, part of material efficiency options, heat production and cogeneration in energy supply,
heavy duty vehicles, shipping and high-occupancy passenger transport, most high-cost options for buildings, wastewater treatment, emission reduction from coal mines and gas pipelines, fluorinated gases from energy supply and transport. The underestimation of the total economic potential from these emissions is of the order of 10-15%.
Energy supply
0
1
2
3
4
5
6
7
<20 <50<10
0<20 <50
<100
<20 <50<10
0<2
0<5
0<1
00 <20 <50<10
0<20 <50
<100
<20<50
<100
GtCO2-eq/yr
Transport Buildings Industry Agriculture Forestry Waste
Non-OECD/EITEITOECDWorld total
US$/tCO2-eq
19 See Chapter 3 for the definition of Category III and IV pathways.
80
Technical Summary
higher CO2 reductions to achieve the targets require higher carbon prices and most report higher GDP costs. For category I and II studies (stabilization between 445 and 535 ppm CO2-eq) costs are less than 3% GDP loss, but the number of studies is relatively small and they generally use low baselines. The lower estimates of the studies assessed here, compared with the full set of studies reported in Chapter 3, are caused mainly by a larger share of studies that allow for enhanced technological innovation triggered by policies, particularly for more stringent mitigation scenarios (high agreement, medium evidence) [11.4].
All approaches indicate that no single sector or technology will be able to address the mitigation challenge successfully on its own, suggesting the need for a diversified portfolio based on a variety of criteria. Top-down assessments agree with the bottom-up results in suggesting that carbon prices around 20-50 US$/tCO2-eq (73-183 US$/tC-eq) are sufficient to drive large-scale fuel-switching and make both CCS and low-carbon power sources economic as technologies mature. Incentives of this order might also play an important role in avoiding deforestation. The various short- and long-term models come up with differing estimates, the variation of which can be explained mainly by approaches and assumptions regarding the use of revenues from carbon taxes or permits, treatment of technological change, degree of substitutability between internationally traded products, and the disaggregation of product and regional markets (high agreement, much evidence) [11.4, 11.5, 11.6].
The development of the carbon price and the corresponding emission reductions will determine the level at which atmospheric GHG concentrations can be stabilized. Models suggest that a predictable and ongoing gradual increase in the carbon price that would reach 20–50 $US/tCO2-eq by 2020–2030 corresponds with Category III stabilization (550 ppm CO2-eq). For Category IV (650 ppm CO2-eq), such a price level could be reached after 2030. For stabilization at levels between 450 and 550 ppm CO2-eq, carbon prices of up to 100 US$/tCO2-eq need to be reached by around 2030 (medium agreement, medium evidence) [11.4, 11.5, 11.6].
In all cases, short-term pathways towards lower stabilization levels, particularly for Category III and below, would require many additional measures around energy efficiency, low-carbon energy supply, other mitigation actions and avoidance of investment in very long-lived carbon-intensive capital stock. Studies of decision-making under uncertainty emphasize the need for stronger early action, particularly on long-lived infrastructure and other capital stock. Energy sector infrastructure (including power stations) alone is projected to require at least US$ 20 trillion investment to 2030 and the options for stabilization will be heavily constrained by the nature and carbon intensity of this investment. Initial estimates for lower carbon scenarios show a large redirection of investment, with net additional investments ranging from negligible to less than 5% (high agreement, much evidence) [11.6].
As regards portfolio analysis of government actions, a general finding is that a portfolio of options that attempts to balance emission reductions across sectors in a manner that appears equitable (e.g., by equal percentage reduction), is likely to be more costly than an approach primarily guided by cost-effectiveness. Portfolios of energy options across sectors that include low-carbon technologies will reduce risks and costs, because fossil fuel prices are expected to be more volatile relative to the costs of alternatives, in addition to the usual benefits from diversification. A second general finding is that costs will be reduced if options that correct the two market failures of climate change damages and technological innovation benefits are combined, for example, by recycling revenues from permit auctions to support energy-efficiency and low-carbon innovations (high agreement, medium evidence) [11.4].
Technological change across sectors
A major development since the TAR has been the inclusion in many top-down models of endogenous technological change. Using different approaches, modelling studies suggest that allowing for endogenous technological change may lead to substantial reductions in carbon prices as well as GDP costs, compared with most of the models in use at the time of the TAR (when technological change was assumed to be included in the baseline and largely independent of mitigation policies and action). Studies without induced technological change show that carbon prices rising to 20 to 80 US$/tCO2-eq by 2030 and 30 to 155 US$/tCO2-eq by 2050 are consistent with stabilization at around 550 ppm CO2-eq by 2100. For the same stabilization level, studies since TAR that take into account induced technological change lower these price ranges to 5 to 65 US$/tCO2eq in 2030 and 15 to 130 US$/tCO2-eq in 2050. The degree to which costs are reduced hinges critically on the assumptions about the returns from climate change mitigation R&D expenditures, spill-overs between sectors and regions, crowding-out of other R&D, and, in models including learning-by-doing, learning rates (high agreement, much evidence) [11.5].
Major technological shifts like carbon capture and storage, advanced renewables, advanced nuclear and hydrogen require a long transition as learning-by-doing accumulates and markets expand. Improvement of end-use efficiency therefore offers more important opportunities in the short term. This is illustrated by the relatively high share of the buildings and industry sector in the 2030 potentials (Table TS.17). Other options and sectors may play a more significant role in the second half of the century (see Chapter 3) (high agreement, much evidence) [11.6].
Spill-over effects from mitigation in Annex I countries on Non-Annex I countries
Spill-over effects of mitigation from a cross-sectoral perspective are the effects of mitigation policies and measures in one country or group of countries on sectors in other countries. One aspect of spill-over is so-called ‘carbon leakage’:
81
Technical Summary
the increase in CO2 emissions outside the countries taking domestic measures divided by the emission reductions within these countries. The simple indicator of carbon leakage does not cover the complexity and range of effects, which include changes in the pattern and magnitude of global emissions. Modelling studies provide wide-ranging outcomes on carbon leakages depending on their assumptions regarding returns to scale, behaviour in the energy-intensive industry, trade elasticities and other factors. As in the TAR, the estimates of carbon leakage from implementation of the Kyoto Protocol are generally in the range of 5–20% by 2010. Empirical studies on the energy-intensive industries with exemptions under the EU Emission Trading Scheme (ETS) highlight that transport costs, local market conditions, product variety and incomplete information favour local production, and conclude that carbon leakage is unlikely to be substantial (medium agreement, medium evidence) [11.7].
Effects of existing mitigation actions on competitiveness have been studied. The empirical evidence seems to indicate that losses of competitiveness in countries implementing Kyoto are not significant, confirming a finding in the TAR. The potential beneficial effect of technology transfer to developing countries arising from technological development brought about by Annex I action may be substantial for energy-intensive industries, but has not so far been quantified in a reliable manner (medium agreement, low evidence) [11.7].
Perhaps one of the most important ways in which spill-overs from mitigation actions in one region affect others is through the effect on world fossil fuel prices. When a region reduces its fossil fuel demand because of mitigation policy, it will reduce the world demand for that commodity and so put downward pressure on the prices. Depending on the response of the fossil fuel producers, oil, gas or coal prices may fall, leading to loss of revenues by the producers, and lower costs of imports for the consumers. As in the TAR, nearly all modelling studies that have been reviewed show more pronounced adverse effects on oil-producing countries than on most Annex I countries that are taking the abatement measures. Oil-price protection strategies may limit income losses in the oil-producing countries (high agreement, limited evidence) [11.7].
Co-benefits of mitigation
Many recent studies have demonstrated significant benefits of carbon-mitigation strategies on human health, mainly because they also reduce other airborne emissions, for example, SO2, NOx and particulate matter. This is projected to result in the prevention of tens of thousands of premature deaths in Asian and Latin American countries annually, and several thousands in Europe. However, monetization of mortality risks remains controversial, and hence a large range of benefit estimates can be found in the literature. However, all studies agree that the monetized health benefits may offset a substantial fraction of the mitigation costs (high agreement, much evidence) [11.8].
In addition, the benefits of avoided emissions of air pollutants have been estimated for agricultural production and the impact of acid precipitation on natural ecosystems. Such near-term benefits provide the basis for a no-regrets GHG-reduction policy, in which substantial advantages accrue even if the impact of human-induced climate change turns out to be less than current projections show. Including co-benefits other than those for human health and agricultural productivity (e.g., increased energy security and employment) would further enhance the cost savings (high agreement, limited evidence) [11.8].
A wealth of new literature has pointed out that addressing climate change and air pollution simultaneously through a single set of measures and policies offers potentially large reductions in the costs of air-pollution control. An integrated approach is needed to address those pollutants and processes for which trade-offs exist. This is, for instance, the case for NOx controls for vehicles and nitric acid plants, which may increase N2O emissions, or the increased use of energy-efficient diesel vehicles, which emit relatively more fine particulate matter than their gasoline equivalents (high agreement, much evidence) [11.8].
Adaptation and mitigation
There can be synergies or trade-offs between policy options that can support adaptation and mitigation. The synergy potential is high for biomass energy options, land-use management and other land-management approaches. Synergies between mitigation and adaptation could provide a unique contribution to rural development, particularly in least-developed countries: many actions focusing on sustainable natural resource management could provide both significant adaptation benefits and mitigation benefits, mostly in the form of carbon sequestration. However, in other cases there may be trade-offs, such as the growth of energy crops that may affect food supply and forestry cover, thereby increasing vulnerability to the impacts of climate change (medium agreement, limited evidence) [11.9].
12 Sustainable development and mitigation
Relationship between sustainable development and climate change mitigation
The concept of sustainable development was adopted by the World Commission on Environment and Development and there is agreement that sustainable development involves a comprehensive and integrated approach to economic, social and environmental processes. Discussions on sustainable development, however, have focused primarily on the environmental and economic dimensions. The importance of social, political and cultural factors is only now getting more recognition. Integration is essential in order to articulate
82
Technical Summary
development trajectories that are sustainable, including addressing the climate change problem [12.1].
Although still in the early stages, there is growing use of indicators to measure and manage the sustainability of development at the macro and sectoral levels, which is driven in part by the increasing emphasis on accountability in the context of governance and strategy initiatives. At the sectoral level, progress towards sustainable development is beginning to be measured and reported by industry and governments using, inter alia, green certification, monitoring tools or emissions registries. Review of the indicators shows, however, that few macro-indicators include measures of progress with respect to climate change (high agreement, much evidence) [12.1.3].
Climate change is influenced not only by the climate-specific policies that are put in place (the ‘climate first approach’), but also by the mix of development choices that are made and the development trajectories that these policies lead to (the ‘develop-ment first approach’) - a point reinforced by global scenario analysis published since the TAR. Making development more sustainable by changing development paths can thus make a significant contribution to climate goals. It is important to note, however, that changing development pathways is not about choosing a mapped-out path, but rather about navigating through an uncharted and evolving landscape (high agreement, much evidence) [12.1.1].
It has further been argued that sustainable development might decrease the vulnerability of all countries, and particularly of developing countries, to climate change impacts. Framing the debate as a development problem rather than an environmental one may better address the immediate goals of all countries, particularly developing countries and their special vulnerability to climate change, while at the same time addressing the driving forces for emissions that are linked to the underlying development path [12.1.2].
Making development more sustainable
Decision-making on sustainable development and climate change mitigation is no longer solely the purview of governments. The literature recognizes the shift to a more inclusive concept of governance, which includes the contributions of various levels of government, the private sector, non-governmental actors and civil society. The more that climate change issues are mainstreamed as part of the planning perspective at the appropriate level of implementation, and the more all these relevant parties are involved in the decision-making process in a meaningful way, the more likely are they to achieve the desired goals (high agreement, medium evidence) [12.2.1].
Regarding governments, a substantial body of political theory identifies and explains the existence of national policy styles or political cultures. The underlying assumption of this work is that individual countries tend to process problems in a specific manner, regardless of the distinctiveness or
specific features of any specific problem; a national ‘way of doing things’. Furthermore, the choice of policy instruments is affected by the institutional capacity of governments to implement the instrument. This implies that the preferred mix of policy decisions and their effectiveness in terms of sustainable development and climate change mitigation depend strongly on national characteristics (high agreement, much evidence). However, our understanding of which types of policies will work best in countries with particular national characteristics remains sketchy [12.2.3].
The private sector is a central player in ecological and sustainability stewardship. Over the past 25 years, there has been a progressive increase in the number of companies that are taking steps to address sustainability issues at either the firm or industry level. Although there has been progress, the private sector has the capacity to play a much greater role in making development more sustainable if awareness that this will probably benefit its performance grows (medium agreement, medium evidence) [12.2.3].
Citizen groups play a significant role in stimulating sustainable development and are critical actors in implementing sustainable development policy. Apart from implementing sustainable development projects themselves, they can push for policy reform by awareness-raising, advocacy and agitation. They can also pull policy action by filling the gaps and providing policy services, including in the areas of policy innovation, monitoring and research. Interactions can take the form of partnerships or be through stakeholder dialogues that can provide citizens’ groups with a lever for increasing pressure on both governments and industry (high agreement, medium evidence) [12.2.3].
Deliberative public-private partnerships work most effectively when investors, local governments and citizen groups are willing to work together to implement new technologies, and provide arenas to discuss such technologies that are locally inclusive (high agreement, medium evidence) [12.2.3].
Implications of development choices for climate change mitigation
In a heterogeneous world, an understanding of different regional conditions and priorities is essential for mainstreaming climate change policies into sustainable-development strategies. Region- and country-specific case studies demonstrate that different development paths and policies can achieve notable emissions reductions, depending on the capacity to realize sustainability and climate change objectives [12.3].
In industrialized countries, climate change continues to be regarded mainly as a separate, environmental problem to be addressed through specific climate change policies. A fundamental and broad discussion in society on the implications of development pathways for climate change in general and climate change mitigation in particular in the industrialized
83
Technical Summary
countries has not been seriously initiated. Priority mitigation areas for countries in this group may be in energy efficiency, renewable energy, CCS, etc. However, low-emission pathways apply not only to energy choices. In some regions, land-use development, particularly infrastructure expansion, is identified as a key variable determining future GHG emissions [12.2.1; 12.3.1].
Economies in transition as a single group no longer exist. Nevertheless, Central and Eastern Europe and the countries of Eastern Europe, the Caucasus and Central Asia (EECCA) do share some common features in socio-economic development and in climate change mitigation and sustainable development. Measures to decouple economic and emission growth would be especially important for this group [12.2.1; 12.3.1].
Some large developing countries are projected to increase their emissions at a faster rate than the industrialized world and the rest of developing nations as they are in the stage of rapid industrialization. For these countries, climate change mitigation and sustainable-development policies can complement one another; however, additional financial and technological resources would enhance their capacity to pursue a low-carbon path of development [12.2.1; 12.3.1].
For most other developing countries, adaptive and mitigative capacities are low and development aid can help to reduce their vulnerability to climate change. It can also help to reduce their emissions growth while addressing energy-security and energy-access problems. CDM can provide financial resources for such developments. Members of the Organization of the Petroleum-Exporting Countries (OPEC) are unique in the sense that they may be adversely affected by development paths that reduce the demand for fossil fuels. Diversification of their economies is high on their agenda [12.2.1; 12.3.1].
Some general conclusions emerge from the case studies reviewed in this chapter on how changes in development pathways at the sectoral level have (or could) lower emissions (high agreement, medium evidence) [12.2.4]:• GHG emissions are influenced by, but not rigidly linked to,
economic growth: policy choices can make a difference.• Sectors where effective production is far below the maximum
feasible production with the same amount of inputs – that is, sectors that are far from their production frontier – have opportunities to adopt ‘win-win-win’ policies, that is, policies that free up resources and bolster growth, meet other sustainable-development goals and also reduce GHG emissions relative to baseline.
• Sectors where production is close to the optimal given available inputs – i.e., sectors that are closer to the production frontier – also have opportunities to reduce emissions by meeting other sustainable development goals. However, the closer one gets to the production frontier, the more trade-offs are likely to appear.
• What matters is not only that a ‘good’ choice is made at a certain point in time, but also that the initial policy is sustained for a long time – sometimes several decades – to really have effects.
• It is often not one policy decision, but an array of decisions that are needed to influence emissions. This raises the issue of coordination between policies in several sectors and at various scales.
Mainstreaming requires that non-climate policies, programmes and/or individual actions take climate change mitigation into consideration, in both developing and developed countries. However, merely piggybacking climate change on to an existing political agenda is unlikely to succeed. The ease or difficulty with which mainstreaming is accomplished will depend on both mitigation technologies or practices, and the underlying development path. Weighing other development benefits against climate benefits will be a key basis for choosing development sectors for mainstreaming. Decisions about macro-economic policy, agricultural policy, multilateral development bank lending, insurance practices, electricity market reform, energy security, and forest conservation, for example, which are often treated as being apart from climate policy, can have profound impacts on emissions, the extent of mitigation required, and the costs and benefits that result. However, in some cases, such as shifting from biomass cooking to liquid petroleum gas (LPG) in rural areas in developing countries, it may be rational to disregard climate change considerations because of the small increase in emissions when compared with its development benefits (see Table TS.18) (high agreement, medium evidence) [12.2.4].
In general terms, there is a high level of agreement on the qualitative findings in this chapter about the linkages between mitigation and sustainable development: the two are linked, and synergies and trade-offs can be identified. However, the literature about the links and more particularly, about how these links can be put into action in order to capture synergies and avoid trade-offs, is as yet sparse. The same applies to good practice guidance for integrating climate change considerations into relevant non-climate policies, including analysis of the roles of different actors. Elaborating possible development paths that nations and regions can pursue – beyond more narrowly conceived GHG emissions scenarios or scenarios that ignore climate change – can provide the context for new analysis of the links, but may require new methodological tools (high agreement, limited evidence) [12.2.4].
Implications of mitigation choices for sustainable development trajectories
There is a growing understanding of the opportunities to choose mitigation options and their implementation in such a way that there will be no conflict with or even benefits for other dimensions of sustainable development; or, where trade-offs are inevitable, to allow rational choices to be made. A summary of
84
Technical Summary
Selected sectors
Non-climate policy instruments and actions that are candidates for mainstreaming
Primary decision- makers and actors
Global GHG emissions by sector that could be addressed by non-climate policies (% of global GHG emissions)a, d Comments
Macro economy Implement non-climate taxes/ subsidies and/or other fiscal and regulatory policies that promote SD
State (governments at all levels)
100 Total global GHG emissions
Combination of economic, regulatory, and infrastructure non-climate policies could be used to address total global emissions.
Forestry Adoption of forest conservation and sustainable management practices
State (governments at all levels) and civil society (NGOs)
7 GHG emissions from deforestation
Legislation/regulations to halt deforestation, improve forest management, and provide alternative livelihoods can reduce GHG emissions and provide other environmental benefits.
Electricity Adoption of cost-effective renewables, demand-side management programmes, and reduction of transmission and distribution losses
State (regulatory commissions), market (utility companies) and, civil society (NGOs, consumer groups)
20b Electricity sector CO2 emissions (excluding auto producers)
Rising share of GHG-intensive electricity generation is a global concern that can be addressed through non-climate policies.
Petroleum imports
Diversifying imported and domestic fuel mix and reducing economy’s energy intensity to improve energy security
State and market (fossil fuel industry)
20b CO2 emissions associated with global crude oil and product imports
Diversification of energy sources to address oil security concerns could be achieved such that GHG emissions are not increased.
Rural energy in developing countries
Policies to promote rural LPG, kerosene and electricity for cooking
State and market (utilities and petroleum companies), civil society (NGOs)
<2c GHG emissions from biomass fuel use, not including aerosols
Biomass used for rural cooking causes health impacts due to indoor air pollution, and releases aerosols that add to global warming. Displacing all biomass used for rural cooking in developing countries with LPG would emit 0.70 GtCO2-eq., a relatively modest amount compared with 2004 total global GHG emissions.
Insurance for building and transport sectors
Differentiated premiums, liability insurance exclusions, improved terms for green products
State and market (insurance companies)
20 Transport and building sector GHG emissions
Escalating damages due to climate change are a source of concern to insurance industry. Insurance industry could address these through the types of policies noted here.
International finance
Country and sector strategies and project lending that reduces emissions
State (international) financial institutions) and market (commercial banks)
25b CO2 emissions from developing countries (non-Annex I)
International financial institutions can adopt practices so that loans for GHG-intensive projects in developing countries that lock-in future emissions are avoided.
Notes: a) Data from Chapter 1 unless noted otherwise. b) CO2 emissions from fossil fuel combustion only; IEA (2006). c) CO2 emissions only. Authors estimate, see text.d) Emissions indicate the relative importance of sectors in 2004. Sectoral emissions are not mutually exclusive, may overlap, and hence sum up to more than total
global emissions, which are shown in the Macro economy row.
Table TS.18: Mainstreaming climate change into development choices – selected examples [Table 12.3].
85
Technical Summary
Sector and mitigation options
Potential SD synergies and conditions for implementation Potential SD trade-offs
Energy supply and use: Chapters 4-7
Energy efficiency improvement in all sectors (buildings, transportation, industry, and energy supply) (Chapters 4-7)
- Almost always cost-effective, reduces or eliminates local pollutant emissions and consequent health impacts, improves indoor comfort and reduces indoor noise levels, creates business opportunities and jobs and improves energy security
- Government and industry programmes can help overcome lack of information and principal agent problems
- Programmes can be implemented at all levels of government and industry
- Important to ensure that low-income household energy needs are given due consideration, and that the process and consequences of implementing mitigation options are, or the result is, gender-neutral
- Indoor air pollution and health impacts of improving the thermal efficiency of biomass cooking stoves in developing country rural areas are uncertain
Fuel switching and other options in the transportation and buildings sectors (Chapters 5 and 6)
- CO2 reduction costs may be offset by increased health benefits
- Promotion of public transport and non-motorized transport has large and consistent social benefits
- Switching from solid fuels to modern fuels for cooking and heating indoors can reduce indoor air pollution and increase free time for women in developing countries
- Institutionalizing planning systems for CO2 reduction through coordination between national and local governments is important for drawing up common strategies for sustainable transportation systems
- Diesel engines are generally more fuel-efficient than gasoline engines and thus have lower CO2 emissions, but increase particle emissions.
- Other measures (CNG buses, hybrid diesel-electric buses and taxi renovation) may provide little climate benefit.
Replacing imported fossil fuels with domestic alternative energy sources (DAES) (Chapter 4)
- Important to ensure that DAES is cost-effective- Reduces local air pollutant emissions. - Can create new indigenous industries (e.g., Brazil ethanol
programme) and hence generate employment
- Balance of trade improvement is traded off against increased capital required for investment
- Fossil fuel-exporting countries may face reduced exports
- Hydropower plants may displace local populations and cause environmental damage to water bodies and biodiversity
Replacing domestic fossil fuel with imported alternative energy sources (IAES) (Chapter 4)
- Almost always reduces local pollutant emissions- Implementation may be more rapid than DAES- Important to ensure that IAES is cost-effective - Economies and societies of energy-exporting countries
would benefit
- Could reduce energy security- Balance of trade may worsen but capital needs
may decline
Forestry sector: Chapter 9
Afforestation - Can reduce wasteland, arrest soil degradation, and manage water runoff
- Can retain soil carbon stocks if soil disturbance at planting and harvesting is minimized
- Can be implemented as agroforestry plantations that enhance food production
- Can generate rural employment and create rural industry- Clear delineation of property rights would expedite
implementation of forestation programmes
- Use of scarce land could compete with agricultural land and diminish food security while increasing food costs
- Monoculture plantations can reduce biodiversity and are more vulnerable to disease
- Conversion of floodplain and wetland could hamper ecological functions
Avoided deforestation - Can retain biodiversity, water and soil management benefits, and local rainfall patterns
- Reduce local haze and air pollution from forest fires- If suitably managed, it can bring revenue from ecotourism
and from sustainably harvested timber sales- Successful implementation requires involving local
dwellers in land management and/or providing them alternative livelihoods, enforcing laws to prevent migrants from encroaching on forest land.
- Can result in loss of economic welfare for certain stakeholders in forest exploitation (land owners, migrant workers)
- Reduced timber supply may lead to reduced timber exports and increased use of GHG-intensive construction materials
- Can result in deforestation with consequent SD implications elsewhere
Forest Management - See afforestation - Fertilizer application can increase N2O production and nitrate runoff degrading local (ground)water quality
- Prevention of fires and pests has short term benefits but can increase fuel stock for later fires unless managed properly
Table TS.19: Sectoral mitigation options and sustainable development (economic, local environmental and social) considerations: synergies and trade-offs [Table 12.4].
86
Technical Summary
Sector and mitigation options
Potential SD synergies and conditions for implementation Potential SD trade-offs
Bio-energy (chapter 8 en 9)
Bio-energy production - Mostly positive when practised with crop residues (shells, husks, bagasse and/or tree trimmings).
- Creates rural employment.- Planting crops/trees exclusively for bio-energy
requires that adequate agricultural land and labour is available to avoid competition with food production
- Can have negative environmental consequences if practised unsustainably - biodiversity loss, water resource competition, increased use of fertilizer and pesticides.
- Potential problem with food security (location-specific) and increased food costs.
Agriculture: Chapter 8
Cropland management (management of nutrients, tillage, residues, and agroforestry; water, rice, and set-aside)
- Improved nutrient management can improve groundwater quality and environmental health of the cultivated ecosystem
- Changes in water policies could lead to clash of interests and threaten social cohesiveness
- Could lead to water overuse
Grazing land management - Improves livestock productivity, reduces desertification, and provide social security for the poor
- Requires laws and enforcement to ban free grazing
Livestock management - Mix of traditional rice cultivation and livestock management would enhance incomes even in semi-arid and arid regions
Waste management: Chapter 10
Engineered sanitary landfilling with landfill gas recovery to capture methane gas
- Can eliminate uncontrolled dumping and open burning of waste, improving health and safety for workers and residents.
- Sites can provide local energy benefits and public spaces for recreation and other social purposes within the urban infrastructure.
- When done unsustainably can cause leaching that leads to soil and groundwater contamination with potentially negative health impacts
Biological processes for waste and wastewater (composting, anaerobic digestion, aerobic and anaerobic wastewater processes)
- Can destroy pathogens and provide useful soil amendments if properly implemented using source-separated organic waste or collected wastewater.
- Can generate employment- Anaerobic processes can provide energy benefits
from CH4 recovery and use.
- A source of odours and water pollution if not properly controlled and monitored.
Incineration and other thermal processes
- Obtain the most energy benefit from waste.
- Expensive relative to controlled landfilling and composting.
- Unsustainable in developing countries if technical infrastructure not present.
- Additional investment for air pollution controls and source separation needed to prevent emissions of heavy metals and other air toxics.
Recycling, re-use, and waste minimization
- Provide local employment as well as reductions in energy and raw materials for recycled products.
- Can be aided by NGO efforts, private capital for recycling industries, enforcement of environmental regulations, and urban planning to segregate waste treatment and disposal activities from community life.
- Uncontrolled waste scavenging results in severe health and safety problems for those who make their living from waste
- Development of local recycling industries requires capital.
Table TS.19. Continued.
Note: Material in this table is drawn from the Chapters 4–11. Where new material is introduced, it is referenced in the accompanying text below, which describes the SD implications of mitigation options in each sector.
87
Technical Summary
the sustainable development implications of the main climate change mitigation options is given in Table TS.19 [12.3].
The sustainable development benefits of mitigation options vary within a sector and between regions (high agreement, much evidence): • Generally, mitigation options that improve the productivity
of resource use, whether energy, water, or land, yield positive benefits across all three dimensions of sustainable development. Other categories of mitigation options have a more uncertain impact and depend on the wider socio-economic context within which the option is being implemented.
• Climate-related policies such as energy efficiency and renewable energy are often economically beneficial, improve energy security and reduce local pollutant emissions. Many energy-supply mitigation options can be designed to also achieve sustainable development benefits such as avoided displacement of local populations, job creation and health benefits.
• Reducing deforestation can have significant biodiversity, soil and water conservation benefits, but may result in a loss of economic welfare for some stakeholders. Appropriately designed forestation and bio-energy plantations can lead to restoration of degraded land, manage water runoff, retain soil carbon and benefit rural economies, but may compete with land for food production and be negative for biodiversity.
• There are good possibilities for reinforcing sustainable development through mitigation actions in most sectors, but particularly in the waste management, transportation and buildings sectors, notably through decreased energy use and reduced pollution [12.3].
13 Policies, instruments and co-operative agreements
Introduction
This chapter discusses national policy instruments and their implementation, initiatives of the private sector, local governments and non-governmental organizations, and cooperative international agreements. Wherever feasible, national policies and international agreements are discussed in the context of four principle criteria by which they can be evaluated; that is, environmental effectiveness, cost-effectiveness, distributional considerations and institu- tional feasibility. There are a number of additional criteria that could also be explicitly considered, such as effects on competitiveness and administrative costs. Criteria may be applied by governments in making ex-ante choices among instruments and in ex-post evaluation of the performance of instruments [13.1].
National policy instruments, their implementation and interactions
The literature continues to reflect that a wide variety of national policies and measures are available to governments to limit or reduce GHG emissions. These include: regulations and standards, taxes and charges, tradable permits, voluntary agreements, phasing out subsidies and providing financial incentives, research and development and information instruments. Other policies, such as those affecting trade, foreign direct investments and social development goals can also affect GHG emissions. In general, climate change policies, if integrated with other government polices, can contribute to sustainable development in both developed and developing countries (see Chapter 12) [13.1].
Reducing emissions across all sectors and gases requires a portfolio of policies tailored to fit specific national circumstances. While the literature identifies advantages and disadvantages for any given instrument, the above-mentioned criteria are widely used by policy makers to select and evaluate policies.
All instruments can be designed well or poorly, stringent or lax. Instruments need to be adjusted over time and supplemented with a workable system of monitoring and enforcement. Furthermore, instruments may interact with existing institutions and regulations in other sectors of society (high agreement, much evidence) [13.1].
The literature provides a good deal of information to assess how well different instruments meet the above-mentioned criteria (see Table TS.20) [13.2]. Most notably, it suggests that:
• Regulatory measures and standards generally provide
environmental certainty. They may be preferable when lack of information or other barriers prevent firms and consumers from responding to price signals. Regulatory standards do not generally give polluters incentives to develop new technologies to reduce pollution, but there are a few examples whereby technology innovation has been spurred by regulatory standards. Standards are common practice in the building sector and there is strong innovation. Although relatively few regulatory standards have been adopted solely to reduce GHG emissions, standards have reduced these gases as a co-benefit (high agreement, much evidence) [13.2].
• Taxes and charges (which can be applied to carbon or all GHGs) are given high marks for cost effectiveness since they provide some assurance regarding the marginal cost of pollution control. They cannot guarantee a particular level of emissions, but conceptually taxes can be designed to be environmentally effective. Taxes can be politically difficult to implement and adjust. As with regulations, their environmental effectiveness depends on their stringency. As with nearly all other policy instruments, care is needed to prevent perverse effects (high agreement, much evidence) [13.2].
88
Technical Summary
• Tradable permits are an increasingly popular economic instrument to control conventional pollutants and GHGs at the sectoral, national and international level. The volume of emissions allowed determines the carbon price and the environmental effectiveness of this instrument, while the distribution of allowances has implications for competitiveness. Experience has shown that banking provisions can provide significant temporal flexibility and that compliance provisions must be carefully designed, if a permit system is to be effective (high agreement, much evidence). Uncertainty in the price of emission reductions under a trading system makes it difficult, a priori, to estimate the total cost of meeting reduction targets [13.2].
• Voluntary agreements between industry and governments and information campaigns are politically attractive, raise awareness among stakeholders and have played a role in the evolution of many national policies. The majority of voluntary agreements has not achieved significant emission reductions beyond business-as-usual. However, some
recent agreements in a few countries have accelerated the application of best available technology and led to measurable reductions of emissions compared with the baseline (high agreement, much evidence). Success factors include clear targets, a baseline scenario, third-party involvement in design and review, and formal provisions for monitoring [13.2].
• Voluntary actions: Corporations, sub-national governments, NGOs and civil groups are adopting a wide variety of voluntary actions, independent of government authorities, which may limit GHG emissions, stimulate innovative policies and encourage the deployment of new technologies. By themselves, they generally have limited impact at the national or regional level [13.2].
• Financial incentives (subsidies and tax credits) are frequently used by governments to stimulate the diffusion of new, less GHG-emitting technologies. While the economic costs of such programmes are often higher than for the instruments listed above, they are often critical to overcome barriers to the penetration of new technologies (high agreement, much
Emission levels set directly, though subject to exceptionsDepends on deferrals and compliance
Depends on design; uniform application often leads to higher overall compliance costs
Depends on level playing field; small/new actors may be disadvantaged
Depends on technical capacity; popular with regulators, in countries with weak functioning markets
Taxes and charges
Depends on ability to set tax at a level that induces behavioural change
Better with broad application; higher administrative costs where institutions are weak
Regressive; can be improved with revenue recycling
Often politically unpopular; may be difficult to enforce with underdeveloped institutions
Tradable permits
Depends on emissions cap, participation and compliance
Decreases with limited participation and fewer sectors
Depends on initial permit allocation, may pose difficulties for small emitters
Requires well-functioning markets and complementary institutions
Voluntary agreements
Depends on programme design, including clear targets, a baseline scenario, third-party involvement in design and review, and monitoring provisions
Depends on flexibility and extent of government incentives, rewards and penalties
Benefits accrue only to participants
Often politically popular; requires significant number of administrative staff
Subsidies and other incentives
Depends on programme design; less certain than regulations/ standards.
Depends on level and programme design; can be market-distorting
Benefits selected participants; possibly some that do not need it
Popular with recipients; potential resistance from vested interests. Can be difficult to phase out
Research and development
Depends on consistent funding, when technologies are developed, and polices for diffusion. May have high benefits in long-term
Depends on programme design and the degree of risk
Initially benefits selected participants, Potentially easy for funds to be misallocated
Requires many separate decisions; Depends on research capacity and long-term funding
Note: Evaluations are predicated on assumptions that instruments are representative of best practice rather than theoretically perfect. This assessment is based primarily on experiences and literature from developed countries, since peer-reviewed articles on the effectiveness of instruments in other countries were limited. Applicability in specific countries, sectors and circumstances – particularly developing countries and economies in transition – may differ greatly. Environmental and cost effectiveness may be enhanced when instruments are strategically combined and adapted to local circumstances.
Table TS.20: National environmental policy instruments and evaluative criteria [Table 13.1].
89
Technical Summary
evidence). As with other policies, incentive programmes must be carefully designed to avoid perverse market effects. Direct and indirect subsidies for fossil fuel use and agriculture remain common practice in many countries, although those for coal have declined over the past decade in many OECD countries and in some developing countries (See also Chapter 2, 7 and 11) [13.2].
• Government support for research and development is a special type of incentive, which can be an important instrument to ensure that low GHG-emitting technologies will be available in the long-term. However, government funding for many energy-research programmes dropped after the oil crisis in the 1970s and stayed constant, even after the UNFCCC was ratified. Substantial additional investments in, and policies for, R&D are needed to ensure that technologies are ready for commercialization in order to arrive at stabilization of GHGs in the atmosphere (see Chapter 3), along with economic and regulatory instruments to promote their deployment and diffusion (high agreement, much evidence) [13.2.1].
• Information instruments – sometimes called public disclosure requirements – may positively affect environmental quality by allowing consumers to make better-informed choices. There is only limited evidence that the provision of information can achieve emissions reductions, but it can improve the effectiveness of other policies (high agreement, much evidence) [13.2].
Applying an environmentally effective and economically efficient instrument mix requires a good understanding of the environmental issue to be addressed, of the links with other policy areas and the interactions between the different instruments in the mix. In practice, climate-related policies are seldom applied in complete isolation, as they overlap with other national polices relating to the environment, forestry, agriculture, waste management, transport and energy, and in many cases require more than one instrument (high agreement, much evidence) [13.2].
Initiatives of sub-national governments, corporations and non-governmental organizations
The preponderance of the literature reviews nationally based governmental instruments, but corporations, local- and regional authorities, NGOs and civil groups can also play a key role and are adopting a wide variety of actions, independent of government authorities, to reduce emissions of GHGs. Corporate actions range from voluntary initiatives to emissions targets and, in a few cases, internal trading systems. The reasons corporations undertake independent actions include the desire to influence or pre-empt government action, to create financial value, and to differentiate a company and its products. Actions by regional, state, provincial and local governments include renewable portfolio standards, energy-efficiency programmes, emission registries and sectoral cap-and-trade mechanisms. These actions are undertaken to influence national policies, address stakeholder concerns, create incentives for new industries, or
create environmental co-benefits. NGOs promote programmes to reduce emissions through public advocacy, litigation and stakeholder dialogue. Many of the above actions may limit GHG emissions, stimulate innovative policies, encourage the deployment of new technologies and spur experimentation with new institutions, but by themselves generally have limited impact. To achieve significant emission reductions, these actions must lead to changes in national policies (high agreement, much evidence) [13.4].
International agreements (climate change agreements and other arrangements)
The UNFCCC and its Kyoto Protocol have set a significant precedent as a means of solving a long-term international environmental problem, but are only the first steps towards implementation of an international response strategy to combat climate change. The Kyoto Protocol’s most notable achievements are the stimulation of an array of national policies, the creation of an international carbon market and the establishment of new institutional mechanisms. Its economic impacts on the participating countries are yet to be demonstrated. The CDM, in particular, has created a large project pipeline and mobilized substantial financial resources, but it has faced methodological challenges regarding the determination of baselines and additionality. The protocol has also stimulated the development of emissions trading systems, but a fully global system has not been implemented. The Kyoto Protocol is currently constrained by the modest emission limits and will have a limited effect on atmospheric concentrations. It would be more effective if the first commitment period were to be followed up by measures to achieve deeper reductions and the implementation of policy instruments covering a higher share of global emissions (high agreement, much evidence) [13.3].
Many options are identified in the literature for achieving emission reductions both under and outside the Convention and its Kyoto Protocol, for example: revising the form and stringency of emission targets; expanding the scope of sectoral and sub-national agreements; developing and adopting common policies; enhancing international RD&D technology programmes; implementing development-oriented actions, and expanding financing instruments (high agreement, much evidence). Integrating diverse elements such as international R&D cooperation and cap-and-trade programmes within an agreement is possible, but comparing the efforts made by different countries would be complex and resource-intensive (medium agreement, medium evidence) [13.3].
There is a broad consensus in the literature that a successful agreement will have to be environmentally effective, cost-effective, incorporate distributional considerations and equity, and be institutionally feasible (high agreement, much evidence) [13.3].
90
Technical Summary
A great deal of new literature is available on potential structures for and the substance of future international agreements. As has been noted in previous IPCC reports, because climate change is a globally common problem, any approach that does not include a larger share of global emissions will be more costly or less environmentally effective. (high agreement, much evidence) (See Chapter 3) [13.3].
Most proposals for future agreements in the literature include a discussion of goals, specific actions, timetables, participation, institutional arrangements, reporting and compliance provisions. Other elements address incentives, non-participation and non-compliance penalties (high agreement, much evidence) [13.3].
GoalsThe specification of clear goals is an important element
of any climate agreement. They can both provide a common vision about the near-term direction and offer longer-term certainty, which is called for by business. Goal-setting also helps structure commitments and institutions, provides an incentive to stimulate action and helps establish criteria against which to measure the success in implementing measures (high agreement, much evidence) [13.3].
The choice of the long-term ambition significantly influences the necessary short-term action and therefore the design of the international regime. Abatement costs depend on the goal, vary with region and depend on the allocation of emission allowances among regions and the level of participation (high agreement, much evidence) [13.3].
Options for the design of international regimes can incorporate goals for the short, medium and long term. One option is to set a goal for long-term GHG concentrations or a temperature stabilization goal. Such a goal might be based on physical impacts to be avoided or conceptually on the basis of the monetary and non-monetary damages to be avoided. An alternative to agreeing on specific CO2 concentration or temperature levels is an agreement on specific long-term actions such as a technology R&D and diffusion target – for example, ‘eliminating carbon emissions from the energy sector by 2060’. An advantage of such a goal is that it might be linked to specific actions (high agreement, much evidence) [13.3].
Another option would be to adopt a ‘hedging strategy’, defined as a shorter-term goal on global emissions, from which it is still possible to reach a range of desirable long-term goals. Once the short-term goal is reached, decisions on next steps can be made in light of new knowledge and decreased levels of uncertainty (medium agreement, medium evidence) [13.3].
ParticipationParticipation of states in international agreements can
vary from very modest to extensive. Actions to be taken by participating countries can be differentiated both in terms of when such action is undertaken, who takes the action and what
the action will be. States participating in the same ‘tier’ would have the same (or broadly similar) types of commitments. Decisions on how to allocate states to tiers can be based on formalized quantitative or qualitative criteria, or be ‘ad hoc’. Under the principle of sovereignty, states may choose the tier into which they are grouped (high agreement, much evidence) [13.3].
An agreement can have static participation or may change over time. In the latter case, states can ‘graduate’ from one tier of commitments to another. Graduation can be linked to passing of quantitative thresholds for certain parameters (or combinations of parameters) that have been predefined in the agreement, such as emissions, cumulative emissions, GDP per capita, relative contribution to temperature increase or other measures of development, such as the human development index (HDI) (high agreement, much evidence) [13.3].
Some argue that an international agreement needs to include only the major emitters to be effective, since the largest 15 countries (including the EU-25 as one) make up 80% of global GHG emissions. Others assert that those with historical responsibility must act first. Still another view holds that technology development is the critical factor for a global solution to climate change, and thus agreements must specifically target technology development in Annex I countries – which in turn could offset some or all emissions leakage in Non-Annex I countries. Others suggest that a climate regime is not exclusively about mitigation, but also encompasses adaptation – and that a far wider array of countries is vulnerable to climate change and must be included in any agreement (high agreement, much evidence) [13.3].
Regime stringency: linking goals, participation and timingUnder most equity interpretations, developed countries as a
group would need to reduce their emissions significantly by 2020 (10–40% below 1990 levels) and to still lower levels by 2050 (40–95% below 1990 levels) for low to medium stabilization levels (450–550ppm CO2-eq) (see also Chapter 3). Under most of the regime designs considered for such stabilization levels, developing-country emissions need to deviate below their projected baseline emissions within the next few decades (high agreement, much evidence). For most countries, the choice of the long-term ambition level will be more important than the design of the emission-reduction regime [13.3].
The total global costs are highly dependent on the baseline scenario, marginal abatement cost estimates, the assumed concentration stabilization level (see also Chapters 3 and 11) and the level (size of the coalition) and degree of participation (how and when allowances are allocated). If, for example some major emitting regions do not participate in the reductions immediately, the global costs of the participating regions will be higher if the goal is maintained (see also Chapter 3). Regional abatement costs are dependent on the allocation of emission allowances to regions, particularly the timing. However, the
91
Technical Summary
assumed stabilization level and baseline scenario are more important in determining regional costs [11.4; 13.3].
Commitments, timetables and actionsThere is a significant body of new literature that identifies
and evaluates a diverse set of options for commitments that could be taken by different groups. The most frequently evaluated type of commitment is the binding absolute emission reduction cap as included in the Kyoto Protocol for Annex I countries. The broad conclusion from the literature is that such regimes provide certainty about future emission levels of the participating countries (assuming caps are met). Many authors propose that caps be reached using a variety of ‘flexibility’ approaches, incorporating multiple GHGs and sectors as well as multiple countries through emission trading and/or project-based mechanisms (high agreement, much evidence) [13.3].
While a variety of authors propose that absolute caps be applied to all countries in the future, many have raised concerns that the rigidity of such an approach may unreasonably restrict economic growth. While no consensus approach has emerged, the literature provides multiple alternatives to address this problem, including ‘dynamic targets’ (where the obligation evolves over time), and limits on prices (capping the costs of compliance at a given level – which while limiting costs, would also lead to exceeding the environmental target). These options aim at maintaining the advantages of international emissions trading while providing more flexibility in compliance (high agreement, much evidence). However, there is a trade-off between costs and certainty in achieving an emissions level. [13.3]
Market mechanismsInternational market-based approaches can offer a cost-
effective means of addressing climate change if they incorporate a broad coverage of countries and sectors. So far, only a few domestic emissions-trading systems are in place, the EU ETS being by far the largest effort to establish such a scheme, with over 11,500 plants allocated and authorized to buy and sell allowances (high agreement, high evidence) [13.2].
Although the Clean Development Mechanism is developing rapidly, the total financial flows for technology transfer have so far been limited. Governments, multilateral organizations and private firms have established nearly 6 billion US$ in carbon funds for carbon-reduction projects, mainly through the CDM. Financial flows to developing countries through CDM projects are reaching levels in the order of several billion US$/yr. This is higher than the flows through the Global Environment Facility (GEF), comparable to the energy-oriented development assistance flows, but at least an order of magnitude lower than all foreign direct investment (FDI) flows (high agreement, much evidence) [13.3].
Many have asserted that a key element of a successful climate change agreement will be its ability to stimulate the
development and transfer of technology – without which it may be difficult to achieve emission reductions on a significant scale. Transfer of technology to developing countries depends mainly on investments. Creating enabling conditions for investments and technology uptake and international technology agreements are important. One mechanism for technology transfer is to establish innovative ways of mobilizing investments to cover the incremental cost of mitigating and adapting to climate change. International technology agreements could strengthen the knowledge infrastructure (high agreement, much evidence) [13.3].
A number of researchers have suggested that sectoral approaches may provide an appropriate framework for post-Kyoto agreements. Under such a system, specified targets could be set, starting with particular sectors or industries that are particularly important, politically easier to address, globally homogeneous or relatively insulated from competition with other sectors. Sectoral agreement may provide an additional degree of policy flexibility and make comparing efforts within a sector between countries easier, but may be less cost-effective, since trading within a single sector will be inherently more costly than trading across all sectors (high agreement, much evidence) [13.3].
Coordination/harmonization of policies Coordinated policies and measures could be an alternative
to or complement internationally agreed targets for emission reductions. A number of policies have been discussed in the literature that would achieve this goal, including taxes (such as carbon or energy taxes); trade coordination/liberalization; R&D; sectoral policies and policies that modify foreign direct investment. Under one proposal, all participating nations – industrialized and developing alike – would tax their domestic carbon usage at a common rate, thereby achieving cost-effectiveness. Others note that while an equal carbon price across countries is economically efficient, it may not be politically feasible in the context of existing tax distortions (high agreement, much evidence) [13.3].
Non-climate policies and links to sustainable developmentThere is considerable interaction between policies and
measures taken at the national and sub-national level with actions taken by the private sector and between climate change mitigation and adaptation policies and policies in other areas. There are a number of non-climate national policies that can have an important influence on GHG emissions (see Chapter 12) (high agreement, much evidence). New research on future international agreements could focus on understanding the inter-linkages between climate policies, non-climate policies and sustainable development, and how to accelerate the adoption of existing technology and policy tools [13.3].
An overview of how various approaches to international climate change agreements, as discussed above, perform against the criteria, given in the introduction, is presented in
92
Technical Summary
Table TS.21. Future international agreements would have stronger support if they meet these criteria (high agreement, much evidence) [13.3].
14 Gaps in knowledge
Gaps in knowledge refer to two aspects of climate change mitigation:• Where additional data collection, modelling and analysis
could narrow knowledge gaps, and the resulting improved knowledge and empirical experience could assist deci-sion-making on climate change mitigation measures and policies; to some extent, these gaps are reflected in the uncertainty statements in this report.
• Where research and development could improve mitiga-tion technologies and/or reduce their costs. This important aspect is not treated in this section, but is addressed in the chapters where relevant.
Emission data sets and projectionsDespite a wide variety of data sources and databases
underlying this report, there are still gaps in accurate and reliable emission data by sector and specific processes, especially with regard to non-CO2 GHGs, organic or black carbon, and CO2 from various sources, such as deforestation, decay of biomass and peat fires. Consistent treatment of non-CO2 GHGs in the methodologies underlying scenarios for future GHG emissions is often lacking [Chapters 1 and 3].
Links between climate change and other policiesA key innovation of this report is the integrated approach
between the assessment of climate change mitigation and wider development choices, such as the impacts of (sustain-able) development policies on GHG-emission levels and vice versa.
However, there is still a lack of empirical evidence on the magnitude and direction of the interdependence and interaction of sustainable development and climate change, of mitigation and adaptation relationships in relation to development aspects,
a) The table examines each approach based on its capacity to meet its internal goals – not in relation to achieving a global environmental goal. If such targets are to be achieved, a combination of instruments needs to be adopted. Not all approaches have equivalent evaluation in the literature; evidence for individual elements of the matrix varies.
National emission targets and international emission trading (including offsets)
Depends on participation, and compliance
Decreases with limited participation and reduced gas and sector coverage
Depends on initial allocation
Depends on capacity to prepare inventories and compliance. Defections weaken regime stability
Sectoral agreements
Not all sectors amenable to such agreements, limiting overall effectiveness. Effectiveness depends on whether agreement is binding or non-binding
Lack of trading across sectors increases overall costs, although may be cost-effective within individual sectors. Competitive concerns reduced within each sector
Depends on participation. Within-sector competitiveness concerns alleviated if treated equally at global level
Requires many separate decisions and technical capacity. Each sector may require cross-country institutions to manage agreements
Coordinated policies and measures
Individual measures can be effective; emission levels may be uncertain; success will be a function of compliance
Depends on policy design
Extent of coordination could limit national flexibility; but may increase equity
Depends on number of countries; (easier among smaller groups of countries than at the global level)
Cooperation on Technology RD & Db
Depends on funding, when technologies are developed and policies for diffusion
Varies with degree of R&D risk Cooperation reduces individual national risk
Intellectual property concerns may negate the benefits of cooperation
Requires many separate decisions. Depends on research capacity and long-term funding
Development-oriented actions
Depends on national policies and design to create synergies
Depends on the extent of synergies with other development objectives
Depends on distributional effects of development policies
Depends on priority given to sustainable development in national policies and goals of national institutions
Financial mechanisms
Depends on funding Depends on country and project type
Depends on project and country selection criteria
Depends on national institutions
Capacity building Varies over time and depends on critical mass
Depends on programme design
Depends on selection of recipient group
Depends on country and institutional frameworks
Table TS.21: Assessment of international agreements on climate changea [Table 13.3].
93
Technical Summary
20 Carbon leakage is an aspect of spill-overs and is the increase in CO2 emissions outside countries taking domestic measures divided by the emission reductions in these countries.
and the equity implications of both. The literature on the linkages between mitigation and sustainable development and, more particularly, on how to capture synergies and minimize trade-offs, taking into account state, market and civil society’s role, is still sparse. New research is required into the linkages between climate change and national and local policies (including but not limited to energy security, water, health, air pollution, forestry, agriculture) that might lead to politically feasible, economically attractive and environmentally beneficial outcomes. It would also be helpful to elaborate potential development paths that nations and regions can pursue, which would provide links between climate protection and development issues. Inclusion of macro-indicators for sustainable development that can track progress could support such analysis [Chapters 2, 12 and 13].
Studies of costs and potentials The available studies of mitigation potentials and costs
differ in their methodological treatment and do not cover all sectors, GHGs or countries. Because of different assumptions, for example, with respect to the baseline and definitions of potentials and costs, their comparability is often limited. Also, the number of studies on mitigation costs, potentials and instruments for countries belonging to Economies in Transition and most developing regions is smaller than for developed and selected (major) developing countries.
This report compares costs and mitigation potentials based on bottom-up data from sectoral analyses with top-down costs and potential data from integrated models. The match at the sectoral level is still limited, partly because of lack of or incomplete data from bottom-up studies and differences in sector definitions and baseline assumptions. There is a need for integrated studies that combine top-down and bottom-up elements [Chapters 3, 4, 5, 6, 7, 8, 9 and 10].
Another important gap is the knowledge on spill-over effects (the effects of domestic or sectoral mitigation measures on other countries or sectors). Studies indicate a large range (leakage effects20 from implementation of the Kyoto Protocol of between 5 and 20% by 2010), but are lacking an empirical basis. More empirical studies would be helpful [Chapter 11].
The understanding of future mitigation potentials and costs depends not only on the expected impact of RD&D on technology performance characteristics but also on ‘technology learning’, technology diffusion and transfer which are often not taken into account in mitigation studies. The studies on the influence of technological change on mitigation costs mostly have a weak empirical basis and are often conflicting.
Implementation of a mitigation potential may compete with other activities. For instance, the biomass potentials are large, but there may be trade-offs with food production, forestry or nature conservation. The extent to which the biomass potential can be deployed over time is still poorly understood.
In general, there is a continued need for a better understanding of how rates of adoption of climate-mitigation technologies are related to national and regional climate and non-climate policies, market mechanisms (investments, changing consumer preferences), human behaviour and technology evolution, change in production systems, trade and finance and institutional arrangements.