20
IPCC Tier - definition

IPCC Tier - definition
What is the UNFCCC?
Adopted in 1992, entered into force in 1994. 196 signatory countries (2014)
provides a framework for negotiating specific international treaties (called "protocols") that may set binding limits on greenhouse gases.
One of the first tasks set by the UNFCCC was for signatory nations to establish national greenhouse gas (GHG) inventories which include both emissions and removals
United Nations Framework Convention on Climate Change
Goal and objectives of the UNFCCC
What is the overall goal?
“ to protect the climate system for the benefit of present and future generations of mankind. ”
What are the further objectives?
“ to achieve stabilization of greenhouse gas concentrations in the atmosphere at a level that would prevent dangerous anthropogenic interference with the climate system. ”
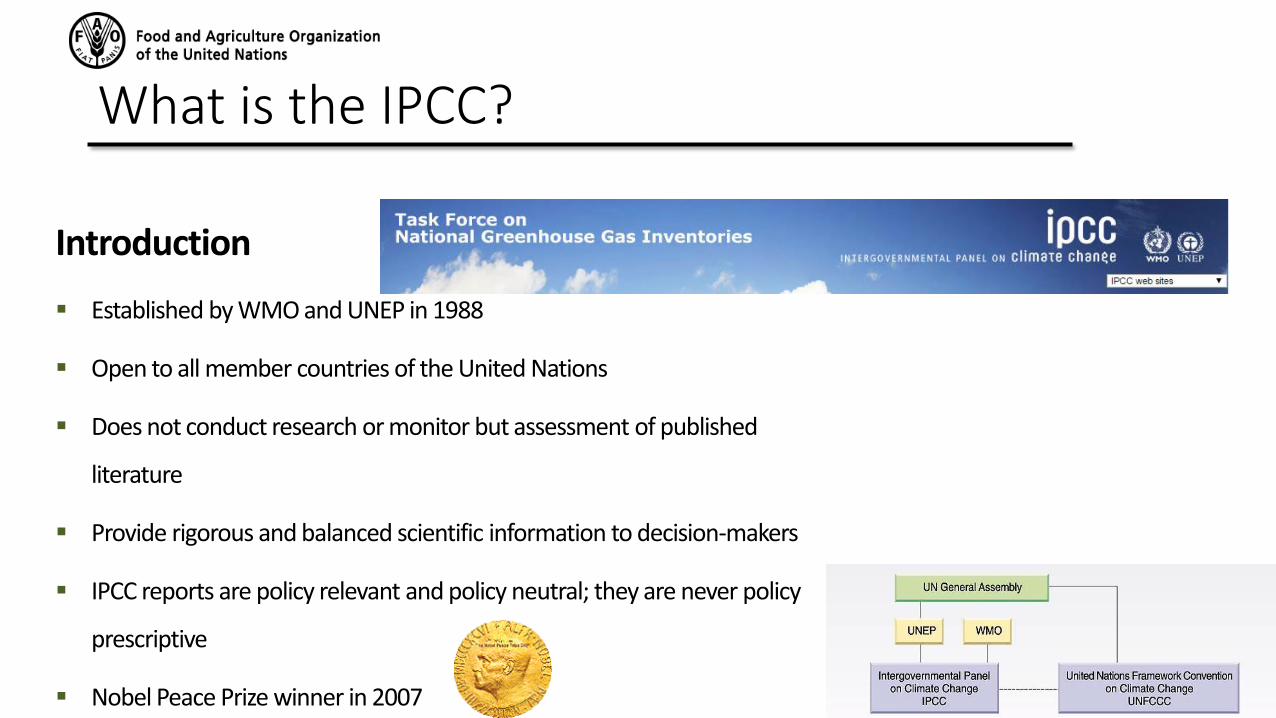
What is the IPCC?
Established by WMO and UNEP in 1988
Open to all member countries of the United Nations
Does not conduct research or monitor but assessment of published
literature
Provide rigorous and balanced scientific information to decision-makers
IPCC reports are policy relevant and policy neutral; they are never policy
prescriptive
Nobel Peace Prize winner in 2007
Introduction
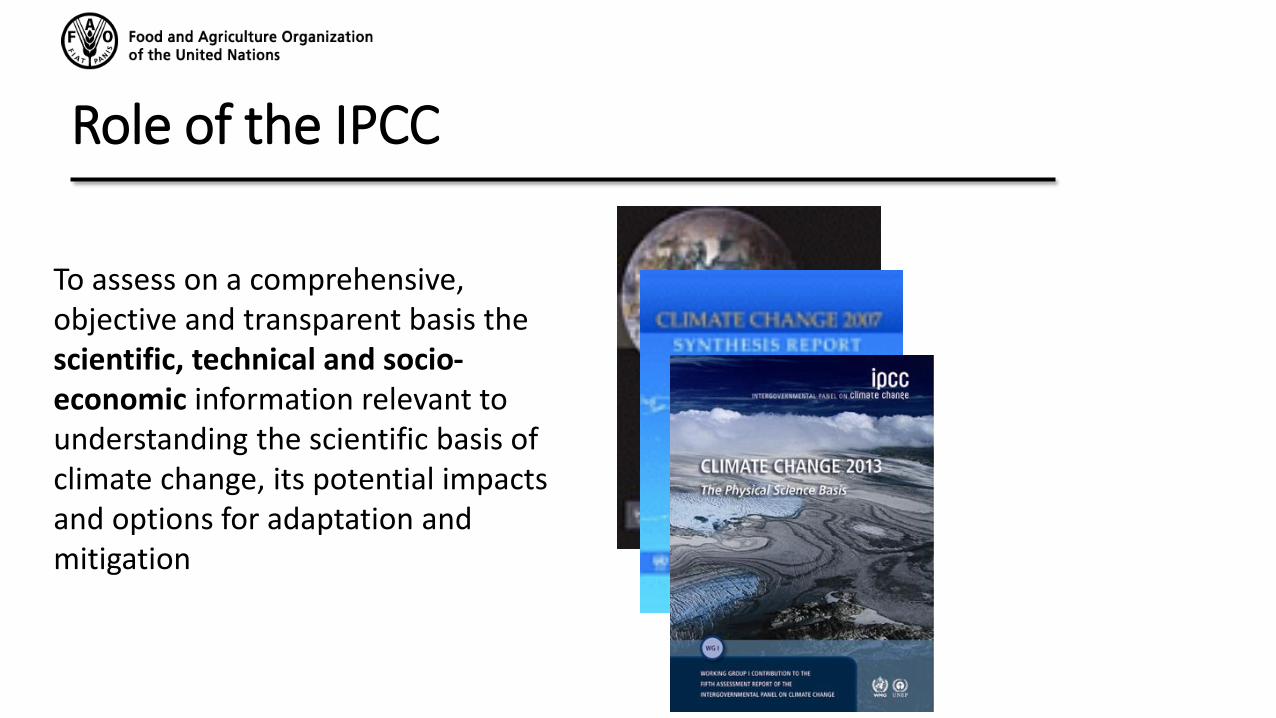
Role of the IPCC
To assess on a comprehensive, objective and transparent basis the scientific, technical and socio-economic information relevant to understanding the scientific basis of climate change, its potential impacts and options for adaptation and mitigation
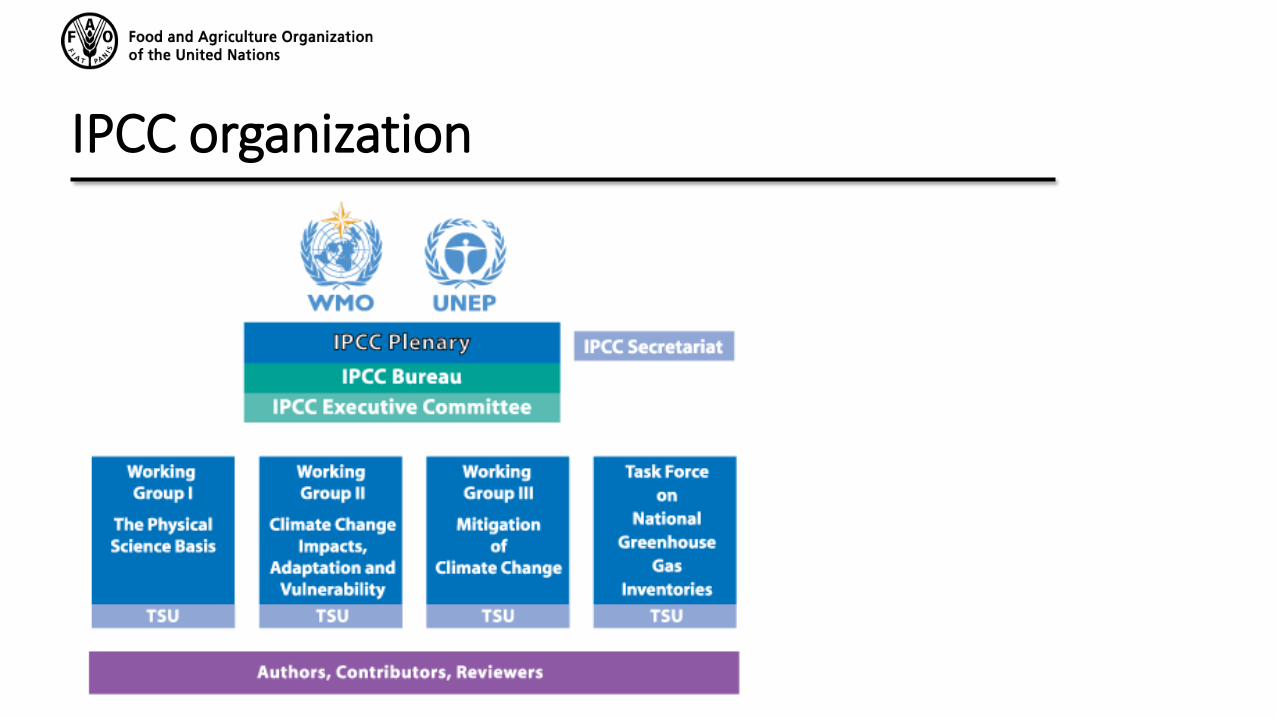
IPCC organization
Task force on national GHG inventories (TFI)
Task Force on National Greenhouse Gas Inventories (TFI) was established by the IPCC to oversee the IPCC National Greenhouse Gas Inventories Programme (IPCC-NGGIP).
The core activity is to:
develop and refine an internationally-agreed methodology for the calculation and reporting of national GHG emissions and removals
encourage its use by countries participating in the IPCC and by parties of UNFCCC.
The NGGIP also established and maintains an Emission Factor Database.
Guidelines for national greenhouse gas inventories
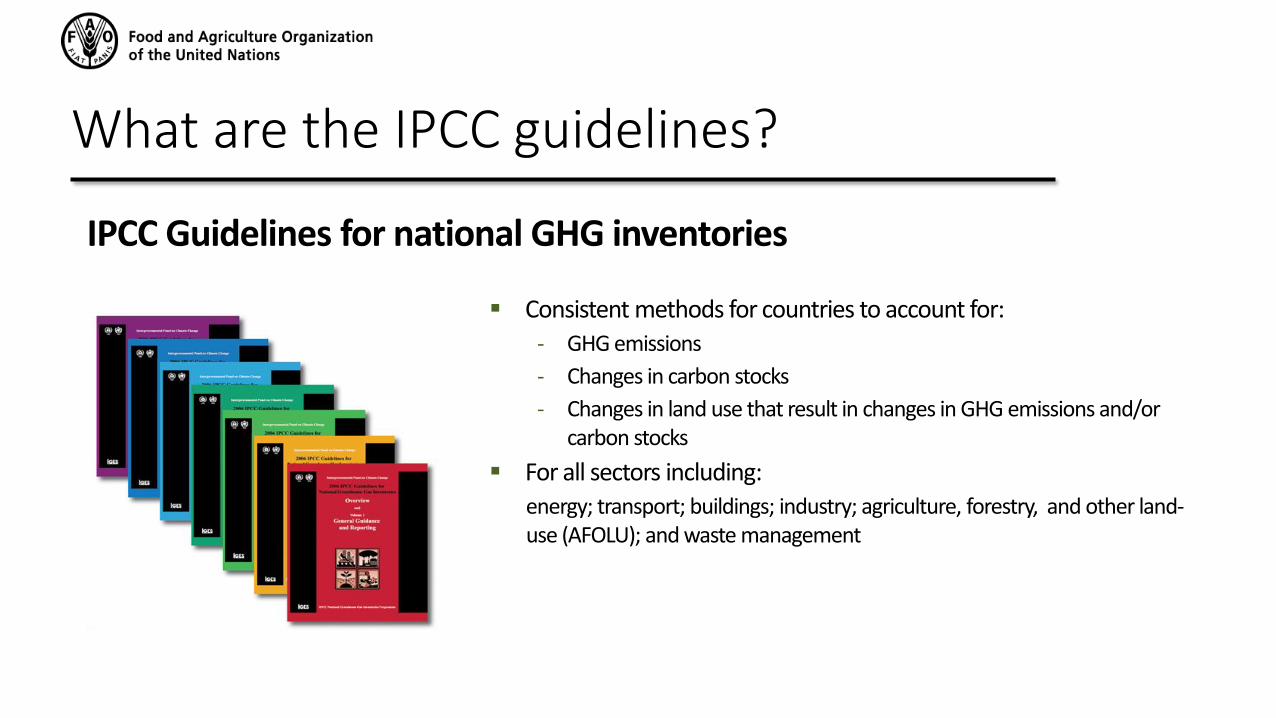
What are the IPCC guidelines?
IPCC Guidelines for national GHG inventories
Consistent methods for countries to account for:
- GHG emissions
- Changes in carbon stocks
- Changes in land use that result in changes in GHG emissions and/or carbon stocks
For all sectors including:
energy; transport; buildings; industry; agriculture, forestry, and other land-use (AFOLU); and waste management
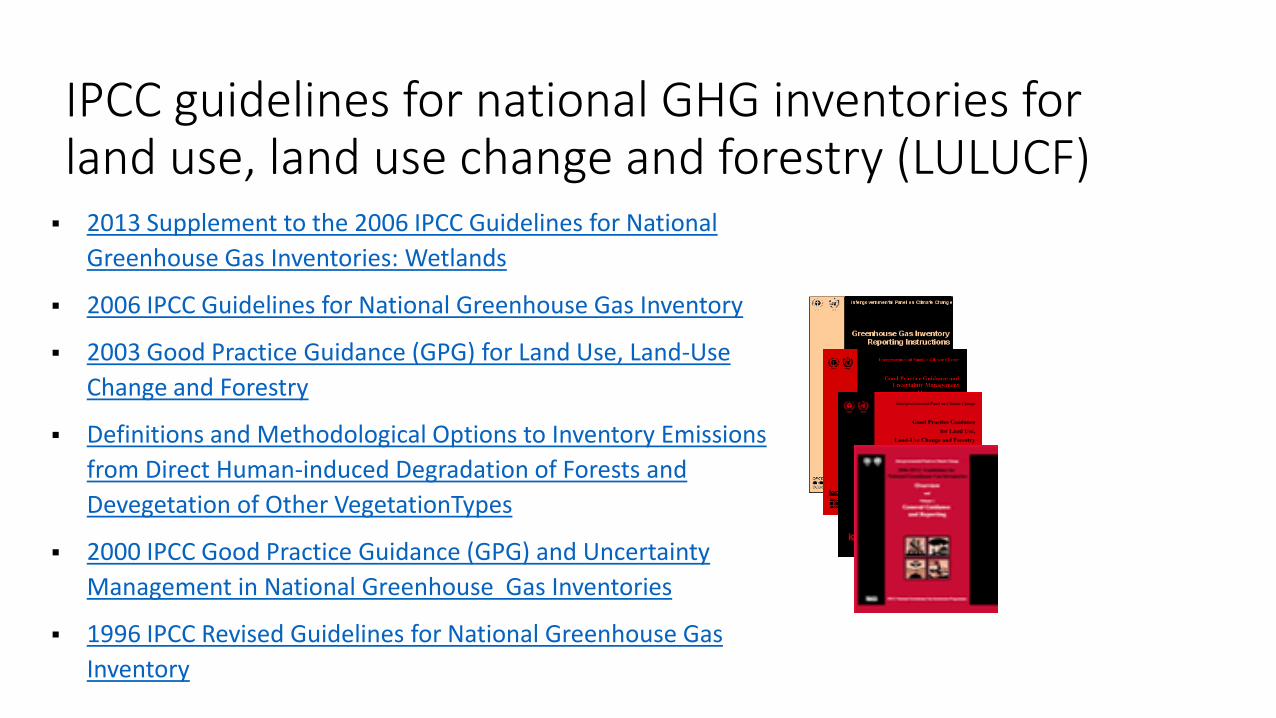
IPCC guidelines for national GHG inventories for land use, land use change and forestry (LULUCF)
2013 Supplement to the 2006 IPCC Guidelines for National
Greenhouse Gas Inventories: Wetlands
2006 IPCC Guidelines for National Greenhouse Gas Inventory
2003 Good Practice Guidance (GPG) for Land Use, Land-Use
Change and Forestry
Definitions and Methodological Options to Inventory Emissions
from Direct Human-induced Degradation of Forests and
Devegetation of Other VegetationTypes
2000 IPCC Good Practice Guidance (GPG) and Uncertainty
Management in National Greenhouse Gas Inventories
1996 IPCC Revised Guidelines for National Greenhouse Gas
Inventory
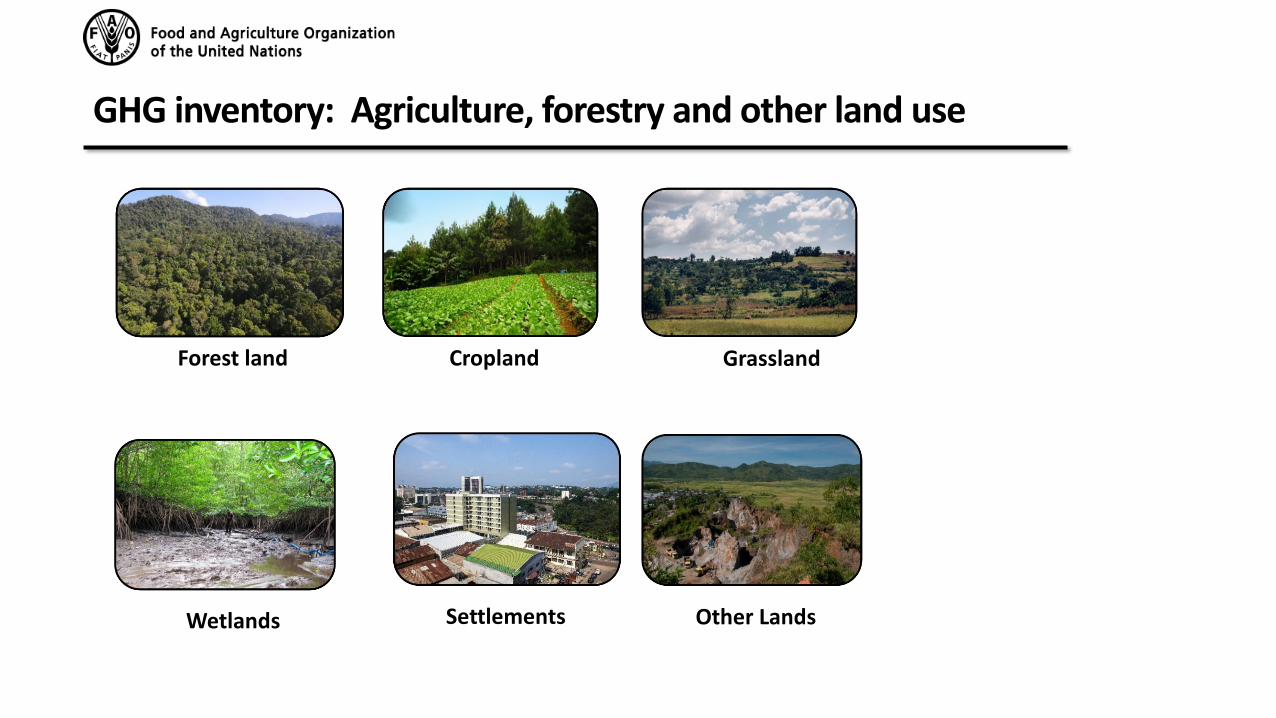
GHG inventory: Agriculture, forestry and other land use
Forest land Cropland Grassland
SettlementsWetlands Other Lands
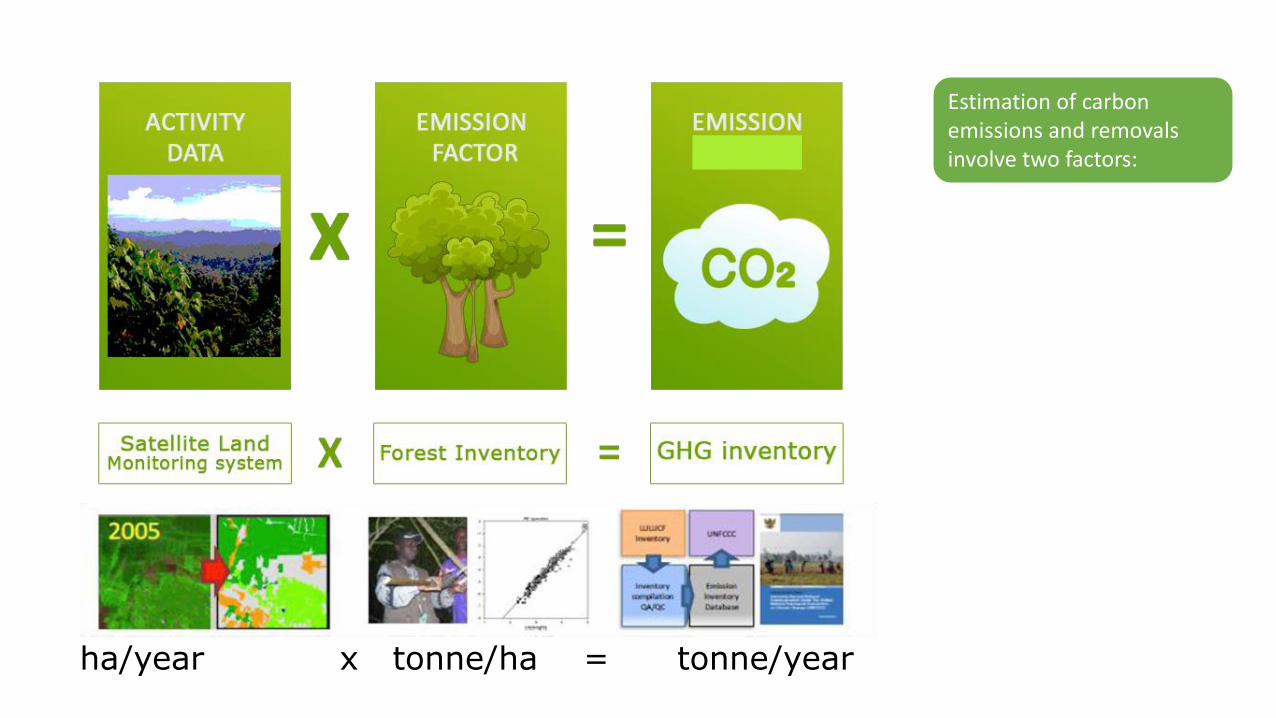
ha/year x tonne/ha = tonne/year
Estimation of carbon emissions and removals involve two factors:
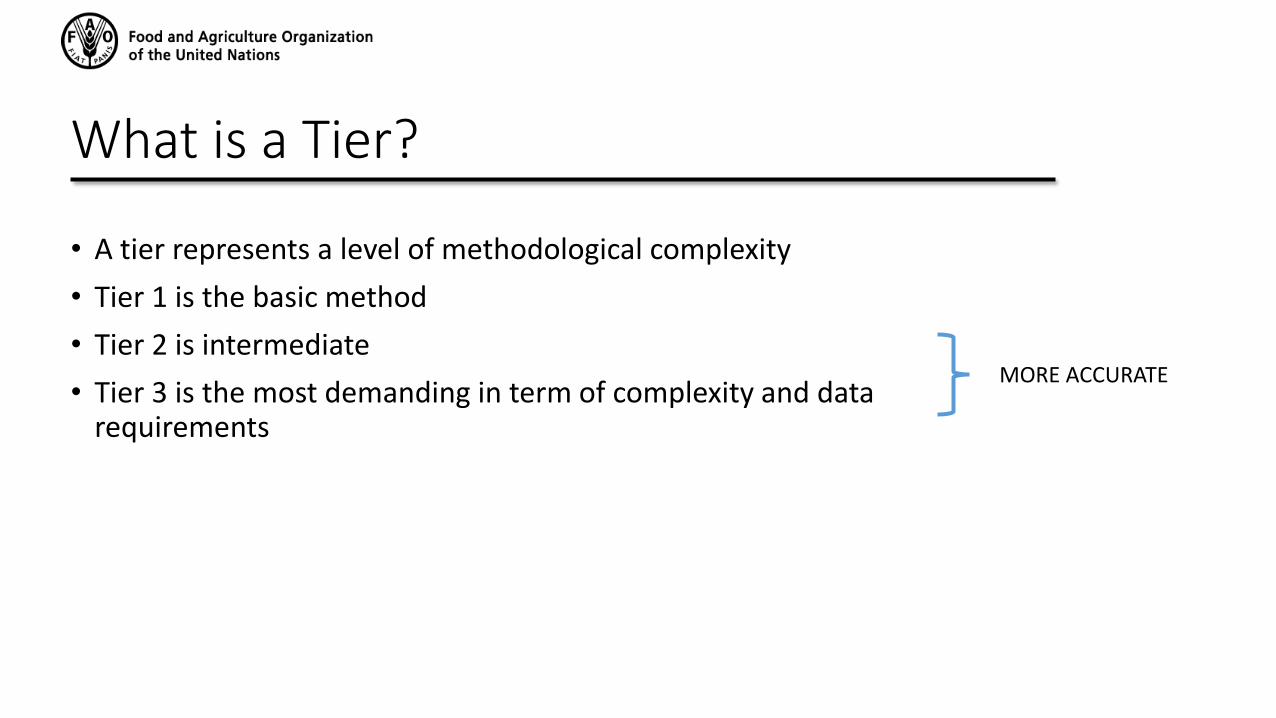
What is a Tier?
• A tier represents a level of methodological complexity
• Tier 1 is the basic method
• Tier 2 is intermediate
• Tier 3 is the most demanding in term of complexity and data requirements
MORE ACCURATE
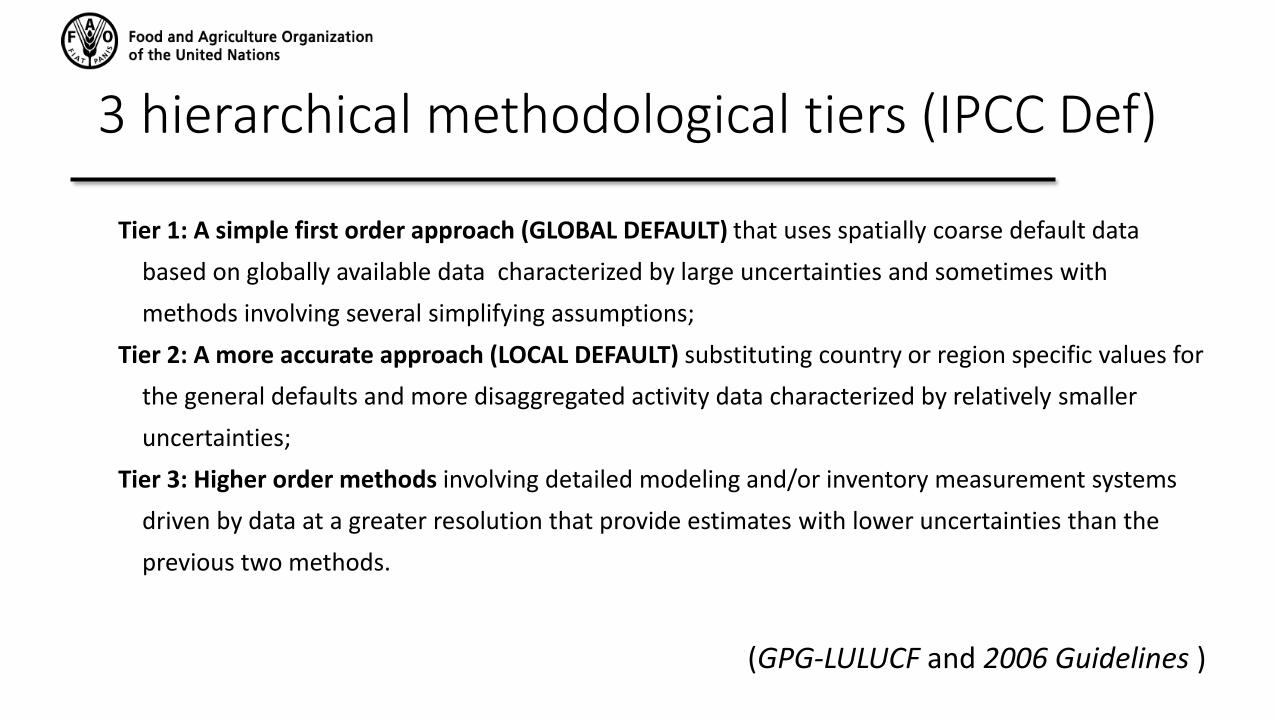
3 hierarchical methodological tiers (IPCC Def)
Tier 1: A simple first order approach (GLOBAL DEFAULT) that uses spatially coarse default data
based on globally available data characterized by large uncertainties and sometimes with
methods involving several simplifying assumptions;
Tier 2: A more accurate approach (LOCAL DEFAULT) substituting country or region specific values for
the general defaults and more disaggregated activity data characterized by relatively smaller
uncertainties;
Tier 3: Higher order methods involving detailed modeling and/or inventory measurement systems
driven by data at a greater resolution that provide estimates with lower uncertainties than the
previous two methods.
(GPG-LULUCF and 2006 Guidelines )
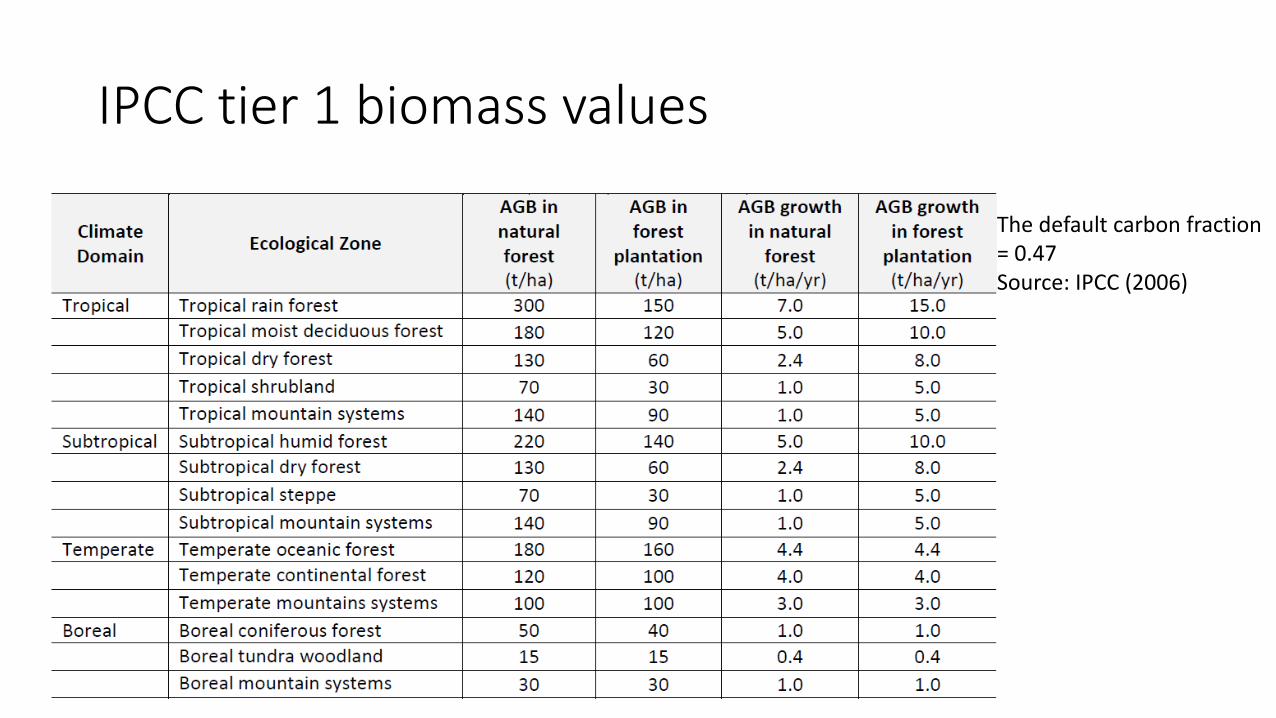
IPCC tier 1 biomass values
The default carbon fraction = 0.47 Source: IPCC (2006)
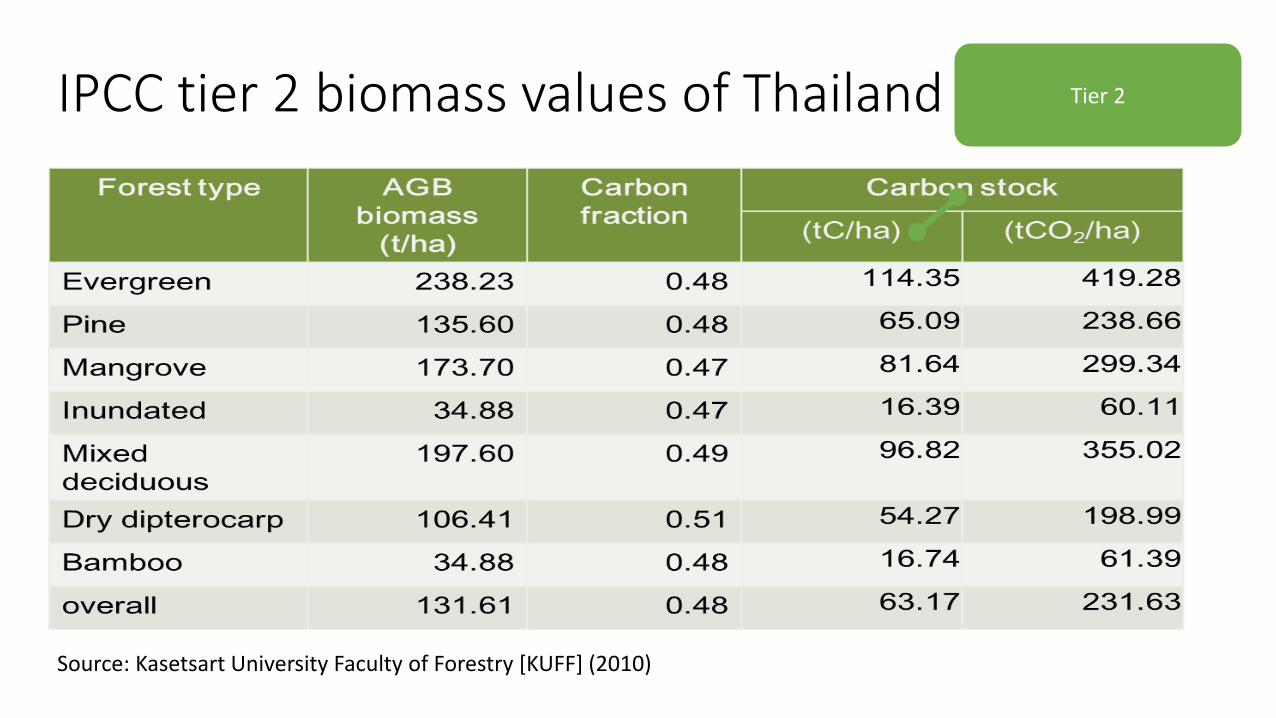
IPCC tier 2 biomass values of Thailand
Source: Kasetsart University Faculty of Forestry [KUFF] (2010)
Tier 2
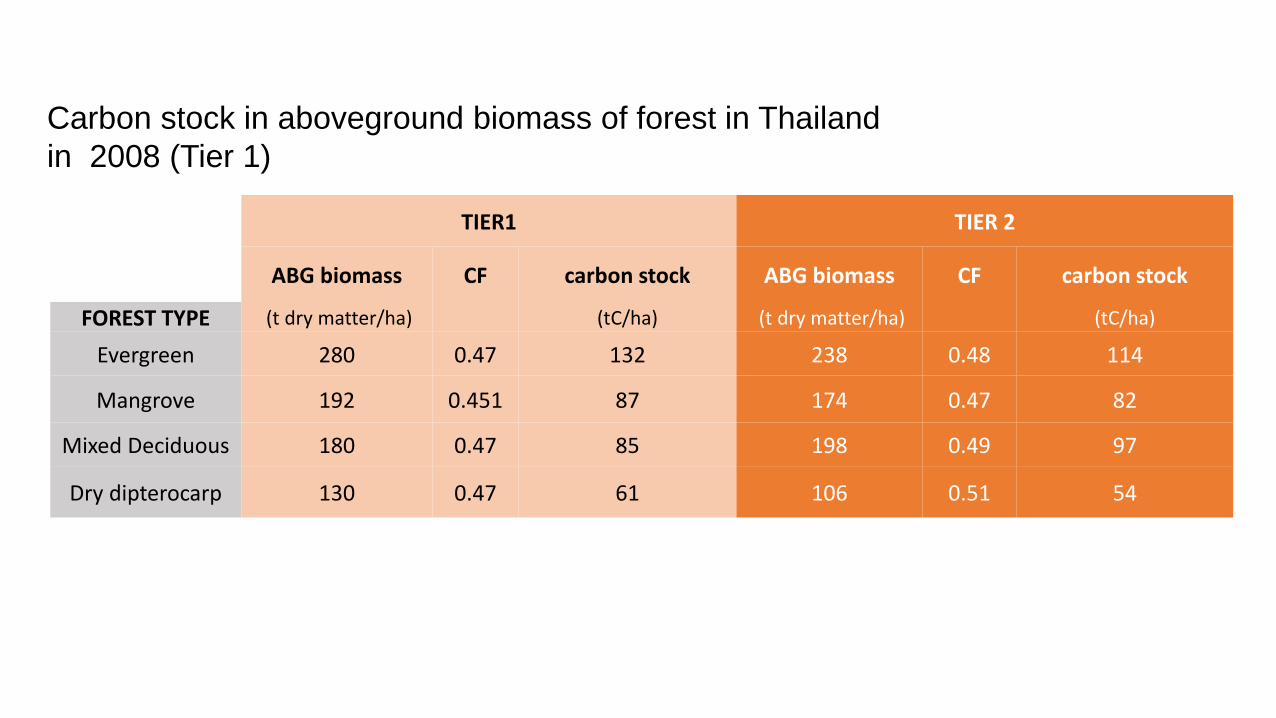
Carbon stock in aboveground biomass of forest in Thailand
in 2008 (Tier 1)
TIER1 TIER 2
ABG biomass CF carbon stock ABG biomass CF carbon stock
FOREST TYPE (t dry matter/ha) (tC/ha) (t dry matter/ha) (tC/ha)
Evergreen 280 0.47 132 238 0.48 114
Mangrove 192 0.451 87 174 0.47 82
Mixed Deciduous 180 0.47 85 198 0.49 97
Dry dipterocarp 130 0.47 61 106 0.51 54
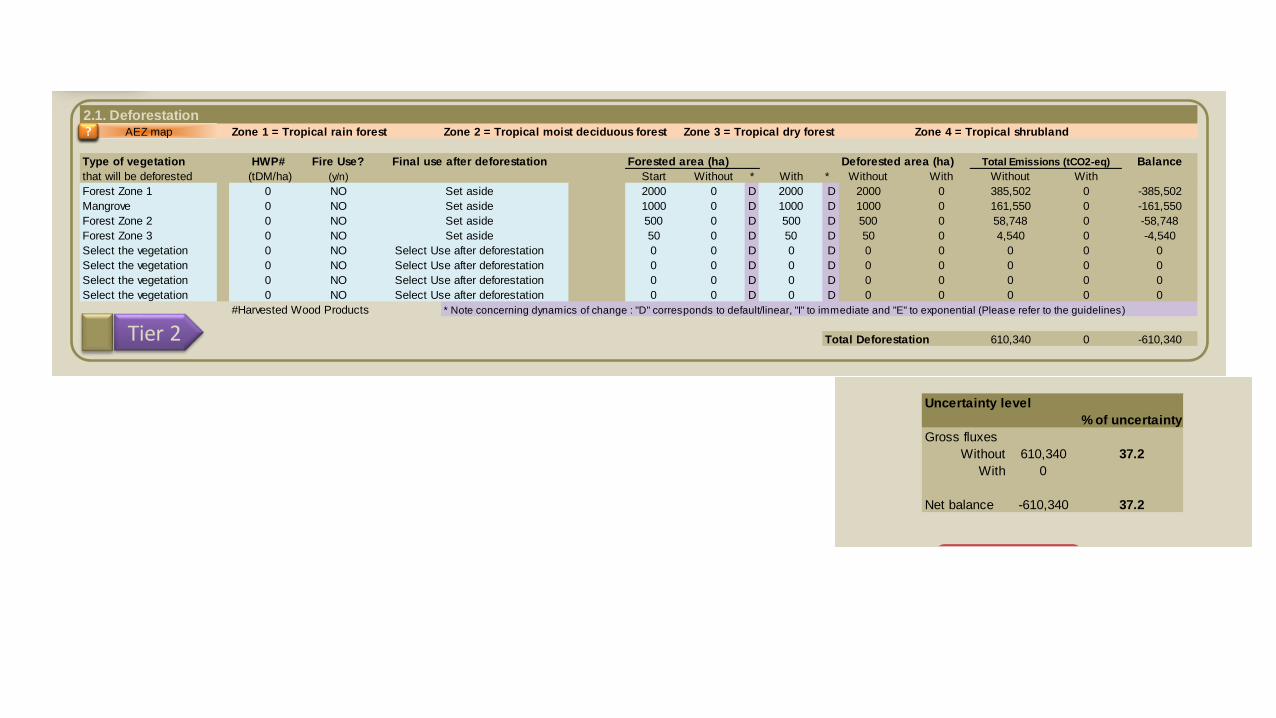
2.1. DeforestationAEZ map Zone 1 = Tropical rain forest Zone 2 = Tropical moist deciduous forest Zone 3 = Tropical dry forest Zone 4 = Tropical shrubland
Type of vegetation HWP# Fire Use? Forested area (ha) Deforested area (ha) Balance
that will be deforested (tDM/ha) (y/n) Start Without * With * Without With Without With
Forest Zone 1 0 NO 2000 0 D 2000 D 2000 0 385,502 0 -385,502
Mangrove 0 NO 1000 0 D 1000 D 1000 0 161,550 0 -161,550
Forest Zone 2 0 NO 500 0 D 500 D 500 0 58,748 0 -58,748
Forest Zone 3 0 NO 50 0 D 50 D 50 0 4,540 0 -4,540
Select the vegetation 0 NO 0 0 D 0 D 0 0 0 0 0
Select the vegetation 0 NO 0 0 D 0 D 0 0 0 0 0
Select the vegetation 0 NO 0 0 D 0 D 0 0 0 0 0
Select the vegetation 0 NO 0 0 D 0 D 0 0 0 0 0
#Harvested Wood Products * Note concerning dynamics of change : "D" corresponds to default/linear, "I" to immediate and "E" to exponential (Please refer to the guidelines)
Total Deforestation 610,340 0 -610,340
Total Emissions (tCO2-eq)
Set aside
Set aside
Set aside
Select Use after deforestation
Final use after deforestation
Set aside
Select Use after deforestation
Select Use after deforestation
Select Use after deforestation
?
Tier 2
???
Uncertainty level
% of uncertainty
Without 610,340 37.2
With 0
Net balance -610,340 37.2
Gross fluxes
Use this part only if you want to refine the analysis with Tier 2 coefficients.
(default values are provided for your information only, while EX-ACT will use Tier 2 values automatically wherever specified)
Type of vegetation
that will be deforested Above-ground
Default Tier 2
Forest Zone 1 131.6 114.4
Forest Zone 2 84.6 96.8
Forest Zone 3 61.1 54.3
Forest Zone 4 28.2
Plantation Zone 1 70.5
Plantation Zone 2 56.4
Plantation Zone 3 28.2
Plantation Zone 4 14.1
Mangrove 86.6 81.6
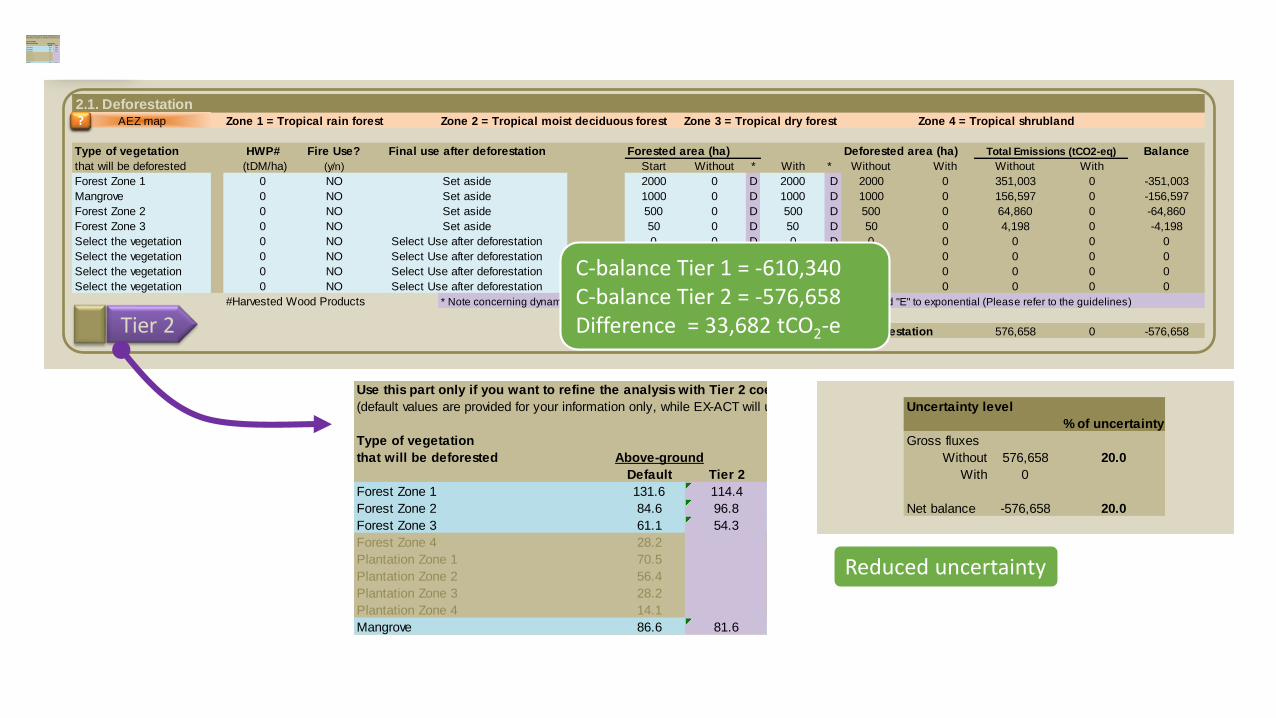
2.1. DeforestationAEZ map Zone 1 = Tropical rain forest Zone 2 = Tropical moist deciduous forest Zone 3 = Tropical dry forest Zone 4 = Tropical shrubland
Type of vegetation HWP# Fire Use? Forested area (ha) Deforested area (ha) Balance
that will be deforested (tDM/ha) (y/n) Start Without * With * Without With Without With
Forest Zone 1 0 NO 2000 0 D 2000 D 2000 0 351,003 0 -351,003
Mangrove 0 NO 1000 0 D 1000 D 1000 0 156,597 0 -156,597
Forest Zone 2 0 NO 500 0 D 500 D 500 0 64,860 0 -64,860
Forest Zone 3 0 NO 50 0 D 50 D 50 0 4,198 0 -4,198
Select the vegetation 0 NO 0 0 D 0 D 0 0 0 0 0
Select the vegetation 0 NO 0 0 D 0 D 0 0 0 0 0
Select the vegetation 0 NO 0 0 D 0 D 0 0 0 0 0
Select the vegetation 0 NO 0 0 D 0 D 0 0 0 0 0
#Harvested Wood Products * Note concerning dynamics of change : "D" corresponds to default/linear, "I" to immediate and "E" to exponential (Please refer to the guidelines)
Total Deforestation 576,658 0 -576,658
Total Emissions (tCO2-eq)
Set aside
Set aside
Set aside
Select Use after deforestation
Final use after deforestation
Set aside
Select Use after deforestation
Select Use after deforestation
Select Use after deforestation
?
Tier 2
???
Uncertainty level
% of uncertainty
Without 576,658 20.0
With 0
Net balance -576,658 20.0
Gross fluxes
C-balance Tier 1 = -610,340C-balance Tier 2 = -576,658Difference = 33,682 tCO2-e
Use this part only if you want to refine the analysis with Tier 2 coefficients.
(default values are provided for your information only, while EX-ACT will use Tier 2 values automatically wherever specified)
Type of vegetation
that will be deforested Above-ground
Default Tier 2
Forest Zone 1 131.6 114.4
Forest Zone 2 84.6 96.8
Forest Zone 3 61.1 54.3
Forest Zone 4 28.2
Plantation Zone 1 70.5
Plantation Zone 2 56.4
Plantation Zone 3 28.2
Plantation Zone 4 14.1
Mangrove 86.6 81.6
Reduced uncertainty
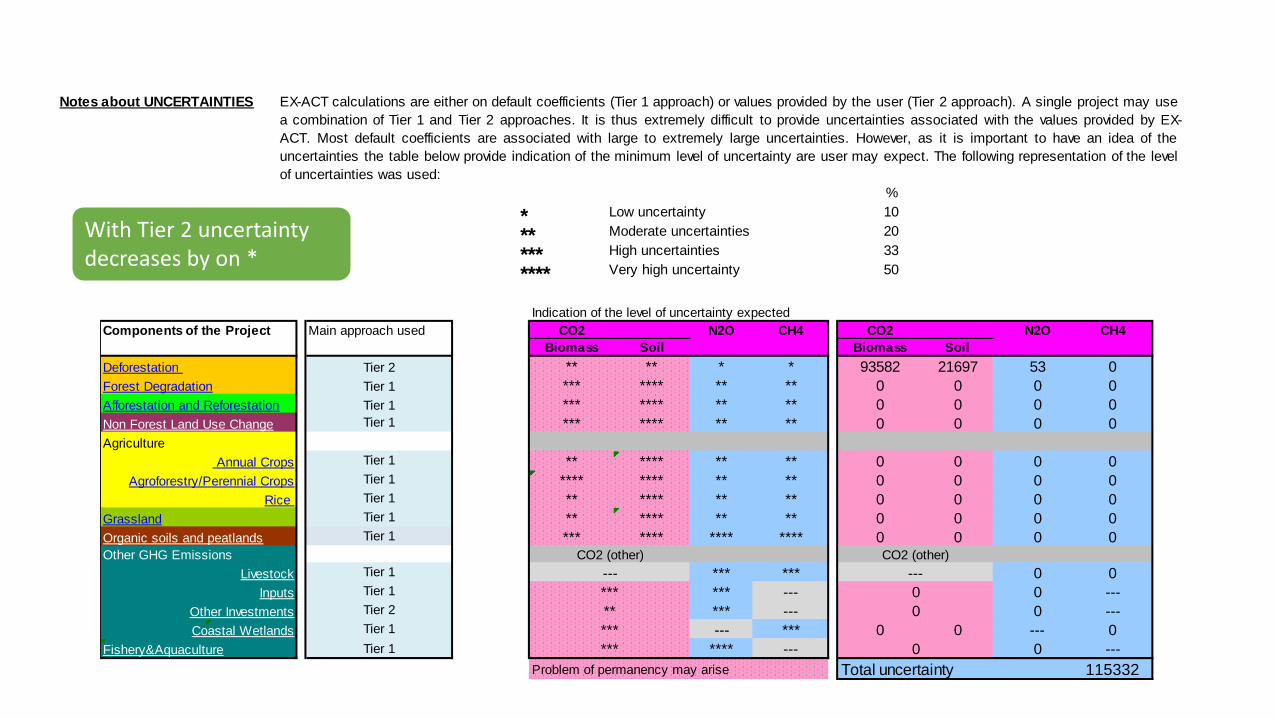
Notes about UNCERTAINTIES
%
* Low uncertainty 10
** Moderate uncertainties 20
*** High uncertainties 33
**** Very high uncertainty 50
EX-ACT calculations are either on default coefficients (Tier 1 approach) or values provided by the user (Tier 2 approach). A single project may use
a combination of Tier 1 and Tier 2 approaches. It is thus extremely difficult to provide uncertainties associated with the values provided by EX-
ACT. Most default coefficients are associated with large to extremely large uncertainties. However, as it is important to have an idea of the
uncertainties the table below provide indication of the minimum level of uncertainty are user may expect. The following representation of the level
of uncertainties was used:
Indication of the level of uncertainty expected
Components of the Project Main approach used CO2 N2O CH4 CO2 N2O CH4
Biomass Soil Biomass Soil
Deforestation ** ** * * 93582 21697 53 0
Forest Degradation *** **** ** ** 0 0 0 0
Afforestation and Reforestation *** **** ** ** 0 0 0 0
Non Forest Land Use Change *** **** ** ** 0 0 0 0
Agriculture
** **** ** ** 0 0 0 0
**** **** ** ** 0 0 0 0
** **** ** ** 0 0 0 0
Grassland ** **** ** ** 0 0 0 0
Organic soils and peatlands *** **** **** **** 0 0 0 0Other GHG Emissions
*** *** 0 0
*** --- 0 ---
*** --- 0 ---
Coastal Wetlands --- *** 0 0 --- 0
Fishery&Aquaculture **** --- 0 ---
Problem of permanency may arise Total uncertainty 115332
***Tier 1
0***
Annual Crops
Agroforestry/Perennial Crops
Rice
Other Investments
Livestock
Inputs
Tier 1
**
CO2 (other)
---
0Tier 2 0
---
***Tier 1
Tier 1
Tier 1
CO2 (other)
Tier 2
Tier 1
Tier 1
Tier 1
Tier 1
Tier 1
Tier 1
Tier 1
With Tier 2 uncertainty decreases by on *
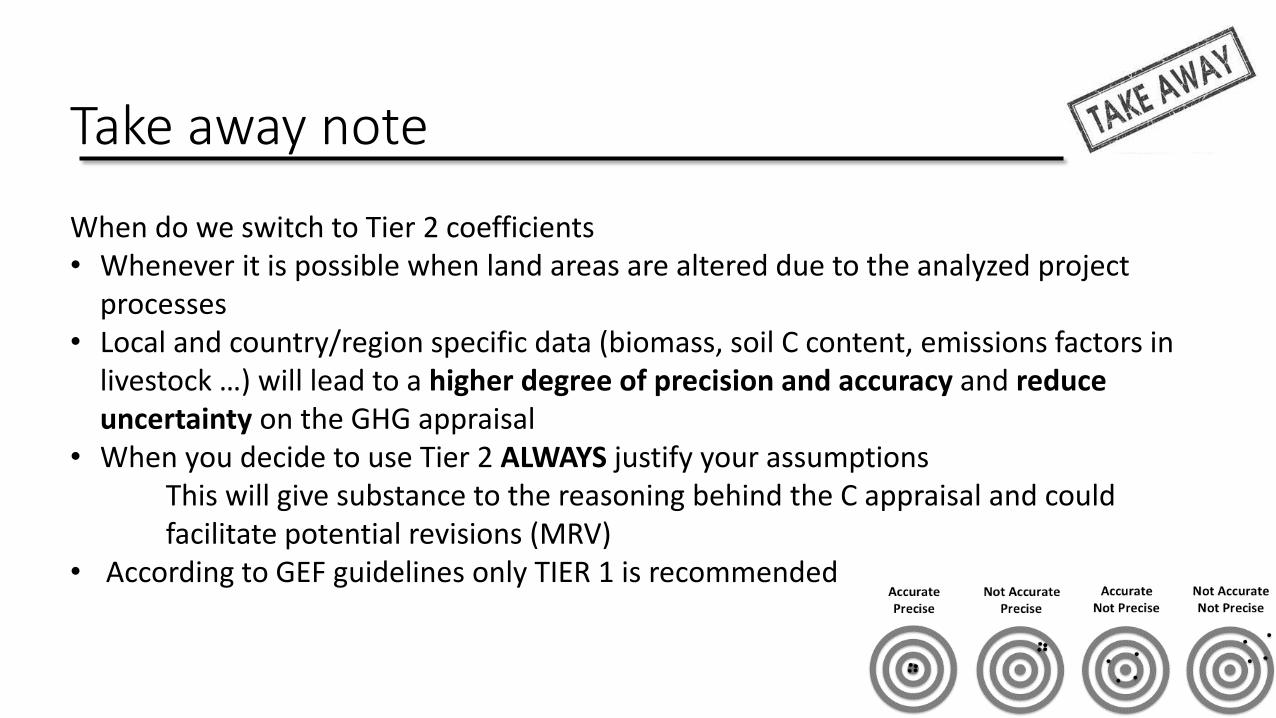
Take away note
When do we switch to Tier 2 coefficients• Whenever it is possible when land areas are altered due to the analyzed project
processes• Local and country/region specific data (biomass, soil C content, emissions factors in
livestock …) will lead to a higher degree of precision and accuracy and reduce uncertainty on the GHG appraisal
• When you decide to use Tier 2 ALWAYS justify your assumptionsThis will give substance to the reasoning behind the C appraisal and could facilitate potential revisions (MRV)
• According to GEF guidelines only TIER 1 is recommended


