36
IPCC Time for action? Options to address climate change Bert Metz Netherlands Environmental Assessment Agency Co-chairman IPCC Working Group III Dublin, November 27 th , 2007
| Date post: | 19-Dec-2015 |
| Category: |
Documents |
| View: | 214 times |
| Download: | 0 times |

IPCC
Time for action?
Options to address climate change
Bert Metz
Netherlands Environmental Assessment Agency
Co-chairman IPCC Working Group III
Dublin, November 27th, 2007

IPCC
Projected climate changeDevelopment
path with HIGH base emissions
Development path with
LOW emissions

IPCC
Projected changes in the Arctic by 2090-2100

IPCC
Food production threatenedGrain productivity in tropics goes down at any warming;
Rainfall patterns change and risk of drought increases (particularly in dry areas)
In temperate areas productivity of some crops increases with moderate warming;
With more than 3 degrees warming also there a decline

IPCC
Nature seriously threatened
Ranunculus
20-30% of species threatened with
extinction at 1,5-2,5 degrees warming
Alpine flora: in 2080 60% threatened with extinction
Coral: bleaching already happening; dying at 1-3 degrees warmer water
Eastern Amazone turns into savanna by 2050
1 2 3 4 5
Extensive extinction of
species
Tempincrease

IPCC
Threatened deltas
Relative vulnerability of coastal deltas as indicated by the indicative population potentially displaced by current sea-level trends to 2050 (Extreme > 1 million; high 1 million to 50,000; medium 50,000 to 5,000)
IPCC
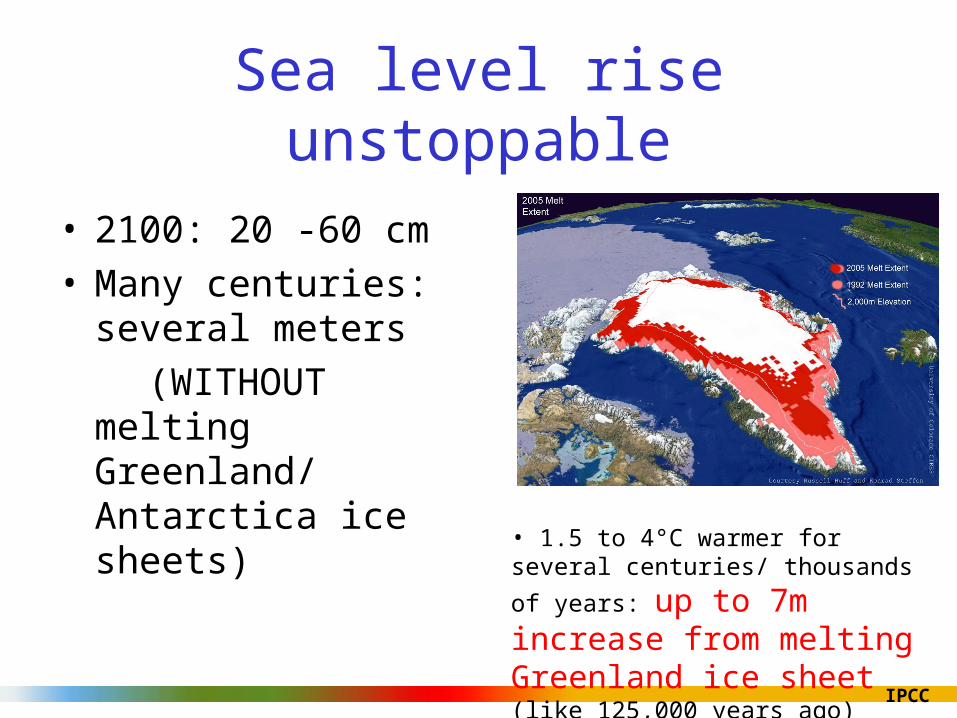
• 1.5 to 4°C warmer for several centuries/
thousands of years: up to 7m increase from melting Greenland ice sheet(like 125,000 years ago)
Sea level rise unstoppable
• 2100: 20 -60 cm• Many centuries:
several meters
(WITHOUT melting Greenland/ Antarctica ice sheets)

IPCC
Security risks associated with climate change
Source:German Advisory Council on Global Change, 2007

IPCC
Emissions of Greenhouse Gases increased by 70% between 1970 and 2004

IPCC
0
5
10
15
20
25
30
0 1,000 2,000 3,000 4,000 5,000 6,000 7,000
Cumulative population in million
t CO
2eq
/cap Average Annex I:
16.1 t CO2eq/cap
Average non-Annex I: 4.2 t CO2eq/cap
Annex I: Population 19.7% Non-Annex I: Population 80.3%
EIT
Ann
ex I:
9.7
%
Latin
Am
eric
a:
10.3
%
Non-Annex I East Asia:
17.3% Africa: 7.8% US
A &
Can
ada:
19.
4%
JAN
Z:5.
2%
Eur
ope
Ann
exII
: 11
.4%
South Asia: 13.1%
Other non-Annex I: 2.0%
Mid
dle
Eas
t: 3
.8%
Differences in per capita emissions
China
Ireland
IPCC
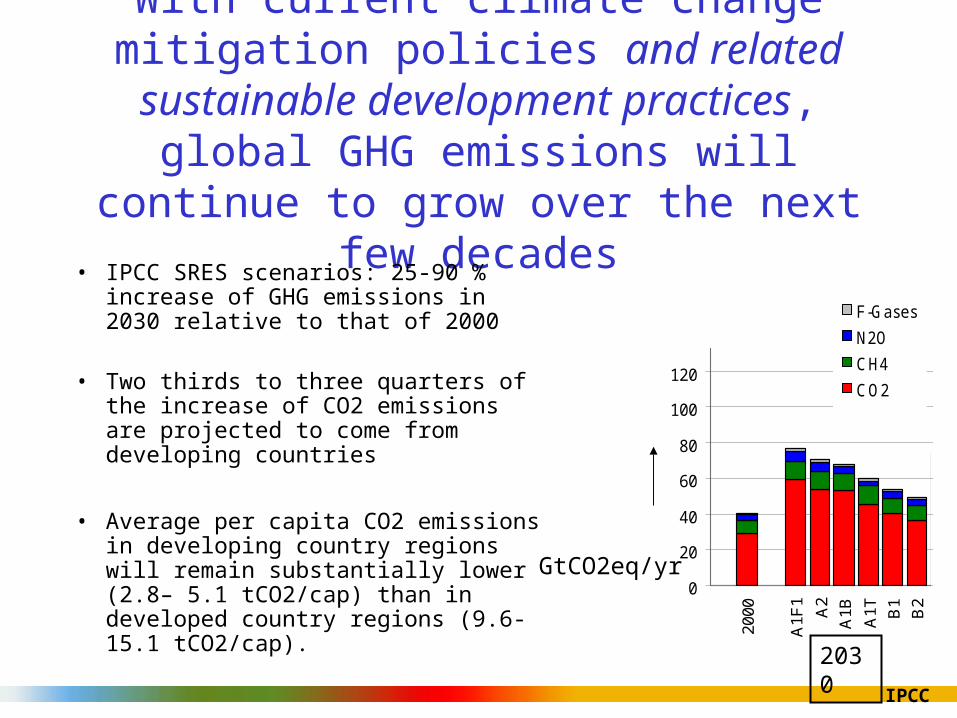
With current climate change mitigation policies and related sustainable development
practices, global GHG emissions will continue to grow over the next few decades
• IPCC SRES scenarios: 25-90 % increase of GHG emissions in 2030 relative to that of 2000
• Two thirds to three quarters of the increase of CO2 emissions are projected to come from developing countries
• Average per capita CO2 emissions in developing country regions will remain substantially lower (2.8– 5.1 tCO2/cap) than in developed country regions (9.6- 15.1 tCO2/cap).
0
20
40
60
80
100
120
140
160
180
2000
A1F
1
A2
A1B
A1T B
1B
2
95th
75th
med
ian
25th 5th
A2
A1F
1
B2
A1B
A1T B
195
th
75th
med
ian
25th 5th
2030
GtCO2eq/yr
0
20
40
60
80
100
120
140
160
180
2000
A1F
1 A2
A1B A1T B
1B
295
th75
thm
edia
n25
th 5th A2
A1F
1B
2A
1B A1T B
195
th75
thm
edia
n25
th 5th
F-Gases
N2O
CH4
CO2
IPCC
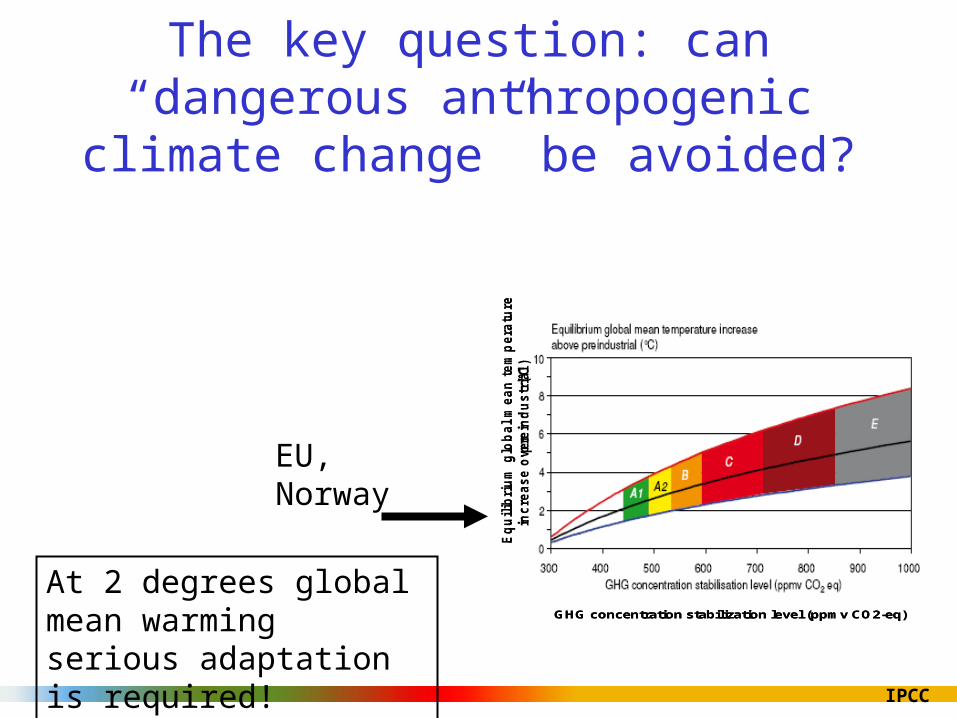
The key question: can “dangerous anthropogenic climate change” be avoided?
-5
0
5
10
15
20
25
30
35
2000 2010 2020 2030 2040 2050 2060 2070 2080 2090 2100
Stabilization targets:
Post-SRES (max)
Post-SRES (min)
Eq
uil
ibri
um
glo
ba
l m
ea
n t
em
pera
ture
inc
rease
ove
r p
rein
du
str
ial
(°C
)
GHG concentration stabilization level (ppmv CO2-eq)
-5
0
5
10
15
20
25
30
35
2000 2010 2020 2030 2040 2050 2060 2070 2080 2090 2100
Stabilization targets:
Post-SRES (max)
Post-SRES (min)
Eq
uil
ibri
um
glo
ba
l m
ea
n t
em
pera
ture
inc
rease
ove
r p
rein
du
str
ial
(°C
)
GHG concentration stabilization level (ppmv CO2-eq)
EU, Norway
At 2 degrees global mean warming serious adaptation is required!
IPCC

IPCC

IPCC
The lower the stabilisation level the earlier global emissions have to go down
-5
0
5
10
15
20
25
30
35
2000 2010 2020 2030 2040 2050 2060 2070 2080 2090 2100
Wo
ld C
O2
Em
iss
ion
s (
GtC
)
E: 850-1130 ppm CO2-eq
D: 710-850 ppm CO2-eq
C: 590-710 ppm CO2-eq
B: 535-590 ppm CO2-eq
A2: 490-535 ppm CO2-eq
A1: 445-490 ppm CO2-eq
Stabilization targets:
Post-SRES (max)
Post-SRES (min)E
qu
ilib
riu
m g
lob
al
mea
n t
em
pera
ture
inc
rease
ove
r
pre
ind
us
tria
l(°C
)
GHG concentration stabilization level (ppmv CO2-eq)
-5
0
5
10
15
20
25
30
35
2000 2010 2020 2030 2040 2050 2060 2070 2080 2090 2100
Wo
ld C
O2
Em
iss
ion
s (
GtC
)
E: 850-1130 ppm CO2-eq
D: 710-850 ppm CO2-eq
C: 590-710 ppm CO2-eq
B: 535-590 ppm CO2-eq
A2: 490-535 ppm CO2-eq
A1: 445-490 ppm CO2-eq
Stabilization targets:
Post-SRES (max)
Post-SRES (min)E
qu
ilib
riu
m g
lob
al
mea
n t
em
pera
ture
inc
rease
ove
r
pre
ind
us
tria
l(°C
)
GHG concentration stabilization level (ppmv CO2-eq)Multigas and CO2 only studies combined
-5
0
5
10
15
20
25
30
35
2000 2010 2020 2030 2040 2050 2060 2070 2080 2090 2100
Stabilization targets:
Post-SRES (max)
Post-SRES (min)
Eq
uil
ibri
um
glo
ba
l m
ea
n t
em
pera
ture
inc
rease
ove
r p
rein
du
str
ial
(°C
)
GHG concentration stabilization level (ppmv CO2-eq)
-5
0
5
10
15
20
25
30
35
2000 2010 2020 2030 2040 2050 2060 2070 2080 2090 2100
Stabilization targets:
Post-SRES (max)
Post-SRES (min)
Eq
uil
ibri
um
glo
ba
l m
ea
n t
em
pera
ture
inc
rease
ove
r p
rein
du
str
ial
(°C
)
GHG concentration stabilization level (ppmv CO2-eq)

IPCC
Mitigation efforts over the next two to three decades will have a large impact on opportunities to achieve
lower stabilization levels
Stababilization level
(ppm CO2-eq)
Global Mean temperature
increase at equilibrium
(ºC)
Year global CO2 needs
to peak
Year global CO2
emissions back at
2000 level
Reduction in 2050 global CO2 emissions
compared to 2000
445 – 490 2.0 – 2.4 2000 - 2015 2000- 2030 -85 to -50
490 – 535 2.4 – 2.8 2000 - 2020 2000- 2040 -60 to -30
535 – 590 2.8 – 3.2 2010 - 2030 2020- 2060 -30 to +5
590 – 710 3.2 – 4.0 2020 - 2060 2050- 2100 +10 to +60
710 – 855 4.0 – 4.9 2050 - 2080 +25 to +85
855 – 1130 4.9 – 6.1 2060 - 2090 +90 to +140
IPCC
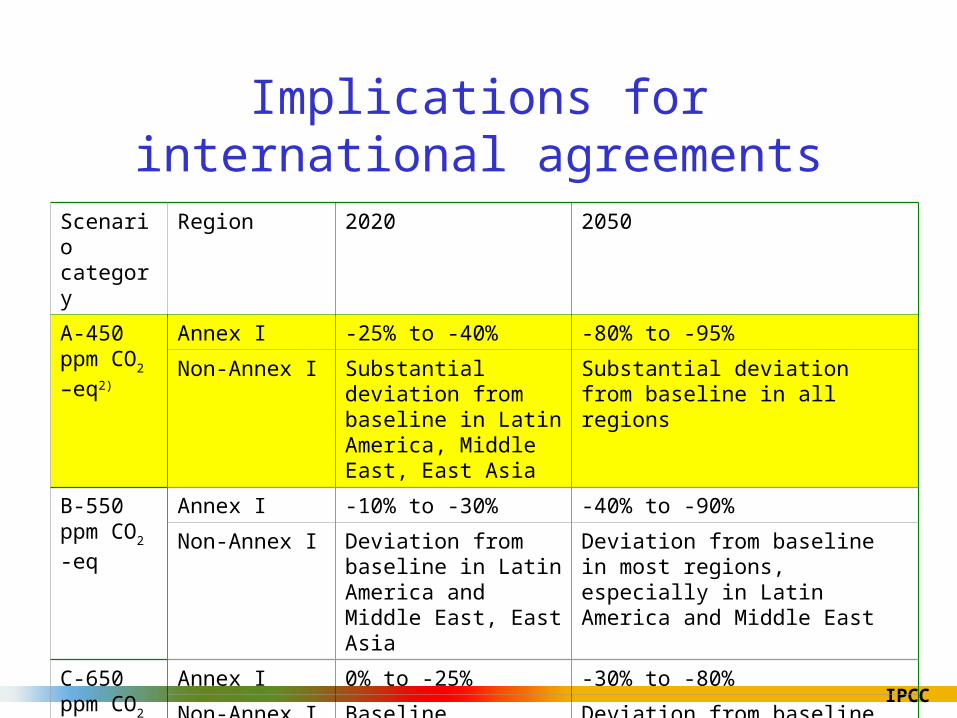
Implications for international agreements
Box 13.7: The range of the difference between emissions in 1990 and emission allowances in 2020/2050 for various GHG concentration levels for the Annex I and non-Annex I countries as a group1)
Scenario category
Region 2020 2050
A-450 ppm CO2 –eq2)
Annex I -25% to -40% -80% to -95%
Non-Annex I Substantial deviation from baseline in Latin America, Middle East, East Asia
Substantial deviation from baseline in all regions
B-550 ppm CO2 -eq
Annex I -10% to -30% -40% to -90%
Non-Annex I Deviation from baseline in Latin America and Middle East, East Asia
Deviation from baseline in most regions, especially in Latin America and Middle East
C-650 ppm CO2 -eq
Annex I 0% to -25% -30% to -80%
Non-Annex I Baseline Deviation from baseline in Latin America and Middle East, East Asia

IPCC
Economic mitigation potential in 2030 could offset the projected growth of global emissions,
or reduce emissions below current levels
Note: estimates are for 2030 and do not include non-technical options, such as lifestyle changes.
Energy savings
Changing energy source
IPCC
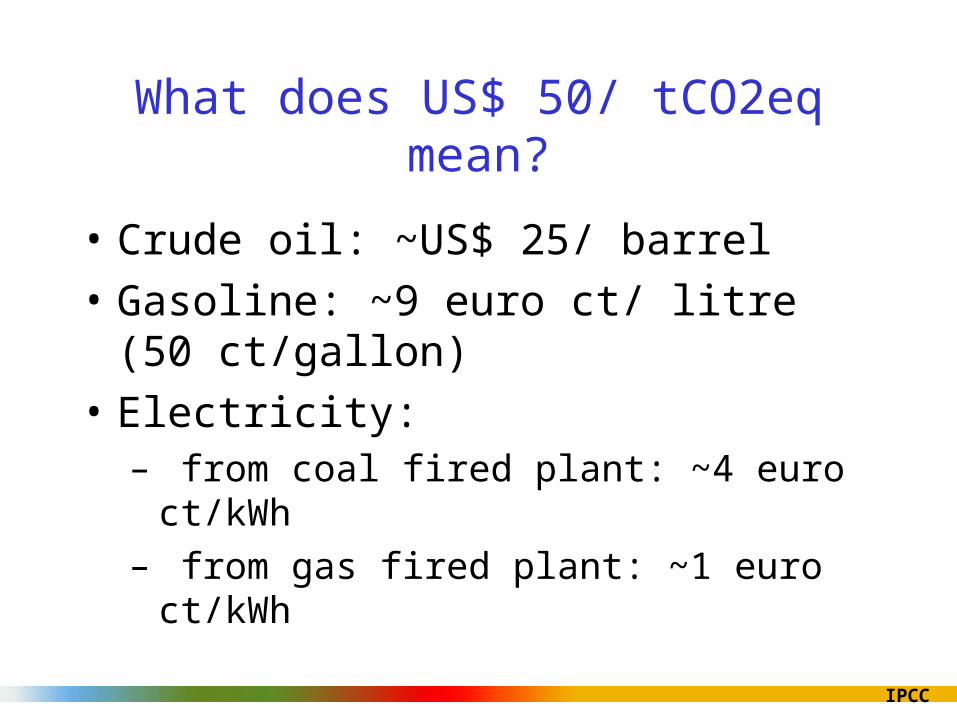
What does US$ 50/ tCO2eq mean?
• Crude oil: ~US$ 25/ barrel
• Gasoline: ~9 euro ct/ litre (50 ct/gallon)
• Electricity:– from coal fired plant: ~4 euro ct/kWh– from gas fired plant: ~1 euro ct/kWh

IPCC
Commercial energy supply mitigation technologies
NOW 2030

IPCC
Commercial transport mitigation technologiesNOW 2030

IPCC
How much does biofuel really reduce CO2?

IPCC
Commercial mitigation technologies in the building sector
NOW 2030
IPCC
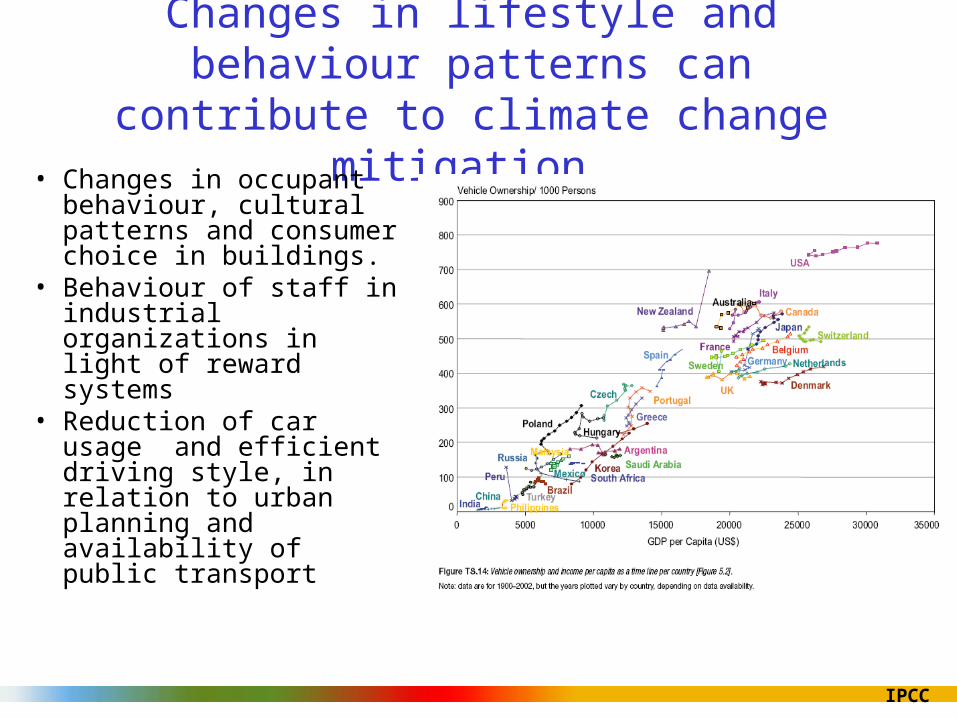
Changes in lifestyle and behaviour patterns can contribute to climate change mitigation
• Changes in occupant behaviour, cultural patterns and consumer choice in buildings.
• Behaviour of staff in industrial organizations in light of reward systems
• Reduction of car usage and efficient driving style, in relation to urban planning and availability of public transport

IPCC
What are the macro-economic costs in 2030?
Trajectories towards
stabilization levels
(ppm CO2-eq)
MedianGDP
reduction[1](%)
Range of GDP reduction [2]
(%)
Reduction of average annual GDP growth
rates [3] (percentage points)
590-710 0.2 -0.6 – 1.2 < 0.06
535-590 0.6 0.2 – 2.5 <0.1
445-535[4] Not available < 3 < 0.12
[1] This is global GDP based market exchange rates.[2] The median and the 10th and 90th percentile range of the analyzed data are given.[3] The calculation of the reduction of the annual growth rate is based on the average reduction during the period till 2030 that would result in the indicated GDP decrease in 2030.[4] The number of studies that report GDP results is relatively small and they generally use low baselines.
•Costs are global average for least cost appoaches from top-down models
•Costs do NOT include co-benefits and avoided climate change damages
IPCC
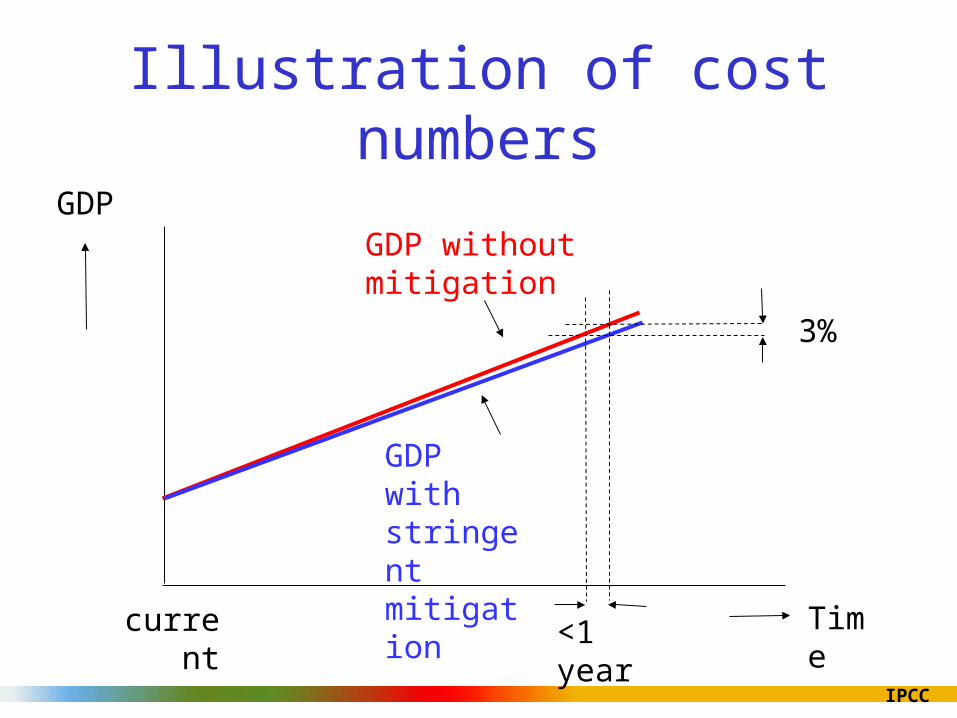
Illustration of cost numbers
GDP without mitigation
GDP with stringent mitigation
GDP
Timecurrent <1 year
3%

IPCC
Technology in the long term
• The range of stabilization levels can be achieved by – deployment of a portfolio of technologies that are
currently available and
– those that are expected to be commercialised in coming decades.
• This assumes that appropriate and effective incentives are in place for development, acquisition, deployment and diffusion of technologies and for addressing related barriers

IPCC
Adaptation• Needed even with very stringent mitigation • Limits to adaptation:
– Certain risks can not be reduced– More serious impacts go beyond adaptive capacity
• Main areas:– Water– Agriculture– Infrastructure– Health– Tourism– Energy
• Adaptation and mitigation are complementary• Costs hardly known

IPCC
Co-benefits of mitigation and relation with adaptation
• Near–term health benefits from reduced air pollution may offset a substantial fraction of mitigation costs
• Mitigation can also be positive for: energy security, balance of trade improvement, provision of modern energy services to rural areas, sustainable agriculture and employment
• Land-use measures positive for improving resilience to climate change and for storing carbon

IPCC
Climate change policies
• Many barriers for implementing low-cost mitigation measures
• Effectiveness of policies depends on national circumstances, their design, interaction, stringency and implementation
• Types of policies:• Regulations and standards • Taxes and charges • Tradable permits • Financial incentives• Voluntary agreements • Information instruments • Research and development

IPCC
Giving CO2 a price is the most important
• Policies that provide a real or implicit price of carbon could create incentives for producers and consumers to significantly invest in low-GHG products, technologies and processes.
• Such policies could include economic instruments, government funding and regulation
• For meeting EU 2 degrees target: about 100 US$/tCO2eq carbon price needed by 2030 (current EU-ETS price ~$ 25)
• But… do not forget the co-benefits

IPCC
Selected sectoral policies, measures and instruments that have shown to be environmentally effective
Sector Policies[1], measures and instruments shown to be environmentally effective
Key constraints or opportunities
Energy supply Reduction of fossil fuel subsidies
Resistance by vested interests may make them difficult to implement
Taxes or carbon charges on fossil fuels
Feed-in tariffs for renewable energy technologies
May be appropriate to create markets for low emissions technologies
Renewable energy obligations
Producer subsidies
[1] Public RD&D investment in low emission technologies have proven to be effective in all sectors.
IPCC
Investments• Energy infrastructure investment decisions, (20 trillion US$ till 2030; 50%
in developing countries) will have long term impacts on GHG emissions.
• The widespread diffusion of low-carbon technologies may take many decades, even if early investments in these technologies are made attractive.
• Returning global energy-related CO2 emissions to 2005 levels by 2030 would require a large shift in the pattern of investment, although the net additional investment required ranges from negligible to 5-10%
• It is often more cost-effective to invest in end-use energy efficiency improvement than in increasing energy supply
IPCC
Climate policy alone will not solve the climate change problem
• Macro-economic policy: taxes, subsidies, other fiscal policies, structural adjustment
• Trade policy: “embodied carbon”, removing barriers for low-carbon products, domestic energy sources
• Energy security policy : efficient energy use, domestic energy sources (low-high carbon)
• Access to modern energy: bioenergy, poverty tariffs• Air quality policy: clean fuel• Bank lending policies: lending for efficiency/ renewables,
avoid lock-in into old technologies in developing countries• Insurance policy: Differentiated premiums, liability insurance
exclusion, improved conditions for green products
IPCC
International agreements• Climate Change Convention (UNFCCC) and Kyoto Protocol :
– Limited reduction of emissions industrialised countries – Array of national policies– International market for CO2 credits– US, Australia not participating; Canada not implementing
• New agreement for after 2012:– Much steeper reduction needed– All countries to contribute, according to capability– Will include adaptation– Bali (December): start of negotiations?
IPCC
The full Report can be downloaded from www.ipcc.ch
orwww.mnp.nl/ipcc
Further information:IPCC Working Group III Technical Support Unit
at the Netherlands Environmental Assessment Agency:[email protected]


![4.- Secrets [Melinda Metz]](https://static.documents.pub/doc/80x56/5571fc184979599169967b52/4-secrets-melinda-metz.jpg)


