Page 1
IPM GIS Mapping: A Tale of Rats and Maps
NEHA 2014 AEC ConventionLas Vegas, NevadaJuly 10th, 2014
Joshua D. Witt, REHSEnvironmental Health Program ManagerUCLA Office of Environment, Health & Safety
Page 2
www.ehs.ucla.edu
UCLA
Founded
StudentsFaculty & Academic StaffStaff PersonnelTotal Campus PopulationAcresPeople/AcreNumber of UC CampusesUCLA Population Density
1919
41,341
10,875
31,262
83,478
419
199.2
10
#1
Page 3
www.ehs.ucla.edu
This rodent found a home
Page 4
Our assumptions
• UCLA will always have a baseline population of rodents due to the following factors:
Page 5
www.ehs.ucla.edu
Bait station analysis
• Sections include:– Building name– Bait station
number– Location– Status/condition
• Media– Pictures–Map of station
status
Page 6
www.ehs.ucla.edu
2008 2009 2010 2011 2012 20130
50
100
150
200
Nu
mb
er
of
Rod
en
t R
ep
ort
sNumber of rodent reports
-67%
Average 2009-2013: 59.6
2008: 181
Year
Page 7
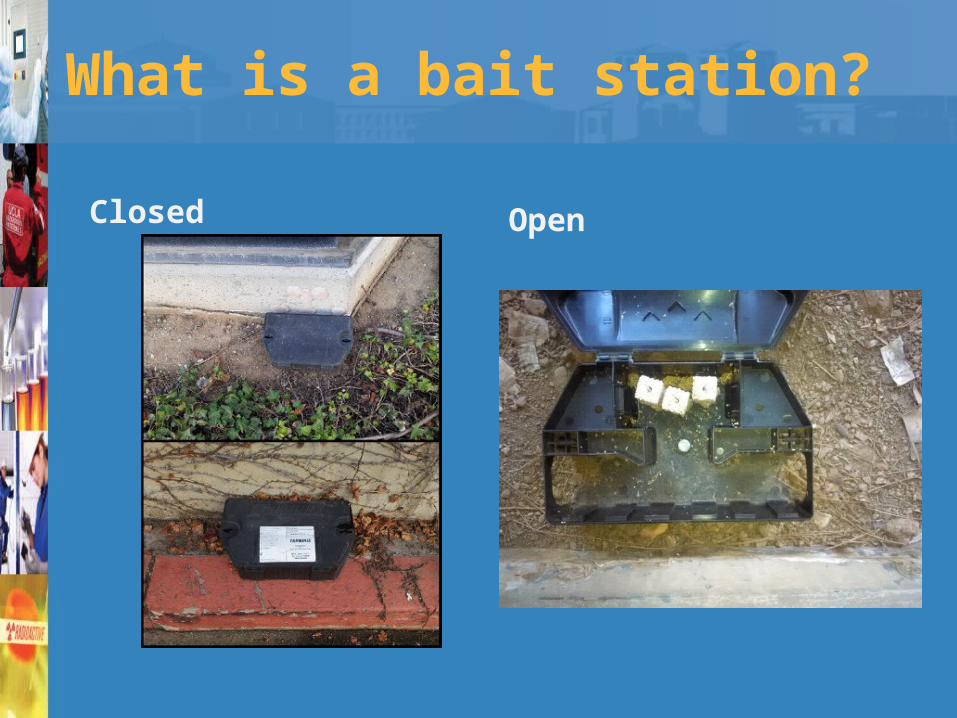
What is a bait station?
OpenClosed
Page 8
www.ehs.ucla.edu
In short:
• Where should we reallocate our rodent bait stations and focus our IPM energy to prevent rodent infestations?
Page 9
www.ehs.ucla.edu
Why we want to limit rodent bait stations
Page 10
www.ehs.ucla.edu
What does GIS mean to us?• Our working definition is: Addressing a complex
problem using intersecting information to create solutions
Page 11
www.ehs.ucla.edu
Why should we visualize our data?
Page 12
www.ehs.ucla.edu
What are our overarching goals?• Optimize our bait station placement to
reduce unnecessary rodenticide
• Demonstrate the viability and usefulness of the GIS project to:– Improve campus Integrated Pest
Management– Increase stakeholder focus and cooperation– Advocate for situation-appropriate resources
Page 13
• Visualize• Question• Analyze• Interpret
What is GIS?
Page 14
www.ehs.ucla.edu
How did we do it?
• Program used: ESRI ArcGIS version 10.1– To be compatible with UCLA GIS-users
–Why is that important?• We need their data and…
Page 15
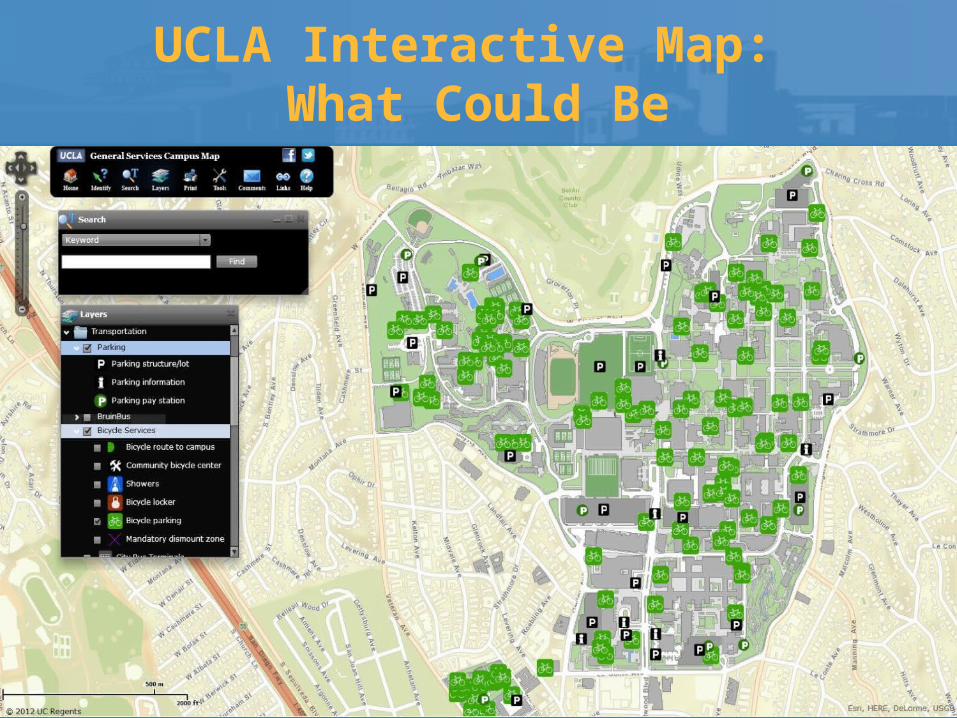
UCLA Interactive Map: What Could Be
Page 16
Which buildings are serviced by EH&S?
• 116/265 buildings (~44%)
• We do not service medical center or housing business units
Page 17
Trash Cans
• # of trash cans: 616
• Trash cans are not rodent proof
Page 18
Age of Building
• Demarcated by 10 year increments
• Shows susceptibility to rodent penetration
• Oldest currently existing building built in 1921
Page 19
Food Facilities
• Areas where the campus community consumes food outdoors
• 53 locations
Page 20
www.ehs.ucla.edu
Dining Areas
10dining areas
Page 21
Rodent Harborage: Algerian Ivy
• 11 ivy patches
Page 22
www.ehs.ucla.edu
Loading Docks
35loading docks
15are
conducive to pests
Page 23
www.ehs.ucla.edu
Vending Machines
49 vending
machines
Page 24
www.ehs.ucla.edu
Given all of that…
• Where do you think the rodent complaints would be?
Page 25
Yearly rodent incident reports:2008-2013
Page 26
www.ehs.ucla.edu
5 year collection of rodent incident reports: 2008-2013
Page 27
www.ehs.ucla.edu
Bait Stations
269bait
stations
Page 28
www.ehs.ucla.edu
Solution: Suitability Model• A model that weights locations relative
to each other based on given criteria
• Suitability models might aid in finding a favorable location for a new facility, road, or habitat for a species of bird
• Basically, suitability models “put it all together”
Page 29
www.ehs.ucla.edu
Suitability Model: How we weighted our factors
1. Rodent Report Locations: 30%2. Trash Cans: 20%3. Building Age: 10%4. Food (facilities + dining areas):
10%5. Ivy: 10%6. Loading Docks: 10%7. Vending Machines: 10%
Page 30
www.ehs.ucla.edu
Suitability Model Map
Page 31
www.ehs.ucla.edu
Credits
• Credit for project management and creating the GIS maps goes to Alan Chen, MPH and Airalee E. Rivera
• Special thanks to Jennie Wung, REHS