39
IPO Underpricing: What about the Shipping Sector? Valeriia Klova, University of Stavanger 1 , Norway E-mail: [email protected] 1 This work was supported by the University of Stavanger.

IPO Underpricing: What about theShipping Sector?
Valeriia Klova,
University of Stavanger1, Norway
E-mail:[email protected]
1This work was supported by the University of Stavanger.

IPO Underpricing: What about the Shipping Sector?
Abstract
This paper looks at IPO underpricing in a shipping sector. This sector presents interest as it
has unique characteristics, among them pro-cyclicality, long history and ownership concentration.
Moreover, an average level of underpricing in shipping is reported to be substantially lower than an
overall level. The effects of shipping-specific factors on underpricing are exhaustively studied in this
paper for the first time. In connection with shipping characteristics, we hypothesize several theories
of underpricing to be relevant explanations of underpricing in a shipping sector. More specifically,
we investigate an investor sentiment theory as shipping is highly exposed to business cycles, an
information asymmetry argument as there seems to be low information asymmetry in shipping,
and two ownership and control theories by Brennan and Franks and Stoughton and Zechner due to
highly-concentrated ownership in a shipping sector. In addition, we consider a partial adjustment
theory that has gained substantial empirical support in the literature. In order to test aforemen-
tioned theories and shipping-specific factors, we perform a cross-sectional regression analysis using
a sample of 60 shipping IPOs from four different stock exchanges. The partial adjustment theory
and the Stoughton and Zechner agency cost theory are supported by the results, while the investor
sentiment theory, information asymmetry argument and the Brennan and Franks managerial control
theory are rejected. Importantly, the Stoughton and Zechner theory and downward price revisions
prevalent among shipping firms are able to partially explain low underpricing “puzzle” in shipping.
1

1 Introduction
This paper investigates initial public offerings (IPOs) in shipping firms. We choose to focus on
this particular sector because of its unique characteristics. More specifically, shipping firms tend to
have a highly-concentrated ownership structure. Shipping is also a sector that is more exposed to
business cycles. Both these characteristics have been hypothesized to be important for firms’ IPO
decisions. We therefore advocate the sector-level approach for explaining IPO performance as it
may give us further insights into a well-known “puzzle” of IPO underpricing.
The existing IPO literature concentrates on an overall IPO market and does not fully control
for firm-specific characteristics. As firm characteristics may differ across industries, studies at a
sector level should be encouraged. While shipping IPOs have been investigated before (Grammenos
and Marcoulis (1996), Merikas, Gounopoulos, and Nounis (2009)), this paper considers additional
shipping-specific factors and underpricing theories. We suggest to look at characteristics that make
a shipping sector distinct from other sectors, such as, pro-cyclicality, highly-concentrated own-
ership, high tangibility, and long history. Typically, shipping firms are family-owned or have a
highly-concentrated ownership structure that may positively impact underpricing according to the
managerial control theory (Brennan and Franks, 1997). On the contrary, the agency cost theory
by Stoughton and Zechner (1998) suggests a negative relationship between family ownership and
underpricing as family firms are less exposed to agency problems. Neither of these control theories
has gained sufficient empirical support, hence, it is difficult to claim that one theory is superior to
another one and further testing is required. Merikas et al. (2009) argue that the shipping sector
should exhibit lower information asymmetry, due to high tangibility and long history. Another
distinct feature of the shipping industry is its exposure to business cycles. As reported by Ritter
(1984), IPO underpricing is higher during the “hot” periods and respectively lower during the “cold”
periods in the market. Such herding behavior of investors in the “hot” markets, which results in
first-day positive abnormal returns, is consistent with an investor sentiment theory of underpricing.
Furthermore, pro-cyclicality might be able to resolve the long-term IPO underperformance “puz-
zle”. As investors are overly optimistic about “hot” IPOs, the presumed underpricing could simply
arise from bubble-pricing, while long-term underperformance can be regarded as mean reversion of
a price to the fundamental value. Thus, the effect of business cycles on IPO performance in the
2

shipping sector is likely to be significant. This paper, therefore, hypothesizes that the aforemen-
tioned unique characteristics related to shipping may shed light on the sources of IPO underpricing.
In addition to the investor sentiment theory and two ownership and control theories, we also test
a partial adjustment theory by Benveniste and Spindt (1989). This theory has gained considerable
empirical support in the literature and seems to be an adequate explanation of underpricing from
a theoretical viewpoint.
In this paper, we investigate different IPO underpricing explanations using a sample of 60
shipping IPOs from four different stock exchanges, associated with a developed shipping sector,
namely, NYSE, NASDAQ, London Stock Exchange (LSE) and Oslo Stock Exchange (OSE). We find
an average underpricing of 2.8% in our sample of shipping IPOs. Conforming to our expectations,
the partial adjustment theory is able to explain most of the variation in shipping IPO underpricing.
Additionally, our results reveal that the Stoughton and Zechner agency cost theory can partially
explain underpricing. This result clearly undermines the Brennan and Franks managerial control
theory. The sample in our analysis also renders the investor sentiment theory and information
asymmetry argument insignificant. Among shipping-specific factors, we find post-IPO ownership
concentration and pre-IPO family ownership to be significant.
The results of this paper can be useful for managers and investors in their decision-making. For
instance, no evidence for the investor sentiment theory would eliminate any incentives to time the
IPO (to go public during the “hot” periods or upturns rather than during the “cold” periods or
downturns). While from investors’ perspective, short-term investing in non-family IPOs, and then
realizing profits from underpricing is an optimal strategy. Hence, more empirical evidence on IPO
performance driving forces will enable decision-makers to make more informed decisions.
The main contribution of this paper is empirical testing of sector-relevant IPO underpricing
theories and factors, in contrast to other studies, that focus only on several leading theories. The
findings of this paper can be also relevant outside shipping, for example, for other sectors that
exhibit similar characteristics. The energy sector and industrial sector share several characteristics
with a shipping sector, such as, sensitivity to business cycles, highly-concentrated ownership, high
tangibility and low total asset turnover. Therefore, IPO underpricing in those sectors might be
driven by the same factors and explained by the same theories as in shipping. While, in information
technology sector and telecommunications sector, which exhibit opposite characteristics, we should
3

expect theories with mirrored predictions of effects on underpricing to be relevant, as well as high
underpricing. Hence, the results of this paper have a potential to be applicable to other sectors
and, therefore, are of essential interest to a broader audience.
2 Related literature
The initial public offering (IPO) is the public sale of firm’s stock for the first time. There is a
number of reasons why firms choose to go public, such as, capital needs, publicity, potential M&As,
diversification. However, it is agreed in the literature, that the primary reason for going public is
the need to raise capital for firm’s investment or production activities. Therefore, it is natural to
assume that an optimal pricing strategy for a firm would be to set the highest possible price based
on the market valuation of stock. This is not what we observe, however, as IPO firms tend to
underprice stock, i.e. the offer price is lower than the fair value of stock. The argument regarding
firm’s inability to incorporate public and private information into the offer price seems an unlikely
explanation of underpricing since the bookbuilding method dominates in the majority of countries.
Subsequently, investors’ demand and valuation of stock is no longer a “black box” for issuers, which
is suggestive of deliberate underpricing. This explanation is rather puzzling and raises even more
questions. For instance, why do firms underprice even though they miss out on IPO proceeds?
What are the issuer’s motives for a seemingly suboptimal behavior?
2.1 Theories of underpricing
A vast amount of literature is dedicated to resolving the IPO underpricing “puzzle”, and con-
sequently, the comparative analysis of existing underpricing theories is quite challenging. Among
numerous studies, we hold reviews of IPO underpricing theories by Jenkinson and Ljungqvist (2001),
Ljungqvist (2005), and Ritter and Welch (2002) in high regard. Jenkinson and Ljungqvist (2001)
suggest the following classification of IPO underpricing theories: asymmetric information, ownership
and control, and institutional theories. Ljungqvist (2005) additionally points out behavioral theo-
ries of underpricing. Ritter and Welch (2002) divide existing underpricing theories into asymmetric
information and symmetric information theories. We will refer to the classification by Ljungqvist
(2005) as it is more specific and clarifying compared to others (see Table 1).
4
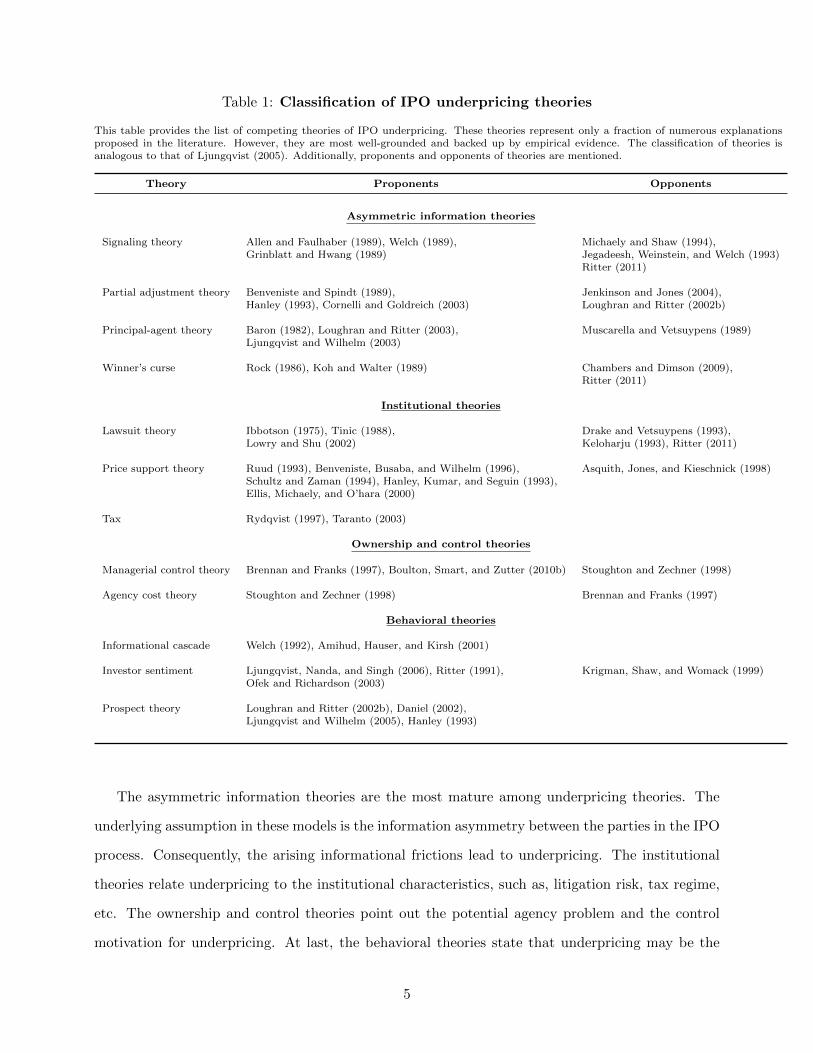
Table 1: Classification of IPO underpricing theories
This table provides the list of competing theories of IPO underpricing. These theories represent only a fraction of numerous explanationsproposed in the literature. However, they are most well-grounded and backed up by empirical evidence. The classification of theories isanalogous to that of Ljungqvist (2005). Additionally, proponents and opponents of theories are mentioned.
Theory Proponents Opponents
Asymmetric information theories
Signaling theory Allen and Faulhaber (1989), Welch (1989), Michaely and Shaw (1994),Grinblatt and Hwang (1989) Jegadeesh, Weinstein, and Welch (1993)
Ritter (2011)
Partial adjustment theory Benveniste and Spindt (1989), Jenkinson and Jones (2004),Hanley (1993), Cornelli and Goldreich (2003) Loughran and Ritter (2002b)
Principal-agent theory Baron (1982), Loughran and Ritter (2003), Muscarella and Vetsuypens (1989)Ljungqvist and Wilhelm (2003)
Winner’s curse Rock (1986), Koh and Walter (1989) Chambers and Dimson (2009),Ritter (2011)
Institutional theories
Lawsuit theory Ibbotson (1975), Tinic (1988), Drake and Vetsuypens (1993),Lowry and Shu (2002) Keloharju (1993), Ritter (2011)
Price support theory Ruud (1993), Benveniste, Busaba, and Wilhelm (1996), Asquith, Jones, and Kieschnick (1998)Schultz and Zaman (1994), Hanley, Kumar, and Seguin (1993),Ellis, Michaely, and O’hara (2000)
Tax Rydqvist (1997), Taranto (2003)
Ownership and control theories
Managerial control theory Brennan and Franks (1997), Boulton, Smart, and Zutter (2010b) Stoughton and Zechner (1998)
Agency cost theory Stoughton and Zechner (1998) Brennan and Franks (1997)
Behavioral theories
Informational cascade Welch (1992), Amihud, Hauser, and Kirsh (2001)
Investor sentiment Ljungqvist, Nanda, and Singh (2006), Ritter (1991), Krigman, Shaw, and Womack (1999)Ofek and Richardson (2003)
Prospect theory Loughran and Ritter (2002b), Daniel (2002),Ljungqvist and Wilhelm (2005), Hanley (1993)
The asymmetric information theories are the most mature among underpricing theories. The
underlying assumption in these models is the information asymmetry between the parties in the IPO
process. Consequently, the arising informational frictions lead to underpricing. The institutional
theories relate underpricing to the institutional characteristics, such as, litigation risk, tax regime,
etc. The ownership and control theories point out the potential agency problem and the control
motivation for underpricing. At last, the behavioral theories state that underpricing may be the
5

result of the behavioral biases of the parties. This bunch of theories represents a real challenge
for researchers, as they cannot be easily tested or verified. Among aforementioned theories of
underpricing, the partial adjustment theory and the investor sentiment theory seem to have gained
most support from both theoreticians and practitioners. Other theories, such as, ownership and
control theories and behavioral theories are still at a development and testing stage. Importantly,
according to Ritter (2011), there are no universal explanations of underpricing, but country- or
market-relevant explanations:
The asymmetric information-based theories would be plausible if the average first-day
return was in the vicinity of 2%, or maybe even 5%. In almost all countries, average
underpricing is noticeably higher than this. In some cases, such as China, institutional
constraints explain severe underpricing. In other cases, I think that agency problems
between issuers and underwriters, combined with a willingness of at least some issuers
to focus on factors other than maximizing the net proceeds raised in the IPO, are
important.
Therefore, the specifics of a particular market should be taken into account and related to
underpricing in that market.
2.2 Evidence on IPO underpricing
Despite a substantial body of literature dedicated to resolving the IPO underpricing puzzle, a
consensus has not been reached. The stylized facts of IPO underpricing and long-term underper-
formance appear to be the only consistent finding across numerous studies in the multiple markets.
Table 2 reports the average levels of underpricing and post-IPO performance across different coun-
tries, as well as globally. The average underpricing appears to vary substantially across countries
and over time. Stoll and Curley (1970), Logue (1973), Reilly (1973), and Ibbotson (1975) first
reported positive abnormal initial returns or underpricing of initial public offerings. Ritter and
Welch (2002) document an average underpricing of 18.8% in US during 1980-2001. Loughran and
Ritter (2003) also document the change in IPO underpricing over time, specifically, they show that
it has increased dramatically since 1980s. Further, IPO firms with larger positive abnormal returns
seem to underperform more in the long-term (see Table 2). Such significant underperformance in
6
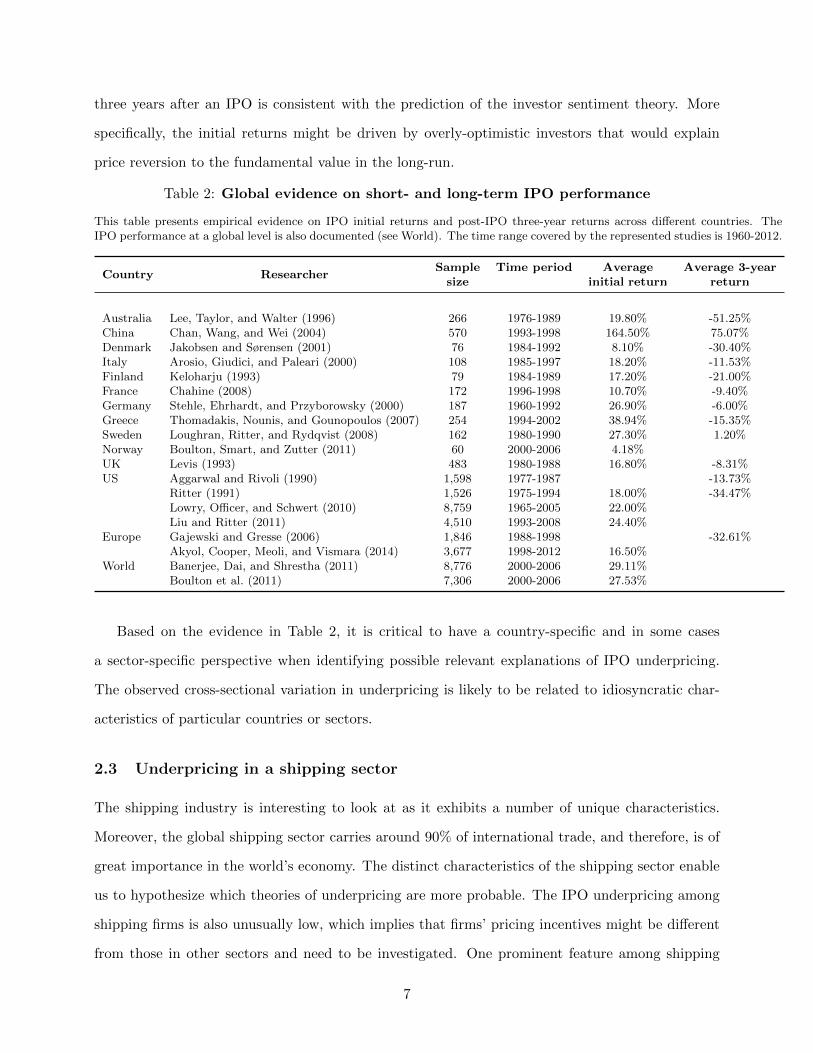
three years after an IPO is consistent with the prediction of the investor sentiment theory. More
specifically, the initial returns might be driven by overly-optimistic investors that would explain
price reversion to the fundamental value in the long-run.
Table 2: Global evidence on short- and long-term IPO performance
This table presents empirical evidence on IPO initial returns and post-IPO three-year returns across different countries. TheIPO performance at a global level is also documented (see World). The time range covered by the represented studies is 1960-2012.
Country ResearcherSample Time period Average Average 3-yearsize initial return return
Australia Lee, Taylor, and Walter (1996) 266 1976-1989 19.80% -51.25%China Chan, Wang, and Wei (2004) 570 1993-1998 164.50% 75.07%Denmark Jakobsen and Sørensen (2001) 76 1984-1992 8.10% -30.40%Italy Arosio, Giudici, and Paleari (2000) 108 1985-1997 18.20% -11.53%Finland Keloharju (1993) 79 1984-1989 17.20% -21.00%France Chahine (2008) 172 1996-1998 10.70% -9.40%Germany Stehle, Ehrhardt, and Przyborowsky (2000) 187 1960-1992 26.90% -6.00%Greece Thomadakis, Nounis, and Gounopoulos (2007) 254 1994-2002 38.94% -15.35%Sweden Loughran, Ritter, and Rydqvist (2008) 162 1980-1990 27.30% 1.20%Norway Boulton, Smart, and Zutter (2011) 60 2000-2006 4.18%UK Levis (1993) 483 1980-1988 16.80% -8.31%US Aggarwal and Rivoli (1990) 1,598 1977-1987 -13.73%
Ritter (1991) 1,526 1975-1994 18.00% -34.47%Lowry, Officer, and Schwert (2010) 8,759 1965-2005 22.00%Liu and Ritter (2011) 4,510 1993-2008 24.40%
Europe Gajewski and Gresse (2006) 1,846 1988-1998 -32.61%Akyol, Cooper, Meoli, and Vismara (2014) 3,677 1998-2012 16.50%
World Banerjee, Dai, and Shrestha (2011) 8,776 2000-2006 29.11%Boulton et al. (2011) 7,306 2000-2006 27.53%
Based on the evidence in Table 2, it is critical to have a country-specific and in some cases
a sector-specific perspective when identifying possible relevant explanations of IPO underpricing.
The observed cross-sectional variation in underpricing is likely to be related to idiosyncratic char-
acteristics of particular countries or sectors.
2.3 Underpricing in a shipping sector
The shipping industry is interesting to look at as it exhibits a number of unique characteristics.
Moreover, the global shipping sector carries around 90% of international trade, and therefore, is of
great importance in the world’s economy. The distinct characteristics of the shipping sector enable
us to hypothesize which theories of underpricing are more probable. The IPO underpricing among
shipping firms is also unusually low, which implies that firms’ pricing incentives might be different
from those in other sectors and need to be investigated. One prominent feature among shipping
7

firms is long histories, which is complemented with old traditions and strong networks. Furthermore,
the shipping industry is mainly associated with tangible assets. Long history and high tangibility,
consequently, imply lower information asymmetry experienced by shipping firms compared to other
firms. Another feature is a more pronounced impact of business cycles on the performance in the
shipping sector. Further, shipping firms are mostly family-owned or have a highly-concentrated
ownership structure and, therefore, tend to experience less severe agency problem. In addition,
the shipping industry is very volatile and highly-levered. The recent trend towards going public
via an IPO can be explained by the high leverage of shipping firms as they need to finance large
investments. Lastly, the growth in the shipping sector is quite rapid and mostly realized through
M&A activity. The essential characteristics of the shipping sector, outlined in previous studies, are
summarized in Table 3.
Table 3: Shipping sector characteristics
This table summarizes shipping-specific characteristics reported in the literature.
Characteristic Researcher
Long history Merikas et al. (2009)Family ownership Harlaftis and Theotokas (2004)Pro-cyclicality Stopford (1997)High tangibility Stopford (1997)High volatility Stopford (1997)High leverage Stopford (1997)M&A activity Alexandrou, Gounopoulos, and Thomas (2014)
The aforementioned shipping characteristics may have an impact on IPO underpricing in the
shipping sector. Moreover, these unique features may indicate which underpricing theories are more
plausible explanations of IPO underpricing in shipping. For instance, the low level of underpricing
can be related to long history and high tangibility, based on the information asymmetry argument.
While concentrated or family ownership may provide incentives for higher underpricing among
shipping IPOs according to the Brennan and Franks managerial control theory. The opposite
prediction is yielded by the Stoughton and Zechner agency cost theory. Pro-cyclicality of the
shipping industry is supportive of the investor sentiment theory. Therefore, it seems reasonable to
investigate the outlined theories as they are particularly relevant for the shipping sector.
8

The IPO underpricing in a shipping sector is relatively unresearched, and there are only a few
shipping IPO studies to the author’s knowledge. It is also evident from Table 2 that IPO underpric-
ing and long-term underperformance in the shipping sector is relatively small. The shipping IPO
studies report average underpricing of 2-5%. Therefore, the shipping sector presents interest for
researchers from two perspectives: (1) it has unique characteristics that can possibly explain lower
underpricing in this sector, and (2) there is a room for research as only the mainstream theories of
underpricing and a few shipping characteristics have been tested.
IPO performance in a global shipping sector was first investigated by Grammenos and Marcoulis
(1996) with a small sample of 31 IPOs, and later by Merikas et al. (2009), with a larger sample of
143 IPOs over a longer time period. Grammenos and Marcoulis (1996) find an average underpricing
of 5.32% in their sample. Their paper concentrates on testing the effects of gearing and age of
fleet on IPO performance as shipping firms are mostly high-levered and have long histories. They
find that long-term performance is positively related to the financial leverage and negatively related
to the average age of fleet. Merikas et al. (2009) find considerably higher underpricing of 17.69%.
Their paper captures the relation between the business cycles and IPO performance, in addition to
testing the effects of the trivial firm- and deal-specific factors. Merikas et al. (2009) show that in the
periods of economic expansion, IPOs tend to be more underpriced, and vice versa. With respect to
the long-term performance, “hot” IPOs tend to underperform in the long-term, while “cold” IPOs
outperform, which can be explained by the price reversion. These findings provide support for an
investor sentiment theory of underpricing. Further, their study somewhat incorporates shipping
specifics into the analysis, though, it still leaves out some important characteristics unique for
shipping. In particular, they hypothesize the age of the firm to have a negative impact on IPO
underpricing and a positive impact on the long-term performance. Both predictions are based on
the information asymmetry argument and receive empirical support in their study. Other factors
considered in their analysis are not shipping-related and, consequently, cannot account for the
effects present exclusively in shipping. According to Merikas et al. (2009), this sector should exhibit
lower information asymmetry2 and underpricing respectively compared to other sectors. Their
paper does not develop any further theoretical predictions in this regard and, hence, leaves more
2First, the market value is associated with the value of physical assets, i.e. shipping industry exhibits hightangibility. Second, extensive information flows reduce information asymmetry.
9
thorough investigation of shipping-specific factors to forthcoming research. The authors also find
that both underpricing and long-term underperformance are lower in the shipping sector than the
levels reported in the overall market. This empirical fact provides even stronger incentives to
analyze the effects of shipping-related factors. There are no other empirical studies, at least to
our knowledge, that consider shipping-specific characteristics in the IPO analysis at a cross-country
level.
Further, there are two US studies, worth of our attention, as they examine IPO performance
in the shipping sector and take into account shipping market conditions and maturity. Merikas,
Gounopoulos, and Karli (2010) investigate a signaling explanation of the initial and long-term IPO
returns. Their sample consists of 61 IPOs listed during 1987 - 2007. The authors report an average
underpricing of only 4.44% and hypothesize that low underpricing is related to the maturity of
the shipping sector. Grammenos and Papapostolou (2012) empirically test two leading asymmetric
information theories of underpricing, namely, a partial adjustment theory and a winner’s curse
theory. The data set contains 51 shipping firms and covers the period of 1987 - 2008. They report
an average underpricing of 2.69%. Their findings provide support for the partial adjustment theory,
but inconsistent with the winner’s curse theory. Furthermore, it is a first study in shipping that
examines predictability of likelihood of underpricing. The authors find market conditions, price
revision, operating efficiency, and gearing to be significant factors. In particular, the shipping
market sentiment is positively related to the probability of underpricing. Overall, their results
are indicative of no information asymmetry in the shipping IPO market since the probability of
underpricing can be predicted based on the publicly available information.
This paper considers a broader set of shipping-specific characteristics compared to previous
studies. These factors are also the means for testing several underpricing theories: the information
asymmetry argument, the investor sentiment theory, and ownership and control theories.
3 Hypotheses
3.1 Development of hypotheses
This paper focuses on investigating several IPO underpricing theories and factors, considered to
be the most relevant for a shipping sector. First, the investor sentiment theory by Ljungqvist
10

et al. (2006) may be a plausible explanation of underpricing in a shipping sector because this
sector is more exposed to business cycles than others. The investor sentiment theory posits that
underpricing is the result of irrational investors’ behavior. More specifically, underpricing is claimed
to be driven by overly-optimistic investors that push the price beyond the true value. The main
prediction of this theory is price reversion to the fundamental value in the long-run. This theory
has gained considerable empirical support in the literature. The inherent assumptions regarding
investor sentiment and short-sale constraints also seem realistic. The former assumption is not
surprising since IPO firms are typically young, informationally opaque companies, and therefore,
hard to value. The latter assumption corresponds to IPO regulations in most countries. The investor
sentiment theory is tested by including market-specific variables into the regression analysis, such
as, stock market sentiment, shipping market sentiment, and IPO frequency3. These variables are
used as proxies for investors’ optimism and, consequently, are expected to be positively related to
IPO underpricing. The positive relationship between these variables and underpricing is reported
in earlier studies by Ritter (1984), Grammenos and Papapostolou (2012), and Merikas et al. (2009).
Hypothesis 1: The market-specific variables, such as, stock market sentiment, shipping market
sentiment, IPO frequency, are positively related to IPO underpricing in a shipping sector.
Another probable explanation of underpricing in a shipping sector is control consideration of
the owners. There are two diametrically opposing ownership and control theories of underpricing:
a managerial control theory (Brennan and Franks, 1997) and an agency cost theory (Stoughton and
Zechner, 1998). Both theories share an assumption of the potential agency problem in IPO firms,
however, they provide completely different predictions and reasons for underpricing.
The managerial control theory by Brennan and Franks states that firms underprice in order to
generate excess demand for shares, which results in a dispersed ownership structure. Unlike large
investors, small investors have no incentives to monitor, which allows the manager to retain the
private benefits of control. Hence, the relationship between the post-IPO ownership concentration
and IPO underpricing should be negative. This prediction is supported with empirical evidence in
Boulton, Smart, and Zutter (2010a). Moreover, the survey among CFOs of publicly listed firms by
Brau and Fawcett (2006) reveals that in the majority of cases the motivation behind underpricing
is a desire for dispersed ownership structure, which is consistent with a managerial control theory.
3High IPO frequency indicates the hot period in the IPO market, while low frequency - the cold period.
11
Though, underpricing is not the only way to protect manager’s private benefits of control. The
manager can alternatively use takeover defences or issue non-voting stock. Interestingly, firms that
employ these types of protection are still underpriced (Field and Karpoff (2002), Aruaslan, Cook,
and Kieschnick (2004)), which means that a managerial control theory is not a whole story.
In contrast to Brennan and Franks theory, the agency cost theory by Stoughton and Zechner
assumes that monitoring, which is used to prevent the agency problem, is actually value-enhancing
for the firm and for the manager as well. To encourage monitoring, managers can allocate large
stakes to investors, and compensate their illiquidity through underpricing. This is feasible due to
discretionary allocation of shares assumption in this theory (while pro-rata allocation is assumed in
Brennan and Franks theory). Hence, the role of underpricing is to attract blockholders who engage
in monitoring and, thereby, mitigate the agency problem.
This paper also hypothesizes that family-owned shipping firms have incentives to underprice
more/less dependent on which theory is assumed to be valid. Given that Brennan and Franks
theory is true, family firms are likely to underprice more in order to create dispersed ownership and
retain private benefits of control (Chambers, 2012). The Stoughton and Zechner theory provides
an opposite prediction, i.e. less underpricing in family firms where the agency problem is not a
big concern4. The lower information asymmetry associated with family firms, should also lead to
lower underpricing. Consistent with the prediction of the agency cost theory and the information
asymmetry argument, Daugherty and Jithendranathan (2012) find that family firms experience less
underpricing compared to non-family firms.
Hypothesis 2: Post-IPO ownership concentration and pre-IPO family ownership are related
to IPO underpricing in a shipping sector.
This paper also investigates the relevance of the information asymmetry argument for underpric-
ing by including the firm age, the current ratio, the measure of tangibility, the total asset turnover
and the gearing ratio into the analysis. These factors impact the level of information asymmetry and
can, therefore, be important determinants of IPO underpricing. Moreover, shipping firms typically
have long histories, low liquidity, substantial tangibility, low total asset turnover and high leverage.
As these factors seem to be essential for shipping, their effect on IPO underpricing in this sector
4Family firms typically do not experience agency conflicts as there is often no separation of ownership and man-agement (Villalonga and Amit, 2006).
12

through the information asymmetry channel, can be significant. Ritter (1984) argues that there is
a positive relationship between ex-ante uncertainty and IPO underpricing. As shipping firms have
longer histories, more information is available to the public and they experience less uncertainty.
Therefore, underpricing should be lower among shipping firms. The predicted negative relation-
ship is confirmed by Su and Fleisher (1999), Loughran and Ritter (2002a), and Chahine (2008).
High tangibility is another important feature of the shipping industry. As argued in Merikas et al.
(2009), it results in lower information asymmetry, and less underpricing respectively. However,
shipping firms also tend to be highly-levered, which implies larger uncertainty (Chen, Firth, and
Kim, 2004) and, consequently, more underpricing. The current ratio, which is a proxy for liquidity,
is hypothesized to be negatively related to underpricing, based on the previous evidence. The total
asset turnover is a measure of operational efficiency of the firm, and was previously shown to be
positively related to underpricing. Engelen (2003), Hauser, Yaari, Tanchuma, and Baker (2006),
and Grammenos and Papapostolou (2012) provide supportive evidence for these predictions.
Hypothesis 3: Firm-specific factors, such as, firm age, current ratio and tangibility, are neg-
atively related to underpricing in the shipping sector, while turnover and gearing are positively
related.
The last theory to be tested is the partial adjustment theory of underpricing by Benveniste
and Spindt, which is one of the leading theories in the field. The transition from the fixed-price
offerings with a pro-rata allocation rule towards bookbuilding IPOs with a discriminatory allocation
of shares gave rise to a so-called bookbuilding theory of underpricing. The information revelation or
partial adjustment theory of underpricing (Benveniste and Spindt, 1989) is based on the assumption
that the underwriter is less informed than investors in a bookbuilding IPO setting. Consequently,
investors with positive information might understate their demand for the stock during the “road
show” in attempt to deflate the IPO price. In response, the underwriter can use underpricing as
an incentive device for investors so that they reveal their private information truthfully. Due to
underpricing, the positive information received from investors is not fully, but partially, incorporated
into the final offer price (Hanley, 1993). This theory suggests that underpricing is beneficial for
all parties involved in the IPO. The underwriter and the issuer become informed about the market
valuation of the issue and partially adjust the offer price, while investors earn positive abnormal
initial returns. The price revision variable is commonly used to test the partial adjustment theory.
13
An upward revision in the final offer price from the midpoint of the initial price range is indicative
of high investor demand for the stock. It follows from this theory that investors reveal positive
information only if they are incentivized through underpricing, which is often accompanied by large
share allocations. It is optimal for the issuer to rely more on the share allocation reward to investors
rather than underpricing, since the latter is costly. Importantly, underpricing is still a necessary
condition for truth-telling from investor side. Hence, a larger upward price revision implies higher
underpricing. In other words, the more positive the information, the more underpricing is required.
The price revision (PR) can be defined as the relative difference between the final offer price (Poffer)
and the midpoint (Midpoint) of the initial filing price range:
PRi =Pi,offer
Midpointi− 1 (1)
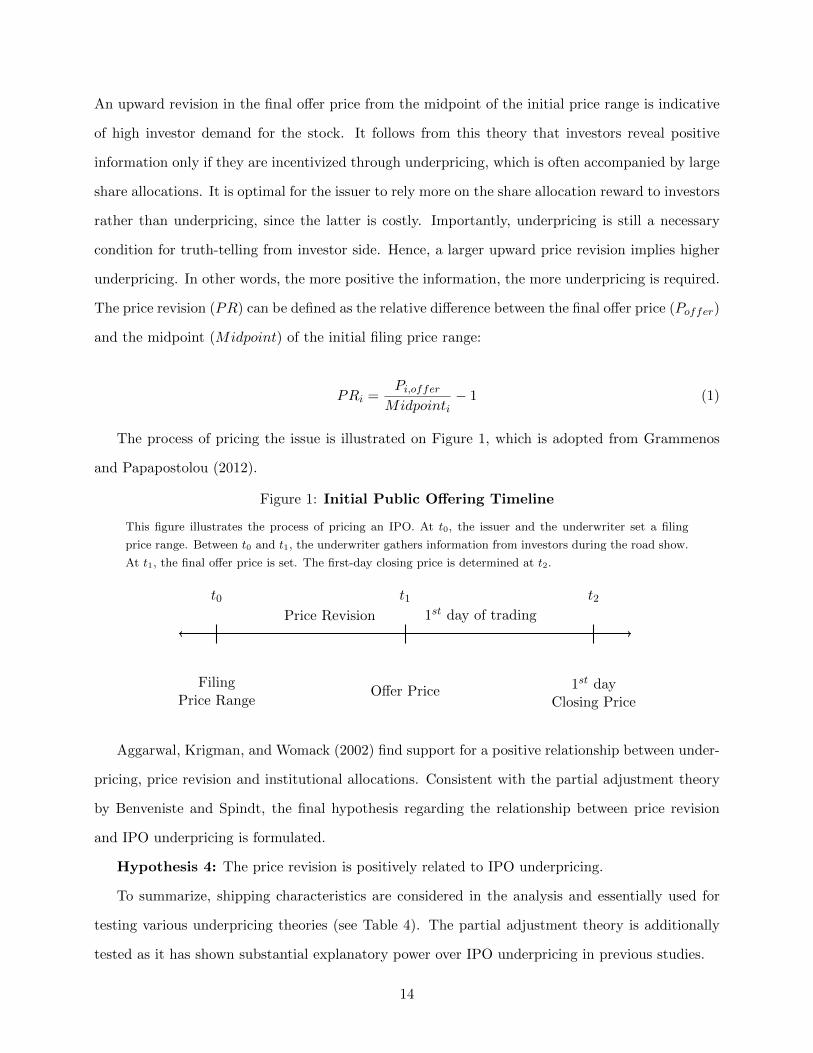
The process of pricing the issue is illustrated on Figure 1, which is adopted from Grammenos
and Papapostolou (2012).
Figure 1: Initial Public Offering Timeline
This figure illustrates the process of pricing an IPO. At t0, the issuer and the underwriter set a filing
price range. Between t0 and t1, the underwriter gathers information from investors during the road show.
At t1, the final offer price is set. The first-day closing price is determined at t2.
t0 t1 t2
FilingPrice Range
Offer Price 1st dayClosing Price
Price Revision 1st day of trading
Aggarwal, Krigman, and Womack (2002) find support for a positive relationship between under-
pricing, price revision and institutional allocations. Consistent with the partial adjustment theory
by Benveniste and Spindt, the final hypothesis regarding the relationship between price revision
and IPO underpricing is formulated.
Hypothesis 4: The price revision is positively related to IPO underpricing.
To summarize, shipping characteristics are considered in the analysis and essentially used for
testing various underpricing theories (see Table 4). The partial adjustment theory is additionally
tested as it has shown substantial explanatory power over IPO underpricing in previous studies.
14

Table 4: The effect of shipping-specific factors on IPO underpricing
This table links shipping-specific factors to the mainstream theories of underpricing. More specifically,
the information asymmetry argument, the investor sentiment theory, and ownership and control theories
can be tested by estimating the relationship between IPO underpricing and shipping-specific factors. The
table also shows the predicted effects on underpricing for the respective factors.
Theory Factor Effect on underpricing
Information asymmetry Firm age ↓Current ratio ↓Tangibility ↓Turnover ↑Gearing ↑
Investor sentiment theory Pro-cyclicality ↑Ownership and control theories Pre-IPO family ownership ↑ / ↓
Post-IPO ownership concentration ↑ / ↓
3.2 Potential determinants of IPO underpricing
For clarity, this paper classifies the potential determinants of IPO underpricing into three categories
(see Table 5): (1) firm-specific factors, (2) deal-specific factors and (3) market-specific factors. The
majority of factors represent shipping characteristics and underpricing theories of interest. The
offer size and return on assets (ROA) are added as control variables. The offer size is predicted
to be negatively related to underpricing, as larger offerings signal better prospects of the firm and
reduce uncertainty associated with an IPO. ROA is a measure of profitability and is expected to be
negatively related to underpricing. A detailed description of all factors is provided in Appendix A.
15
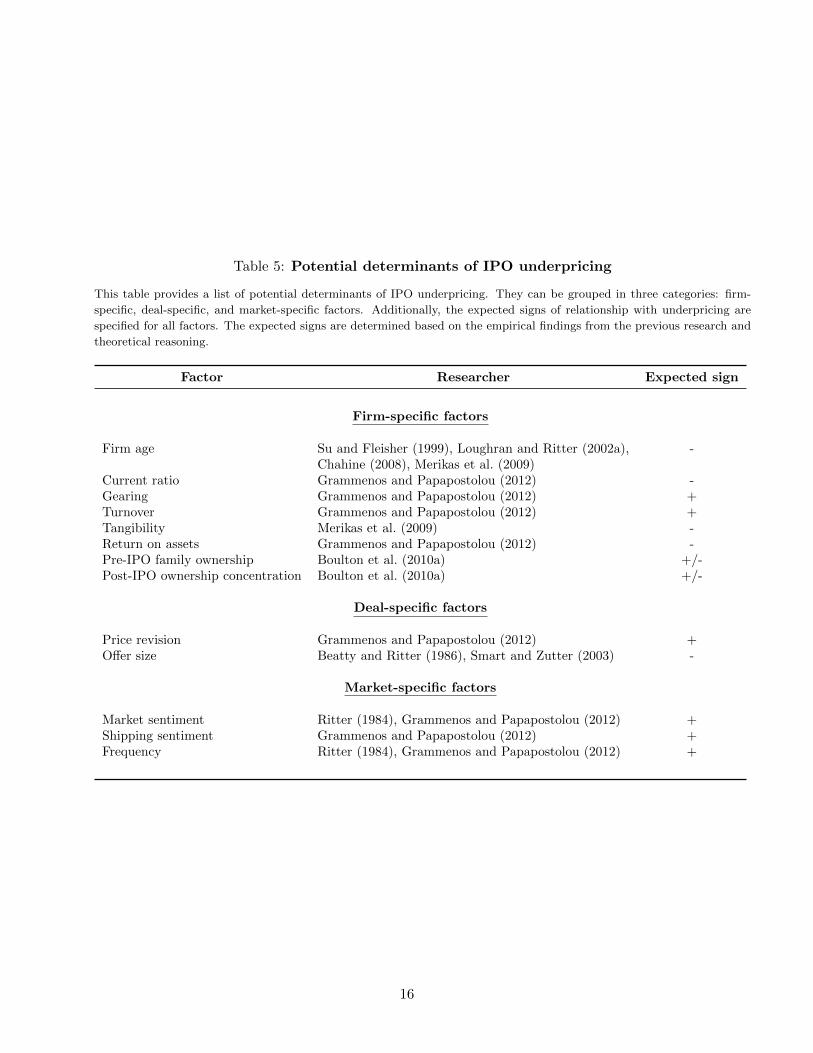
Table 5: Potential determinants of IPO underpricing
This table provides a list of potential determinants of IPO underpricing. They can be grouped in three categories: firm-
specific, deal-specific, and market-specific factors. Additionally, the expected signs of relationship with underpricing are
specified for all factors. The expected signs are determined based on the empirical findings from the previous research and
theoretical reasoning.
Factor Researcher Expected sign
Firm-specific factors
Firm age Su and Fleisher (1999), Loughran and Ritter (2002a), -Chahine (2008), Merikas et al. (2009)
Current ratio Grammenos and Papapostolou (2012) -Gearing Grammenos and Papapostolou (2012) +Turnover Grammenos and Papapostolou (2012) +Tangibility Merikas et al. (2009) -Return on assets Grammenos and Papapostolou (2012) -Pre-IPO family ownership Boulton et al. (2010a) +/-Post-IPO ownership concentration Boulton et al. (2010a) +/-
Deal-specific factors
Price revision Grammenos and Papapostolou (2012) +Offer size Beatty and Ritter (1986), Smart and Zutter (2003) -
Market-specific factors
Market sentiment Ritter (1984), Grammenos and Papapostolou (2012) +Shipping sentiment Grammenos and Papapostolou (2012) +Frequency Ritter (1984), Grammenos and Papapostolou (2012) +
16

4 Data
4.1 Sample
The data set contains 60 IPOs in a shipping sector globally over a period 2004-2015. Specifically,
shipping firms from four leading stock exchanges are considered: NYSE, NASDAQ, London Stock
Exchange and Oslo Stock Exchange. The closing prices, market returns and post-IPO ownership
data are collected from DataStream. The IPO deal-related data is extracted from SDC Platinum.
Founding dates, pre-IPO family ownership and pre-IPO accounting data are gathered manually
from firms’ IPO prospectuses. The price revision variable is obtained only for 46 firms out of 60,
i.e. bookbuilding IPOs, which reduces the sample for estimation involving this variable accordingly.
4.2 Descriptive statistics
The summary statistics for the variables is provided in Table 6. The initial return is 2.8% on average,
which is consistent with the previous research findings. As expected, the initial return does not
seem normally distributed, specifically, it exhibits negative skewness and positive excess kurtosis. It
is also evident from Figure 2 that skewness occurs due to negative outliers. The variables for offer
size and firm age are transformed into the logarithms to achieve normality. Other non-normally
distributed variables, including initial return, cannot be log-transformed as they contain negative
values.
Additionally, disaggregated summary statistics by year and stock exchange for initial return
is presented in Table 8 and 9 respectively. The number of IPOs is quite volatile over the sample
period. Furthermore, the average initial return appears to be higher in years with a larger number
of offerings. This may indicate the hot and cold periods in the shipping IPO market. Similarly,
there is some variation in initial returns across stock exchanges. As shown in Table 9, the LSE issues
exhibit negative initial returns on average, while IPOs on three other stock exchanges are shown
to be underpriced. The highest underpricing is detected on NASDAQ, then on OSE, and lastly
on NYSE. However, even underpricing of 6.8% on Nasdaq is significantly lower than the general
underpricing found in other studies.
Further, a more detailed summary statistics for explanatory variables is presented conditional
17

on the sign of initial return (see Table 7). For instance, it is evident that IPO underpricing appears
when price revision is less negative. The fact that the price revision is negative on average even
for the subsample of underpriced IPOs means that the price revision is not the only driver of un-
derpricing. It also partially explains low underpricing among shipping firms where downward price
revisions are prevalent.
Figure 2: Distribution of initial return
This figure illustrates the statistical distribution of initial return (approximated by
the Epanechnikov kernel density function). The legend states the mean, the standard
deviation, skewness, kurtosis, and the Jarque-Bera test statistic.
01
23
45
Den
sity
-.5 0 .5Initial return
Mean: .028 Std. dev.: .164 Skew: -.313 Kurt: 7.727Jarque-Bera: .002
18

Table 6: Summary statistics
This table provides summary statistics for initial return and explanatory variables. Obs stands forthe number of observations, Median, Min and Max - for median, minimum and maximum valuesrespectively. Along with this statistics, the four statistical moments, such as, mean, standarddeviation, skewness and kurtosis, are specified.
Variable Obs Mean Std. Dev. Median Min Max Skewness Kurtosis
IR 60 .028 .164 .007 -.6 .507 -.313 7.727PR 46 -.072 .131 -.05 -.5 .143 -.842 4.007Size 60 4.845 .879 4.993 1.982 7.129 -.884 4.816Age 60 2.533 1.511 2.250 0 5.7 .335 2.076CR 60 2.355 6.055 .932 .023 43.642 5.68 37.819Tang 60 .734 .247 .811 .094 .991 -1.216 3.547Gear 60 .622 .449 .641 0 3.179 2.892 18.590Turn 60 .443 .802 .193 0 4.579 3.557 16.228ROA 60 .059 .107 0.030 -.136 .519 2.311 9.819OwnConc 60 .417 .497 0 0 1 .338 1.114OutOwn 60 .322 .259 .35 0 .82 .160 1.756Family 60 .367 .486 0 0 1 .553 1.306Freq 60 7.433 2.807 8 1 11 -.539 2.325MktSent 60 .039 .051 .035 -.059 .229 .678 4.715ShipSent 60 .075 .101 .057 -.121 .334 .309 2.664
Table 7: Summary statistics split by initial return
This table provides summary statistics for explanatory variablesconditional on the sign of initial return. The conditions IR > 0and IR < 0 signify underpricing and overpricing accordingly. Thenumber of observations (Obs), the mean and the standard deviationare included.
IR > 0 IR < 0
Obs Mean Std. Dev. Obs Mean Std.Dev.
PR 25 -.015 .106 21 -.139 .126Size 34 4.954 .799 26 4.703 .971Age 34 2.558 1.518 26 2.500 1.530CR 34 3.114 7.664 26 1.361 2.680Tang 34 .740 .216 26 .727 .286Gear 34 .663 .536 26 .568 .304Turn 34 .466 .711 26 .414 .921ROA 34 .070 .127 26 .046 .073OwnConc 34 .471 .507 26 .346 .485OutOwn 34 .354 .254 26 .281 .264Family 34 .265 .448 26 .500 .510Freq 34 7.735 2.767 26 7.038 2.863MktSent 34 .036 .060 26 .044 .039ShipSent 34 .057 .095 26 .097 .106
19

Table 8: Summary statistics for initial return by year
This table provides summary statistics by year for initial return. N stands for thenumber of observations, Min and Max - for minimum and maximum values respectively.Along with this statistics, the four statistical moments, such as, mean, standarddeviation, skewness, and kurtosis are specified.
Year N Mean Std. Dev. Min Max Skewness Kurtosis
2004 4 -.076 .252 -.454 .072 -1.128 2.3122005 11 .045 .117 -.075 .348 1.627 5.142006 9 .088 .183 -.089 .507 1.363 4.092007 9 .011 .272 -.6 .409 -.997 4.2712008 4 -.035 .058 -.09 .028 .08 1.1742010 5 -.036 .02 -.059 -.012 .031 1.4252011 2 .022 .118 -.061 .106 0 12012 1 -.117 . -.117 -.117 . .2013 8 .07 .146 -.017 .424 2.076 5.6552014 6 .07 .108 -.005 .239 .812 1.8192015 1 .009 . .009 .009 . .Total 60 .028 .164 -.6 .507 -.313 7.727
Table 9: Summary statistics for initial return by exchange
This table provides summary statistics by stock exchange for initial return. N standsfor the number of observations, Min and Max - for minimum and maximum valuesrespectively. Along with this statistics, the four statistical moments, such as, mean,standard deviation, skewness, and kurtosis, are specified.
Exc N Mean Std. Dev. Min Max Skewness Kurtosis
LSE 5 -.046 .314 -.6 .174 -1.408 3.142NASDAQ 14 .068 .231 -.454 .424 -.232 3.224NYSE 24 .015 .086 -.117 .239 .942 3.597OSE 17 .034 .131 -.089 .507 2.933 11.403Total 60 .028 .164 -.6 .507 -.313 7.727
20

A preliminary analysis of the association between variables is performed by examining cross-
correlations (see Table 10). The initial return is positively moderately correlated with the price
revision, and positively weakly correlated with the offer size, IPO frequency, post-IPO ownership
concentration and outsider ownership. It is also shown to be negatively weakly correlated with
the pre-IPO family ownership and the market sentiment. The correlation with other explanatory
variables is close to zero, which is suggestive of no relationship. Although, the correlation does not
imply causation, it is still indicative of the underlying relation between variables. Furthermore,
since the explanatory variables are not strongly correlated with one another, there is less likelihood
of multicollinearity problems.
There are several limitations to our data that need to be mentioned. First, the sample size is
rather small, especially, relative to the number of predictors in the model. Hence, dropping some of
the variables is necessary. Second, the dependent variable, initial return, is not normally distributed
due to several negative outliers. Applying standard methods to deal with outliers would definitely
improve the normality of the distribution, but it would also increase the risk of losing important
observations. Since outliers in this case are considered to be legitimate, they are assigned the same
weight as other observations. For obtaining valid inference in non-normality case, robust standard
errors are used.
21

Tab
le10
:C
ross
-corr
ela
tion
tab
le
This
table
show
case
sth
eco
rrel
ati
on
coeffi
cien
tsb
etw
een
all
vari
able
s.T
hes
ecr
oss
-corr
elati
ons
are
defi
ned
base
don
the
case
wis
edel
etio
nm
ethod.
Vari
able
sIR
PR
Siz
eA
ge
CR
Tang
Gea
rT
urn
RO
AO
wnC
onc
OutO
wn
Fam
ily
Fre
qM
ktS
ent
Ship
Sen
t
IR1.0
00
PR
0.4
40
1.0
00
Siz
e0.1
67
0.1
34
1.0
00
Age
-0.0
29
-0.1
74
-0.2
51
1.0
00
CR
0.0
23
0.1
08
-0.1
74
-0.0
61
1.0
00
Tang
-0.0
13
0.2
60
0.3
61
-0.3
04
-0.0
10
1.0
00
Gea
r0.0
54
0.1
25
-0.1
89
0.2
14
-0.2
12
-0.0
84
1.0
00
Turn
0.0
52
-0.1
27
-0.3
63
0.3
89
-0.1
08
-0.6
11
0.2
88
1.0
00
RO
A-0
.011
-0.0
90
-0.1
69
0.0
40
-0.0
83
-0.1
22
0.1
07
0.2
09
1.0
00
Ow
nC
onc
0.2
70
0.2
40
0.0
43
-0.2
68
0.1
43
0.3
11
0.0
64
-0.1
11
-0.2
94
1.0
00
OutO
wn
0.2
27
0.3
04
0.0
31
-0.0
53
0.2
04
0.1
60
-0.1
11
-0.1
10
-0.1
37
0.2
63
1.0
00
Fam
ily
-0.2
23
-0.2
74
-0.0
99
0.1
42
-0.1
70
0.0
91
-0.0
84
-0.1
00
0.2
68
-0.0
82
-0.0
44
1.0
00
Fre
q0.1
94
0.4
45
-0.1
04
-0.1
30
0.1
11
-0.0
27
0.0
34
0.0
39
0.1
02
0.0
75
0.0
22
-0.2
05
1.0
00
MktS
ent
-0.1
76
0.0
10
0.1
34
0.2
14
-0.0
19
0.0
16
0.1
04
0.1
44
0.0
39
-0.1
37
-0.0
96
0.0
48
-0.2
40
1.0
00
Ship
Sen
t-0
.021
0.0
07
0.0
90
0.0
80
-0.0
63
-0.0
17
0.1
64
0.0
68
-0.0
03
-0.0
23
-0.2
19
-0.1
25
-0.0
64
0.5
76
1.0
00
22

5 Results
5.1 Preliminary analysis
The univariate regression analysis is essential for testing hypotheses developed in this paper. The
univariate results can be used to confirm the existence and strength of the relationship between the
variables of interest. However, they should be taken cautiously due to the possibility of the omitted
variable bias, which may result in biased coefficients. The univariate beta coefficients are derived
from the correlations. However, the latter is purely a descriptive statistics of co-movement, while
the former is a measure of observed causal relation - as such, both measures tend to exhibit the
same sign but not the exact numerical values. The results from univariate regressions performed
for all explanatory variables respectively are presented in Table 11.
Table 11: Univariate estimation results
This table shows univariate regression statistics, such as, beta coefficients
(Coefficient), robust standard errors (Std.Err.), and explanatory power
(R2). The significance levels of beta coefficients are based on p-values
and denoted with stars. The dependent variable is Initial Return. The
explanatory variables are potential determinants of underpricing outlined
earlier.
Variable Coefficient (Std. Err.) R2
Price Revision 0.533∗∗∗ (0.159) 0.193Offer Size 0.031 (0.020) 0.028Firm Age -0.003 (0.011) 0.001Current Ratio 0.001 (0.002) 0.001Tangibility -0.009 (0.067) 0.000Gearing 0.020 (0.016) 0.003Turnover 0.011 (0.015) 0.003Return on Assets -0.016 (0.111) 0.000Ownership Concentration 0.089∗∗ (0.042) 0.073Outsider Ownership 0.144 (0.095) 0.051Family Ownership -0.075∗ (0.039) 0.050Frequency 0.011∗ (0.006) 0.038Market Sentiment -0.560 (0.424) 0.031Shipping Sentiment -0.035 (0.176) 0.000
Significance levels : ∗ : 10% ∗∗ : 5% ∗ ∗ ∗ : 1%
23

The results suggest that initial return is significantly and positively related to price revision, IPO
frequency and post-IPO ownership concentration. It is also marginally significantly and negatively
related to pre-IPO family ownership. The relationship with other explanatory variables is found
to be insignificant. The largest R2 of 19.3% is achieved by the price revision, which is consistent
with previous research and supportive of the partial adjustment theory. The other variables that
yield noteworthy R2 are post-IPO ownership concentration, post-IPO outsider ownership, pre-IPO
family ownership, and lastly IPO frequency. These findings are consistent with the control moti-
vation for underpricing. Specifically, it provides support for the prediction of the Stoughton and
Zechner agency cost theory, as the sign of the relationship is positive with respect to post-IPO
ownership concentration and negative with respect to pre-IPO family ownership. Furthermore, the
marginal significance of IPO frequency is supportive of the investor sentiment theory. However, the
multivariate regression analysis should be performed in order to obtain more accurate statistical
inference. The multivariate analysis is preferred as it reduces likelihood of omitted variable bias.
5.2 Multivariate results
The multivariate regressions are estimated by the Ordinary Least Squares (OLS) using robust
standard errors. Table 12 shows restricted sample regression results for a set of multivariate models
specified to test four hypotheses, outlined in Hypotheses. The results for a full sample which
contains 60 shipping firms are similar to those obtained for a restricted sample with 46 shipping
firms (see Table 13). Initial Return is used as a dependent variable across all model specifications,
while main independent variables are specified in accordance with hypotheses. The control variables
for model specifications are selected based on the information criteria, such as, Akaike information
criterion (AIC) and the Bayesian information criterion (BIC). The control variables selection for
hypothesis testing is performed this way since it is not feasible to include all control variables into
the model due to a small number of observations5. The robustness of selected models is tested by
adding exchange dummies and a dummy for financial crisis 2007-2008 to each model specification.
The model specification for Hypothesis 1 includes primary variables of interest, such as, Fre-
quency, Market Sentiment and Shipping Sentiment, and control variables, such as, Price Revision
5The rule of thumb says that there should be 10-15 observations per predictor in the model. Otherwise, inferencefrom regression estimation is unreliable.
24
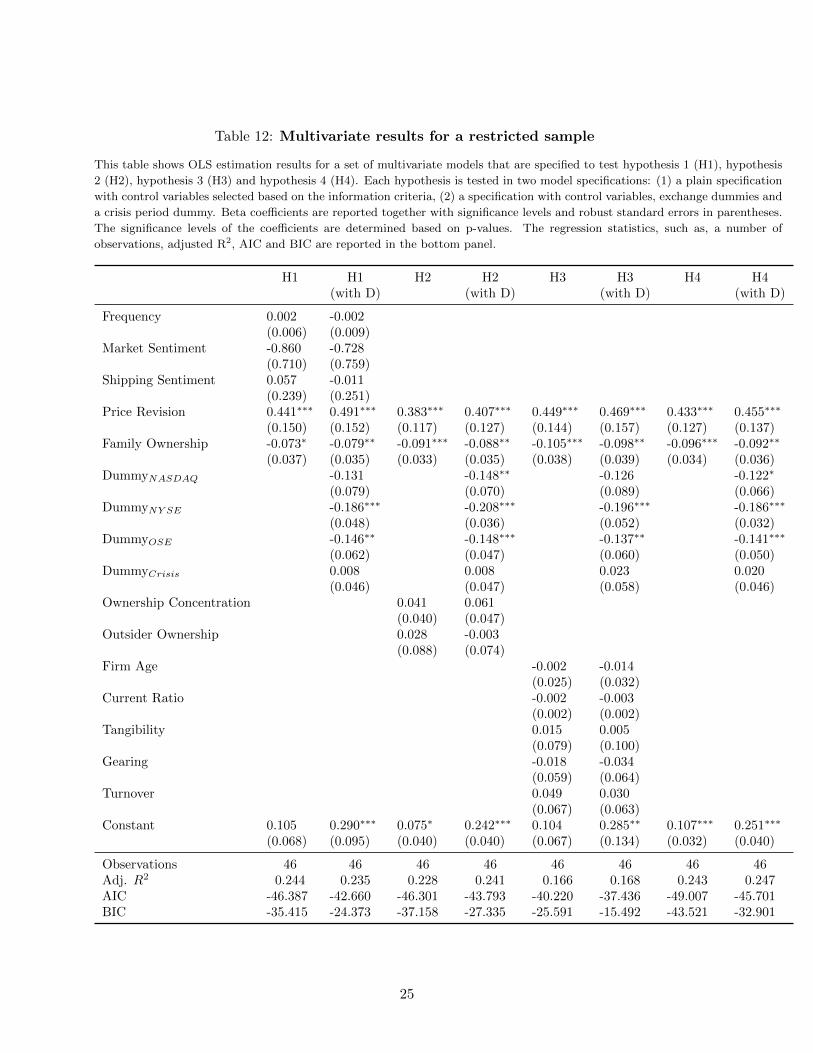
Table 12: Multivariate results for a restricted sample
This table shows OLS estimation results for a set of multivariate models that are specified to test hypothesis 1 (H1), hypothesis
2 (H2), hypothesis 3 (H3) and hypothesis 4 (H4). Each hypothesis is tested in two model specifications: (1) a plain specification
with control variables selected based on the information criteria, (2) a specification with control variables, exchange dummies and
a crisis period dummy. Beta coefficients are reported together with significance levels and robust standard errors in parentheses.
The significance levels of the coefficients are determined based on p-values. The regression statistics, such as, a number of
observations, adjusted R2, AIC and BIC are reported in the bottom panel.
H1 H1 H2 H2 H3 H3 H4 H4(with D) (with D) (with D) (with D)
Frequency 0.002 -0.002(0.006) (0.009)
Market Sentiment -0.860 -0.728(0.710) (0.759)
Shipping Sentiment 0.057 -0.011(0.239) (0.251)
Price Revision 0.441∗∗∗ 0.491∗∗∗ 0.383∗∗∗ 0.407∗∗∗ 0.449∗∗∗ 0.469∗∗∗ 0.433∗∗∗ 0.455∗∗∗
(0.150) (0.152) (0.117) (0.127) (0.144) (0.157) (0.127) (0.137)Family Ownership -0.073∗ -0.079∗∗ -0.091∗∗∗ -0.088∗∗ -0.105∗∗∗ -0.098∗∗ -0.096∗∗∗ -0.092∗∗
(0.037) (0.035) (0.033) (0.035) (0.038) (0.039) (0.034) (0.036)DummyNASDAQ -0.131 -0.148∗∗ -0.126 -0.122∗
(0.079) (0.070) (0.089) (0.066)DummyNY SE -0.186∗∗∗ -0.208∗∗∗ -0.196∗∗∗ -0.186∗∗∗
(0.048) (0.036) (0.052) (0.032)DummyOSE -0.146∗∗ -0.148∗∗∗ -0.137∗∗ -0.141∗∗∗
(0.062) (0.047) (0.060) (0.050)DummyCrisis 0.008 0.008 0.023 0.020
(0.046) (0.047) (0.058) (0.046)Ownership Concentration 0.041 0.061
(0.040) (0.047)Outsider Ownership 0.028 -0.003
(0.088) (0.074)Firm Age -0.002 -0.014
(0.025) (0.032)Current Ratio -0.002 -0.003
(0.002) (0.002)Tangibility 0.015 0.005
(0.079) (0.100)Gearing -0.018 -0.034
(0.059) (0.064)Turnover 0.049 0.030
(0.067) (0.063)Constant 0.105 0.290∗∗∗ 0.075∗ 0.242∗∗∗ 0.104 0.285∗∗ 0.107∗∗∗ 0.251∗∗∗
(0.068) (0.095) (0.040) (0.040) (0.067) (0.134) (0.032) (0.040)
Observations 46 46 46 46 46 46 46 46Adj. R2 0.244 0.235 0.228 0.241 0.166 0.168 0.243 0.247AIC -46.387 -42.660 -46.301 -43.793 -40.220 -37.436 -49.007 -45.701BIC -35.415 -24.373 -37.158 -27.335 -25.591 -15.492 -43.521 -32.901
25

Table 13: Multivariate results for a full sample
This table shows OLS estimation results for a set of multivariate models that are specified to
test hypothesis 1 (H1), hypothesis 2 (H2) and hypothesis 3 (H3). Each hypothesis is tested in
two model specifications: (1) a plain specification with control variables selected based on the
information criteria, (2) a specification with control variables, exchange dummies and a crisis period
dummy. Beta coefficients are reported together with significance levels and robust standard errors
in parentheses. The significance levels of the coefficients are determined based on p-values. The
regression statistics, such as, a number of observations, adjusted R2, AIC and BIC are reported in
the bottom panel.
H1 H1 H2 H2 H3 H3(with D) (with D) (with D)
Frequency 0.008 0.010(0.007) (0.009)
Market Sentiment -0.500 -0.524(0.560) (0.544)
Shipping Sentiment 0.136 0.106(0.255) (0.230)
Ownership Concentration 0.079∗ 0.085∗ 0.082∗ 0.093∗ 0.101∗ 0.099∗
(0.040) (0.043) (0.042) (0.050) (0.052) (0.055)DummyNASDAQ 0.055 0.098 0.081
(0.133) (0.137) (0.166)DummyNY SE 0.044 0.035 0.035
(0.121) (0.121) (0.147)DummyOSE 0.092 0.079 0.073
(0.125) (0.131) (0.142)DummyCrisis -0.040 -0.048 -0.044
(0.055) (0.055) (0.068)Outsider Ownership 0.108 0.078
(0.088) (0.074)Family Ownership -0.080∗∗ -0.087∗∗
(0.038) (0.040)Return on Assets 0.228 0.351∗
(0.150) (0.206)Firm Age 0.003 -0.004
(0.022) (0.028)Current Ratio -0.000 -0.000
(0.002) (0.002)Tangibility -0.060 -0.075
(0.098) (0.105)Gearing 0.006 0.014
(0.034) (0.047)Turnover 0.004 0.003
(0.022) (0.025)Constant -0.058 -0.115 -0.026 -0.074 0.023 -0.009
(0.063) (0.148) (0.053) (0.135) (0.070) (0.178)
Observations 60 60 60 60 60 60Adj. R2 0.054 0.024 0.096 0.080 -0.019 -0.054AIC -45.127 -39.783 -47.827 -43.303 -38.878 -33.538BIC -34.655 -20.934 -37.355 -24.454 -24.218 -10.500
26

and Family Ownership. Contrary to expectations and predictions of the investor sentiment theory,
Frequency, Market Sentiment and Shipping Sentiment variables turn out to be insignificant. This
finding implies no relationship between business cycles and IPO initial returns. The sentiment
variables remain insignificant in a full sample estimation. Hence, the results provide no support for
Hypothesis 1.
Hypothesis 2 is represented by a model that includes Ownership Concentration, Outsider Own-
ership, Family Ownership, which are the variables of interest, and a control variable, Price Revision.
Family Ownership coefficient is found to be negative and highly significant, in line with our expec-
tations. The coefficient ranges from −0.091 to −0.088, which suggests that family-owned firms are
underpriced less compared to non-family owned firms. This finding is consistent with the hypothesis
that family firms have less incentives to underprice as the agency conflict is not severe. However,
Ownership Concentration and Outsider Ownership are shown to be insignificant, contrary to our
expectations. Therefore, the restricted sample results only partially support the Stoughton and
Zechner theory. The full sample results confirm significance of Family Ownership. In addition,
Ownership Concentration becomes marginally significant. The positive coefficient of Ownership
Concentration indicates that firms with post-IPO concentrated ownership tend to underprice more.
The revealed positive relationship between post-IPO ownership concentration and IPO underpricing
is consistent with the Stoughton and Zechner theory. Hence, there seems to be sufficient support
for Hypothesis 2 in our sample.
Hypothesis 3 is specified with a model that includes firm-specific variables of interest, such as,
Firm Age, Current Ratio, Tangibility, Gearing and Turnover, and control variables, such as, Price
Revision and Family Ownership. None of the firm-specific variables are found to be significant. This
result is inconsistent with predictions of the information asymmetry theory and yields no support
for Hypothesis 3. The results remain unchanged in a full sample estimation.
Hypothesis 4 is tested in a model that includes Price Revision as the main variable of interest and
Family Ownership as a control variable. Price Revision coefficient is found to be positive and highly
significant. More specifically, the coefficient is 0.455, which suggests that the final offer price only
partially adjusts to positive private information revealed by investors, which is consistent with the
partial adjustment theory. Hence, there is strong evidence in favor of Hypothesis 4. This hypothesis
cannot be tested for a full sample, since Price Revision can be obtained only for bookbuilding IPOs
27

(a restricted sample).
Overall, the results appear to be robust with respect to a sample size and model specifications.
The partial adjustment theory is strongly supported in both restricted and full samples. Addition-
ally, the Stoughton and Zechner agency cost theory seems to be relevant for pricing decisions in
a shipping sector, as post-IPO ownership concentration is found to be positively related to IPO
underpricing. The corroborating evidence also comes from the finding that family firms tend to be
less underpriced than non-family firms. However, investor sentiment and information asymmetry
do not seem to affect IPO underpricing in our sample.
5.3 Discussion
This paper examines a wider range of shipping-specific factors and underpricing theories compared
to previous shipping IPO studies. In particular, we test the partial adjustment theory, the investor
sentiment theory, and two conflicting ownership and control theories. The fist two theories are
considered as they have proved to be important in both shipping and general IPO literature. The
ownership and control theories are additionally tested as they are regarded as plausible explanations
of underpricing in the sector with concentrated or family ownership. Since these theories have not
been extensively tested in the literature yet, and have not been considered as explanations of
underpricing in a shipping sector, investigation of these theories is an important contribution of
this paper. The managerial control theory by Brennan and Franks and the agency cost theory by
Stoughton and Zechner provide opposite empirical predictions regarding the relationship between
post-IPO ownership concentration and IPO underpricing. Hence, empirical testing is necessary in
order to reveal the true underlying relationship between the two.
This paper provides supportive evidence for the agency cost theory by Stoughton and Zechner,
since post-IPO ownership concentration is positively related to underpricing. Moreover, pre-IPO
family ownership is found to be negatively related to underpricing, i.e. family firms tend to un-
derprice less. This finding corroborates the agency story, as family firms do not often experience
agency conflicts and, consequently, have less incentives to underprice. Hence, low underpricing in a
shipping sector could be partially explained by family ownership or highly-concentrated ownership
structure prevalent in shipping firms. The results are also supportive of the partial adjustment
theory. Moreover, the price revision has the highest explanatory power over underpricing among
28

explanatory variables. Since price revision is shown to be mostly negative for our sample of ship-
ping IPOs, there should be little to no underpricing according to the partial adjustment theory.
Lastly, contrary to our expectations and previous research findings, investor sentiment variables
and firm-specific variables, used to test information asymmetry argument, are found to be insignif-
icant. Therefore, the results provide no support for the investor sentiment theory and information
asymmetry argument.
The findings of this paper contribute to IPO literature in several ways. First, shipping char-
acteristics, such as, post-IPO ownership concentration and pre-IPO family ownership are found to
be significant. The coefficient signs are consistent with predictions of the Stoughton and Zechner
theory, which in turn, renders null the Brennan and Franks theory. Moreover, low underpricing
“puzzle” in a shipping sector can be partially explained by the Stoughton and Zechner theory. This
finding accentuates the importance of accounting for sector-specific factors when explaining IPO
underpricing. Second, price revision is found to be highly significant, consistent with the partial
adjustment theory and previous literature. Finally, the investor sentiment theory and information
asymmetry argument do not seem to be relevant for underpricing in shipping.
6 Conclusion
This paper provides additional insights into the IPO underpricing “puzzle” in a global shipping
sector. The observed underpricing in shipping is rather low compared to the typical level, reported
in previous studies. This paper suggests that shipping-relevant factors and underpricing theories
can partially explain this empirical regularity. Among shipping-specific factors, post-IPO ownership
concentration and pre-IPO family ownership turn out to be significant. However, other shipping
firm-specific characteristics, such as, firm age, current ratio, tangibility, gearing and turnover are
found to be insignificant. This paper also considers several underpricing theories that seem to be
relevant to shipping specifics or have gained substantial empirical support in the previous literature.
Specifically, we test the partial adjustment theory by Benveniste and Spindt, the investor sentiment
theory, the information asymmetry argument, the agency cost theory by Stoughton and Zechner
and the managerial control theory by Brennan and Franks. Consistent with previous research, the
partial adjustment theory is able to explain a significant amount of underpricing in global ship-
29

ping. Moreover, downward price revisions prevalent among shipping firms are consistent with low
underpricing in shipping. The investor sentiment theory and information asymmetry argument,
contrary to expectations, are not supported by the results of this paper. Hence, low underpricing
among shipping firms cannot be justified by business cycle fluctuations or low information asymme-
try in this sector. Importantly, this paper provides strong evidence in favor of the Stoughton and
Zechner agency cost theory, which claims that underpricing is a solution to the agency problem in
the issuer’s firm. The corroborating evidence also comes from the significant negative relationship
between pre-IPO family ownership and IPO underpricing. Put differently, family firms typically
do not experience severe agency problems, and therefore underprice less, which is fully consistent
with the Stoughton and Zechner theory of underpricing. This result can partially explain lower
underpricing observed in a shipping sector as most shipping firms are family-owned.
The findings of this paper can be useful for any parties involved in IPO decision-making in
a shipping sector. For example, investors can exploit profitable short-selling opportunities due to
larger underpricing expected from non-family shipping firms. Furthermore, this paper has significant
importance for general IPO literature as it suggests potential relevance of sector-specific factors and
theories to IPO underpricing by showing that shipping-specific factors do matter for underpricing
in a shipping sector. An example of a shipping sector presents support for a notion that there could
be sector-specific explanations of underpricing in other sectors as well. Moreover, the results for
a shipping sector might be also relevant for sectors with similar characteristics. The investigation
of idiosyncratic sector characteristics that could affect IPO underpricing in different sectors and
testing their relevance is left to future research.
30

References
Aggarwal, R., and P. Rivoli. 1990. Fads in the initial public offering market? Financial Management
pp. 45–57.
Aggarwal, R. K., L. Krigman, and K. L. Womack. 2002. Strategic IPO underpricing, information
momentum, and lockup expiration selling. Journal of financial economics 66:105–137.
Akyol, A. C., T. Cooper, M. Meoli, and S. Vismara. 2014. Do regulatory changes affect the under-
pricing of European IPOs? Journal of Banking & Finance 45:43–58.
Alexandrou, G., D. Gounopoulos, and H. M. Thomas. 2014. Mergers and acquisitions in shipping.
Transportation Research Part E: Logistics and Transportation Review 61:212–234.
Allen, F., and G. R. Faulhaber. 1989. Signalling by underpricing in the IPO market. Journal of
financial Economics 23:303–323.
Amihud, Y., S. Hauser, and A. Kirsh. 2001. Allocations, Adverse Selection and Cascades in Ipos:
Evidence from Israel .
Arosio, R., G. Giudici, and S. Paleari. 2000. What drives the initial market performance of Italian
IPOs? An empirical investigation on underpricing and price support. In Financial Management
Association Conference.
Aruaslan, O., D. O. Cook, and R. Kieschnick. 2004. Monitoring as a Motivation for IPO Under-
pricing. The Journal of Finance 59:2403–2420.
Asquith, D., J. D. Jones, and R. Kieschnick. 1998. Evidence on price stabilization and underpricing
in early IPO returns. The Journal of Finance 53:1759–1773.
Banerjee, S., L. Dai, and K. Shrestha. 2011. Cross-country IPOs: What explains differences in
underpricing? Journal of Corporate Finance 17:1289–1305.
Baron, D. P. 1982. A model of the demand for investment banking advising and distribution services
for new issues. Journal of Finance pp. 955–976.
31

Beatty, R. P., and J. R. Ritter. 1986. Investment banking, reputation, and the underpricing of
initial public offerings. Journal of financial economics 15:213–232.
Benveniste, L. M., W. Y. Busaba, and W. J. Wilhelm. 1996. Price stabilization as a bonding
mechanism in new equity issues. Journal of Financial Economics 42:223–255.
Benveniste, L. M., and P. A. Spindt. 1989. How investment bankers determine the offer price and
allocation of new issues. Journal of Financial Economics 24:343–361.
Boulton, T. J., S. B. Smart, and C. J. Zutter. 2010a. Acquisition activity and IPO underpricing.
Financial Management 39:1521–1546.
Boulton, T. J., S. B. Smart, and C. J. Zutter. 2010b. IPO underpricing and international corporate
governance. Journal of International Business Studies 41:206–222.
Boulton, T. J., S. B. Smart, and C. J. Zutter. 2011. Earnings quality and international IPO
underpricing. The Accounting Review 86:483–505.
Brau, J. C., and S. E. Fawcett. 2006. Initial public offerings: An analysis of theory and practice.
The Journal of Finance 61:399–436.
Brennan, M. J., and J. Franks. 1997. Underpricing, ownership and control in initial public offerings
of equity securities in the UK. Journal of Financial Economics 45:391–413.
Chahine, S. 2008. Underpricing versus gross spread: New evidence on the effect of sold shares at
the time of IPOs. Journal of Multinational Financial Management 18:180–196.
Chambers, A. 2012. Chambers Corporate Governance Handbook. A&C Black.
Chambers, D., and E. Dimson. 2009. IPO underpricing over the very long run. The Journal of
Finance 64:1407–1443.
Chan, K., J. Wang, and K. J. Wei. 2004. Underpricing and long-term performance of IPOs in China.
Journal of Corporate Finance 10:409–430.
Chen, G., M. Firth, and J.-B. Kim. 2004. IPO underpricing in Chinas new stock markets. Journal
of Multinational Financial Management 14:283–302.
32

Cornelli, F., and D. Goldreich. 2003. Bookbuilding: How informative is the order book? The
Journal of Finance 58:1415–1443.
Daniel, K. 2002. Discussion of” Why don’t issuers get upset about leaving money on the table in
IPOs?”. Review of Financial Studies pp. 445–454.
Daugherty, M. S., and T. Jithendranathan. 2012. Underpricing of IPOs of US family controlled
businesses. Journal of Finance and Economics .
Drake, P. D., and M. R. Vetsuypens. 1993. IPO underpricing and insurance against legal liability.
Financial Management pp. 64–73.
Ellis, K., R. Michaely, and M. O’hara. 2000. When the underwriter is the market maker: An
examination of trading in the IPO aftermarket. The Journal of Finance 55:1039–1074.
Engelen, P.-J. 2003. Underpricing of IPOs: Belgium evidence. European Review of Economics and
Finance 2:53–69.
Field, L. C., and J. M. Karpoff. 2002. Takeover defenses of IPO firms. The Journal of Finance
57:1857–1889.
Gajewski, J.-F., and C. Gresse. 2006. A survey of the European IPO market. ECMI Research Paper
.
Grammenos, C. T., and S. N. Marcoulis. 1996. A cross-section analysis of stock returns: The case
of shipping firms. Maritime Policy and Management 23:67–80.
Grammenos, C. T., and N. C. Papapostolou. 2012. US shipping initial public offerings: Do prospec-
tus and market information matter? Transportation Research Part E: Logistics and Transporta-
tion Review 48:276–295.
Grinblatt, M., and C. Y. Hwang. 1989. Signalling and the pricing of new issues. Journal of Finance
pp. 393–420.
Hanley, K. W. 1993. The underpricing of initial public offerings and the partial adjustment phe-
nomenon. Journal of financial economics 34:231–250.
33

Hanley, K. W., A. A. Kumar, and P. J. Seguin. 1993. Price stabilization in the market for new
issues. Journal of Financial economics 34:177–197.
Harlaftis, G., and J. Theotokas. 2004. European family firms in international business: British and
Greek tramp-shipping firms. Business History 46:219–255.
Hauser, S., U. Yaari, Y. Tanchuma, and H. Baker. 2006. Initial Public Offering Discount and
Competition*. Journal of Law and Economics 49:331–351.
Ibbotson, R. G. 1975. Price performance of common stock new issues. Journal of financial economics
2:235–272.
Jakobsen, J. B., and O. Sørensen. 2001. Decomposing and Testing Long-term Returns: an Appli-
cation on Danish IPOs. European Financial Management 7:393–417.
Jegadeesh, N., M. Weinstein, and I. Welch. 1993. An empirical investigation of IPO returns and
subsequent equity offerings. Journal of Financial Economics 34:153–175.
Jenkinson, T., and H. Jones. 2004. Bids and allocations in European IPO bookbuilding. The Journal
of Finance 59:2309–2338.
Jenkinson, T., and A. Ljungqvist. 2001. Going public: The theory and evidence on how companies
raise equity finance. Oxford University Press.
Keloharju, M. 1993. The winner’s curse, legal liability, and the long-run price performance of initial
public offerings in Finland. Journal of Financial Economics 34:251–277.
Koh, F., and T. Walter. 1989. A direct test of Rock’s model of the pricing of unseasoned issues.
Journal of Financial Economics 23:251–272.
Krigman, L., W. H. Shaw, and K. L. Womack. 1999. The persistence of IPO mispricing and the
predictive power of flipping. The Journal of Finance 54:1015–1044.
Lee, P. J., S. L. Taylor, and T. S. Walter. 1996. Australian IPO pricing in the short and long run.
Journal of Banking & Finance 20:1189–1210.
Levis, M. 1993. The long-run performance of initial public offerings: The UK experience 1980-1988.
Financial Management pp. 28–41.
34

Liu, X., and J. R. Ritter. 2011. Local underwriter oligopolies and IPO underpricing. Journal of
Financial Economics 102:579–601.
Ljungqvist, A. 2005. IPO underpricing. Handbook of Empirical Corporate Finance 2:375–422.
Ljungqvist, A., V. Nanda, and R. Singh. 2006. Hot markets, investor sentiment, and IPO pricing.
The Journal of Business 79:1667–1702.
Ljungqvist, A., and W. J. Wilhelm. 2003. IPO pricing in the dot-com bubble. The Journal of
Finance 58:723–752.
Ljungqvist, A., and W. J. Wilhelm. 2005. Does prospect theory explain IPO market behavior? The
Journal of Finance 60:1759–1790.
Logue, D. E. 1973. On the pricing of unseasoned equity issues: 1965–1969. Journal of Financial
and Quantitative Analysis 8:91–103.
Loughran, T., and J. Ritter. 2002a. Why has IPO underpricing increased over time. Unpublished
working paper, University of Notre Dame and University of Florida .
Loughran, T., and J. R. Ritter. 2002b. Why dont issuers get upset about leaving money on the
table in IPOs? Review of Financial Studies 15:413–444.
Loughran, T., and J. R. Ritter. 2003. Why has IPO underpricing changed over time? .
Loughran, T., J. R. Ritter, and K. Rydqvist. 2008. Initial public offerings: international insights.
Pacific-Basin Finance Journal 1:139–140.
Lowry, M., M. S. Officer, and G. W. Schwert. 2010. The variability of IPO initial returns. The
Journal of Finance 65:425–465.
Lowry, M., and S. Shu. 2002. Litigation risk and IPO underpricing. Journal of Financial Economics
65:309–335.
Merikas, A., D. Gounopoulos, and C. Karli. 2010. Market performance of US-listed Shipping IPOs.
Maritime Economics & Logistics 12:36–64.
35

Merikas, A., D. Gounopoulos, and C. Nounis. 2009. Global shipping IPOs performance. Maritime
Policy & Management 36:481–505.
Michaely, R., and W. H. Shaw. 1994. The pricing of initial public offerings: Tests of adverse-selection
and signaling theories. Review of Financial studies 7:279–319.
Muscarella, C. J., and M. R. Vetsuypens. 1989. A simple test of Baron’s model of IPO underpricing.
Journal of financial Economics 24:125–135.
Ofek, E., and M. Richardson. 2003. Dotcom mania: The rise and fall of internet stock prices. The
Journal of Finance 58:1113–1137.
Reilly, F. K. 1973. Further evidence on short-run results for new issue investors. Journal of Financial
and Quantitative Analysis 8:83–90.
Ritter, J., and I. Welch. 2002. A review of IPO activity, pricing, and allocations. Tech. rep., national
bureau of economic research.
Ritter, J. R. 1984. The” hot issue” market of 1980. Journal of Business pp. 215–240.
Ritter, J. R. 1991. The long-run performance of initial public offerings. The journal of finance
46:3–27.
Ritter, J. R. 2011. Equilibrium in the IPO market. Available at SSRN 1822542 .
Rock, K. 1986. Why new issues are underpriced. Journal of financial economics 15:187–212.
Ruud, J. S. 1993. Underwriter price support and the IPO underpricing puzzle. Journal of Financial
Economics 34:135–151.
Rydqvist, K. 1997. IPO underpricing as tax-efficient compensation. Journal of Banking & Finance
21:295–313.
Schultz, P. H., and M. A. Zaman. 1994. Aftermarket support and underpricing of initial public
offerings. Journal of Financial Economics 35:199–219.
Smart, S. B., and C. J. Zutter. 2003. Control as a motivation for underpricing: a comparison of
dual and single-class IPOs. Journal of Financial Economics 69:85–110.
36

Stehle, R., O. Ehrhardt, and R. Przyborowsky. 2000. Long-run stock performance of German initial
public offerings and seasoned equity issues. European Financial Management 6:173–196.
Stoll, H. R., and A. J. Curley. 1970. Small business and the new issues market for equities. Journal
of financial and quantitative analysis 5:309–322.
Stopford, M. 1997. Maritime Economics. 2nd.
Stoughton, N. M., and J. Zechner. 1998. IPO-mechanisms, monitoring and ownership structure.
Journal of Financial Economics 49:45–77.
Su, D., and B. M. Fleisher. 1999. Why does return volatility differ in Chinese stock markets?
Pacific-Basin Finance Journal 7:557–586.
Taranto, M. A. 2003. Employee stock options and the underpricing of initial public offerings.
Available at SSRN 479901 .
Thomadakis, S., C. Nounis, and D. Gounopoulos. 2007. The long term performance of initial public
offerings in the Athens stock exchange (1994-2002). European Financial Management .
Tinic, S. M. 1988. Anatomy of initial public offerings of common stock. The Journal of Finance
43:789–822.
Villalonga, B., and R. Amit. 2006. How do family ownership, control and management affect firm
value? Journal of financial Economics 80:385–417.
Welch, I. 1989. Seasoned offerings, imitation costs, and the underpricing of initial public offerings.
The Journal of Finance 44:421–449.
Welch, I. 1992. Sequential sales, learning, and cascades. Journal of Finance pp. 695–732.
37

A Explanatory variables
Table 14: List of explanatory variables
This table lists potential determinants of IPO underpricing or initial return that are used as explanatory variables. The short names, full namesand descriptions of the variables are provided.
Variable name Variable name Descriptionshort long of variable
PR Price Revision A difference between the final offer price and the midpoint of the initial filing price range
Size Offer Size A logarithm of the offer size, defined as a number of offered shares times an offer price
Age Firm Age A logarithm of the firm age at IPO date (in years)
CR Current Ratio A ratio of current assets to current liabilities (a measure of liquidity)
Tang Tangibility A ratio of fixed assets to total assets of a firm
Gear GearingA proxy for indebtedness of a firm, measured by a ratio of long-term debt tototal capital of a firm
Turn Turnover A ratio of freight revenue to total assets of a firm
ROA Return on Assets A ratio of net income to total assets of a firm
Family Family Ownership A dummy variable which is equal to 1 for family-owned firms
OwnConc Ownership ConcentrationA dummy variable which is equal to 1 for firms with non-zero post-IPO ownershipconcentration, measured by a fraction of institutional holdings in a firm
OutOwn Outsider OwnershipPost-IPO outsiders’ holdings in a firm
Freq Frequency A total number of shipping IPOs in a year of an IPO
MktSent Market Sentiment A cumulative local market return over the last three months before an IPO
ShipSent Shipping Sentiment A cumulative local shipping market return over the last three months before an IPO
38


