28
IPPC V1 (23.3.2016)

IPPC V1 (23.3.2016)
2
Disclaimer
This presentation has been prepared by Comba Telecom Systems Holdings Limited (the“Company”) for reference only. The information contained in this presentation has not beenindependently verified. The Company does not make any representation, warranty orundertaking, whether express or implied, to and no reliance should be placed on, the fairness,accuracy, suitability, completeness or correctness of the information or opinions contained herein.Any summary does not purport to be complete and accurate. None of the Company or itsaffiliates or their respective directors, employees or representatives will be liable for any losshowsoever arising from any use of this presentation or its contents or otherwise arising inconnection with this presentation.
This presentation contains statements that constitute forward-looking statements. Thesestatements include descriptions regarding the intent, belief or current expectations of theCompany or its officers with respect to the Company and the relevant industry. Such forward-looking statements are not guarantees of future performance and involve risks and uncertainties,and actual results may differ from those in the forward-looking statements in material respect asa result of various factors and assumptions (in particular for the national policies). The Companyhas no obligation and does not undertake to revise forward-looking statements to reflect futureevents or circumstances.
This presentation does not constitute an offer to sell or issue or the solicitation of an offer to buyor acquire securities of the Company in any jurisdiction or an inducement to enter intoinvestment activity, not may it or any part of it form the basis of or be relied upon in connectionwith any contract or commitment whatsoever.

Agenda
3
1. Financial Highlights
2. Financial Review
3. Customer Review
4. Business Review
Financial Highlights
1. Financial Results
2. Dividends & Bonus Shares
3. Exceptional Items
4. Proforma Financial Results
5. Financial Position
6. Key Financial Indicators
4
5
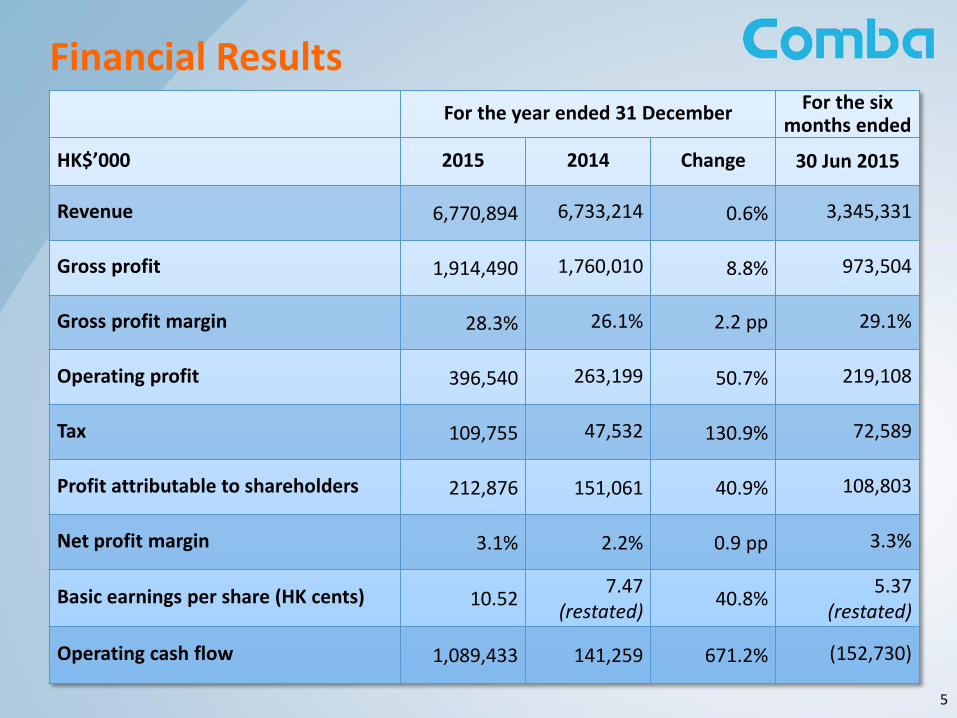
Financial ResultsFor the year ended 31 December
For the six months ended
HK$’000 2015 2014 Change 30 Jun 2015
Revenue 6,770,894 6,733,214 0.6% 3,345,331
Gross profit 1,914,490 1,760,010 8.8% 973,504
Gross profit margin 28.3% 26.1% 2.2 pp 29.1%
Operating profit 396,540 263,199 50.7% 219,108
Tax 109,755 47,532 130.9% 72,589
Profit attributable to shareholders 212,876 151,061 40.9% 108,803
Net profit margin 3.1% 2.2% 0.9 pp 3.3%
Basic earnings per share (HK cents) 10.527.47
(restated) 40.8%
5.37(restated)
Operating cash flow 1,089,433 141,259 671.2% (152,730)
6
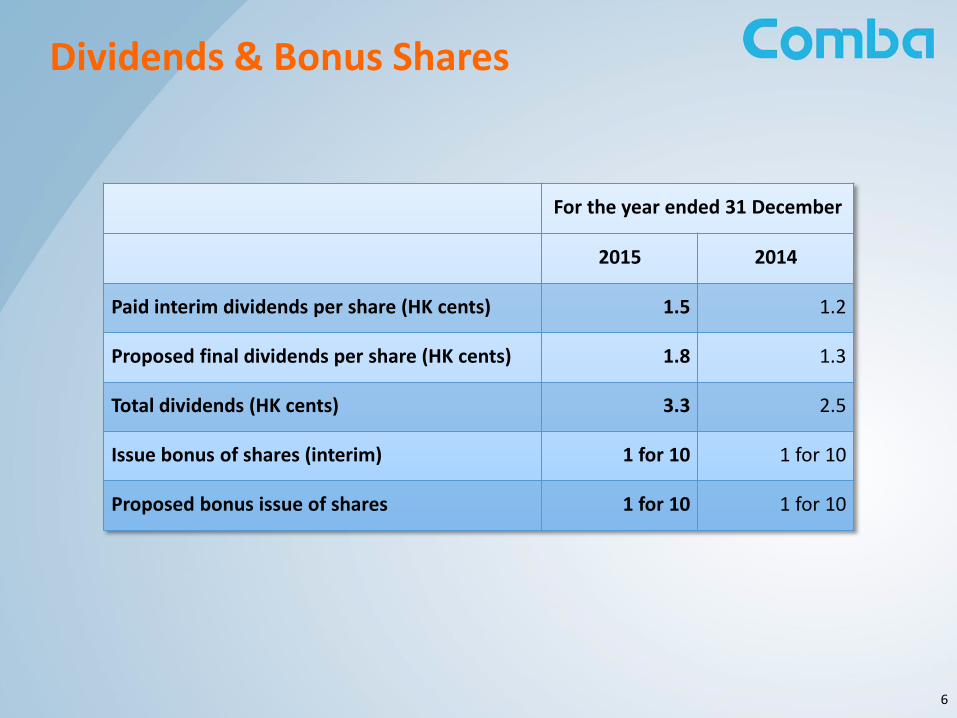
For the year ended 31 December
2015 2014
Paid interim dividends per share (HK cents) 1.5 1.2
Proposed final dividends per share (HK cents) 1.8 1.3
Total dividends (HK cents) 3.3 2.5
Issue bonus of shares (interim) 1 for 10 1 for 10
Proposed bonus issue of shares 1 for 10 1 for 10
Dividends & Bonus Shares
7
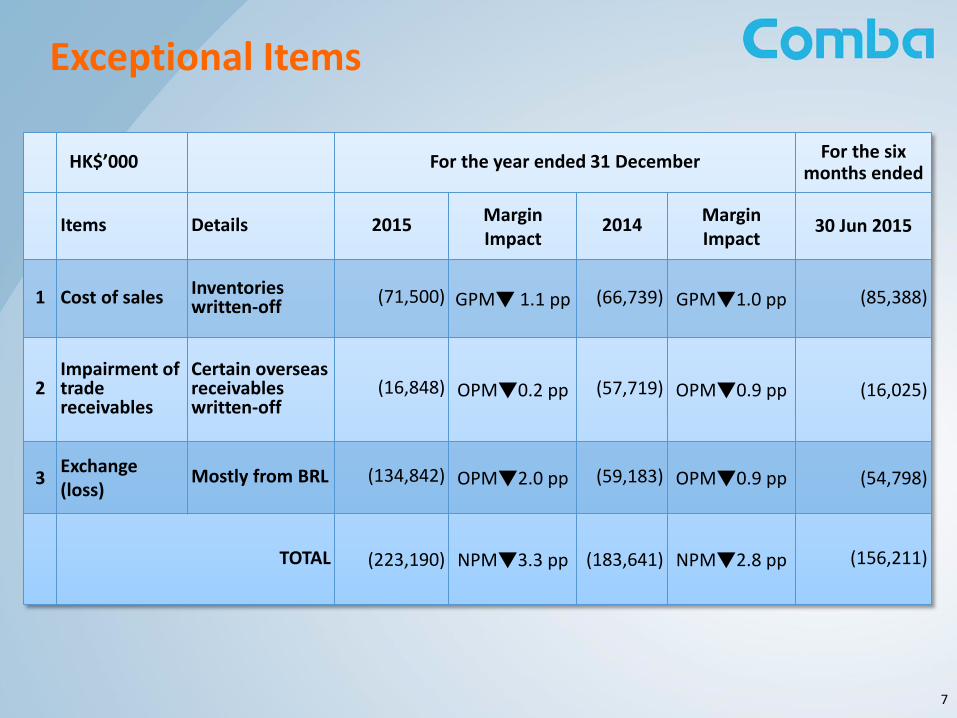
Exceptional Items
HK$’000 For the year ended 31 DecemberFor the six
months ended
Items Details 2015Margin Impact
2014MarginImpact
30 Jun 2015
1 Cost of sales Inventories written-off
(71,500) GPM▼ 1.1 pp (66,739) GPM▼1.0 pp (85,388)
2Impairment of trade receivables
Certain overseas receivables written-off
(16,848) OPM▼0.2 pp (57,719) OPM▼0.9 pp (16,025)
3Exchange (loss)
Mostly from BRL (134,842) OPM▼2.0 pp (59,183) OPM▼0.9 pp (54,798)
TOTAL (223,190) NPM▼3.3 pp (183,641) NPM▼2.8 pp (156,211)
8
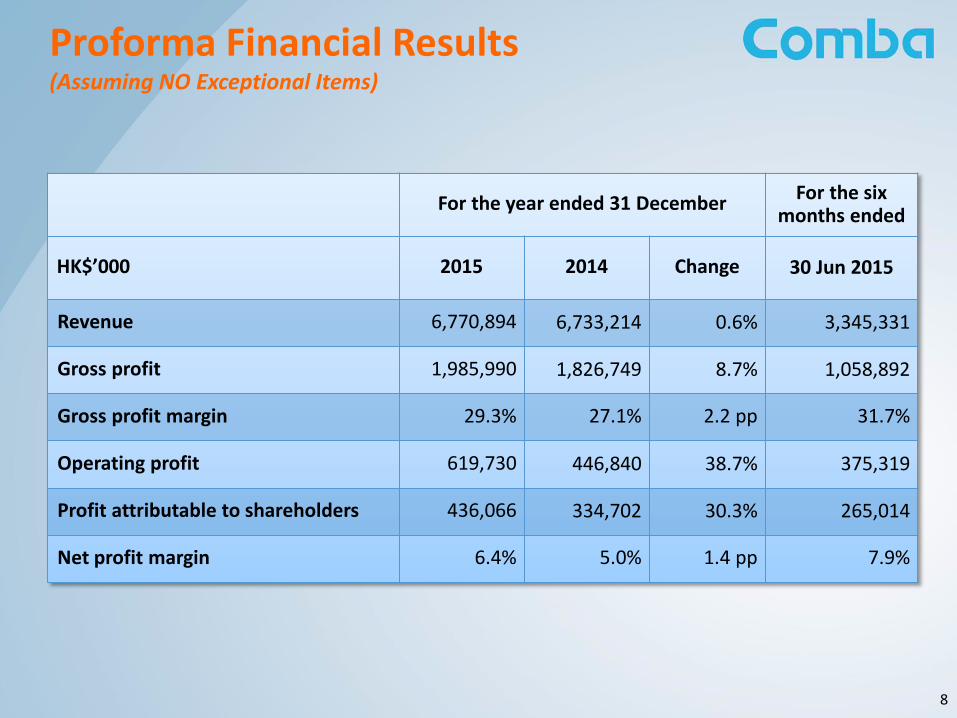
Proforma Financial Results(Assuming NO Exceptional Items)
For the year ended 31 DecemberFor the six
months ended
HK$’000 2015 2014 Change 30 Jun 2015
Revenue 6,770,894 6,733,214 0.6% 3,345,331
Gross profit 1,985,990 1,826,749 8.7% 1,058,892
Gross profit margin 29.3% 27.1% 2.2 pp 31.7%
Operating profit 619,730 446,840 38.7% 375,319
Profit attributable to shareholders 436,066 334,702 30.3% 265,014
Net profit margin 6.4% 5.0% 1.4 pp 7.9%

Financial Position
9
As at 31 December As at
30 June 2015HK$’000 2015 2014 Change
Net cash / (debt) 647,829 (17,113) 3,885.6% (411,478)
Total assets 9,574,875 10,136,732 (5.5%) 10,061,152
Total liabilities 5,863,088 6,370,777 (8.0%) 6,225,131
Net assets 3,652,531 3,709,791 (1.5%) 3,778,083
NAV per share (HK$) 1.80 1.83
(restated)(1.6%)
1.86(restated)
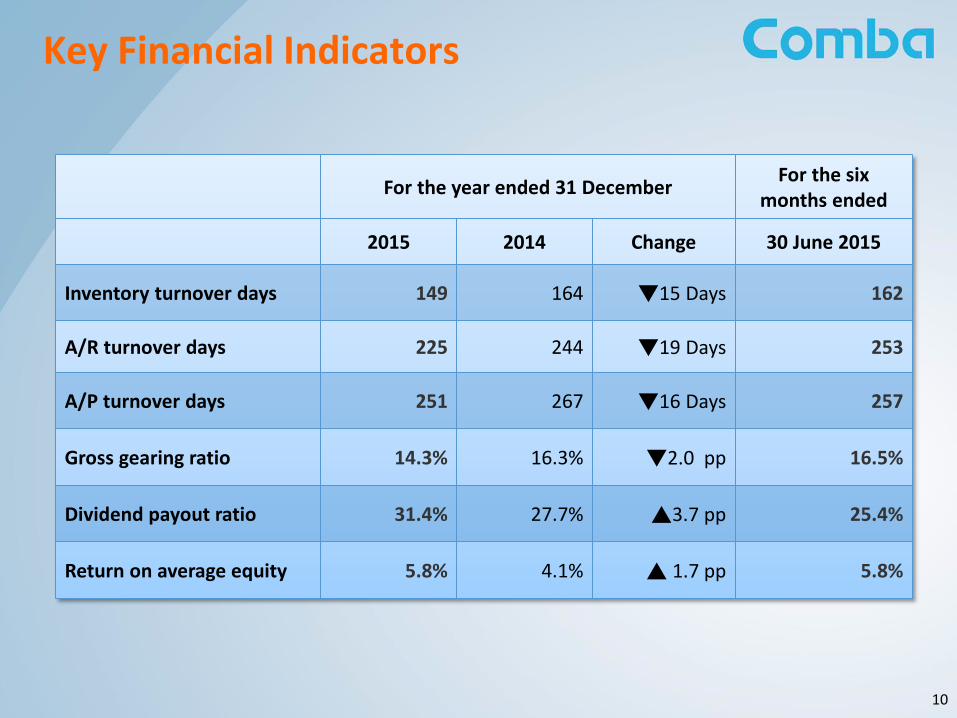
Key Financial Indicators
10
For the year ended 31 DecemberFor the six
months ended
2015 2014 Change 30 June 2015
Inventory turnover days 149 164 ▼15 Days 162
A/R turnover days 225 244 ▼19 Days 253
A/P turnover days 251 267 ▼16 Days 257
Gross gearing ratio 14.3% 16.3% ▼2.0 pp 16.5%
Dividend payout ratio 31.4% 27.7% ▲3.7 pp 25.4%
Return on average equity 5.8% 4.1% ▲ 1.7 pp 5.8%

Financial Review
1. Revenue Breakdown by Customers
2. Revenue Breakdown by Businesses
3. Cost Structure
11
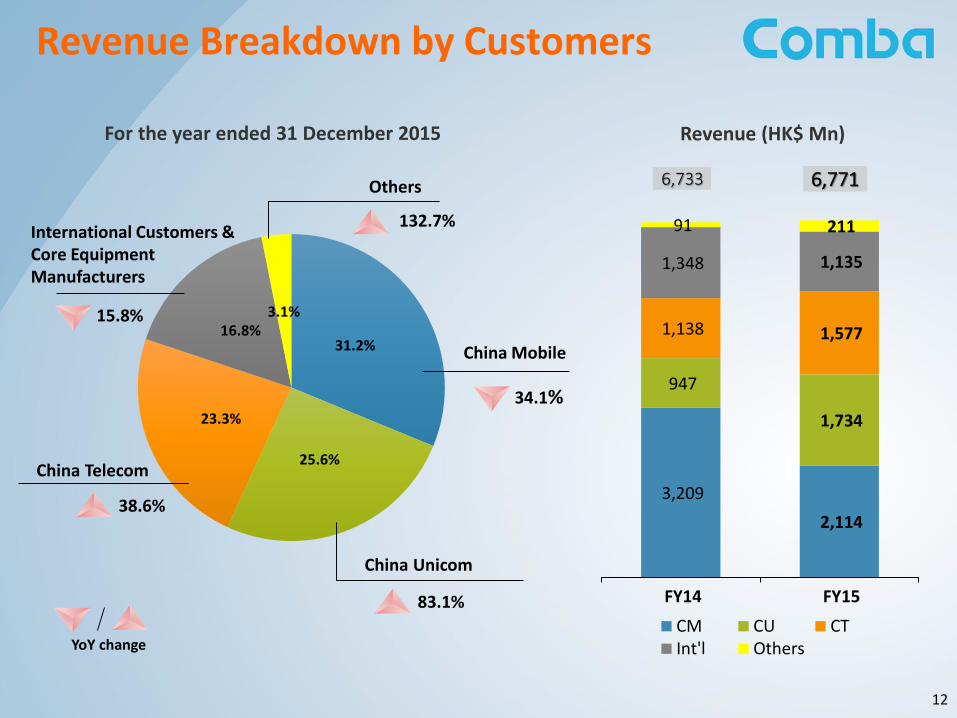
31.2%
25.6%
23.3%
16.8%3.1%
3,209
2,114
947
1,734
1,138 1,577
1,348 1,135
91 211
FY14 FY15
CM CU CTInt'l Others
Others
34.1%
China Mobile
83.1%
China Unicom
38.6%
China Telecom
International Customers & Core Equipment Manufacturers
Revenue Breakdown by Customers
For the year ended 31 December 2015
12
6,733 6,771
15.8%
132.7%
Revenue (HK$ Mn)
YoY change
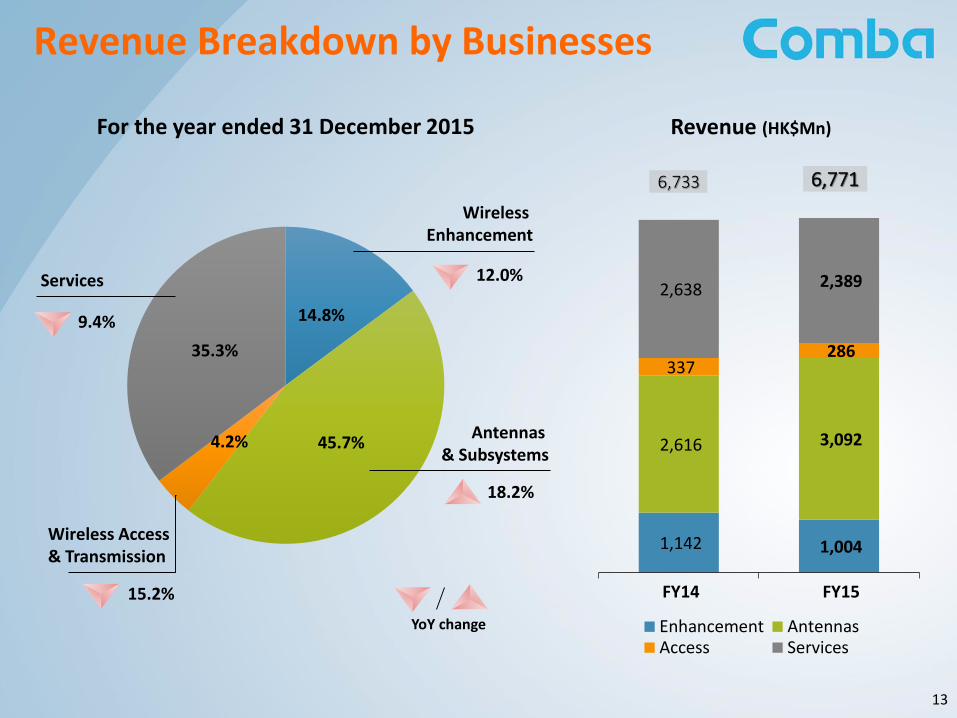
14.8%
45.7%4.2%
35.3%
12.0%
Wireless Enhancement
18.2%
Antennas & Subsystems
9.4%
Services
15.2%
Wireless Access & Transmission
Revenue Breakdown by Businesses
For the year ended 31 December 2015
13
Revenue (HK$Mn)
1,142 1,004
2,616 3,092
337 286
2,638 2,389
FY14 FY15
Enhancement AntennasAccess Services
6,733 6,771
YoY change
0.7% 1.6%0.9%1.0%
11.7%12.4%
7.6%7.0%
2.9%3.4%
FY14 FY15
Tax Fin cost Admin S&G R&D
14
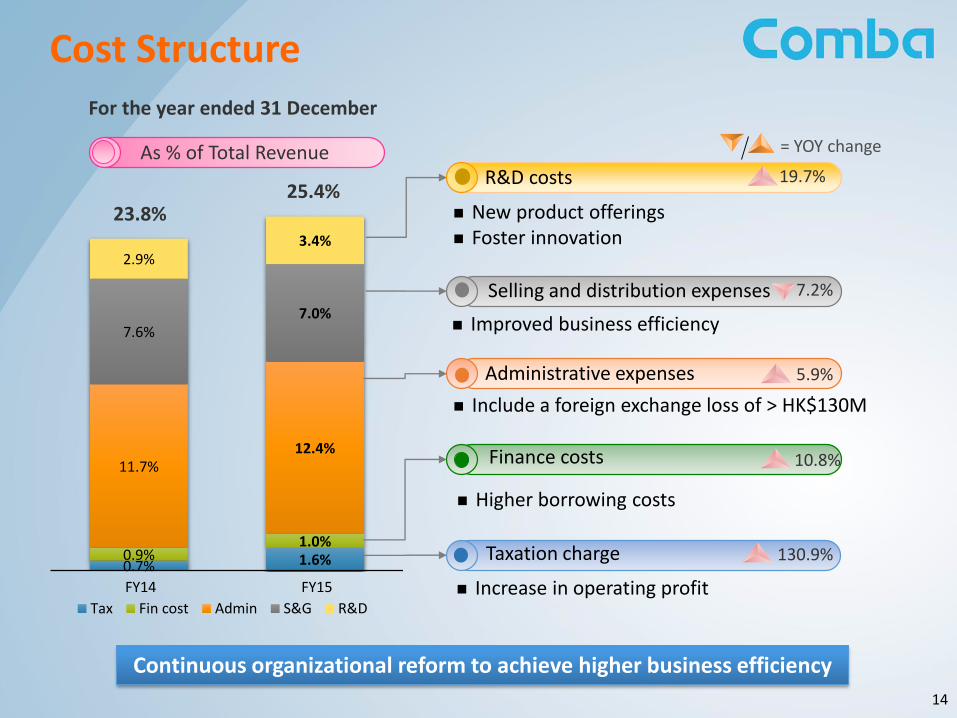
Cost Structure
As % of Total Revenue = YOY change
For the year ended 31 December
23.8%
Administrative expenses
Improved business efficiency
Selling and distribution expenses
New product offerings Foster innovation
R&D costs 19.7%
7.2%
5.9%
Finance costs
Taxation charge 130.9%
10.8%
Include a foreign exchange loss of > HK$130M
Higher borrowing costs
Increase in operating profit
25.4%
Continuous organizational reform to achieve higher business efficiency

Customer Review
15
16
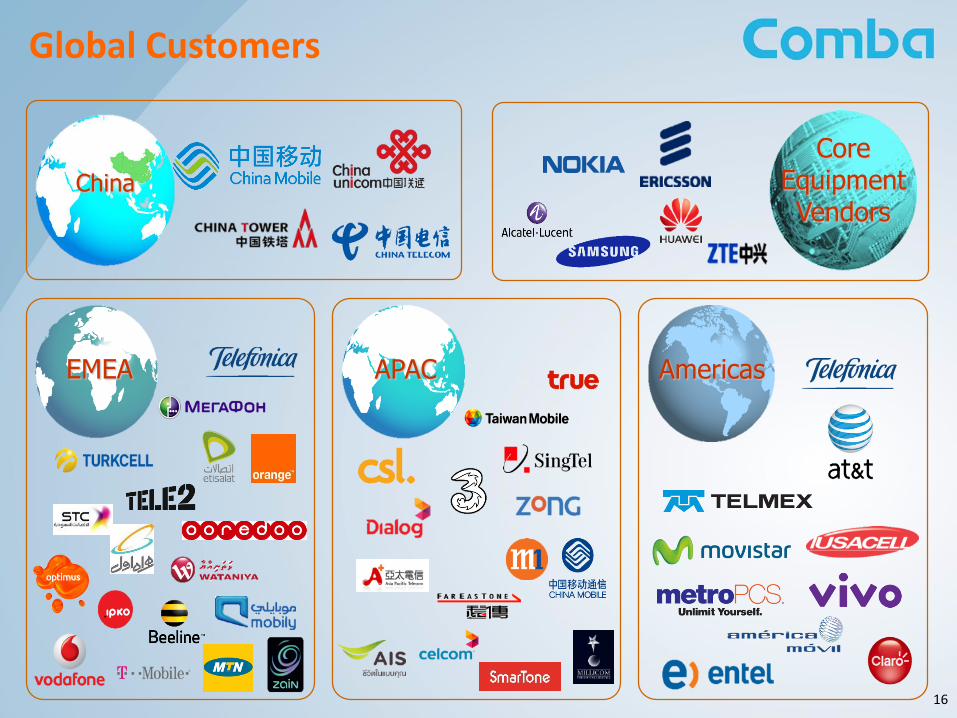
Global Customers
China
EMEA APAC Americas
CoreEquipmentVendors
17
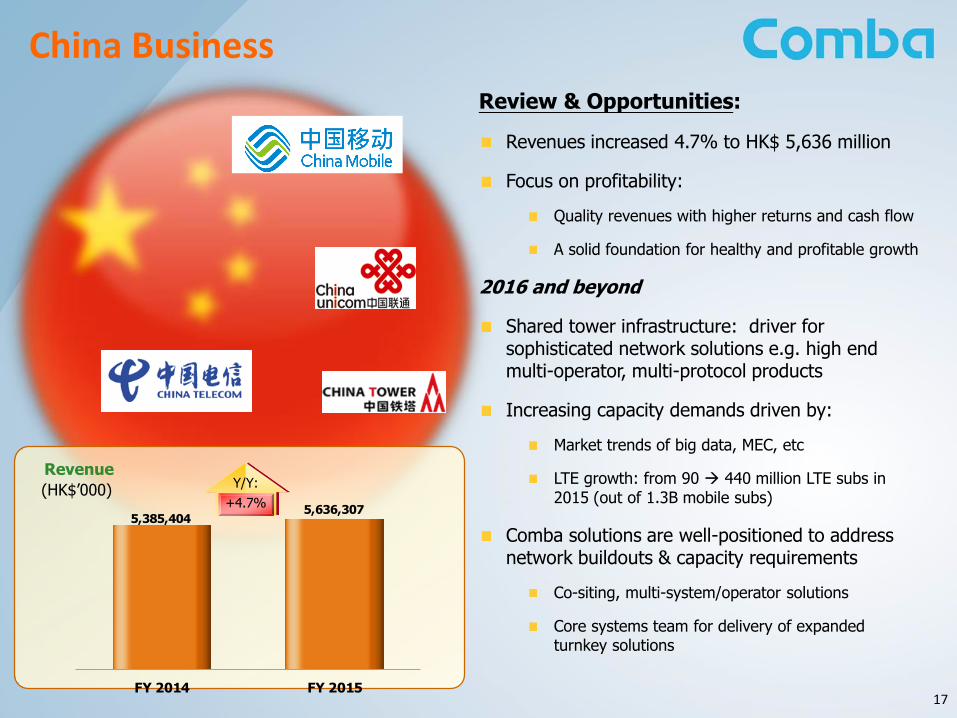
China Business
Review & Opportunities:
Revenues increased 4.7% to HK$ 5,636 million
Focus on profitability:
Quality revenues with higher returns and cash flow
A solid foundation for healthy and profitable growth
2016 and beyond
Shared tower infrastructure: driver for sophisticated network solutions e.g. high end multi-operator, multi-protocol products
Increasing capacity demands driven by:
Market trends of big data, MEC, etc
LTE growth: from 90 440 million LTE subs in 2015 (out of 1.3B mobile subs)
Comba solutions are well-positioned to address network buildouts & capacity requirements
Co-siting, multi-system/operator solutions
Core systems team for delivery of expanded turnkey solutions
5,385,4045,636,307
FY 2014 FY 2015
(HK$’000)
RevenueY/Y:
+4.7%
18
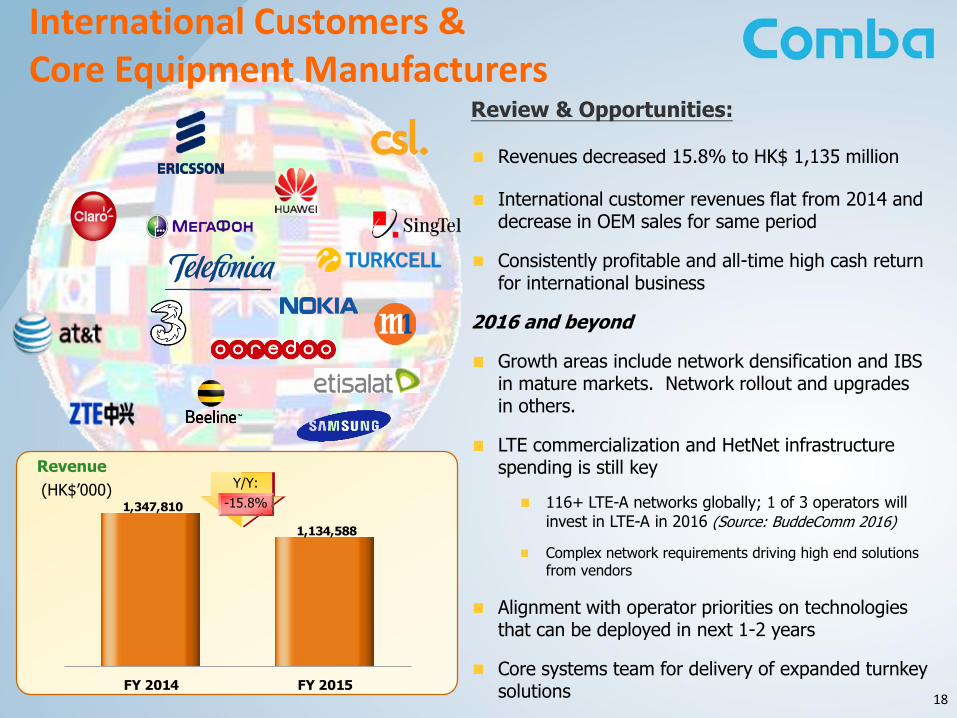
International Customers & Core Equipment Manufacturers
Review & Opportunities:
Revenues decreased 15.8% to HK$ 1,135 million
International customer revenues flat from 2014 and decrease in OEM sales for same period
Consistently profitable and all-time high cash return for international business
2016 and beyond
Growth areas include network densification and IBS in mature markets. Network rollout and upgrades in others.
LTE commercialization and HetNet infrastructure spending is still key
116+ LTE-A networks globally; 1 of 3 operators will invest in LTE-A in 2016 (Source: BuddeComm 2016)
Complex network requirements driving high end solutions from vendors
Alignment with operator priorities on technologies that can be deployed in next 1-2 years
Core systems team for delivery of expanded turnkey solutions
Revenue
1,347,810
1,134,588
FY 2014 FY 2015
(HK$’000)Y/Y:
-15.8%

Business Review
19

Review & Opportunities:
Revenues increased 18.2% to HK$ 3,092 million
Strong market acceptance and gaining market share:
LTE antenna deployment for China 4G network rollout
Expansion of customer portfolio and international operator demand for antennas and subsystems
2016 and beyond
Antennas are becoming even more crucial as the network becomes more complicated
Capacity demand continues:
Driving demand for MIMO and carrier aggregation antenna & subsystem solutions
Complex network topologies is driving advanced technology antennas with higher selling prices
Focus on R&D for product development of antenna and passive technology
Meet market demand for complex network topology and antenna technology
20
Antennas & Subsystems
Antennas
CombiningSolutions
Revenue
2,616,403
3,092,156
FY 2014 FY 2015
Y/Y:
+18.2%
(HK$’000)

21
Wireless EnhancementReview & Opportunities:
Revenues decreased 12.0% to HK$ 1,004 million
Strong growth in 4G solutions offset by decline in 3G demand
Strong international contribution to revenues
2016 and beyond
Long term growth of DAS and in-building wireless market
Large sporting venues, airports, convention centers, vertical markets
Demand for railway and tunnel wireless solutions
Huge capacity demands in networks and high density areas driving wireless enhancement solutions
Successful deployment in key projects allows solid value proposition for upcoming major sporting events
Growth of enterprise wireless network for focused capacity and featured solutions supporting
Passive DAS /Repeaters
RRU
Revenue
(HK$’000)1,141,617
1,004,095
FY 2014 FY 2015
Y/Y:
-12.0%
Active DAS

22
Wireless Access & Transmission
Review & Opportunities:
Revenues decreased 15.2% to HK$ 286 million
Stable 2015 growth for wireless transmission solutions
Decrease in WLAN solution revenues
2016 and beyond
Commercialization of China’s Satellite Communications market SatCom solutions opportunities
Demand for IP microwave full outdoor systems
High-speed and high-capacity network requirements to drive backhaul solution demands
Exploding wireless data usage globally driving offload solution demands.
Revenue
337,278
285,952
FY 2014 FY 2015
Y/Y:
-15.2%(HK$’000)
WLAN Solutions
Small Cell Solutions Digital MicrowaveSystems
SatelliteSolutions
23
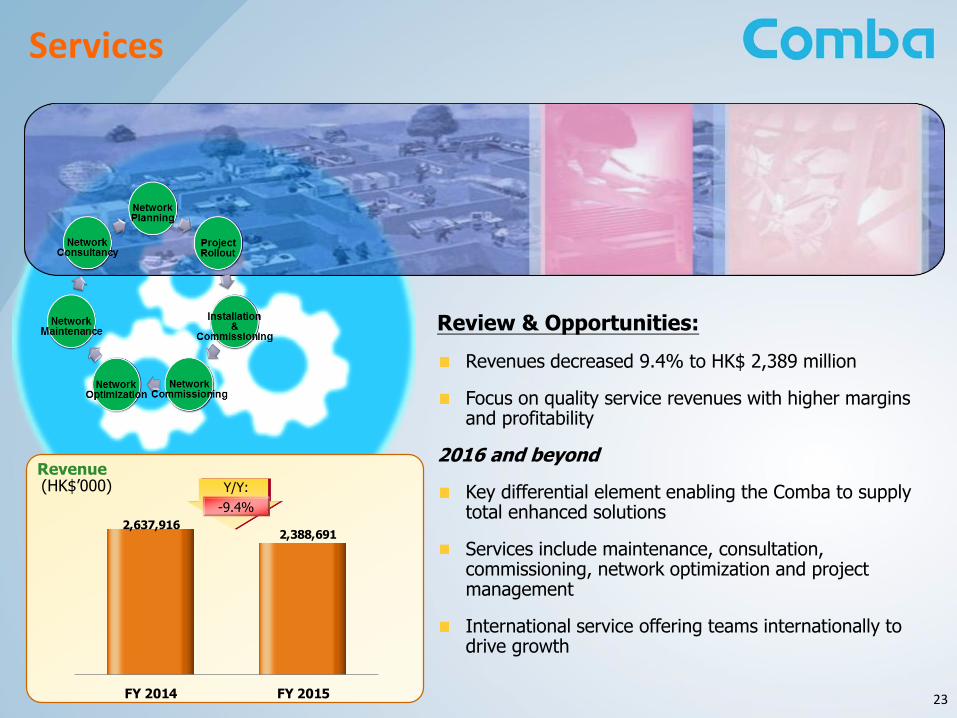
Services
Review & Opportunities:
Revenues decreased 9.4% to HK$ 2,389 million
Focus on quality service revenues with higher margins and profitability
2016 and beyond
Key differential element enabling the Comba to supply total enhanced solutions
Services include maintenance, consultation, commissioning, network optimization and project management
International service offering teams internationally to drive growth
Revenue
2,637,9162,388,691
FY 2014 FY 2015
(HK$’000) Y/Y:
-9.4%
24
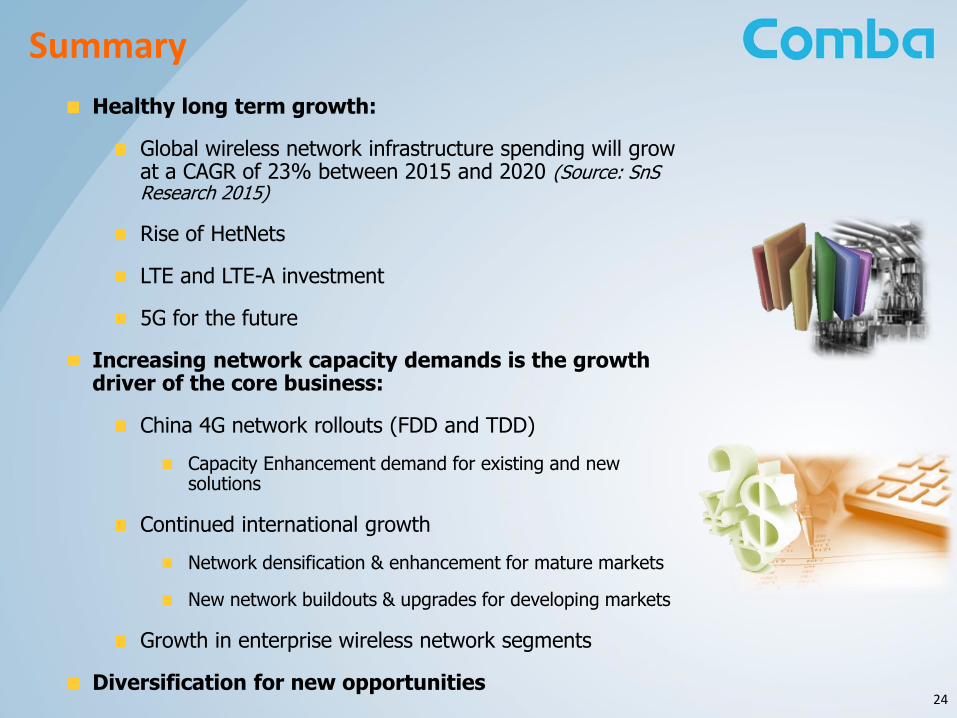
Summary
Healthy long term growth:
Global wireless network infrastructure spending will grow at a CAGR of 23% between 2015 and 2020 (Source: SnSResearch 2015)
Rise of HetNets
LTE and LTE-A investment
5G for the future
Increasing network capacity demands is the growth driver of the core business:
China 4G network rollouts (FDD and TDD)
Capacity Enhancement demand for existing and new solutions
Continued international growth
Network densification & enhancement for mature markets
New network buildouts & upgrades for developing markets
Growth in enterprise wireless network segments
Diversification for new opportunities
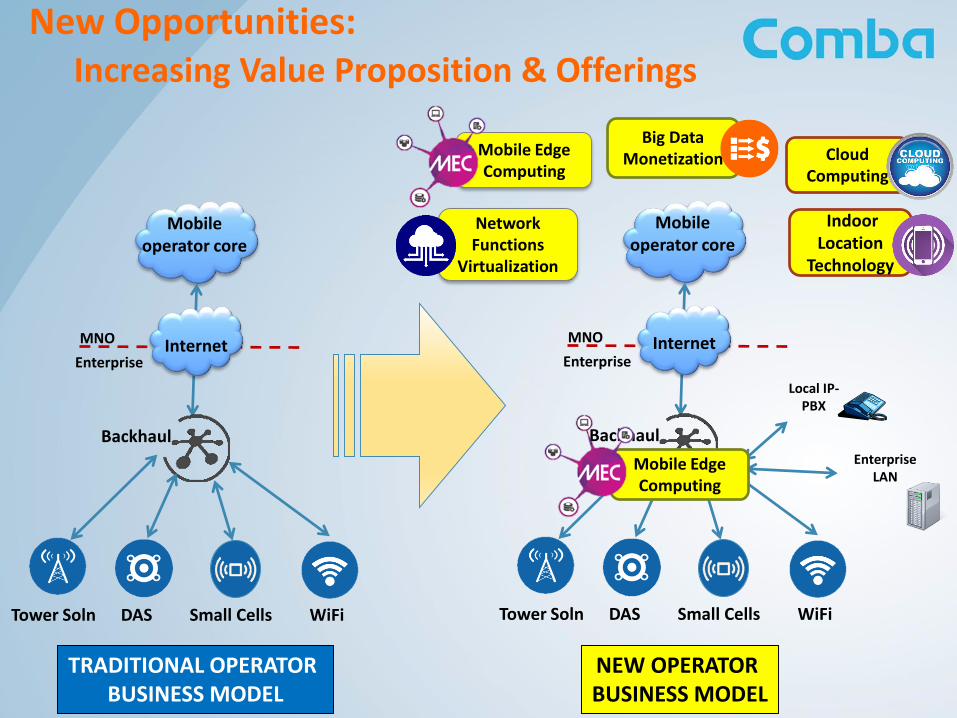
NEW OPERATOR BUSINESS MODEL
Mobile operator core
InternetEnterprise
MNO
Backhaul
Tower Soln DAS Small Cells WiFi
New Opportunities:Increasing Value Proposition & Offerings
Local IP-PBX
Enterprise LAN
Big Data Monetization
Network Functions
Virtualization
Cloud Computing
Mobile Edge Computing
Indoor Location
Technology
Mobile Edge Computing
Mobile operator core
InternetEnterprise
MNO
Backhaul
Tower Soln DAS Small Cells WiFi
TRADITIONAL OPERATOR BUSINESS MODEL

26
Mobile Edge Computing (MEC)
Enables dynamic, real-time user experience(e.g. instant replay video streaming)
Big Data Monetization
Monetizing operator’s subscriber dataCompliant with EU / US data privacy regulation
Accurate Indoor Location Technology
Enabling dynamic, rich content and apps for indoor environments
Internet of Things
Enterprise solutions
New Opportunities: Applications
27
New Opportunities:Uniquely Positioned!
Top Tier Antenna Supplier
Antennas increasingly important core component as network topology grows more complex
Requires deep expertise in creating antennas that can sustain and grow with the network demands
Top 3 DAS Vendor
Leading edge technology and development of all DAS solutions
Unrivalled track record with major sports events and railways
Global #1 for all mobile environment solutions
DAS portfolio addresses high capacity, high density requirements for indoor/outdoor applications
iCell suite as a highly flexible in-fill solution to achieve true ubiquitous wireless connectivity | WiFi completes the hetnet proposition
Global Services and Relationships
Established relationships with most of the world’s leading Telcos
Solid VAS partner to operators in LatAm and China
Unbeatable services capabilities and teams across the world for TOTAL solutions

Thank You
28


