22
The election, the polls, and aftermath Ben Page, Chief Executive, Ipsos MORI [email protected] @benatipsosmori
| Date post: | 18-Jul-2015 |
| Category: |
News & Politics |
| Upload: | ipsos-mori |
| View: | 8,114 times |
| Download: | 0 times |

The election, the polls, and aftermath
Ben Page, Chief Executive, Ipsos MORI
[email protected] @benatipsosmori


Exit poll - 316 Result - 331
Exit poll - 239 Result - 232
Exit poll - 10 Result - 8
Exit poll - 58
Result - 21
Exit poll - 2 Result - 1
Exit poll - 2 Result - 1
Result - 56
Exit poll - 23
Source: Ipsos MORI/GfK NOP for BBC/ITV News /Sky News
Asking what did do,
rather than what will…

Our final poll – all parties less than 2% points away from
actual – except Labour, overestimated
Base: 862 British adults who are registered and certain to vote 5th -6th May 2015
6 HOW WOULD YOU VOTE IF THERE WERE A GENERAL ELECTION TOMORROW?
Source: Ipsos MORI Political Monitor/Ipsos MORI calculations from BBC reports
36%
35%
11%
5%
8% 5%
Ipsos MORI final poll GB final result
Conservative lead = +1 Conservative lead = +6.5
CONSERVATIVE
LABOUR
UKIP
GREEN
LIB DEM
OTHER
37.7%
31.2%
12.9%
3.8%
8.1% 6.4%

Record of the final polls in Britain
Con Lab Lib/Alliance/
LibDem Average
“error”
1959 0 +1 0 0.33
1964 +1 +1 -1 1.00
1966 -1 +3 -1 1.67
1970 -2 +4 -1 2.33
February 1974 0 -2 +2 1.33
October 1974 -2 +2 0 1.33
1979 0 +1 0 0.33
1983 +2 -2 0 1.33
1987 -1 +2 -1 1.33
1992 -5 +4 +1 3.33
1997 0 +3 -1 1.33
2001 -1 +3 -1 1.67
2005 0 +1 0 0.33
2010 -1 -2 +3 2.00 2015 -2 +4 +1 2.33
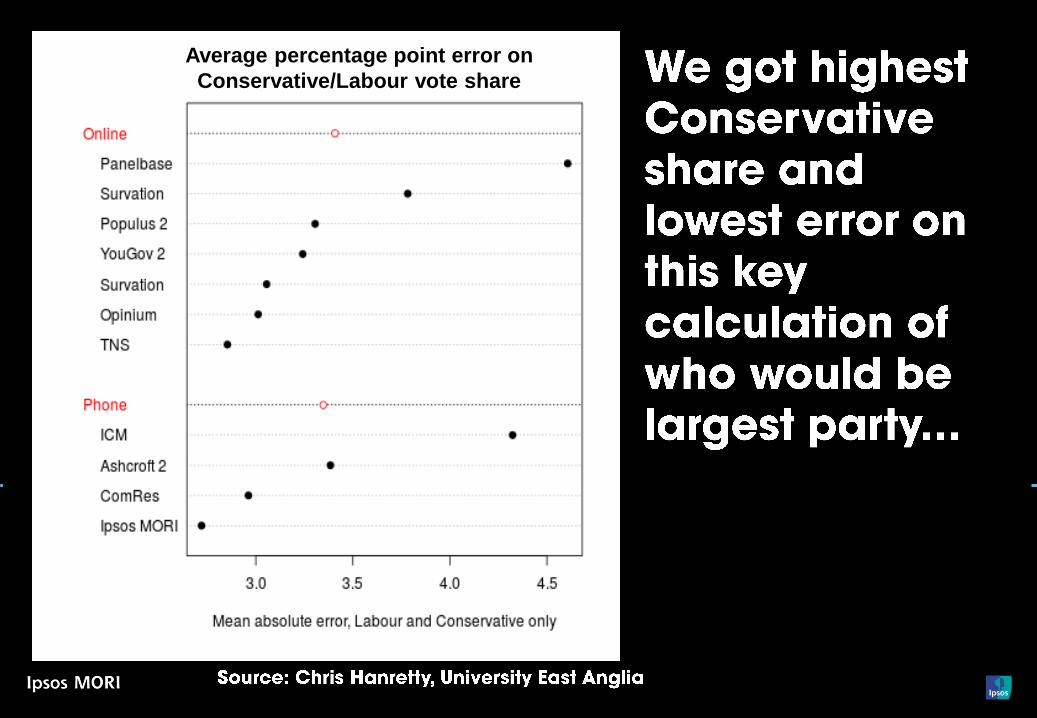
Average percentage point error on
Conservative/Labour vote share
0
5
10
15
20
25
30
35
40
45
50
Jun
10
Au
g 1
0
Oct
10
De
c 1
0
Fe
b 1
1
Ap
r 11
Jun
11
Au
g 1
1
Oct
11
De
c 1
1
Fe
b 1
2
Ap
r 12
Jun
12
Au
g 1
2
Oct
12
De
c 1
2
Fe
b 1
3
Ap
r 13
Jun
13
Au
g 1
3
Oct
13
De
c 1
3
Fe
b 1
4
Ap
r 14
Jun
14
Au
g 1
4
Oct
14
De
c 1
4
Fe
b 1
5
Ap
r 15
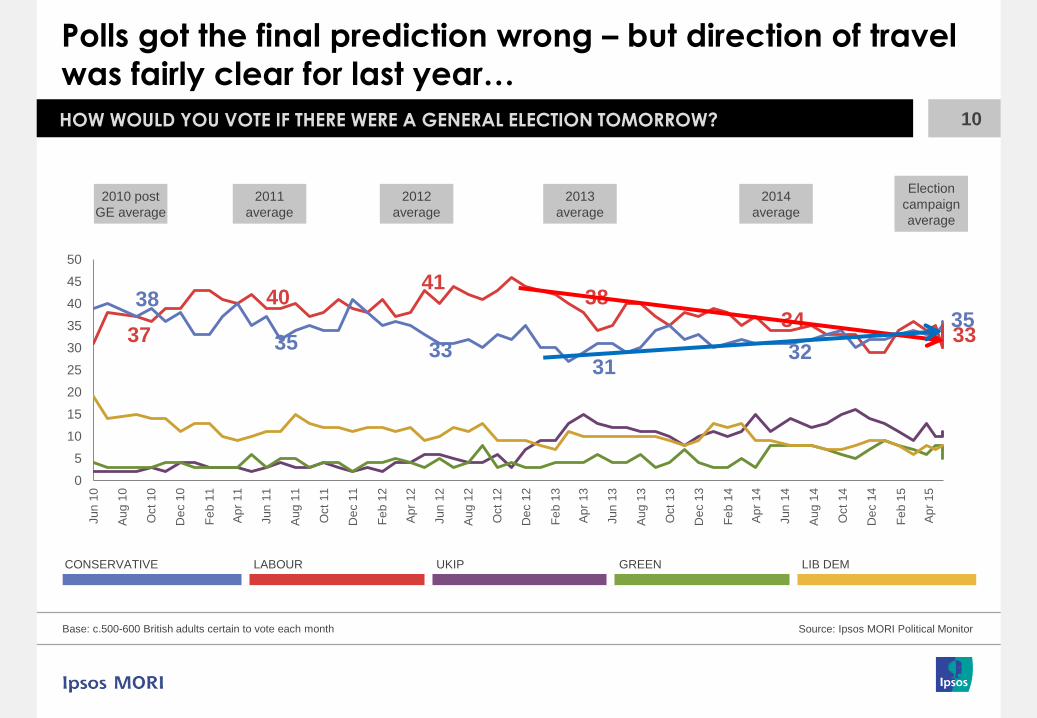
Polls got the final prediction wrong – but direction of travel
was fairly clear for last year…
Base: c.500-600 British adults certain to vote each month
10 HOW WOULD YOU VOTE IF THERE WERE A GENERAL ELECTION TOMORROW?
Source: Ipsos MORI Political Monitor
2013
average
CONSERVATIVE LABOUR UKIP GREEN LIB DEM
38 35 33
Election
campaign
average
31
2014
average
34
32
2012
average
41
33
2011
average
40
35
2010 post
GE average
37
38

‘Shy Tories’ not our problem – instead ‘Lazy Labour’
11 HOW WOULD YOU VOTE IF THERE WERE A GENERAL ELECTION TOMORROW?
Base: 1,186 British adults 18+, 5th – 6th May 2015 Source: Ipsos MORI Political Monitor/Ipsos MORI calculations from BBC reports
9.3
11.3
12.2
12.5
Implied from final poll ActualVotes
(millions)

© Ipsos MORI
50
55
60
65
70
75
80
85
-60 -50 -40 -30 -20 -10 0
2015
2010
2005
Days before election
% certain to vote
-9ppt
-11ppt
-16ppt
Difference between actual turnout and certainty to vote
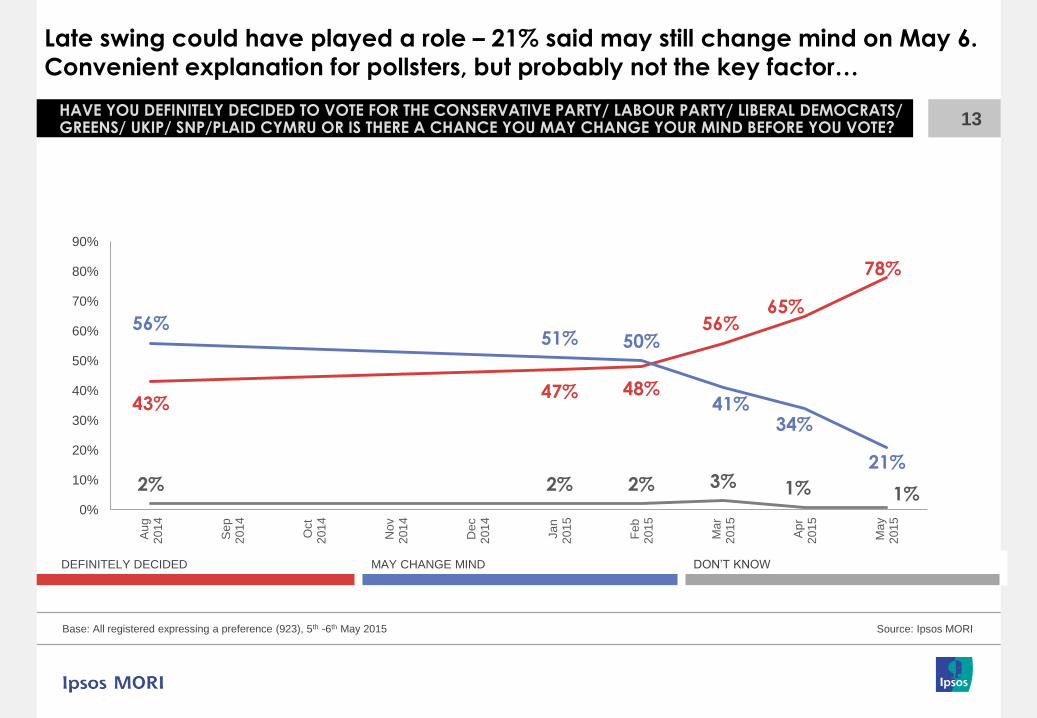
Late swing could have played a role – 21% said may still change mind on May 6.
Convenient explanation for pollsters, but probably not the key factor…
13 HAVE YOU DEFINITELY DECIDED TO VOTE FOR THE CONSERVATIVE PARTY/ LABOUR PARTY/ LIBERAL DEMOCRATS/ GREENS/ UKIP/ SNP/PLAID CYMRU OR IS THERE A CHANCE YOU MAY CHANGE YOUR MIND BEFORE YOU VOTE?
43% 47% 48%
56% 65%
78%
56% 51% 50%
41% 34%
21% 2% 2% 2% 3% 1% 1%
0%
10%
20%
30%
40%
50%
60%
70%
80%
90%
Au
g2
01
4
Se
p2
01
4
Oct
201
4
No
v2
01
4
De
c2
01
4
Ja
n2
01
5
Feb
201
5
Ma
r2
01
5
Ap
r2
01
5
Ma
y2
01
5
DEFINITELY DECIDED MAY CHANGE MIND DON’T KNOW
Source: Ipsos MORI Base: All registered expressing a preference (923), 5th -6th May 2015

Conservatives held on to as much of 2010 vote as Labour (so
starting from higher base), and little direct Con-Lab switching
Base: 260 2010 Conservative voters / 233 2010 Labour voters 5th -6th May 2015 registered and certain to vote
14 HOW WOULD YOU VOTE IF THERE WERE A GENERAL ELECTION TOMORROW? AMONG 2010 CONSERVATIVE AND LABOUR VOTERS
Source: Ipsos MORI Political Monitor
80%
4%
12% 3% 1%
2010 Conservative voters 2010 Labour voters
2015 VOTING
BEHAVIOUR
CONSERVATIVE
LABOUR
UKIP
LIB DEM
OTHER
5%
75%
5%
6% 9%

IN POWER

23%
41%
4% 3%
0
5
10
15
20
25
30
35
40
45
50
Jan
00
Ap
r 00
Jul 00
Oct
00
Jan
01
Ap
r 01
Jul 01
Oct
01
Jan
02
Ap
r 02
Jul 02
Oct
02
Jan
03
Ap
r 03
Jul 03
Oct
03
Jan
04
Ap
r 04
Jul 04
Oct
04
Jan
05
Ap
r 05
Jul 05
Oct
05
Jan
06
Ap
r 06
Jul 06
Oct
06
Jan
07
Ap
r 07
Jul 07
Oct
07
Jan
08
Ap
r 08
Jul 08
Oct
08
Jan
09
Ap
r 09
Jul 09
Oct
09
Jan
10
Ap
r 10
Jul 10
Oct
10
Jan
11
Ap
r 11
Jul 11
Oct
11
Jan
12
Ap
r 12
Jul 12
Oct
12
Jan
13
Ap
r 13
Jul 13
Oct
13
Jan
14
Ap
r 14
Jul 14
Oct
14
Jan
15
Ap
r 15
Conservatives’ led on the “economy stupid”…
16 WHICH PARTY DO YOU THINK HAS THE BEST POLICIES ON MANAGING THE ECONOMY THE CONSERVATIVES, LABOUR, LIBERAL DEMOCRATS OR SOME OTHER PARTY?
Base: c.1,000 British adults each month Source: Ipsos MORI Political Monitor
CONSERVATIVE LABOUR UKIP LIB DEM
57%
51%
44%
47%
40%
56%
33%
24%
35%
50%
20%
45%
31%
24%
33%
46%
34%
31%
26%
17%
19%
33%
64%
43%
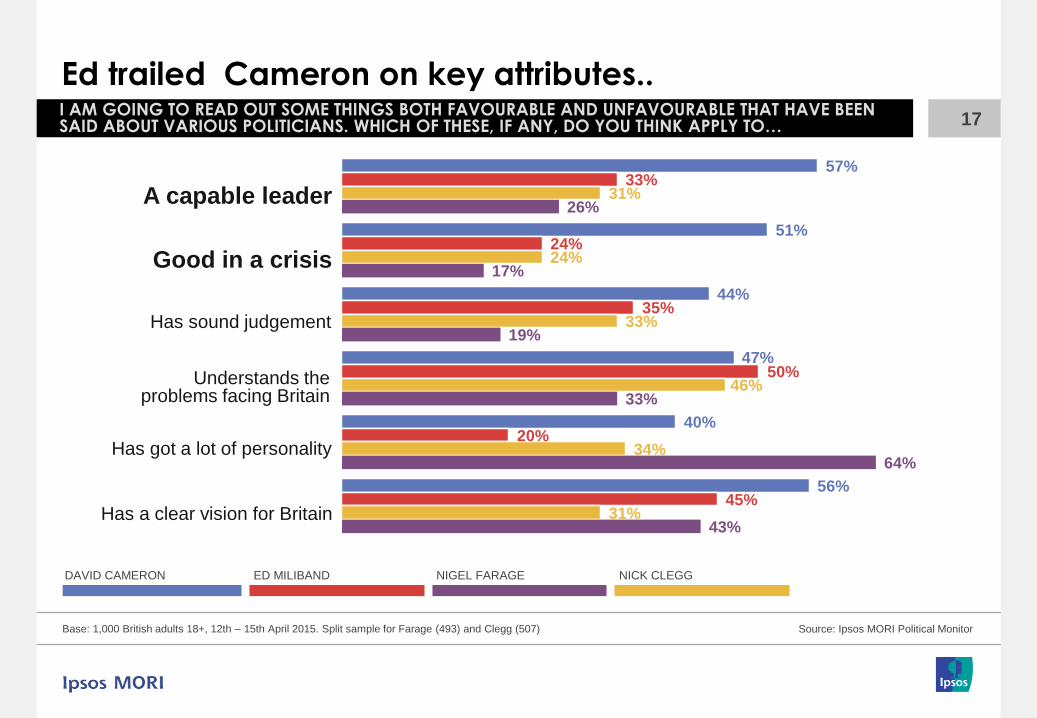
Ed trailed Cameron on key attributes..
17 I AM GOING TO READ OUT SOME THINGS BOTH FAVOURABLE AND UNFAVOURABLE THAT HAVE BEEN SAID ABOUT VARIOUS POLITICIANS. WHICH OF THESE, IF ANY, DO YOU THINK APPLY TO…
DAVID CAMERON ED MILIBAND NIGEL FARAGE NICK CLEGG
Base: 1,000 British adults 18+, 12th – 15th April 2015. Split sample for Farage (493) and Clegg (507) Source: Ipsos MORI Political Monitor
A capable leader
Understands the problems facing Britain
Good in a crisis
Has sound judgement
Has got a lot of personality
Has a clear vision for Britain
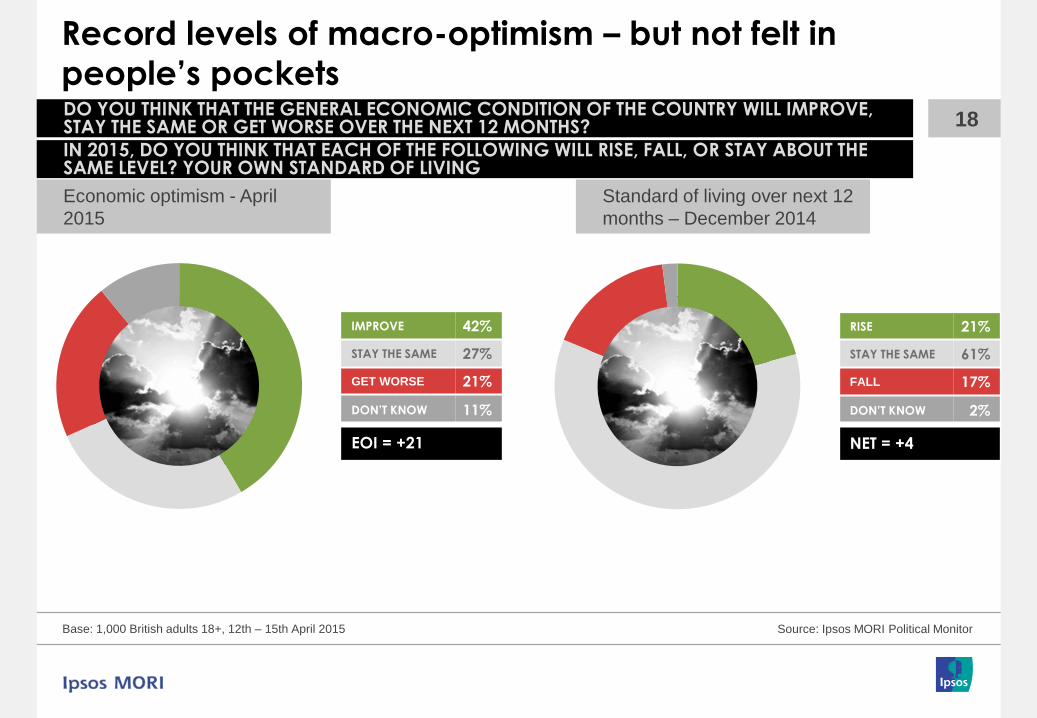
Record levels of macro-optimism – but not felt in
people’s pockets
Base: 1,000 British adults 18+, 12th – 15th April 2015
18 DO YOU THINK THAT THE GENERAL ECONOMIC CONDITION OF THE COUNTRY WILL IMPROVE, STAY THE SAME OR GET WORSE OVER THE NEXT 12 MONTHS?
IN 2015, DO YOU THINK THAT EACH OF THE FOLLOWING WILL RISE, FALL, OR STAY ABOUT THE SAME LEVEL? YOUR OWN STANDARD OF LIVING
Source: Ipsos MORI Political Monitor
Economic optimism - April
2015
IMPROVE 42%
STAY THE SAME 27%
GET WORSE 21%
DON’T KNOW 11%
EOI = +21
RISE 21%
STAY THE SAME 61%
FALL 17%
DON’T KNOW 2%
NET = +4
Standard of living over next 12
months – December 2014
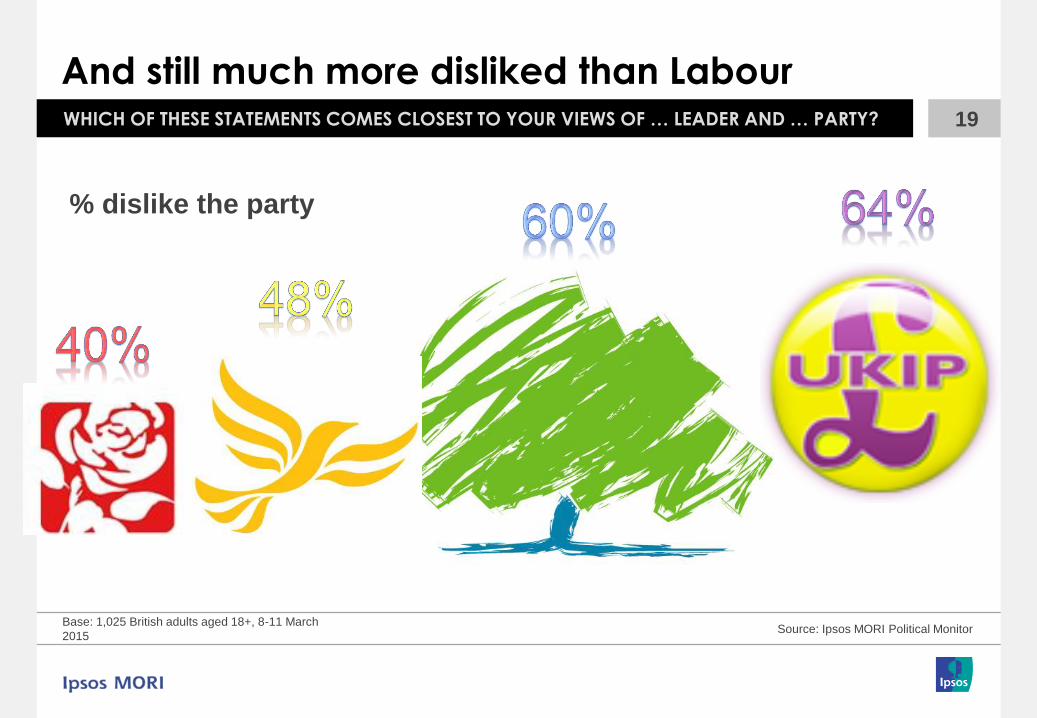
And still much more disliked than Labour
Base: 1,025 British adults aged 18+, 8-11 March
2015 Source: Ipsos MORI Political Monitor
WHICH OF THESE STATEMENTS COMES CLOSEST TO YOUR VIEWS OF … LEADER AND … PARTY? 19
% dislike the party


Political Monitor Trends
Prediction (10 p.m.):
Con 307 seats
Lab 255 seats
LD 59 seats
Result:
Con 307 seats
Lab 258 seats
LD 57 seats
Iain Dale (10:02 p.m.):
The Lib Dems are
only predicted to get
59 seats. I'll run
naked down
Whitehall
if that turns out to be
true


