AbstractThe academic program life cycle (APLC) concept states
each program’s life flows through several stages: introduction, growth, maturity, and decline. A mixed-influence diffusion growth model is fitted to annual enrollment data on academic programs to analyze the factors determining progress of academic programs through their life cycles. The regression analysis yields reasonable parameter estimates, including magnitude of enrollment peaks and duration of stages, and describes growth patterns of academic programs very well. The results indicate that key factors accounting for progress of academic programs through life cycle stages are external information and word-of-mouth communication (social and behavioral factors as well as economic factors). The model’s application for analyzing market dynamics and long-range forecasting is demonstrated.
IntroductionChallenges and competition in the education sector
have created a situation where postsecondary institutions are viewed as producers and their academic programs are viewed as products; and students are perceived as end-users or customers in the education marketplace. In the past, postsecondary institutions sprang up on the assumption that “if you build, they will come.” This assumption is no longer sustainable. In recent years, it has been claimed that colleges and universities have been characterized by the “market ethos,” which is said to involve the transformation of educational values into business values (Karabel, 2005; Tuchman, 2009). Colleges and universities see the purpose of education in
Using Advanced Tools, Techniques, and Methodologies
Supporting quality data and decisions for higher education.
Edward H. K. Acquah, Ph.D.Senior Institutional AnalystAthabasca University
A Growth Model For The Academic Program Life Cycle (APLC): A Theoretical And Empirical Analysis 1
1 This paper is a revision of a presentation at the 50th Annual AIR Forum, Chicago, IL, May 29–June 2, 2010.
Page 2 IR Applications, Number 33, A Growth Model For The Academic Program Life Cycle (APLC)
more practical terms, such as preparing students for jobs (workforce development; Tuchman). More importantly, according to Tuchman, colleges and universities perceive knowledge and job preparation as commodities whose transmission is purchased by student customers (and their parents), when they pay tuition, room, board, and other fees.
According to this perception, education has become a market transaction in which potential buyers (students and their parents) must be actively sought after and motivated with incentives to buy into an institution’s market offerings. Like businesses, academic institutions require innovative marketing strategies in order to survive and grow in the highly competitive postsecondary market. These marketing strategies depend on the stage of each academic program in its life cycle. The APLC is a powerful marketing tool. Effective program marketing requires that deans, directors, and program managers understand how to introduce new academic programs, how to manage them during their lives, and when to withdraw or eliminate those academic programs that no longer enjoy a meaningful market demand.
This empirical work was based on an open university, which is a distance and online institution with an open admissions policy, that is, one that admits students without regard to their previous educational background or achievements. To enter an open university as an undergraduate student, you must be 16 or older. No other conditions apply. However, advanced programs and courses have academic prerequisites (see Athabasca University at http://calendar.athabascau.ca/undergrad/current/). An open university is dedicated to removing the educational, geographical, financial, social, cultural, and other barriers that often limit access to postsecondary achievement. In doing so, it guarantees access to university-level study to a broad range of nontraditional students, transforming lives and enriching families and communities. An open university’s programs, courses, teaching, and learning are characterized by continuous enrollments; flexible scheduling; study at anytime, anywhere; minimal program admission requirements; transfer of existing credits from
other institutions; and acceptance of prior learning assessment and recognition (PLAR: that is, credits for learning from life and work experience).
Research ObjectiveAn open and distance learning (ODL) university
in Canada (Canada’s Open University) has been offering various quality academic and professional certificate and degree programs through partly online and partly distance delivery in Canada and the rest of the world for more than 20 years; however, no attempt has been made to study the life cycles of the ODL academic programs offered. There has been a rapid growth in ODL programs both as a result of an increasing number of ODL institutions worldwide and the incursion of traditional postsecondary institutions into the ODL submarket with new ODL academic program offerings, creating additional competitive pressures. In the ensuing competition, each institution is trying to secure a sustainable share of the ODL submarket. The ODL university would therefore need to implement innovative marketing strategies in order to achieve its market share objectives and keep up with the emerging competition in the ODL submarket.
Product Life Cycles (PLC) have been used as a basis for product planning and control in marketing (Schultz & Rao, 1986). PLC studies have been done for a wide variety of products such as cigarette brands, blenders, washers and dryers, refrigerators, air conditioners, radios, televisions, coffee makers, microwaves, and vacuum cleaners (Cox, 1967; Polli & Cook, 1969; Schultz & Rao, 1986). The PLC concept can also be used as a basis for planning and control of academic programs in academe.
The paucity of rigorous theoretical and empirical research on the life cycles and diffusion of academic programs needs little emphasis. Scouring through the literature, only two were found. For example, Mukerji and Tripathi (2004) applied the PLC concept and charts to analyze the life cycle of an MBA program launched in 1991 at the Indian Government National Open University (IGNOU), which peaked in enrollments in 1997 while passing through the growth stage and declined subsequently. In a similar way, Lakatos (1998)
Page 3 IR Applications, Number 33, A Growth Model For The Academic Program Life Cycle (APLC)
used charts to illustrate the stages in an academic program life cycle.
The current study is different not only from the two examples above but also from known program evaluation/assessment studies, which only measure and articulate quality of student learning in a program, collect data, and interpret results to make informed curricular decisions to improve learning and teaching in an academic program. The current work attempts to make up for the apparent neglect by offering a theoretical framework for the analysis of life cycles of academic programs. Specifically, the study employs economic and marketing concepts and econometric tools to analyze the growth of ODL academic programs during their life cycles (APLC) in order to determine the underlying forces of the growth (diffusion) of these academic programs.
This is particularly important because, in addition to the paucity of PLC research in academe, ODL institutions and some of their programs are relatively new and lend themselves to adoption and diffusion studies (Bass, 1969; Mahajan & Muller, 1979; Rogers, 1962). Unlike the approaches used by previous researchers (Lakatos, 1998; Mukerji & Tripathi, 2004), the purposes of this work are (a) to present an operational growth (diffusion) model consistent with the assumptions underlying the PLC concept, (b) to specify test statistics with which to evaluate the performance of the model as applied to program life cycles, and (c) to present the results of analyses, which make use of observed enrollment data in 12 academic programs at an ODL university. These academic programs include undergraduate bachelor’s degrees, diplomas, and certificates. The model hypothesizes that enrollments in academic programs follow a consistent sequence of stages beginning with introduction and proceeding to growth, then into maturity, and eventually into decline, ceteris paribus. The model’s parameters (k1 represents external information; k2 represents internal information) will show that external and internal information are the main underlying influences shaping the enrollment decisions of potential students in academic programs.
The knowledge and insights that would emerge from these analyses are important for enrollment
planning, formulation and implementation of enrollment marketing strategies, and forecasting of enrollments at the program level. The PLC model has been utilized for predictive purposes and as an aid in planning and policy formulation by previous researchers (Bass, 1969; Kotler, 1971). For example, the identification of stages in the life cycle is thought useful because they permit evaluation of a series of tactical and strategic considerations bearing on program policy and new program development (Bass, 1969; Kotler, 1971).
Literature ReviewFor many years, the PLC concept has been
applied only in business to determine the stages durable and nondurable consumer products go through in their life cycles and to forecast the duration of life cycle stages (Brinbaum, 1998; Cox, 1967; Modis, 1994; Polli & Cook, 1969; Schultz & Rao, 1986; Shane & Ulrich, 2004; Shewchuk, 1992). PLC researchers have neglected academic programs of study offered by academic institutions. Recently, however, institutional researchers have begun to apply PLC concepts and tools to the analysis of academic programs life cycles (Lakatos, 1998; Mukerji & Tripathi, 2004). In business, all products have life processes; in academia, all academic programs are also deemed to possess life cycles. The life cycle of a product is a depiction of its sales history from its market inception to its withdrawal from the market. The PLCs of products are, in effect, sales volume curves. According to the PLC concept, all products begin life with the first sale of the product, rise to a peak, and then decline until their usefulness to buyers and their contributions to profits are insufficient to justify their presence in the market (Kotler, 2000). The intuitive logic of the PLC concept is that each product’s life typically flows through distinct stages of growth: development, introduction, growth, maturity, and decline.
On the other hand, the life cycle of an academic program (APLC) is a depiction of its enrollment/registration history from its development/introduction to its withdrawal from an institution’s
Page 4 IR Applications, Number 33, A Growth Model For The Academic Program Life Cycle (APLC)
portfolios of programs. The life cycles of academic programs are, in effect, enrollment/registration volume curves. According to the APLC concept, all academic programs begin life with the first set of enrollment/registrations, rise to a peak, and then decline—or, they may be revised and renewed, replaced, or withdrawn. Thus, an academic program might typically diffuse over its life through several distinct stages, which include introduction, growth, maturity, and decline, and/or a second growth, maturity, and decline.
Initially, a new academic program diffuses or attempts to gain a foothold in the market with slow enrollments and course registrations because it might be new, untried, or untested (Introduction Stage). Programs need time to gain acceptance. If the program gains market acceptance, it should, at some point in time, launch into a period of comparatively rapid growth (Growth Stage). This growth stage is exemplified by enrollments/course registrations increasing at an increasing rate or by an upward-rising steep curve. The slope of the enrollment curve is steepest during this stage, but as the program approaches the end of the growth stage, enrollments begin to level off. A change in the growth rate heralds this change, which is indicated by enrollments increasing at a decreasing rate. When the enrollment growth rate has peaked, the program passes into the maturity stage (Maturity Stage). The volume of enrollments peaks and then starts declining during the maturity stage. When the rate of decline begins to accelerate, the Decline Stage is underway. This might culminate in the disappearance of the academic program from the market and from the academic institution’s portfolio of programs, or the program might require revision and renewal.
The diffusion of an academic program, sequence and duration, shape of the curve, and magnitude of enrollments at each transition of the APLC (diffusion) are influenced by numerous forces. The determinants of the rate of program diffusion at the introduction stage include perceived advantage of the program relative to the best available alternative and awareness of the program and its benefits to prospective students (Zaltman & Stiff, 1973). The impact of government educational policies can
be especially dramatic during the growth stage. Expansion from demographic changes, changes in social and economic trends and student learning (student experience with the program) can impact enrollments in the program at the growth stage as well as in the transition to maturity. On the other hand, unfavorable demographic changes such as relocation and/or out-migration can accelerate the onset of decline.
Although the APLC and the PLC appear simplistic, these concepts have descriptive value when used as a systematic framework for explaining market dynamics (Day, 1981). Researchers have used the PLC as a forecasting model in marketing (Bass, 1969, 1980). It has been used to model the factors that determine the progress of a product through the stages of the life cycle (Mahajan & Muller, 1979), to establish the life cycle position of the product, and as a tool to formulate competitive strategies (Day, 1981).
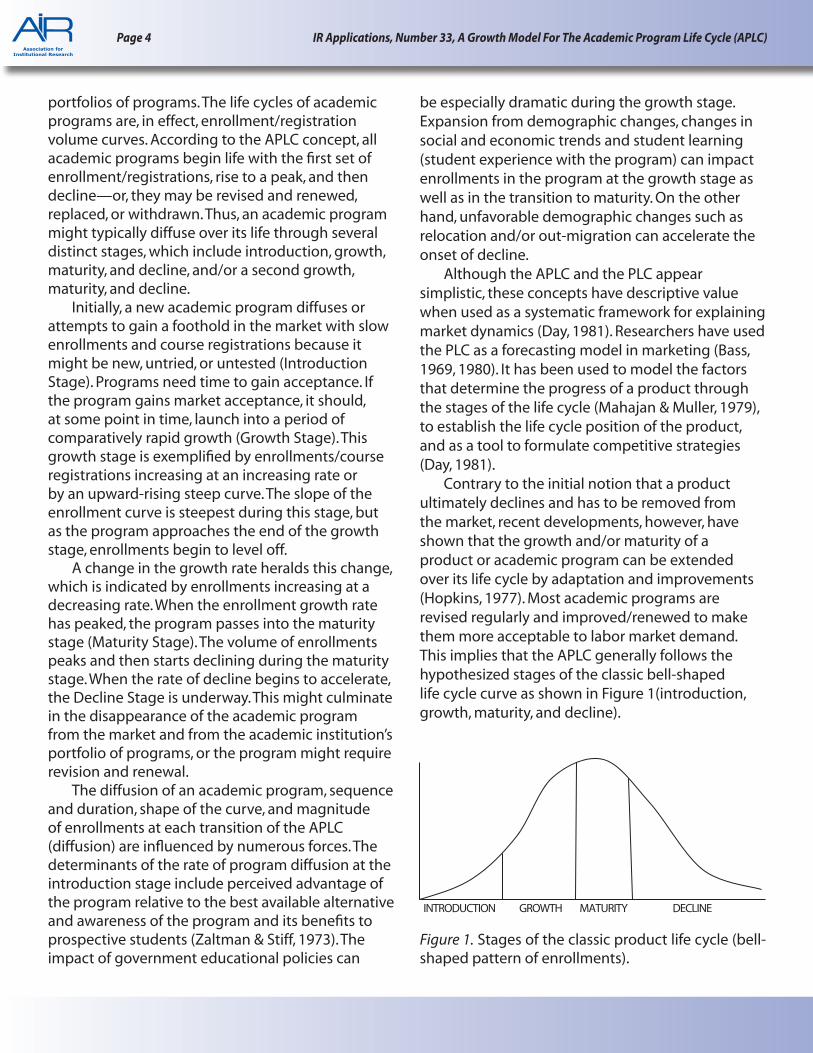
Contrary to the initial notion that a product ultimately declines and has to be removed from the market, recent developments, however, have shown that the growth and/or maturity of a product or academic program can be extended over its life cycle by adaptation and improvements (Hopkins, 1977). Most academic programs are revised regularly and improved/renewed to make them more acceptable to labor market demand. This implies that the APLC generally follows the hypothesized stages of the classic bell-shaped life cycle curve as shown in Figure 1(introduction, growth, maturity, and decline).
INTRODUCTION GROWTH MATURITY DECLINE
Figure 1. Stages of the classic product life cycle (bell-shaped pattern of enrollments).
Page 5 IR Applications, Number 33, A Growth Model For The Academic Program Life Cycle (APLC)
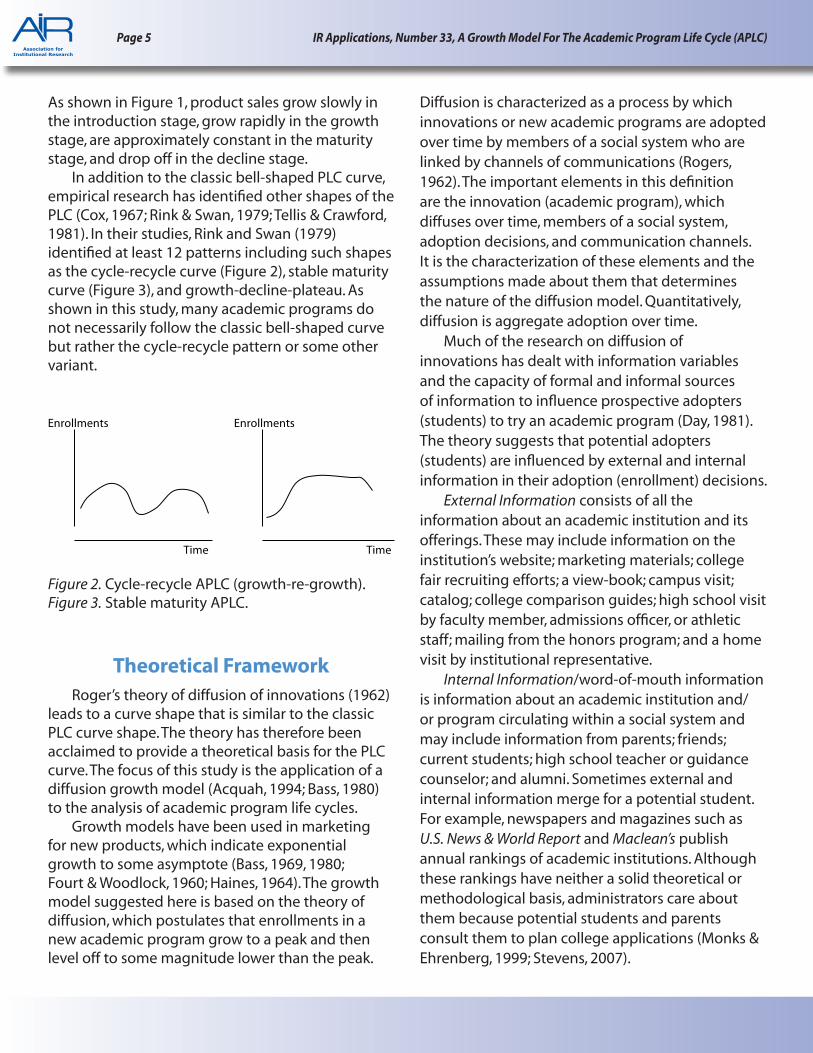
As shown in Figure 1, product sales grow slowly in the introduction stage, grow rapidly in the growth stage, are approximately constant in the maturity stage, and drop off in the decline stage.
In addition to the classic bell-shaped PLC curve, empirical research has identified other shapes of the PLC (Cox, 1967; Rink & Swan, 1979; Tellis & Crawford, 1981). In their studies, Rink and Swan (1979) identified at least 12 patterns including such shapes as the cycle-recycle curve (Figure 2), stable maturity curve (Figure 3), and growth-decline-plateau. As shown in this study, many academic programs do not necessarily follow the classic bell-shaped curve but rather the cycle-recycle pattern or some other variant.
Theoretical FrameworkRoger’s theory of diffusion of innovations (1962)
leads to a curve shape that is similar to the classic PLC curve shape. The theory has therefore been acclaimed to provide a theoretical basis for the PLC curve. The focus of this study is the application of a diffusion growth model (Acquah, 1994; Bass, 1980) to the analysis of academic program life cycles.
Growth models have been used in marketing for new products, which indicate exponential growth to some asymptote (Bass, 1969, 1980; Fourt & Woodlock, 1960; Haines, 1964). The growth model suggested here is based on the theory of diffusion, which postulates that enrollments in a new academic program grow to a peak and then level off to some magnitude lower than the peak.
Diffusion is characterized as a process by which innovations or new academic programs are adopted over time by members of a social system who are linked by channels of communications (Rogers, 1962). The important elements in this definition are the innovation (academic program), which diffuses over time, members of a social system, adoption decisions, and communication channels. It is the characterization of these elements and the assumptions made about them that determines the nature of the diffusion model. Quantitatively, diffusion is aggregate adoption over time. Much of the research on diffusion of innovations has dealt with information variables and the capacity of formal and informal sources of information to influence prospective adopters (students) to try an academic program (Day, 1981). The theory suggests that potential adopters (students) are influenced by external and internal information in their adoption (enrollment) decisions. External Information consists of all the information about an academic institution and its offerings. These may include information on the institution’s website; marketing materials; college fair recruiting efforts; a view-book; campus visit; catalog; college comparison guides; high school visit by faculty member, admissions officer, or athletic staff; mailing from the honors program; and a home visit by institutional representative.
Internal Information/word-of-mouth information is information about an academic institution and/or program circulating within a social system and may include information from parents; friends; current students; high school teacher or guidance counselor; and alumni. Sometimes external and internal information merge for a potential student. For example, newspapers and magazines such as U.S. News & World Report and Maclean’s publish annual rankings of academic institutions. Although these rankings have neither a solid theoretical or methodological basis, administrators care about them because potential students and parents consult them to plan college applications (Monks & Ehrenberg, 1999; Stevens, 2007).
Page 6 IR Applications, Number 33, A Growth Model For The Academic Program Life Cycle (APLC)
The Analytical FrameworkThe Basic Growth Model
These considerations suggest the formulation of a basic diffusion growth model, which is explicitly based on the external and internal sources of information about the new academic program (innovation), but also implicitly takes into account the other diffusion elements such as the members of the potential social system. Assuming that both external and internal information are effective in generating new student enrollments in an academic program, then, the number of new enrollments in a time, ∆t, is given by the following equation:
∆At=k1 (M* – At ∆t) + k2At [M* – At ∆t] (1)
Where:
∆At = new enrollments in an academic program in year t;
At = the cumulative number of previous enrollments in an academic program in year t;
k1 = parameter measuring the effectiveness of external information (influence) in generating new enrollments;
k2 = parameter measuring the effectiveness of internal information (influence) or word-of-mouth in generating new enrollments in an academic program;
M* = the ceiling number of potential adopters (students) of an academic program in the social system; and
[M*-At] = the remaining number of potential adopters (students) of an innovation (academic program) in year t.
Using differential notations:
dAt = k1 (M* - At) dt + k2At [M* - At] dt
dAt/dt = k1 (M* - At) + k2At [M* - At] (2)
Where, dAt/dt = instantaneous rate of diffusion (growth) of the new academic program at time t, best shown as an S-shaped curve (Figure 4).
This model is known as the Basic Mixed-Influence Diffusion Growth Model (Acquah, 1994). It is similar to the new product growth model for
consumer durables introduced by Bass (1969) and extended by Mahajan and Schoeman (1977). In his new growth model, Bass (1969) classified the population of potential adopters as innovators and imitators and included “coefficient of innovation,” (k1), and “coefficient of imitation,” (k2), to capture their roles in the diffusion growth process.
According to Bass (1969) innovators (students) are progressive members of the potential adopters in the social system. They are venturesome, daring, and less risk-averse, and their decision to enroll in an academic program is based mainly on information from the academic institution. On the other hand, imitators (students) base their decision to enroll in an academic program not only on external information but, more importantly, also on word-of-mouth communication such as information from current students, alumni, relatives, parents, and friends.
The final model, which is conducive for estimation, can be specified as follows2:
at = k1M* + (k2 - k1) At-1 – (k2/M*)At-12
(3)
Equation 3 states that the number of new enrollments in an academic program is a function of the number of potential adopters in the social system, M*, external influence (k1), and internal influence (k2). For successful academic programs, the coefficient of internal influence, k2, will ordinarily
Enrollments
Time
Figure 4. The S-shaped cumulative enrollments curve.
2 See Bass (1969) for the full derivation of Equation 3.
Page 7 IR Applications, Number 33, A Growth Model For The Academic Program Life Cycle (APLC)
be much larger than the coefficient of external influence, k1, and enrollment will attain its maximum value at about the time cumulative enrollment is approximately one-half of M* (Bass, 1969). A modified form of this equation has been used to study the diffusion of administrative policies among American states (Bruce-Cry, 1983; Cray, 1973; Mahajan, Kumar, & Haynes, 1977; Walker, 1969), new products (Bass, 1969; Mahajan & Petersen, 1979; Robinson & Lakhani, 1975), and diffusion of cocoa spraying chemicals and hybrid cocoa seeds (Acquah, 1994; Akinola, 1984).
As specified in Equation 3, the model can be used to show that the maximum number of enrollments in an academic program as a function of time coincides with the maximum number of enrollments as a function of the total number of potential enrollments (see Bass, 1969). It can also be used to show that the cumulative number of program enrollments is a function of the total number of students in the social system. First, differentiate Equation 3 with respect to At and set it equal to zero:
dat
= (k2M - k1)M* – 2k2At = 0dAt
2k2At = (k2 - k1)M*
(k2 - k1)M*
At =
2k2
This equation states that the cumulative number of program enrollments (At) is a function of the number of potential students (M*).
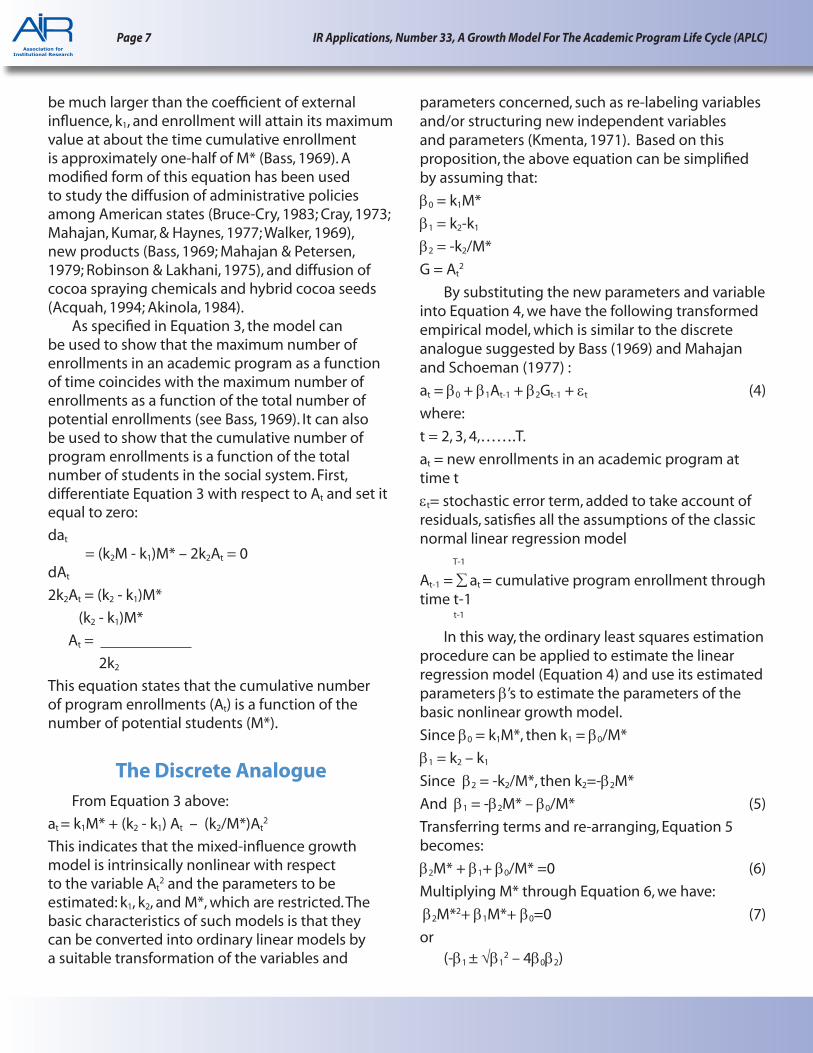
The Discrete AnalogueFrom Equation 3 above:
at = k1M* + (k2 - k1) At – (k2/M*)At2
This indicates that the mixed-influence growth model is intrinsically nonlinear with respect to the variable At
2 and the parameters to be estimated: k1, k2, and M*, which are restricted. The basic characteristics of such models is that they can be converted into ordinary linear models by a suitable transformation of the variables and
parameters concerned, such as re-labeling variables and/or structuring new independent variables and parameters (Kmenta, 1971). Based on this proposition, the above equation can be simplified by assuming that:
b0 = k1M*
b1 = k2-k1
b2 = -k2/M*
G = At2
By substituting the new parameters and variable into Equation 4, we have the following transformed empirical model, which is similar to the discrete analogue suggested by Bass (1969) and Mahajan and Schoeman (1977) :
at = b0 + b1At-1 + b2Gt-1 + et (4)
where:
t = 2, 3, 4,…….T.
at = new enrollments in an academic program at time t
et= stochastic error term, added to take account of residuals, satisfies all the assumptions of the classic normal linear regression model T-1
At-1 = ∑ at = cumulative program enrollment through time t-1 t-1
In this way, the ordinary least squares estimation procedure can be applied to estimate the linear regression model (Equation 4) and use its estimated parameters b’s to estimate the parameters of the basic nonlinear growth model.
Since b0 = k1M*, then k1 = b0/M*
b1 = k2 – k1
Since b2 = -k2/M*, then k2=-b2M*
And b1 = -b2M* – b0/M* (5)
Transferring terms and re-arranging, Equation 5 becomes:
b2M* + b1+ b0/M* =0 (6)
Multiplying M* through Equation 6, we have:
b2M*2+ b1M*+ b0=0 (7)
or (-b1 ± √b1
2 – 4b0b2)
Page 8 IR Applications, Number 33, A Growth Model For The Academic Program Life Cycle (APLC)
M* = (8) 2b2
The parameters k1, k2, and M* are identified because we have three equations with three unknowns. This model, along with others (Acquah, 1994; Bass, 1969; Wind, 1981) assumes the following: an S-shaped diffusion curve; homogenous potential adopters (students) of the program; no consideration of economic decision variables; and constrained long-run growth given the fixed number of potential adopters in the social system (M*).
Regression AnalysisThe model was tested by developing regression
estimates for the parameters in Equation 5 using annual time series enrollment data for academic programs at an ODL university in Canada. Students rarely repeat enrollment in an academic program of studies, which means that the enrollment data are unique headcount and do not include repeat enrollments. There is no problem of “repeat sales” encountered in growth models for consumer products (Bass, 1969). A student can enroll in a program but register in several courses related to the program to satisfy the program requirements. Enrollment is different from course registrations.
The enrollment data were calculated on an annual basis (Bass, 1969). The purpose of a growth model is to develop a theory of the timing of initial
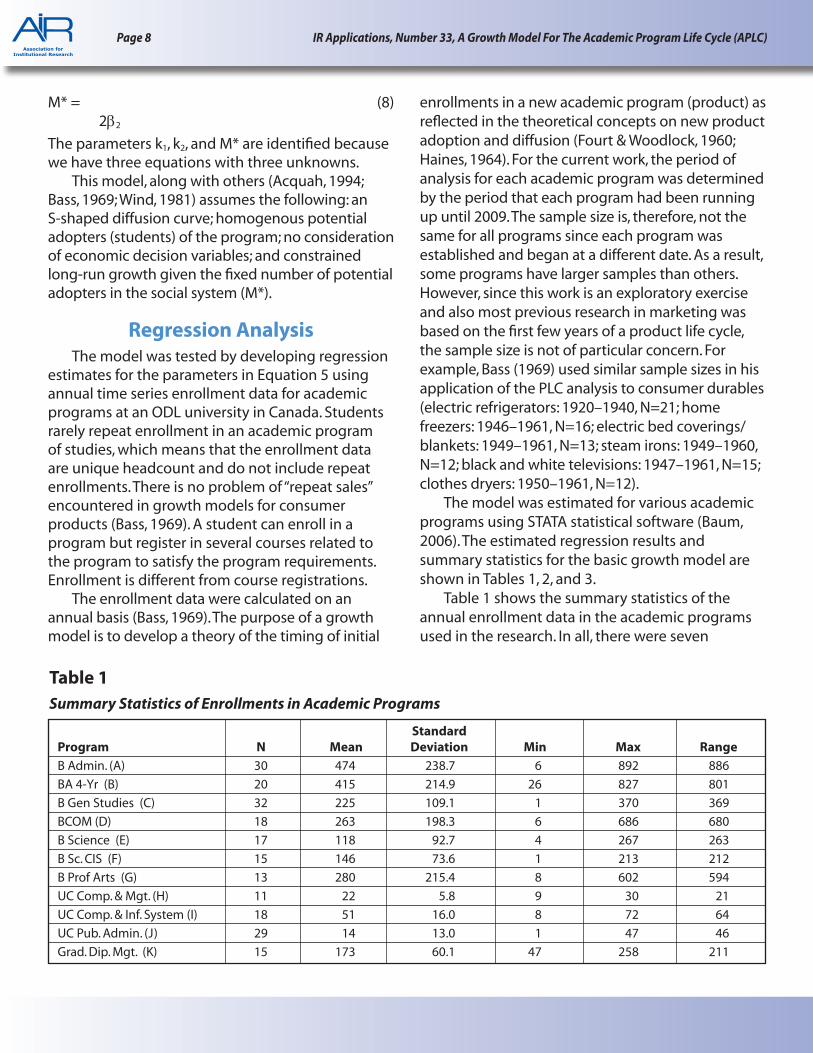
enrollments in a new academic program (product) as reflected in the theoretical concepts on new product adoption and diffusion (Fourt & Woodlock, 1960; Haines, 1964). For the current work, the period of analysis for each academic program was determined by the period that each program had been running up until 2009. The sample size is, therefore, not the same for all programs since each program was established and began at a different date. As a result, some programs have larger samples than others. However, since this work is an exploratory exercise and also most previous research in marketing was based on the first few years of a product life cycle, the sample size is not of particular concern. For example, Bass (1969) used similar sample sizes in his application of the PLC analysis to consumer durables (electric refrigerators: 1920–1940, N=21; home freezers: 1946–1961, N=16; electric bed coverings/blankets: 1949–1961, N=13; steam irons: 1949–1960, N=12; black and white televisions: 1947–1961, N=15; clothes dryers: 1950–1961, N=12). The model was estimated for various academic programs using STATA statistical software (Baum, 2006). The estimated regression results and summary statistics for the basic growth model are shown in Tables 1, 2, and 3.
Table 1 shows the summary statistics of the annual enrollment data in the academic programs used in the research. In all, there were seven
StandardProgram N Mean Deviation Min Max RangeB Admin. (A) 30 474 238.7 6 892 886
BA 4-Yr (B) 20 415 214.9 26 827 801
B Gen Studies (C) 32 225 109.1 1 370 369
BCOM (D) 18 263 198.3 6 686 680
B Science (E) 17 118 92.7 4 267 263
B Sc. CIS (F) 15 146 73.6 1 213 212
B Prof Arts (G) 13 280 215.4 8 602 594
UC Comp. & Mgt. (H) 11 22 5.8 9 30 21
UC Comp. & Inf. System (I) 18 51 16.0 8 72 64
UC Pub. Admin. (J) 29 14 13.0 1 47 46
Grad. Dip. Mgt. (K) 15 173 60.1 47 258 211
Table 1Summary Statistics of Enrollments in Academic Programs
Page 9 IR Applications, Number 33, A Growth Model For The Academic Program Life Cycle (APLC)
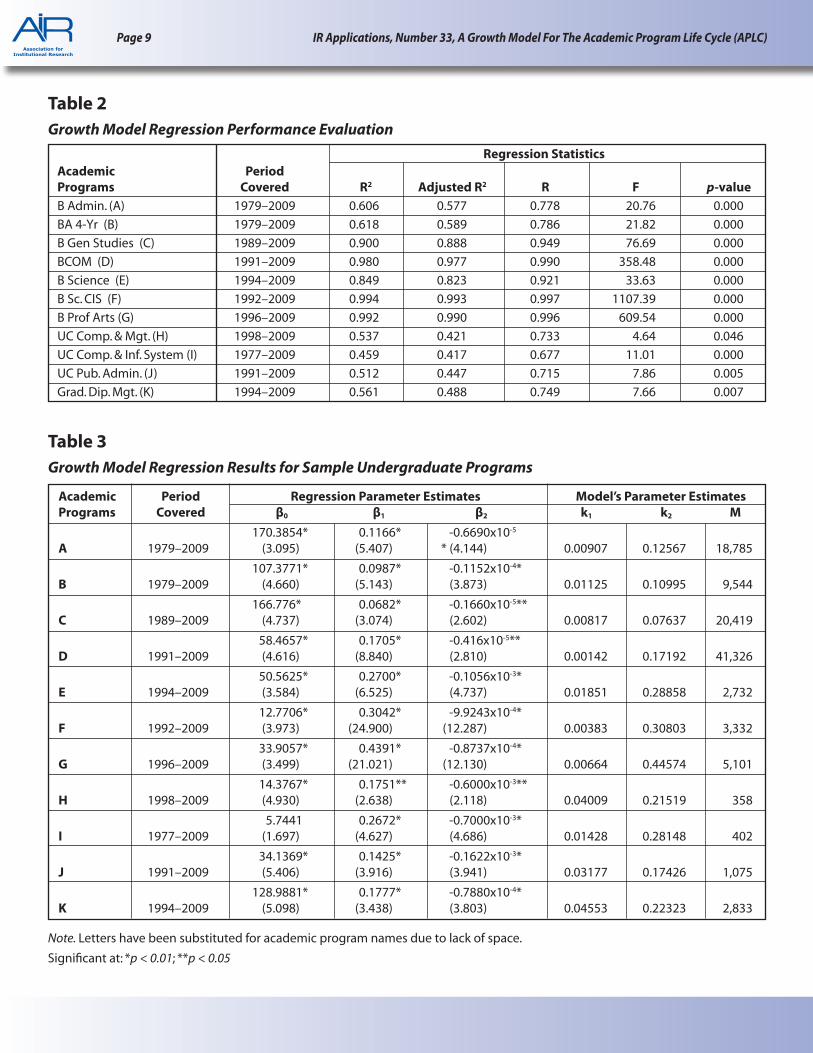
Regression StatisticsAcademic PeriodPrograms Covered R2 Adjusted R2 R F p-valueB Admin. (A) 1979–2009 0.606 0.577 0.778 20.76 0.000
BA 4-Yr (B) 1979–2009 0.618 0.589 0.786 21.82 0.000
B Gen Studies (C) 1989–2009 0.900 0.888 0.949 76.69 0.000
BCOM (D) 1991–2009 0.980 0.977 0.990 358.48 0.000
B Science (E) 1994–2009 0.849 0.823 0.921 33.63 0.000
B Sc. CIS (F) 1992–2009 0.994 0.993 0.997 1107.39 0.000
B Prof Arts (G) 1996–2009 0.992 0.990 0.996 609.54 0.000
Table 3 Growth Model Regression Results for Sample Undergraduate Programs
Note. Letters have been substituted for academic program names due to lack of space.
Significant at: *p < 0.01; **p < 0.05
Page 10 IR Applications, Number 33, A Growth Model For The Academic Program Life Cycle (APLC)
bachelor’s degree programs, three Undergraduate University Certificate programs, and one Graduate Diploma program, with a sample size or years of availability ranging between 11 and 30, which are in line with the sample sizes used in most previous research (Bass, 1969). The mean enrollments in the programs ranged between 14 and 474. With minimum enrollments in the programs ranging between 1 and 47 and maximum enrollments between 30 and 892, the range in enrollments ranged between 21 and 886.
As shown in Tables 2 and 3, the data appear to be in good agreement with the model. The coefficient of determination R2 values and the adjusted coefficient of determination (adjusted-R2) indicate that the model provides a reasonably strong fit to the data and describes the growth rate behavior of academic programs very well (Howell, 2002). The large F-values (significant far beyond 0.01, that is p < 0.01) imply that it is a very strong model. The estimated multiple correlation coefficients, R, indicate that the dependent variables are strongly correlated with the independent variables of social and behavioral influences as a whole (Table 2).
Furthermore, the parameter estimates seem reasonable for the model. Almost all the model effects were statistically significant at 0.05 levels as indicated by their t-values (Table 2, in parentheses) and p-values (probability of significance) and are consistent with a priori expectations. One of the conditions for the model to make sense is that the regression estimates for the parameter b2 must be negative, which is reflected by the estimated results of b2 in Table 3. In addition, the estimated results for M*, the ceiling number of potential students in the social system, appear quite plausible. This means the results are not negative (M* > 0) but modest relative to the enrollments in the program.
The estimates for the basic model’s parameters (k1, k2, M*) were based on the estimated regression coefficients as was shown above. According to the literature (Kmenta, 1971), if the estimates of the restricted parameters are linear functions of the estimates of the unrestricted coefficients, then all the desirable properties of the latter carry over
to the former. In this case, the variances of the restricted parameters could be determined from the variances and co-variances of the regression coefficients. This means that if the t-values of the estimated regression coefficients indicate statistical significance, then the associated restricted model’s parameter estimates are also statistically significant. In this case, almost all the parameter estimates of the restricted model were found to be statistically significant.
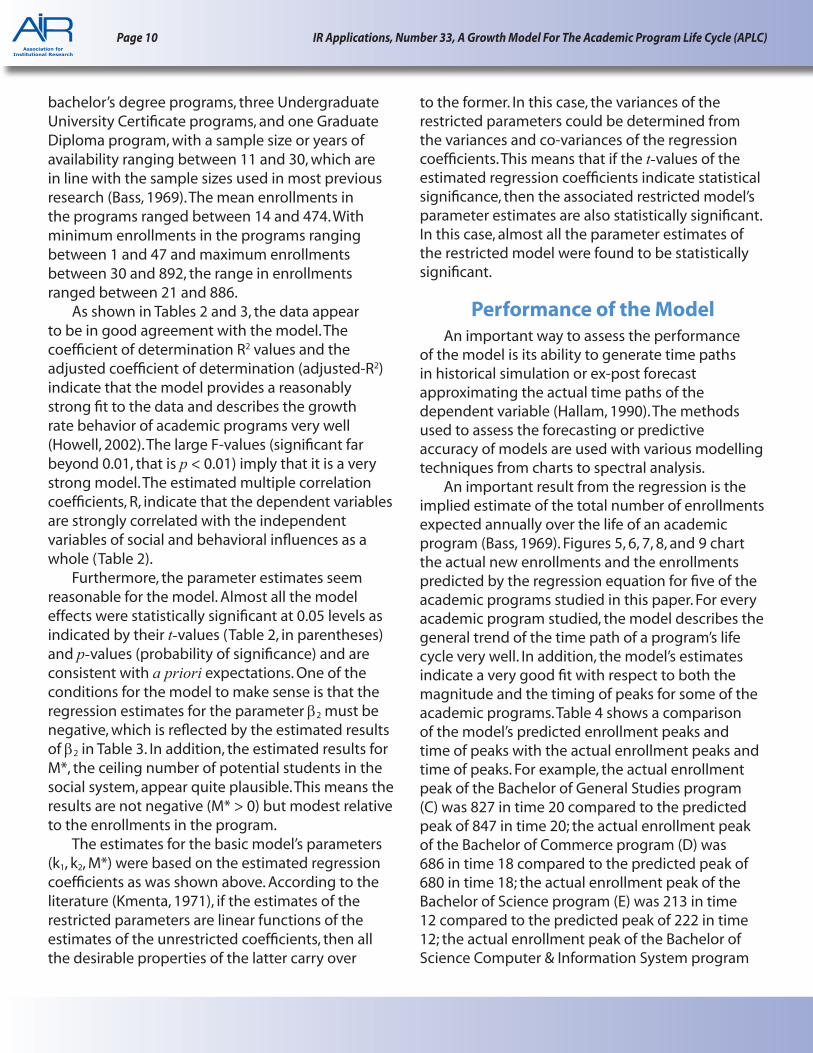
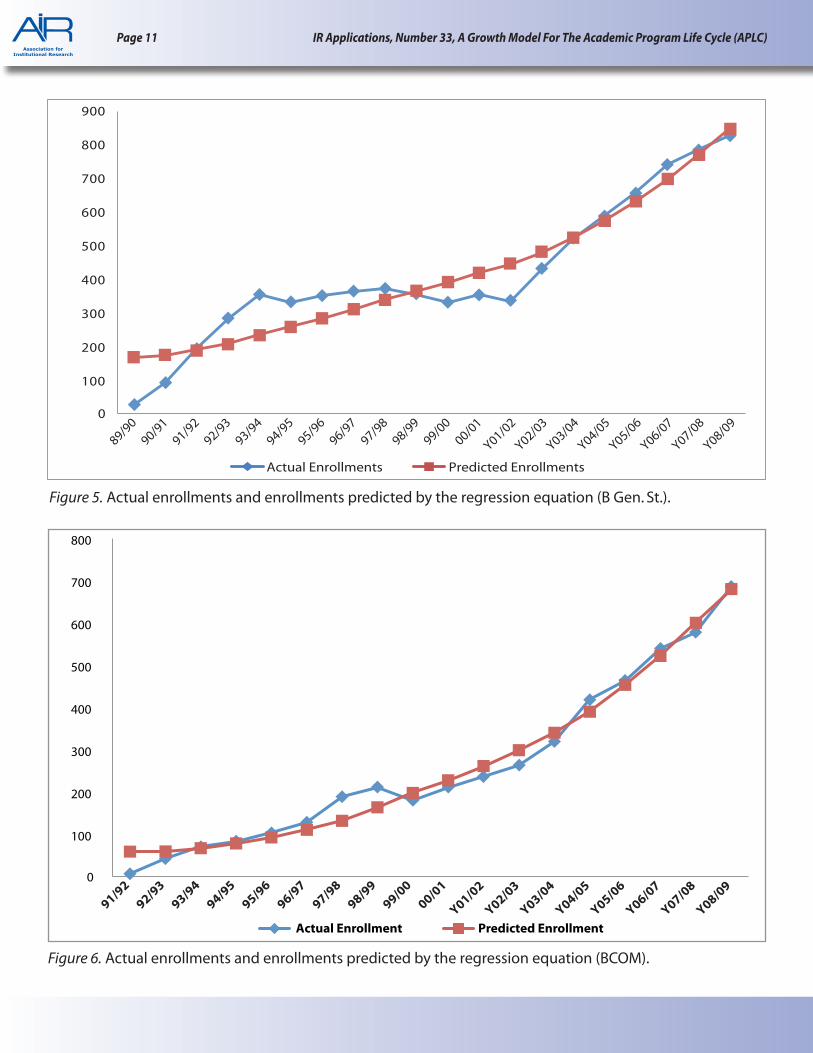
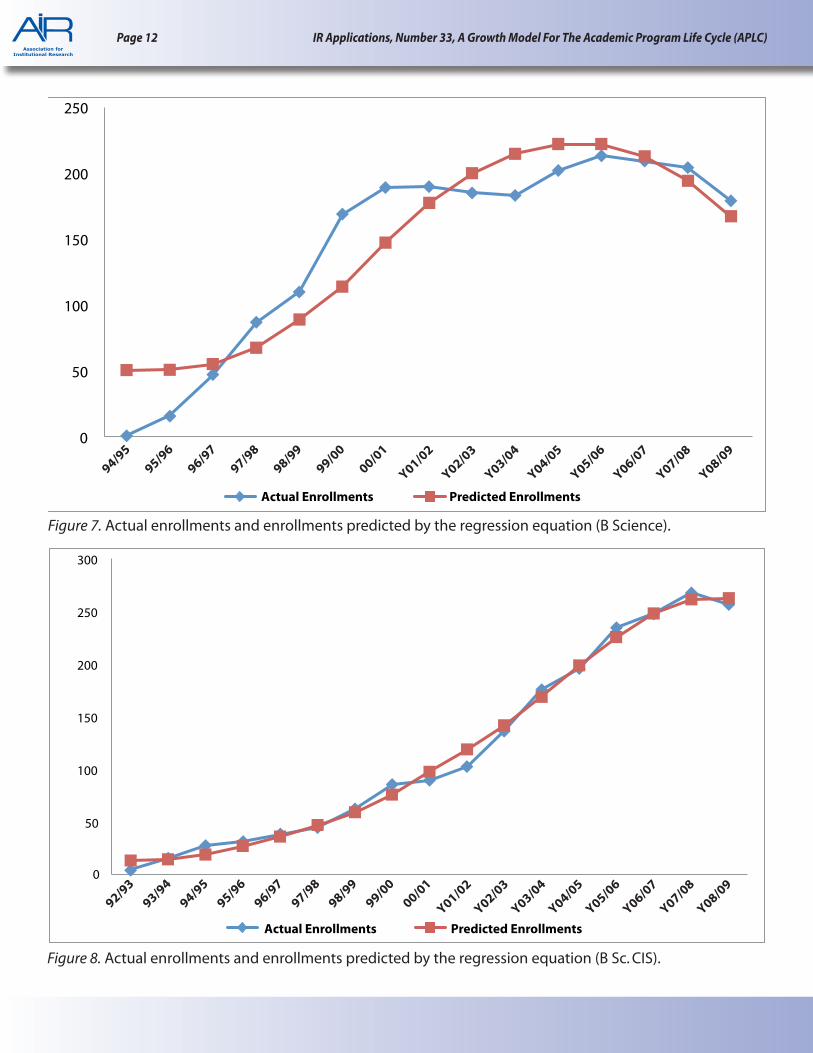
Performance of the ModelAn important way to assess the performance
of the model is its ability to generate time paths in historical simulation or ex-post forecast approximating the actual time paths of the dependent variable (Hallam, 1990). The methods used to assess the forecasting or predictive accuracy of models are used with various modelling techniques from charts to spectral analysis. An important result from the regression is the implied estimate of the total number of enrollments expected annually over the life of an academic program (Bass, 1969). Figures 5, 6, 7, 8, and 9 chart the actual new enrollments and the enrollments predicted by the regression equation for five of the academic programs studied in this paper. For every academic program studied, the model describes the general trend of the time path of a program’s life cycle very well. In addition, the model’s estimates indicate a very good fit with respect to both the magnitude and the timing of peaks for some of the academic programs. Table 4 shows a comparison of the model’s predicted enrollment peaks and time of peaks with the actual enrollment peaks and time of peaks. For example, the actual enrollment peak of the Bachelor of General Studies program (C) was 827 in time 20 compared to the predicted peak of 847 in time 20; the actual enrollment peak of the Bachelor of Commerce program (D) was 686 in time 18 compared to the predicted peak of 680 in time 18; the actual enrollment peak of the Bachelor of Science program (E) was 213 in time 12 compared to the predicted peak of 222 in time 12; the actual enrollment peak of the Bachelor of Science Computer & Information System program
Page 11 IR Applications, Number 33, A Growth Model For The Academic Program Life Cycle (APLC)
0
100
200
300
400
500
600
700
800
900
Actual Enrollments Predicted Enrollments
89/90
90/91
91/92
92/93
93/94
94/95
95/96
96/97
97/98
98/99
99/00
00/01
Y01/02
Y02/03
Y03/04
Y04/05
Y05/06
Y06/07
Y07/08
Y08/09
Figure 5. Actual enrollments and enrollments predicted by the regression equation (B Gen. St.).
0
100
200
300
400
500
600
700
800
Actual Enrollment Predicted Enrollment
91/92
92/93
93/94
94/95
95/96
96/97
97/98
98/99
99/00
00/01
Y01/02
Y02/03
Y03/04
Y04/05
Y05/06
Y06/07
Y07/08
Y08/09
Figure 6. Actual enrollments and enrollments predicted by the regression equation (BCOM).
Page 12 IR Applications, Number 33, A Growth Model For The Academic Program Life Cycle (APLC)
0
50
100
150
200
250
Actual Enrollments Predicted Enrollments
94/95
95/96
96/97
97/98
98/99
99/00
00/01
Y01/02
Y02/03
Y03/04
Y04/05
Y05/06
Y06/07
Y07/08
Y08/09
0
50
100
150
200
250
300
Actual Enrollments Predicted Enrollments
92/93
93/94
94/95
95/96
96/97
97/98
98/99
99/00
00/01
Y01/02
Y02/03
Y03/04
Y04/05
Y05/06
Y06/07
Y07/08
Y08/09
Figure 7. Actual enrollments and enrollments predicted by the regression equation (B Science).
Figure 8. Actual enrollments and enrollments predicted by the regression equation (B Sc. CIS).
Page 13 IR Applications, Number 33, A Growth Model For The Academic Program Life Cycle (APLC)
Figure 9. Actual enrollments and enrollments predicted by the regression equation (B Prof Arts).
(F) was 267 in time 16 compared to the predicted peak of 262 in time 17; and the actual enrollment peak of the University Certificate in Computer & Management program (H) was 27 in time 8 compared to the predicted peak of 26 in time 8.
A stronger test of the model’s forecasting accuracy is what is known as cross-validation (Maddala, 1988). In this procedure, the sample is split into two periods (N: n1, n2): the first subsample (n1) is used to estimate the parameters of the model and the estimated parameters are then used to predict the dependent variable in the first period (within sample prediction) and in the second period (out-of-sample prediction). The correlations between these predicted enrollments and their respective actual enrollments are computed and compared. The out-of-sample correlation (R-o-s) is usually smaller than the within-sample correlation (R-w-s) for a satisfactory forecasting performance.
The cross-validation test was performed for all the academic programs studied in this paper, and the results are shown in Table 5. With the exception of the Bachelor of Administration program (A), the out-of-sample correlation coefficients (R-o-s) are smaller than the within-sample correlation coefficients (R-w-s), indicating that the model is able to accurately forecast academic program enrollments over the long range (Bass, 1969; Maddala, 1988).
The results of all the tests above seem to indicate that the basic model developed and applied in this paper fits the enrollment data on academic programs studied here very well. It is therefore important to note that the mixed-influence diffusion (growth) model can be used to study the life cycle of academic programs. It is also possible to use the knowledge gained for purposes of long-range forecasting of enrollments for academic programs.
Page 14 IR Applications, Number 33, A Growth Model For The Academic Program Life Cycle (APLC)
Academic Period Within-Sample Forecast Out-of-Sample Forecast Programs Covered Period Covered R Period Covered RA 1979–2009 1979–1993 0.953 1994–2009 0.993*
B 1979–2009 1979–1993 0.986 1994–2009 0.304
C 1989–2009 1989–1998 0.964 1999–2009 0.945
D 1991–2009 1991–1999 0.977 2000–2009 0.948
E 1994–2009 1994–2001 0.984 2002–2009 0.721
F 1992–2009 1992–2000 0.974 2001–2009 0.556
G 1996–2009 1996–2002 0.967 2003–2009 0.507
H 1998–2009 1998–2003 0.872 2004–2009 0.331
J 1977–2009 1977–1994 0.938 1995–2009 0.409
K 1991–2009 1991–1999 0.763 2000–2009 0.333
Table 5 Long-Term Forecasting Accuracy of the Model: Cross-Validation
Note. Letters have been substituted for academic program names due to lack of space.
* R-W-S < R-O-S
Academic Period Predicted Time Actual Time of Predicted Magnitude Actual MagnitudePrograms Covered of Peak Peak of Peak of PeakA 1979–2009 23 24 678 892
B 1979–2009 19 16 319 361
C 1989–2009 20 20 847 827
D 1991–2009 18 18 680 686
E 1994–2009 12 12 222 213
F 1992–2009 17 16 262 267
G 1996–2009 12 12 585 602
H 1998–2009 8 8 26 27
I 1977–2009 14 11 30 47
J 1991-2009 10 10 65 72
K 1994–2009 7 4 229 258
Table 4 Comparison of Predicted Time and Magnitude of Peak with Actual Values
Note. Letters have been substituted for academic program names due to lack of space.
Applying the Model for Long-Range Forecasting
Recall the basic growth model (Equation 3):
at = k1M* + (k2 - k1) At-1 – (k2/M*)At-12
The last predicted enrollment for the Bachelor of
Arts four-year program (B) was 244 in 2008/09 fiscal
year. All things remaining the same in the 2009/10
fiscal year, the predicted new enrollment for this
program would be 244, that is assuming no change:
a09/10 = a08/09 + 0
a09/10 = 244 + 0 = 244
But in economics, nothing remains constant, so the enrollment forecast for the 2009/10 fiscal year would rather be:
Figure 10. Forecasting enrollment demand: B Arts 4-Year (2009/10–2014/15).
Page 16 IR Applications, Number 33, A Growth Model For The Academic Program Life Cycle (APLC)
color TV sales (At, At2) were implicit in the estimated
model’s parameters, and there was no need to use the cumulative color TV sales up to 1963 for the projections (see for example, the Cross Validation tests performed above).
In the same way, the cumulative enrollments (At, At
2) are implicit in the current model’s estimated parameters (k1, k2, M*), and all that was required was to use these estimated parameters and a base year enrollment data (a08/09) to begin the projections. Subsequent projections were then based on the new enrollments (a’s). The projections are an attempt to find out how the model would behave in the future based on the estimated parameters (using historical enrollment data) and a base year new enrollment data.
Issues and Limitations First, the sample used for this study was a matter of convenience because the author works at an ODL institution, and the data were readily available for use to test the PLC model. Charity begins at home, so the adage goes. Secondly, ODL institutions and most of their programs are relatively new in terms of mode of delivery and technology and are particularly suited for the PLC analysis in order to determine the nature of the stages in the life cycles of these programs and the potential determinants earlier in the life cycle when no revisions and/or restructuring have been introduced into the program to modify the life cycle stages. Such explorations would help to determine when the growth of a program would end and maturity and decline would set in and how to deal with them (Day, 1981).
Having said that, however, it must be pointed out that the PLC concepts and analysis can also be applied to traditional institutions. Most of the academic programs at traditional institutions have been running over several years and have perhaps undergone several revisions and/or restructuring. These changes would have modified the stages in such programs and must be taken into account when applying the PLC analyses to them. In addition, failed programs or programs, which have declined and been withdrawn from an institution’s
portfolio of programs, might not be particularly suitable for PLC analysis.
The PLC analysis might not be suitable for traditional institutions whose enrollments partly depend on some expressed state/provincial pairing with some secondary schools, where completers smoothly transition into such traditional postsecondary institutions. As stated elsewhere, the PLC analysis was initially applied to new product sales based on market demand conditions. Most ODL institutions market themselves and their programs on the freely competitive higher education market and do not enjoy any advantages from state/provincial directives compelling secondary school completers to enroll in a particular ODL institution.
Summary and Conclusion The mixed-influence diffusion (growth) model developed in this paper to study the life cycle of academic programs is characterized by an S-shaped growth curve; an assumption about the homogeneity of prospective program students; the influence of behavioral and social factors on prospective students’ decision to enroll in academic programs; and no explicit consideration of economic factors such as income, tuition, financial assistance, and advertising. In spite of all these limitations, the model yielded reasonable empirical parameter estimates and the timing of enrollments in academic programs. The ability of the model to forecast program enrollments (enrollment demand growth) was demonstrated by using the parameter estimates to generate plausible long-range enrollment forecasts for one of the academic programs studied in this paper. We may now claim to know something about the phenomenon we set out to explore: all the information which emanates from an academic institution and all the information which circulates within a potential social system are the main social and behavioral forces influencing the decision to enroll in an academic program at a particular institution. These external and internal influences have been the basic underlying forces in the enrollment decisions of potential students, but
Page 17 IR Applications, Number 33, A Growth Model For The Academic Program Life Cycle (APLC)
the roles of these forces have rarely been formally recognized and delineated. The mixed-influence diffusion model has put the role of external and internal influences in the enrollment decisions of prospective students in theoretical and empirical perspectives. The doors are now open for Institutional Researchers to apply the growth model to study the life cycles of academic programs in their institutions. Such knowledge would, no doubt, help academic program administrators better understand how to introduce new academic programs, how to better manage the lives of their academic programs, and when to eliminate academic programs which no longer enjoy sustainable market demand or when to consider retaining low-performing programs by revision and/or restructuring at their institutions. Academic program administrators must now understand
that the most powerful influences bearing upon prospective students’ enrollment decisions are the internal and external information about their institutions and programs in the higher education marketplace, particularly in relation to program marketing as opposed to institutional marketing. Whereas institutional marketing applies to the whole institution and its offerings, program marketing targets specific programs for emphasis and with the knowledge of the theoretical and empirical analyses provided by this paper about academic program life cycles, program marketing can now be done with more and better results.
Areas for Future Research The purpose of model building is to enhance understanding of the relationship between all the factors, which might potentially impact the
0
50
100
150
200
250
300
350
400
79/8
0
80/8
1
81/8
2
82/8
3
83/8
4
84/8
5
85/8
6
86/8
7
87/8
8
88/8
9
89/9
0
90/9
1
91/9
2
92/9
3
93/9
4
94/9
5
95/9
6
96/9
7
97/9
8
98/9
9
99/0
0
00/0
1
Y01/
02
Y02/
03
Y03/
04
Y04/
05
Y05/
06
Y06/
07
Y07/
08
Y08/
09
Actual Enrollments Predicted Enrollments
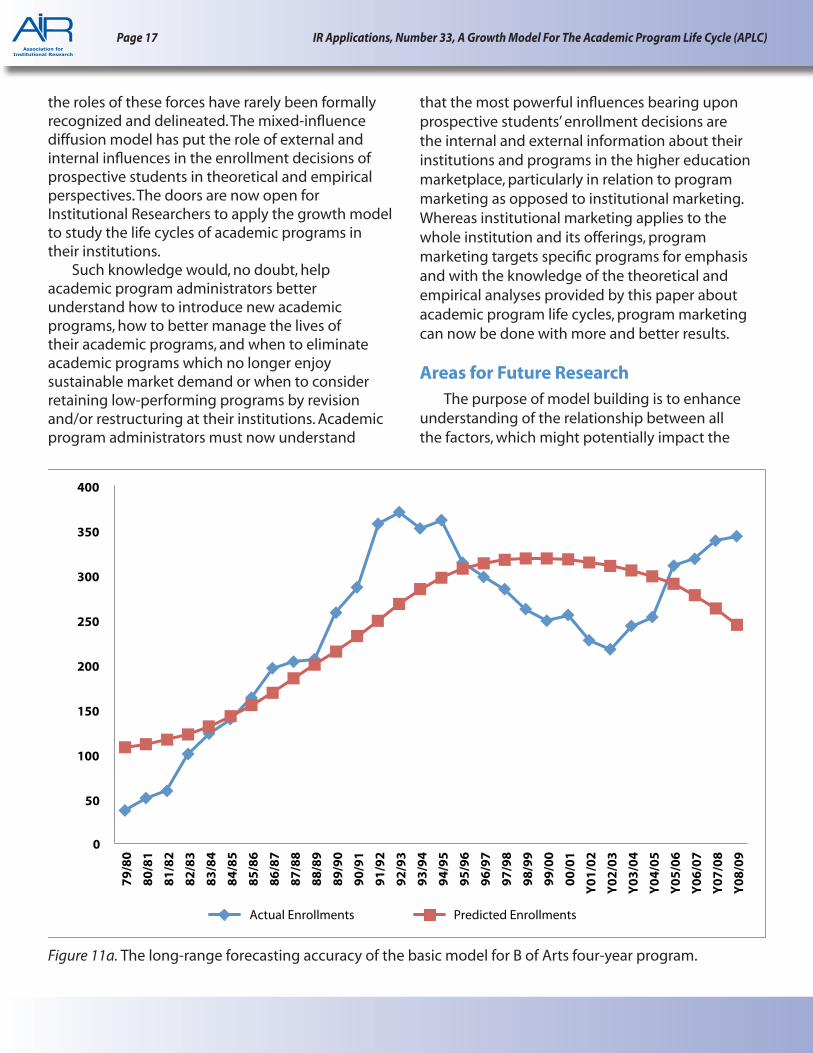
Figure 11a. The long-range forecasting accuracy of the basic model for B of Arts four-year program.
Page 18 IR Applications, Number 33, A Growth Model For The Academic Program Life Cycle (APLC)
References
Acquah, E. H. K. (1994). Economic analysis of innova-tion diffusion processes in agriculture: Hybrid cocoa trees & chemicals in Ghana (Unpublished doctoral
dissertation). University of Reading, England.
Akinola, A. A. (1984). A theoretical and empirical analysis of innovation processes: A case study of cocoa spraying chemicals in Nigeria (Unpublished doctoral dissertation). University of Manchester, England.
Bass, F. M. (1969, January). A new product growth model for consumer durables. Management Sci-ence, 15, 215–227.
Bass, F. M. (1980). The relationship between diffusion rates, experience curves, and demand elasticities for consumer durable technological innovations. Journal of Business, 53, 551–567.
Baum, C. F. (2006). An introduction to modern econo-metrics using Stata. College Station, TX: Stata Press.
Brinbaum, B. (1998, November). The life cycle of academic management fads. Paper presented at the Association for the Study of Higher Education (ASHE) Annual Conference, Miami, FL. See also Brinbaum, B., (2000, January/February). Journal of Higher Education, 71(1), 1–16.
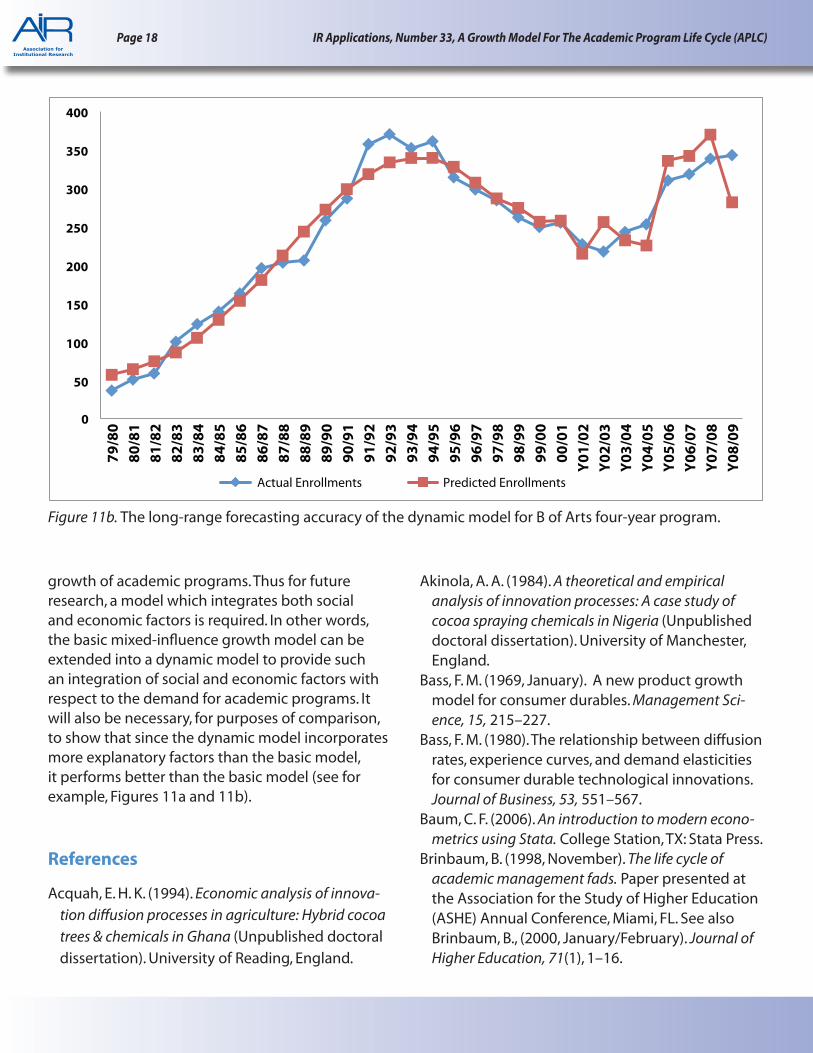
Figure 11b. The long-range forecasting accuracy of the dynamic model for B of Arts four-year program.
0
50
100
150
200
250
300
350
400 79
/80
80/8
1 81
/82
82/8
3 83
/84
84/8
5 85
/86
86/8
7 87
/88
88/8
9 89
/90
90/9
1 91
/92
92/9
3 93
/94
94/9
5 95
/96
96/9
7 97
/98
98/9
9 99
/00
00/0
1 Y0
1/02
Y0
2/03
Y0
3/04
Y0
4/05
Y0
5/06
Y0
6/07
Y0
7/08
Y0
8/09
Actual Enrollments Predicted Enrollments
growth of academic programs. Thus for future research, a model which integrates both social and economic factors is required. In other words, the basic mixed-influence growth model can be extended into a dynamic model to provide such an integration of social and economic factors with respect to the demand for academic programs. It will also be necessary, for purposes of comparison, to show that since the dynamic model incorporates more explanatory factors than the basic model, it performs better than the basic model (see for example, Figures 11a and 11b).
Page 19 IR Applications, Number 33, A Growth Model For The Academic Program Life Cycle (APLC)
Bruce-Cry, A. (1983). A crucial regression error in research on diffusion of state policies. Political Methodology, 9, 201–214.
Cox, W. E., Jr. (1967, October). Product life cycles as marketing models. The Journal of Business, 40, 375–384.
Cray, V. (1973). Innovation in the States: A diffusion study. American Political Science Review, 67, 1174–1185.
Day, G. S. (1981). The product life cycle: Analysis and application issues. Journal of Marketing, 45(4), 60–67.
Fourt, L. A., & Woodlock, J. W. (1960). Early prediction of market success for new grocery products. Jour-nal of Marketing, 2(25), 31–38.
Haines, G. H., Jr. (1964, July). A theory of market behavior after innovation. Management Science, 4(10), 634–658.
Hallam, D. (1990). Econometric modeling of agricultur-al commodity markets (p. 155). London: Routledge.
Hopkins, D. S. (1977). Business strategies for problem products. New York: Conference Board.
Howell, D. C. (2002). Statistical methods for psychol-ogy (5th ed.). Pacific Grove, CA: Duxbury.
Karabel, J. (2005). The chosen: The hidden history of admissions and exclusion at Harvard, Yale, and Princeton. Boston: Houghton Mifflin Harcourt.
Kmenta, J. (1971). Elements of econometrics (pp. 440–446). New York: Macmillan.
Kotler, P. (1971). Marketing decision making: A model building approach. New York: Holt Rinehart & Win-ston.
Kotler, P. (2000). Marketing management: Analysis, planning and control (Millennium ed.). Englewood Cliffs, NJ: Prentice Hall.
Lakatos, M. (1998, November). Managing program life cycle: A model of indicators & strategies. Paper presented at Association for the Study of Higher Education (ASHE) Annual Conference, Miami, FL.
Maddala, G. S. (1988). Introduction to econometrics (pp. 498–499). New York: MacMillan.
Mahajan, V., & Muller, E. (1979, Fall). Innovation diffu-sion and new product growth models in market-ing. Journal of Marketing, 43, 55–68.
Mahajan, V., & Petersen, R. A. (1979). First purchase diffusion models of new product acceptance. Technological Forecasting and Social Change,15, 127–146.
Mahajan, V., & Schoeman, M. E. F. (1977). Generalized model for the time pattern of the diffusion pro-cess. IEEE Transactions of the Engineering Manage-ment, EM-24, 12–18.
Mahajan, V., Kumar K. E., & Haynes, K. E. (1977). Mod-elling the diffusion of public policy innovations among the U.S. states. Socio-Economic Planning Sciences, 11(5), 259–263.
Modis, T. (1994). Life cycle: Forecasting the rise and fall of almost. The Futuristic, 28(5), 20–25.
Monks, J., & Ehrenberg, R. G. (1999). U.S. News & World Report’s college rankings: Why do they matter? Change, 31(6), 42–51.
Mukerji, S., & Tripathi, P. (2004). Academic program life cycle: A redefined approach to understanding market demands. Journal of Distance Education, 19(2), 14–27.
Polli, R., & Cook, V. (1969, October). Validity of the product life cycle. Journal of Business, 42, 385–400.
Rink, D. R., & Swan, J. E. (1979, September). Product life cycle research: A literature review. Journal of Business Research, 78, 219–242.
Rink, D. R., & Swan, J. E. (1982, January-February). Fitting market strategies to varying product life cycles. Business Horizons, 72–76.
Robinson, V., & Lakhani, C. (1975). Dynamic price models for new product planning. Management Science, 21, 1113–1122.
Rogers, E. M. (1962). Diffusion of innovations. New York: The Free Press.
Shane, S. A., & Ulrich, K. T. (2004). Technological in-novation, product development, and entrepre-neurship in management science. Management Science, 50(2), 133–144.
Shewchuk, J. (1992, January/February). Life cycle thinking: An approach to better business decisions and behaviors that will maximize profits. CMA Magazine, 34–36.
Shultz, S. R., & Rao, S. R. (1986). Product life cycles of goods for the home. Journal of the Academy of Marketing Science, 14(1), 8–12.
Page 20 IR Applications, Number 33, A Growth Model For The Academic Program Life Cycle (APLC)
Stevens, M. (2007). Creating a class: Admissions and the education of elites. Cambridge, MA: Harvard University Press.
Tellis, G. J., & Crawford, C. M. (1981, Fall). An evolution-ary approach to product growth theory. Journal of Marketing, 45.
Tuchman, G. (2009). Wannabe U: Inside the corporate university. Chicago: University of Chicago Press.
Walker, J. L. (1969). The diffusion of innovations among the American states. American Political Sci-ence Review, 63, 880–899.
Wind, Y. (1981). Product policy: Concepts, methods and strategy. Reading, MA: Addison-Wesley.
Zaltman, G., & Stiff, R. (1973). Theories of diffusion. In S. Ward & T. S. Robertson (Eds.), Consumer behavior: Theoretical sources. Englewood Cliffs, NJ: Prentice Hall.
IR Applications is an AIR refereed publication that publishes articles focused on the application of advanced and specialized methodologies. The articles address applying qualitative and quantitative techniques to the processes used to support higher education management.