28
Ireland: Villain of crisis or Hero of recovery? Marc Coleman MD Octavian Consulting Radio presenter Columnist, Sunday Independent [email protected] www.Octavian.ie
| Date post: | 27-Dec-2015 |
| Category: |
Documents |
| Upload: | owen-francis |
| View: | 216 times |
| Download: | 0 times |

Ireland: Villain of crisis or Hero
of recovery?Marc Coleman MD Octavian Consulting
Radio presenter
Columnist, Sunday Independent
[email protected] www.Octavian.ie

Some background

• A longer-term perspective on Ireland is needed
• Political factors …. Because politics matters to fiscal policy
• EU level factors …. Because this is not just an “Irish story”

Why a longer term perspective is needed
0.00.51.01.52.02.53.03.54.04.5
Average growth: 1997 to 2014Ireland: Euro area OECD
Source: OECD Economic Outlook, June 2013

A Long Term Perspective: Demography – or –
Why some debt increase was justified for Ireland 2004 2005 2006 2007 2008 2009 2010 2011 2012 2013 2014
100102104106108110112114116
EU & Irish population growth 2004-2014 (2004=100)
Ireland EU
Source: CSO Population estimates, August 2014
Ire
lan
d .
..
Ire
lan
d .
..
Au
str
ia
Fra
nc
e
Po
lan
d
De
nm
ark
Sw
itz.
Ge
rma
ny0.0
5.0
10.0
15.0
20.0
25.0
What if Ireland was as densely populated as…? Republic Island
Mill
ion
s o
f p
eo
ple
18
41
20
060
10
20
30
40
50
IRELAND AND ENGLAND: POPULATION'S COMPARED
Ireland England
Mill
ion
s o
f p
eo
ple
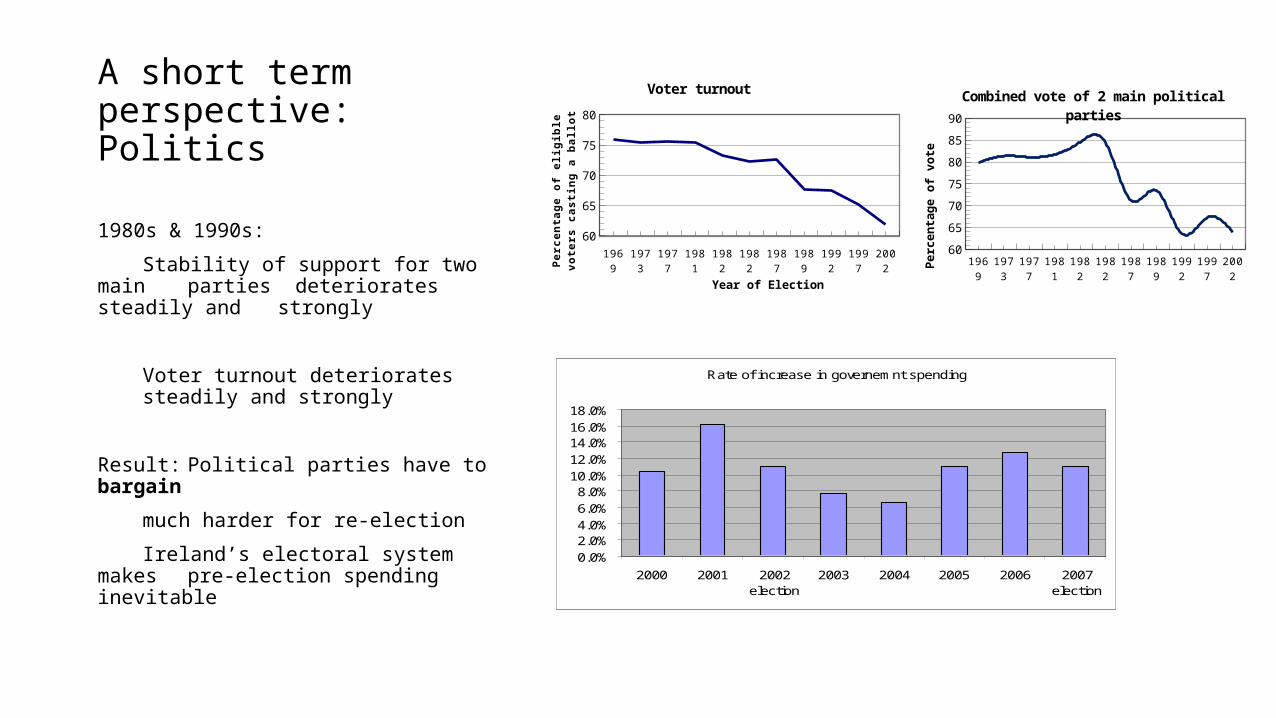
A short term perspective:Politics
1980s & 1990s:
Stability of support for two main parties deteriorates steadily and strongly
Voter turnout deteriorates steadily and strongly
Result: Political parties have to bargain
much harder for re-election
Ireland’s electoral system makes pre-election spending inevitable
1969 1973 1977 1981 1982 1982 1987 1989 1992 1997 200260
65
70
75
80
85
90
Combined vote of 2 main political par-ties
Pe
rce
nta
ge
of
vo
te
1969 1973 1977 1981 1982 1982 1987 1989 1992 1997 2002
60
65
70
75
80
Voter turnout
Year of ElectionPe
rce
nta
ge
of
eli
gib
le v
ote
rs c
as
t-in
g a
ba
llo
t
Rate of increase in governemnt spending
0.0%2.0%4.0%6.0%8.0%
10.0%12.0%14.0%16.0%18.0%
2000 2001 2002election
2003 2004 2005 2006 2007election

Attitudes to Europe
Nice I defeat:
Cynicism over 2001 ECOFIN reprimanding of Ireland over cyclical balance
Lisbon I defeat:
View that by defeating referendum Ireland could achieve a superior bargaining position vis-à-vis retention of EU Commissioner
1971 EU Accession
1987 Single European Act
1992 Maas-tricht treaty
1998 Ams-terdam Treaty
2001 Nice I 2002 Nice II 2008 Lisbon I
0.00
10.00
20.00
30.00
40.00
50.00
60.00
70.00
80.00
90.00
Votes on European Referenda
00
0s

Ireland’s record in Europe
1973-2013:- GDP grows in real terms by 333.6 per cent- Far and away fastest rate in EU- From 60% of EU GDP per capita (1972) to 121% (2012
1990: Irish Presidency helps to secure German re-unification
1996: Irish Presidency of ECOFIN secures agreement to Stability Pact
2004: Irish Presidency steers EU Accession process and secures agreement to draft EU Constitution (which France rejects)

Villain of the crisis?

EU level factors
• Abandonment of Stability Pact strictures by Ecofin in November 2003
• Adoption of a policy of zero real interest rates between 2003 and 2005

2004: A turning point
2003 2004e 2005f
Ireland 0.2 -0.8 -1.0
France -4.1 -3.7 -3.6
Germany -3.9 -3.6 -2.8
Source: 2004 Public Finance Report of EU Commission
2003 2004e 2005f
Ireland 0.1 -0.3 -0.2
France -3.9 -3.4 -3.3
Germany -3.2 -2.9 -2.3
Actual budgetary balances Structural budgetary balances

If France and Germany can get away with it…..From 2004 to 2007Government spending rises by 31%
Spending significantly exceeds inflation plus pop. growth
% Annual change 2004 2005 2006 2007
Total Government Expenditure
6.2% 11.1% 10.6% 12.1%
Inflation 2.1% 2.5% 3.9% 4.9%
Population growth 1.6% 2.2% 2.5% 1.6%

How was this public spending financed?
2004 2005 2006 2007
GDP growth (% change y-o-y) 4.4 5.9 5.4 5.4
Balance of Payments (Current Account) as % GDP -0.6 -3.4 -3.5 -5.4
Private Sector Credit (€bn, end Dec) 91.0 115.4 134.1 148.6
Employment (000s) 1,870.50 1,962.70 2,048.30 2,122.80
Gen. Gov't Balance as % GDP 1.4 1.7 2.9 0.1
Gen. Gov't Debt as % GDP 29.5 27.3 24.6 25.0
Total Gov't expenditure (€bn) 45.7 50.8 56.1 62.9
A massive expansion of private sector credit injected an amount equivalent of one third of GDP into the economy in just 4 years

Capital taxes, income taxes & VAT became hugely dependent on credit expansionA heavy and unsustainable dependence on capital taxation
And exposure of other tax categories to construction activity
2004 2005 2006 2007 2008 2009 20104
6
8
10
12
14
16
18
Share of capital taxes in total
1998Q1
1998Q4
1999Q3
2000Q2
2001Q1
2001Q4
2002Q3
2003Q2
2004Q1
2004Q4
2005Q3
2006Q2
2007Q1
2007Q4
2008Q3
2009Q2
2010Q1
2010Q4
2011Q3
2012Q2
2013Q1
2013Q47.0%
8.0%
9.0%
10.0%
11.0%
12.0%
13.0%
14.0%
Chart Title

Monetary Policy Backdrop
Ireland’s higher inflation brought real interest rates to significantly below euro zone levels
Negative real interest rates between 2002 and 2005
But
Euro zone real rates were already significantly below average Bundesbank norm between 1948 and 1998
M3 growth 2003-2005 was 8 per cent per annum ,well in excess of reference value of 4.5 per cent
1994 1995 1996 1997 1998 1999 2000 2001 2002 2003 2004-3
-2
-1
0
1
2
3
4
5
6
7
Real Interest rates: Euro zone (yellow), Ireland (blue) Bundesbank avge real interest rate 1948-1998
(black)

An aggravating factor: Ireland’s “transmission mechanism” differs from rest of EZ”• High home ownership, weak rental security of tenure
• Variable rather than fixed mortgage rates
• A strong culture of “my home is my castle” in contrast to more functional approach to property on European mainland
• High taxation of home construction (VAT, builders levies) and home ownership (stamp duty, property tax) gives politicians incentive to inflate the market.
• While there is as yet no property boom (price rises are a correction in my view) the above factors have not gone away.

An economy warped by low interest rates and weak regulation
2004: Economy not perfect but- Fiscal balances and debt prudent- Current account in surplus- Private sector credit and house prices only
modestly excessive given Ireland’s young and growing population
2004-2007
- “Socialist” policy increases public spending by 31%
- Monetary policy backdrop allows
policy makers to temporarily disguise long term policy implications by overreliance on property market
-2%
0%
2%
4%
6%
8%
10%
12%
14%
1999 2000 2001 2002 2003 2004 2005 2006 2007
Domestic Demand External Demand

Consequences II
The Housing market
From a position of slight or modest overvaluation in 2003……
…house prices explode in 2005 and 2006
Interestingly peak growth subsides in
May 2007
2005M01 2005M11 2006M09 2007M07 2008M05 2009M03 2010M01 2010M11 2011M09 2012M07 2013M05 2014M030
20
40
60
80
100
120
140
-25
-20
-15
-10
-5
0
5
10
15
20
Housing market trends
Residential Property Price Index (Base Jan 2005 = 100)Percentage Change over 12 months for Residential Property Price Index (%)

Did anyone shout “stop!” ?:
September 2004 Taoiseach (Chancellor) announces he is a “socialist”October 2004 (Magill ma
13th July 2005 (Irish Times) “High rates of lending growth threaten our economy”
July 29th 2005 (Irish Times) Growth in our economy is “not sustainable”. August 19th 2005 (Irish Times) “The influence of construction is hugely disproportionate” [in the economy].
September 2005 (Irish Times) I carry Jean Claude Trichet’s warning to financial authorities to “take action” in relation to overheating
March 31st 2006 (Irish Times) “Stop the economy I want to get off”... “financial regulation has broken down”...”Nobody, absolutely nobody, is in charge”.
June 2006 ESRI Quarterly Economic Commentary contains warning of a possible US recession
July 6th 2006 (Irish Times) “Aimless, lopsided and unsustainable, our economy needs remedial action now”....”Revenue growth is not strong..it is absolutely crazy”....the government’s fiscal position could “deteriorate rapidly”
Response July 13th 2006 Finance Minister Brian Cowen writes opinion piece rejecting my assertion that government finances are overdependent on property
On July 17th 2006: I physically confront the Finance Minister at a government Economic conference and challenge him to prepare a contingency plan in case of recession.
April 13th 2007 I warn that election forecasts of all political parties (4+ per cent growth per annum 2008-2012 are unrealistic (page 150 “Fall of the Celtic Tiger”, O’Donovan & Murphy 2014)
Response “We know but if we put lower forecasts in our manifestos we are afraid government will accuse us of talkingdown economy”

Boy who cried wolf syndrome
• Several economists were shouting “stop”
• Problem: Phenomenon of “Boy who cried wolf”, economic commentary as entertainment (shock value)
• Predictions made of economic collapse from mid to early 1990s - long before
• Then more boring commentators (like myself) issue warnings
• Easy for political leaders to dismiss “we’ve heard it before & it was wrong”

Hero of Recovery?

Ireland’s correction:
- Early- Fast- Hard
Early: Ireland begins fiscal correction with an
emergency budget in October 2008. Before the fiscal impact of the crisis has begun in earnest
Fast In less than 15 months, Ireland implements 3 budgets with a total correction of nearly €10 billion or nearly 6% of GDP
This is before Britain, Greece, Italy, Spain
or Portugal have begun in earnest
Hard: Consolidation is sustained and determined with a total correction equating to roughly 12% of GDP
Budget Spending cuts (€bn)
Tax increases (€bn) Ratio SC/TI
October 2008 0.30 2.30 3/23
April 2009 1.20 2.70 4/9
December 2009 3.10 0.10 31/1
December 2010 2.20 2.40 11/12
December 2011 1.60 1.60 1/1
December 2012 1.85 1.65 37/33
October 2013 1.60 0.90 16/9
Total 11.85 11.65 1/1

Both fiscal and current account balances are corrected
Quickly.
2004-2007
Unit Labour Cost rises imply 15% deterioration in competitiveness
Public sector leads this deterioration as earnings in that sector rise 20% in period
2008-2011
Led mainly by private sector ULC decline by 15% reversing earlier loss in competitiveness
By 2010 Current account back in surplus2008 2009 2010 2011 2012 2013
-35
-30
-25
-20
-15
-10
-5
0
5
10
Gen. Govt Deficit

Recovery2012 2013e 2014f 2015f 2016f
GDP growth (% change y-o-y) 0.2 0.2 2.0 (3.0) 2.3 (2.5) 2.8 (2.9)
Employment (000s) 1,837 1,866 1,894 (1,910) 1,919 (1,920) 1,944 (1,945)
Unemployment % GDP 14.7 13.5 12.4 (11.2) 11.8 (10.6) 11.4 (10.4)
Gen. Gov't Balance as % GDP* -8.2 -7.3 -4.8 -2.9 -2.4
Primary Balance as % of GDP -4.5 -2.7 0.0 2.0 2.6

Some caveats on “hero” status
Composition of adjustment too much on tax increases and too little on public spending
- 1982-86: Public spending not reduced, taxes increased
Result: Average GDP growth of 0.3%
- 1987-92: Public spending reduced by 10 per cent of GDP, taxes not increased
Result: Average GDP growth 3.4% (initial impetus to devaluation but after 1987 Ricardian effects as public fear of tax increases abates
- Dec. 2009: Budget emphasises cuts in spending with no tax increases
Result: Domestic economy grows, unemployment stabilises and taxes come in above target
- Dec. 2010 Budget reverts to “tax and spend” mode
Result: Return to recession, renewed increase in unemployment and taxes
come in below target
2 Elephants in the room 1. Public pay 47% higher than private pay on average
Giordano et al: ECB WP 1406 “only Portugal Italy Greece & Spain comparable
2. Total government spending remains approx. 40% above 2004 levels

Financial credibility restored
- Bond yields over bunds now at pre crisis lows
- Fitch restores Ireland to “A” grade rating last month
- Main banks (AIB, BoI) report greatly improved results H1 2014
-

Latest indicators of recovery
• GDP Q1 2014: +2.7% Q/Q (sa) +4.1% Y/Y
• Unemployment: 11.2% August 2014 (from 15.3% peak July 2012)
• Fitch ratings: Upgrade from BBB+ to A- in August 2014
• Property prices: 13% increase in year to date (but prices still 41% below peak & credit subdued so not a boom)

Conclusion• Ireland is unique because
• Highly successful experience in EU in terms of economic and demographic growth
• Historic trends of population recovery makes higher debt inevitable. Gap between Irish and Euro zone debt/ GDP levels probably justified by different demographics (Life Cycle hypothesis)
• Last point re differential does not excuse high debt in both Euro zone or Ireland
• Weak fiscal policy & high debt accumulation in Ireland has • A domestic cause: Dysfunctional political system• a common cause: Abandonment by large countries of SGP
Zero real interest rate policy between 2003 and 2005(aggravated but not caused by Irish competitiveness loss)


