Ireland’s Health Care System: Some Issues and Challenges Anne Nolan and Brian Nolan Working Paper 14 Subsequently published in A. Nolan, B. Nolan, Ireland’s Health Care System: Some Issues and Challenges , 2004. Chapter 3 in Callan, T. et al. (eds.) Budget Perspectives 2005, Dublin: Economic and Social Research Institute. Research Programme on “Health Services, Health Inequalities and Health and Social Gain” This programme is supported by the Health Research Board, and is being carried out by researchers at the Economic and Social Research Institute (ESRI), University College Dublin and the University of Ulster. Working Papers are not for publication and should not be quoted without the prior permission of the author(s) • Economic and Social Research Institute, 4 Burlington Road, Dublin 4, Ireland. Correspondence to: Anne Nolan, Economic and Social Research Institute, 4 Burlington Road, Dublin 4, Ireland. Email: [email protected]
Transcript
Ireland’s Health Care System: Some Issues and Challenges
Anne Nolan and Brian Nolan
Working Paper 14
Subsequently published in A. Nolan, B. Nolan, Ireland’s Health Care System: Some Issues and Challenges, 2004. Chapter 3 in Callan, T. et al. (eds.) Budget Perspectives 2005, Dublin: Economic and Social Research Institute.
Research Programme on “Health Services, Health Inequalities and Health and
Social Gain”
This programme is supported by the Health Research Board, and is being carried
out by researchers at the Economic and Social Research Institute (ESRI),
University College Dublin and the University of Ulster.
Working Papers are not for publication and should not be quoted without the prior permission of the author(s) • Economic and Social Research Institute, 4 Burlington Road, Dublin 4, Ireland. Correspondence to: Anne Nolan, Economic and Social Research Institute, 4 Burlington Road, Dublin 4, Ireland. Email: [email protected]
Ireland’s Health Care System: Some Issues and Challenges
Anne Nolan and Brian Nolan1
1. Introduction
A variety of recent reports and strategy documents have highlighted the
intimidating range of challenges facing Ireland’s health system as it seeks to improve its
performance. In this short paper we cannot deal with these in any comprehensive
fashion, but instead focus on three specific issues. First, we illustrate the value of trying
to benchmark performance against other countries, as well as some of the difficulties
that arise in such an exercise. Secondly, with primary care a central focus of official
strategies we look at the use of general practitioner services by people at different
income levels and in particular by those with and without entitlement to free GP care.
Finally, we discuss the complex web of issues in relation to both equity and efficiency
that arise from the unique role which private health insurance plays in the Irish
healthcare system.
2. Benchmarking Ireland’s Performance
How well is Ireland’s health care system functioning? Media attention tends to
highlight waiting lists for acute hospital care and waiting times and conditions in A&E.
These are real concerns, but the broader perspective gained by benchmarking
performance against other countries can be particularly valuable, in this as in other
areas. To provide this perspective we can draw on recent comparative compilations of
data by the OECD and Eurostat and the methodology employed in a recent
benchmarking exercise by the Conference Board of Canada (see Conference Board of
Canada 2004).
The Conference Board adopts an interesting approach to benchmarking which
distinguishes three dimensions: health status, non-medical factors and health outcomes.
In each of these, the performance of OECD countries is assessed and each is awarded a
gold, silver or bronze medal. “Gold medal” performance means the country is in the top
1 We are grateful to ESRI colleagues and to Donal de Buitleir and Miriam Hederman-O’Brien for comments on an earlier draft, and to the Health Research Board for funding the collaborative research programme on the Provision and Use of Health Services, Health Inequalities, and Health and Social Gain on which the paper draws.
1
one-third of the range on the indicator in question, “silver medal” performance means it
is in the middle third and “bronze medal” means it is in the bottom one-third of the
range. Note that this is not equivalent to being in the top one-third of countries on the
indicator in question; indeed, if there was a big enough gap between the best and next-
best performer, there might be only one country in the top one-third of the range of
scores. That is precisely the appeal of this approach; it is based on how close to or far
away from the best performers each country is, rather than simply on where they rank
on each indicator. Based on their medal performance, countries are then ranked on each
dimension and in aggregate across them, by assigning different values to gold, silver
and bronze medal performance respectively.
Unfortunately the results presented by the Conference Board itself, although
they do include Ireland, could be misleading because they fail to take into account that
some of the indicators employed were missing for some countries. So here we apply
their method, but re-analyse the data taking this failing into account, i.e., instead of
assigning a zero score to a country with missing information on an indicator, we
exclude that indicator altogether from the analysis.2 In addition, the Conference Board
analysis covers 24 OECD countries, including Mexico and South Korea. In certain
instances, including Mexico and South Korea widens the range of values on the
indicators and has a significant impact on the results. We prefer to confine attention to
22 OECD countries in Europe, North America, Australasia and Japan, using data from
20013.
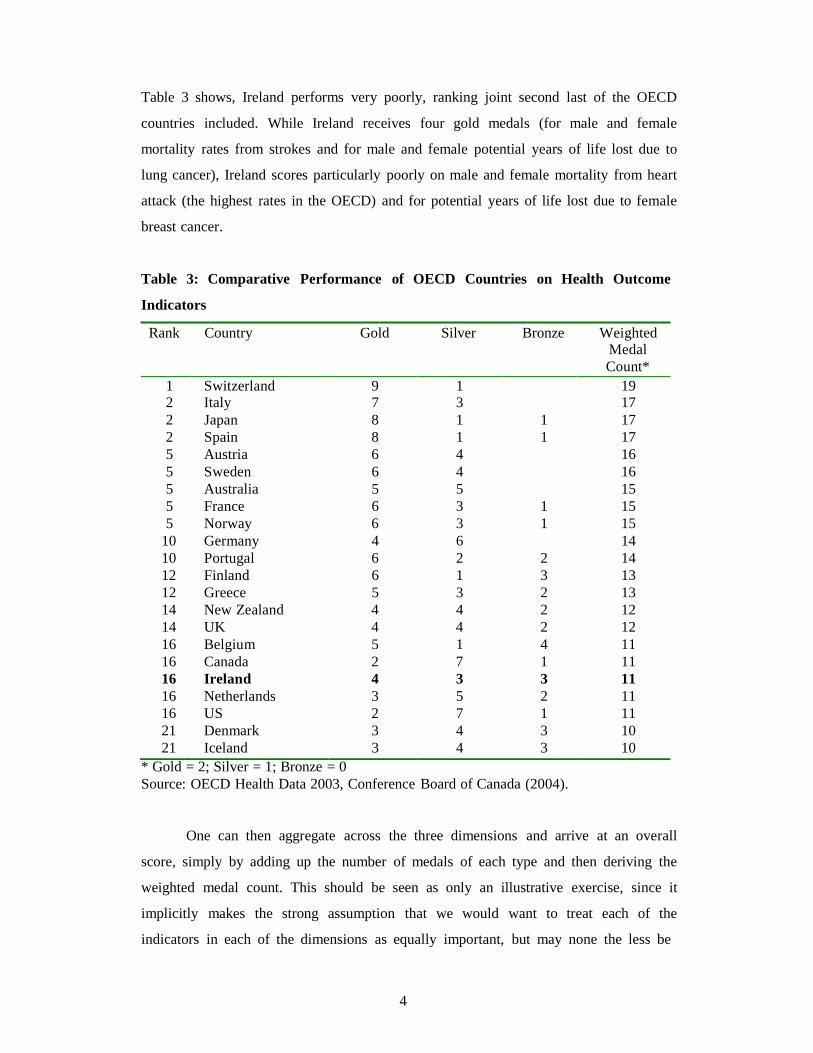
We look first at health status. Table 1 shows how the 22 OECD countries
included in the analysis were ranked on the basis of four health status indicators: life
expectancy for men and for women, infant mortality and low birth weight rates. We see
that for these indicators Ireland has one gold medal and three bronze medals. Ireland
performs poorly on life expectancy at birth for both men and women, which is in the
bottom one-third of countries. Ireland also scores poorly on infant mortality, where
again it is in the bottom one-third of the range. In contrast, Ireland is among the best
performers in terms of the proportion of babies born with low birth weight.
2 Due to missing information for some countries, in the “health status” category we exclude disability-free life expectancy for men and women and self-reported health status while for the “non-medical factors” category, we exclude body weight and immunization rates for influenza. 3 We follow the Conference Board in not including five OECD countries (Czech Republic, Hungary, Poland, Slovak Republic and Turkey) for reasons to do with data availability and reliability, and Luxembourg on the basis of its size. In some instances, where data for 2001 are unavailable, data for earlier years are used instead. All data were obtained from the OECD Health Databank for 2003.
2
A ranking of countries on this dimension can then be derived by aggregating
across the indicators assigning a value of two for each gold medal, one for each silver
medal and zero for each bronze medal. Ireland ranks joint 14th out of 22 countries on
this basis. Health status indicators are of course affected by a wide range of factors other
than health care, notably socio-economic and environmental conditions. None the less,
the ultimate aim of health care is indeed to improve population health.
Table 1: Comparative Performance of OECD Countries on Health Status
Indicators
Rank Country Gold Silver Bronze Weighted Medal Count*
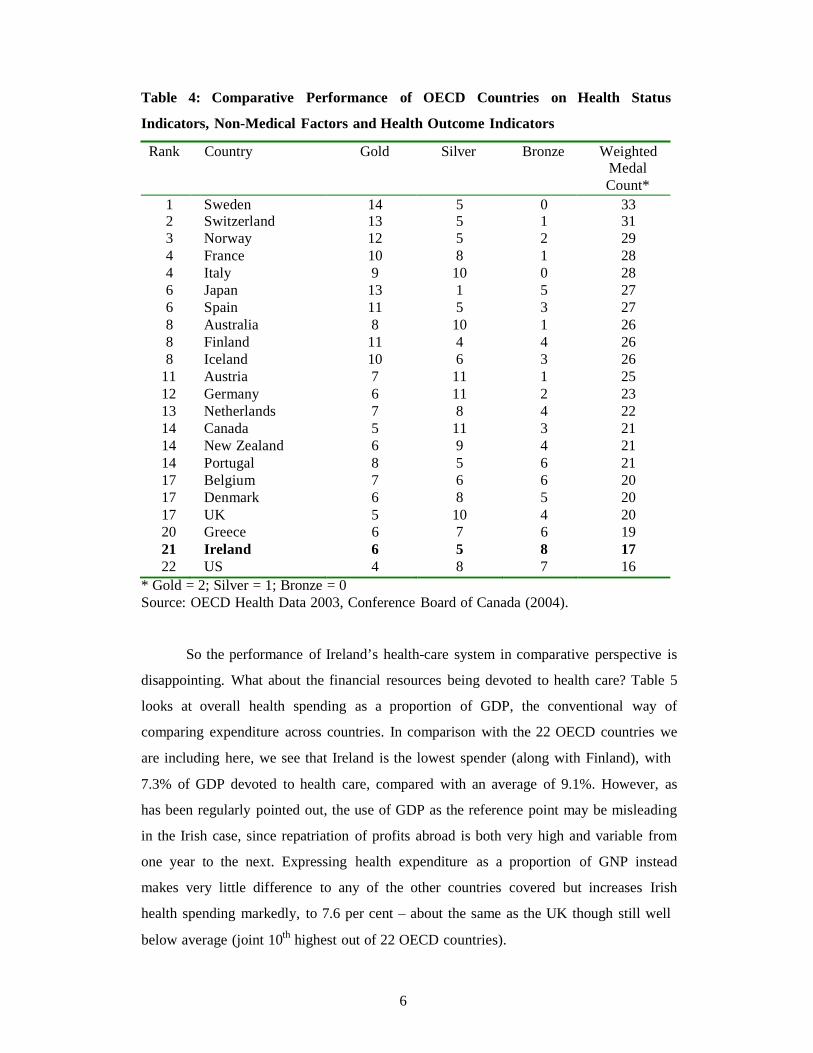
Table 4: Comparative Performance of OECD Countries on Health Status
Indicators, Non-Medical Factors and Health Outcome Indicators
Rank Country Gold Silver Bronze Weighted
* Gold = 2; Silver = 1; Bronze = 0 Source: OECD Health Data 2003, Conference Board of Canada (2004).
So the performance of Ireland’s health-care system in comparative perspective is
disappointing. What about the financial resources being devoted to health care? Table 5
looks at overall health spending as a proportion of GDP, the conventional way of
comparing expenditure across countries. In comparison with the 22 OECD countries we
are including here, we see that Ireland is the lowest spender (along with Finland), with
7.3% of GDP devoted to health care, compared with an average of 9.1%. However, as
has been regularly pointed out, the use of GDP as the reference point may be misleading
in the Irish case, since repatriation of profits abroad is both very high and variable from
one year to the next. Expressing health expenditure as a proportion of GNP instead
makes very little difference to any of the other countries covered but increases Irish
health spending markedly, to 7.6 per cent – about the same as the UK though still well
below average (joint 10th highest out of 22 OECD countries).
7
Table 5: Financial Resources Devoted to Health Care, OECD Countries, 2002
Country Total Health Expenditure as a
% of GDP
Total Health Expenditure as a
% of GNP
Total Health Expenditure per Capita in $ PPP
Australia 9.1 9.4 2,504 Austria 7.7 7.8 2,220 Belgium 9.1 8.9 2,515 Canada 9.6 9.9 2,931 Denmark 8.8 9.0 2,580 Finland 7.3 7.3 1,943 France 9.7 9.7 2,736 Germany 10.9 10.9 2,817 Greece 9.5 9.5 1,814 Iceland 9.9 10.1 2,807 Ireland 7.3 9.0 2,367 Italy 8.5 8.5 2,166 Japan 7.8 7.7 2,077 Netherlands 9.1 9.3 2,643 New Zealand 8.5 8.4 1,857 Norway 8.7 8.6 3,083 Portugal 9.3 9.5 1,702 Spain 7.6 7.7 1,646 Sweden 9.2 9.3 2,517 Switzerland 11.2 10.4 3,445 UK 7.7 7.6 2,160 US 14.6 14.5 5,267
OECD 22 Average
9.1
9.2
2,536 Source: OECD Health Data 2004 (for total health expenditure and GDP) and European Commission, AMECO Macro-Economic Database 2004 (for GNP). Note: Data for Australia and Japan refer to 2001. Total health expenditure as a % of GNP for New Zealand refers to 2000.
However, the most striking feature of Ireland’s health spending is how rapidly it
has been increasing in absolute terms in recent years. Whatever about relative to rapidly
increasing GNP, health spending has risen very rapidly indeed in nominal terms – from
€2.2 bn. to €9.4 bn. between 1990 and 2002. Even when adjusted for the increases in
relevant prices, health spending has risen markedly in purchasing power terms. Figure 1
charts Irish total health expenditure per capita in purchasing power terms from 1990 to
2002, as calculated by the OECD, and by the end of the period the level of spending
was 3 times higher than in 1990. This depends of course on the reliability of the
adjustment made for the change in prices of the goods and services involved (holding
“quality” constant), which is notoriously difficult to capture in the health care area. It is
also worth noting that despite its rapid rate of increase, the level of spending per capita
8
Tota
l Hea
lth E
xpen
ditu
re $
PPP
in purchasing power terms in Ireland had still not reached the average for these 22
OECD countries by 2002.
Figure 1: Ireland’s Total Health Expenditure per capita expressed in $ PPP; 1990-
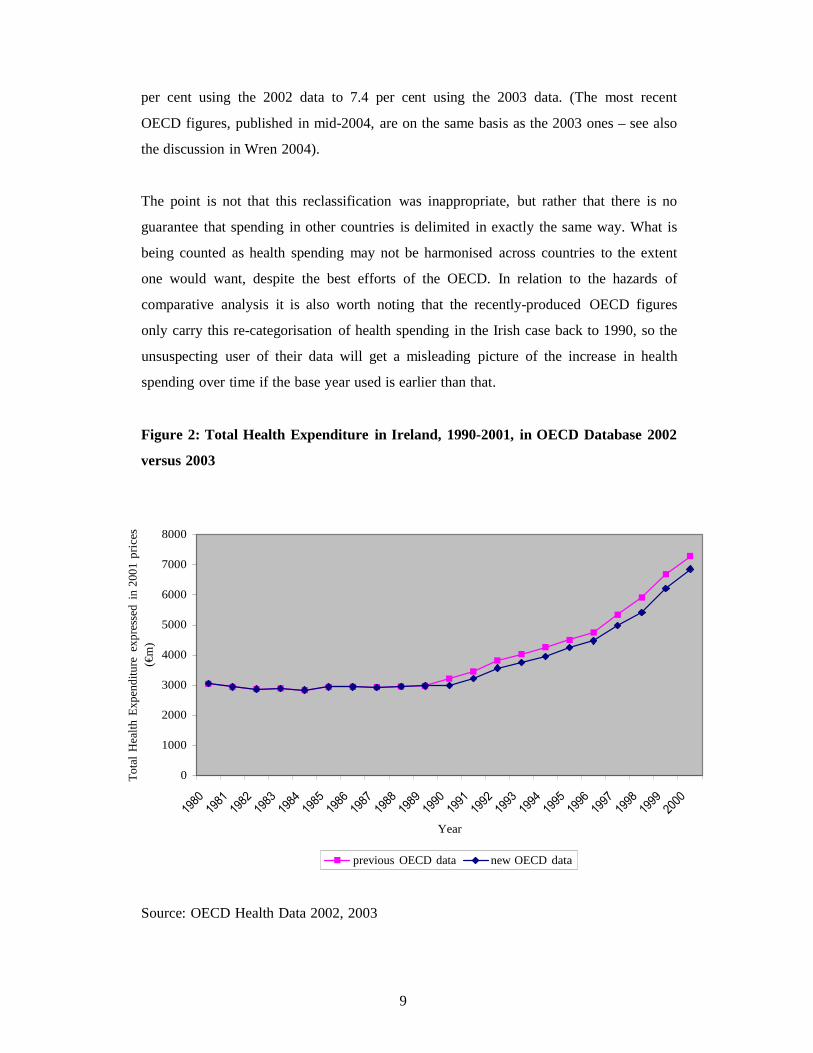
It is also worth entering an important caveat in relation to the comparative perspective
on Ireland’s health spending. This is illustrated by the comparison of the trend in health
spending shown in Figure 2 labelled “2003 OECD data” with the line labelled “2002
OECD data”. The latter shows the figures published in 2002 by the OECD in their
databank and in “Health At a Glance”, the source on which comparisons of this sort for
OECD countries now rely. We can see that this shows substantially higher levels of
health spending for Ireland than the set produced in 2003. This is because, in compiling
their 2003 set of data, the OECD with the help of the Department of Health and
Children re-examined the nature of the spending involved, and decided to exclude
certain sub-heads of Irish public health spending which relate to what would in other
countries probably be counted as social services or social transfers. Consequently, the
percentage of GNP accounted for by health spending in Ireland for 2000 fell from 7.9
9
Tota
l Hea
lth E
xpen
ditu
re e
xpre
ssed
in
2001
pric
es
(€m
)
per cent using the 2002 data to 7.4 per cent using the 2003 data. (The most recent
OECD figures, published in mid-2004, are on the same basis as the 2003 ones – see also
the discussion in Wren 2004).
The point is not that this reclassification was inappropriate, but rather that there is no
guarantee that spending in other countries is delimited in exactly the same way. What is
being counted as health spending may not be harmonised across countries to the extent
one would want, despite the best efforts of the OECD. In relation to the hazards of
comparative analysis it is also worth noting that the recently-produced OECD figures
only carry this re-categorisation of health spending in the Irish case back to 1990, so the
unsuspecting user of their data will get a misleading picture of the increase in health
spending over time if the base year used is earlier than that.
Figure 2: Total Health Expenditure in Ireland, 1990-2001, in OECD Database 2002
versus 2003
8000
7000
6000
5000
4000
3000
2000
1000
0
Year
previous OECD data new OECD data
Source: OECD Health Data 2002, 2003
10
3. Use of GP Services by Income Level and Medical Card Status As we noted in the introduction to this paper, primary care has become a central
focus of official health strategy as Ireland, like many other countries, seeks to shift the
emphasis from expensive hospital-based health care to primary curative and
preventative interventions. General practitioners play the central role in primary care,
and one of the most distinctive features of the Irish healthcare system is the pricing of
GP services. For those who have medical card cover – generally because they fall below
the specified income threshold – GP visits are free. For the rest of the population, GP
visits must be paid for out of pocket on a fee per service basis; usually the patient has to
bear that full cost (i.e., it is not reimbursed even where they have health insurance). GPs
are free to set the charge to meet their full costs and provide them with an income and
the majority of GPs provide services to both sets of patients – medical cardholders and
non-medical cardholders. In many other OECD countries, by contrast, primary care is
either free or heavily subsidised, by one means or another, for most or all of the
population.
This pricing structure in the Irish context gives rise to a number of concerns, so
it is useful to look at the empirical evidence about the use of general practitioner
services by people at different income levels, and in particular by those with and
without entitlement to free GP care due to the medical card system. Once again it is
helpful to start with a comparative perspective. Using data from the European
Community Household Panel Survey for representative samples of the populations of
most of the “old” EU 15 countries, we can derive GP visiting rates for adults by position
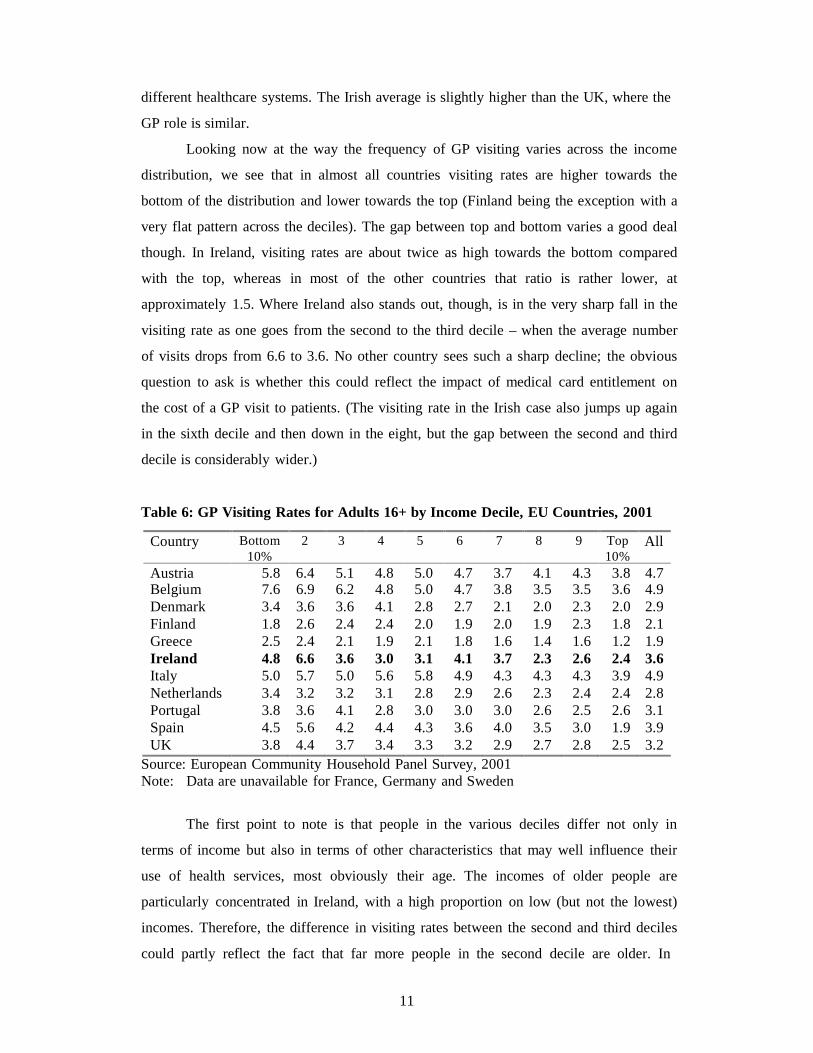
in the income distribution.4 Table 6 shows for 2001 the average number of GP visits in
the previous year for adults (aged 16+) in the bottom one-tenth (decile) of the income
distribution in their country, the next one-tenth and so on up to the top one-tenth, as
well as the overall average. (This ranking is on the basis of household income adjusted
for the size and composition of the household using what are termed “equivalence
scales”).
We see first that the overall average visiting rate in Ireland, of 3.6 visits per
person per year, is about the middle of the range across these countries. That range is in
fact rather wide, running from almost 5 in Austria, Belgium and Italy down to less than
2 in Greece, reflecting inter alia the different roles played by general practitioners in
4 Sweden did not participate in the survey, and some other countries (Germany, France) participated but did not have exactly the data we are focusing on here for 2001.
11
different healthcare systems. The Irish average is slightly higher than the UK, where the
GP role is similar.
Looking now at the way the frequency of GP visiting varies across the income
distribution, we see that in almost all countries visiting rates are higher towards the
bottom of the distribution and lower towards the top (Finland being the exception with a
very flat pattern across the deciles). The gap between top and bottom varies a good deal
though. In Ireland, visiting rates are about twice as high towards the bottom compared
with the top, whereas in most of the other countries that ratio is rather lower, at
approximately 1.5. Where Ireland also stands out, though, is in the very sharp fall in the
visiting rate as one goes from the second to the third decile – when the average number
of visits drops from 6.6 to 3.6. No other country sees such a sharp decline; the obvious
question to ask is whether this could reflect the impact of medical card entitlement on
the cost of a GP visit to patients. (The visiting rate in the Irish case also jumps up again
in the sixth decile and then down in the eight, but the gap between the second and third
decile is considerably wider.)
Table 6: GP Visiting Rates for Adults 16+ by Income Decile, EU Countries, 2001
Source: European Community Household Panel, 2001 Notes: Data are unavailable for France, Germany and Sweden
We have pursued this using micro-data from the Living in Ireland Survey, the
Irish element of the European Community Household Panel. Estimation of an
econometric model of GP visiting behaviour using Irish data for 2001 allows us to relate
the reported number of visits by each adult to a range of characteristics including their
age, gender, education, household income and medical card status. Valuably, we were
also able to control to some extent for differences in health status, which is particularly
13
important since those on low incomes are distinctive not just in having medical card
cover, but are also likely to have poorer health and a greater need for health care than
the rest of the population. While the measures of health status available to us in the
survey are crude, they do allow us to go some way towards taking such differences in
needs into account.
Cross-sectional analysis described in detail in Nolan and Nolan (2003) and
Madden, Nolan and Nolan (2004) find that medical card entitlement has a highly
statistically significant and substantial influence on the number of GP visits an
individual reports. Having controlled for all the other characteristics mentioned,
including health status, those with medical card cover have on average about 1.6 more
visits each year than those with similar characteristics but without a medical card. Even
if the health status indicators available to us understate the difference in needs between
those with and without medical cards, it seems likely that the different financial
incentives they face also play a role in producing this very substantial gap.
It is also important to investigate whether this effect is more pronounced in the
income ranges above but still quite close to the medical card threshold. There has been a
great deal of concern expressed about the position of families just above the threshold,
who would be brought within medical card entitlement by raising the threshold as the
government are committed to doing at some point. For this paper we tested whether
proximity to the threshold makes a marked difference to visiting rates by introducing a
set of interaction terms between income decile and the variable in our model capturing
medical card status. These interaction terms do not turn out to be statistically
significant. These results suggest, on the face of it, that the key difference in terms of
GP visiting rates in Ireland is simply between those with and without medical cards.
While the analysis to date has been cross-sectional, we have also begun to
exploit in this context the longitudinal nature of the Living in Ireland Survey data, i.e.,
the fact that it sought to interview the same individuals from one year to the next. This
means we can follow people from 1995 up to 2001 and identify those who moved from
having medical card cover to not having cover and vice versa, and investigate whether
their GP visiting rates changed. Visiting rates do fall on average when medical card
cover is lost and rise when medical card cover is “gained”, but this could be for a
14
variety of reasons including changes in health and thus the need for care.5 The next
stage in the analysis is to estimate econometric models controlling for, among other
things, changes in reported health status and see the extent to which changes in visiting
rates not associated with such variation in need are identified.
How should one react to the fact that medical cardholders visit the GP more
often than those without cover, even when we control for measured differences in health
status? Does this mean that medical cardholders “overconsume” or non-medical
cardholders “underconsume” GP services, or indeed both? Deciding on an appropriate
benchmark against which to make such a judgement is difficult, since we don’t know
the “right” level of visiting from a medical, much less a cost-effectiveness point of
view. International comparisons reveal countries with higher average levels of visiting
towards the bottom of the income distribution than Ireland, and ones with similar
(though not lower) rates towards the top. What we can say is that, given the gap
between those with and without medical cards, it is unlikely that both are optimal –
again, from a medical or cost-effectiveness point of view.
If we regard the present situation as distorted, then, the next issue is best how to
address that distortion. From an incentives perspective, one can look at both supply and
demand sides, providers and patients. Focusing on providers, it seems plausible that
providers paid on a fee-for-service basis to treat patients facing zero price would be
particularly likely to induce demand; this was indeed a key rationale behind the change
in the reimbursement system for GMS GPs in the late 1980s, following on the research
by Tussing (1985). However, when we estimated the cross-sectional models mentioned
earlier for 1987, 1995 and 2000, this did not reveal any narrowing of the gap between
medical cardholders and others after the change to a capitation reimbursement system
(see Madden, Nolan and Nolan 2004).
Turning to the patient side of the equation, the issue of charging for health care
and its impact on utilisation and efficiency is a perennial and much-debated one in the
health economics literature (see Nolan 1993 for a discussion). The key question is not
now whether charges affect utilisation – the accumulating evidence is that they do, and
our findings to date are consistent with that pattern. Rather, the critical question is
whether charges reduce “necessary” as well as “unnecessary” visits, and by its nature
5 It would hardly be surprising if visiting fell when someone moved from being out of work due to illness or disability into work, or rose when the opposite occurred; the pattern described remains when we exclude such cases, but .
15
that is very difficult to assess. Perhaps the most important point to stress in this context
is the uncertainty inherent in making that distinction for the patient ex post. It is difficult
for experts to make an assessment of the value of a specific visit after the event; it is
even more difficult for a “layman” to do so when deciding whether to visit, since the
motive for visiting a doctor is often to see if medical intervention is needed because the
individual simply doesn’t have the knowledge to make that judgement. This uncertainty,
identified as critically important to the economics of health care as long ago as Arrow
(1963), means that charges inevitably discourage “necessary” as well as “unnecessary”
visits. This of course applies to the current substantial charges facing Irish patients
without medical cards, as well as to any charges that might be levied on medical card
patients.
4. Health Insurance Over the past decade or so the context in which Ireland’s complex mix of public
and private health care operates has changed radically, as the numbers purchasing health
insurance soared and the nature of the insurance market has changed in response to EU
regulations. This has widened the divide between those with and without health
insurance, and called into question the public-private structure on which Ireland has
relied for many years. Almost half the Irish population now pay for private health
insurance, one of the highest levels of coverage in the OECD. This is despite the fact
that hospital care is covered by private health insurance and everyone has entitlement to
public hospital care from the state. The insured can avail of “private” health care, but
much of this private care is actually delivered in public hospitals. The resulting two-tier
system is now widely regarded as problematic from an equity perspective, but there are
also serious efficiency issues arising from the incentive structures embedded in this
particularly close intertwining of public and private.
It is worth dwelling briefly on how this situation has come about. For many
years those towards the top of the income distribution in Ireland have been encouraged
to take out “private” health insurance. In the late 1950s the Voluntary Health Insurance
Board (VHI) was established as a monopoly state-backed not-for-profit health insurer to
cater for the top 15 per cent or so of the income distribution, who did not (then) have
entitlement to public hospital care from the state. This state-backed insurer operated
community rating and income tax relief was available on premia paid. This structure
16
was designed, inter alia, to ensure that the entire population had access to hospital care
while satisfying the demands of medical consultants that their private practice not be
undermined. Those towards the top of the distribution were in effect encouraged to take
out “private” insurance, while the cost of in-patient care for the rest of the population
was fully covered by the state.
To complicate the picture – and it is a crucial difference between Ireland and
many other countries – not only was “private” insurance provided for many years by
what was to all intents and purposes an arm of the State, much of the “private” care it
covers was and is delivered in public hospitals. Medical consultants retained the right to
treat their private patients in public hospitals, and about half of all private hospital care
is in fact delivered in those hospitals. Most patients receiving private care – in a public
or private hospital - have insurance, and the insurer reimburses both medical consultant
and hospital. However, for many years public hospitals only charged for the “hotel”
facilities associated with being in a private room. In addition, most medical consultants
are contracted to care for public patients in public hospitals on a salaried basis, while
maintaining the scope to treat private patients on a fee-for-service basis. The public and
private systems in Ireland, rather than being distinct, have had what has accurately been
described as a symbiotic relationship (Barrington 1987; see also Wren 2003).
From the 1950s to the late 1970s or early 1980s, this public-private mix
supported by “private” health insurance functioned in roughly the way it was designed
to do, with a monopoly insurer covering private care for the well-off and in effect
“topping up” the public system. There have been fundamental changes in the health
insurance landscape since then. The first is the dramatic rise in the percentage of the
population buying health insurance. This jumped up from about 20 per cent to 30 per
cent in the late 1970s, jumped once again in 1987 to 35 per cent, rose steadily through
the 1990s and by now is very close to half the population. This occurred despite the fact
that full entitlement to public hospital care (subject to some charges levied on all those
without medical card cover) was extended to the top part of the income distribution in
the early 1990s.
So health insurance in Ireland, having been the preserve of the better-off for
many years, now covers half the population. Quite why this increase in the numbers
buying health insurance has occurred is not well understood. The scale of economic
growth and increasing real household incomes in Ireland during the 1990s – the “Celtic
Tiger” - has clearly made it possible for more people, but this does not explain why they
17
want or feel the need to have health insurance cover. The upward trend in numbers
insured has also proved remarkably resilient in the face of significant annual premium
increases and a diminution in income tax relief as tax rates fell and relief was scaled
back to the standard rather than the purchaser’s marginal tax rate. Econometric time-
series analysis also suggests that the evolution of income and price still leave much of
the increase in demand to be explained (Harmon and Nolan 2001), so it is also
important to explore what people think they are buying when they buy insurance, and
the alternative they face or believe they face without it.
Attitudinal surveys (see for example, Watson and Williams 2001, Health
Insurance Authority 2003) suggest that concern about waiting times for public hospital
care is uppermost in people’s minds, that quality of care has also come to be seen as a
significant issue, and that having a private room or other “hotel” aspects are not seen as
an important reason for buying private insurance. Waiting times for public hospitals are
widely perceived to be long, both by those with and without insurance. So what people
essentially believe they are buying is the assurance that they can access hospital care
when they need it, without undue waiting and with care from a medical consultant of
their choice.
It seems plausible then that perceptions of access to public hospitals combined
with perceptions of the quality of public versus private care are key drivers
underpinning demand for health insurance. The role of media coverage in influencing
such perceptions merits examination, but there are indeed long waits for certain types of
public hospital treatment that are by-passed by those with insurance. In one of the
attitudinal surveys, for example, almost half the respondents said they personally knew
someone who recently had a lengthy wait for public hospital treatment – so they were
not simply reacting to media reports.
This two-tier hospital system is now widely regarded as problematic from an
equity perspective. Indeed, the issue of equity of access to hospital care for public
versus private patients has become a very high profile one politically and equity as a
goal has been highlighted in the official Health Strategy produced after lengthy
consultation in 2001. The focus of policy has been on regulating access to public
hospitals, on the proportion of private versus public beds in them, on the charges for
private care in public hospitals and on reducing waiting times for public patients.
However in our view this focus misses some deep-seated structural problems, in respect
18
to both equity and efficiency, which the recent upsurge in numbers insured has not
created but has certainly exacerbated.
Dealing first with equity, a number of different layers to the argument may be
usefully distinguished in assessing the fairness of the current system. Where separate
and distinct public and private healthcare systems operate side-by-side and private
health insurance provides cover for the latter, then a likely outcome is that those with
insurance – who are most often on higher incomes – will have more rapid access to
health care. Views may, and do, differ about whether this is equitable, both within and
across societies. However, the role of the state in subsidising health insurance or private
health care, directly or indirectly, adds a further dimension: some who see differential
access as fair if the full cost is being paid by those “going privately” might question its
fairness if the taxpayer is in effect covering part of the cost. A further, and even more
complex, dimension arises when – as in the Irish case – much of the private care to
which those with insurance gain access is actually being delivered in public hospitals. In
that situation, the financial flows underpinning the system are more difficult to
disentangle but the two-tier nature of access by those with versus without insurance is
more striking.
So what is distinctive about the Irish case is that the public hospital system has
come to be seen very widely as a two-tier one, offering the better-off more rapid access;
the fact that they are in effect subsidised by the taxpayer in doing so is less widely
debated but well understood by analysts. Subsidisation comes through tax breaks on
insurance premia and below-cost charges for private care in public hospital; recently
this charge has been raised significantly but still represents an implicit subsidy to
private care in public hospitals (Nolan and Wiley 2001). The clarity of the distinction
between private versus public beds in those hospitals and how to ensure that private
patients do not obtain preferential access through public beds have also been the focus
of particular attention from policy-makers.
Even if private care in public hospitals covered its full cost or even generated a
surplus to cross-subsidise care of public patients, an equity concern would arise about
two-speed access to those hospitals. The main argument advanced for retention of
private care in public hospitals is that this allows the most able medical specialists to be
available to care for public patients. There has been no attempt to assess the scale of the
purported benefits to the public system, nor whether the benefits of close interaction
with private care are outweighed by the costs.
19
These costs include not only the direct and indirect subsidisation already
mentioned, but also the distortionary impact of the incentives for medical consultants
and hospital managers associated with the inter-mingling of public and private care.
Most medical consultants employed to treat public patients, and paid a salary for doing
so, also have private patients for whom they are paid on a fee-per-service basis. While
consultants are committed to a specified number of hours per week caring for public
patients there is no effective monitoring and the incentive they face to concentrate more
of their attention on private patients – even if it is by working very long hours over and
above their public commitment – may clearly be to the detriment of public patients.
(Unlike private patients, many public patients will be treated by more junior doctors).
Public hospital managers also face an incentive to maximise revenue from private
patients in any given year, since this is one of the few sources of additional revenue
available to them.
Some of these incentive issues might still feature, though they would probably
be less pronounced, if private care was delivered only in private hospitals – if for
example consultants still had a mix of private and public patients and were in effect
incentivised to prioritise the former. Equity concerns could still be raised about faster
access to such private hospitals, especially if the state subsidises them not only
indirectly by favourable tax treatment of insurance premia and via training of staff in the
public system, but also by direct tax breaks to encourage building private facilities as
have recently been introduced by the Irish government. However, both efficiency and
equity concerns are undoubtedly heightened by Ireland’s peculiarly intimate public-
private mix.
Health insurance underpins Ireland’s public/private mix. The major change in
the landscape in that respect came in response to the EU’s 1992 Third Non-Life
Insurance Directive, designed to stimulate competition in insurance. The Irish
government enacted legislation opening up the health insurance market, and BUPA
Ireland commenced operation in 1997. The way that market operates is tightly
regulated: Ireland obtained approval from the EU to continue to require all insurers to
apply open enrolment, community rating and lifetime cover, as enshrined in the 1994
Health Insurance Act and the 1996 Health Insurance Regulations. In 2001 the Health
Insurance Authority was set up to oversee and regulate the market. Among its
responsibilities is the implementation of a risk equalisation scheme in order to support
community rating. This has proved particularly controversial and no transfer of funds
20
across insurers has yet taken place. The VHI continues to dominate the market, with
about 95 per cent of subscribers and although its status has been debated it remains a
not-for-profit body whose board is appointed by the Minister for Health, requiring
official approval for changes in premium levels.
The highly regulated nature of the private health insurance market in Ireland is
distinctive. Open enrolment, community rating and lifetime cover are enshrined as core
principles, reflecting the role which public policy has traditionally assigned to insurance
in the health care system. These restrictions have not been much debated and appear
widely supported, but their rationale is in fact open to question. The logic that applied
when public policy saw insurance financing hospital care for the well-off cannot simply
carry over to what is now a very different situation. Indeed, it is far from clear where
policy now sees insurance fitting in and going, in a situation where everyone is entitled
to avail of public care on the same basis but half choose to buy insurance.
Implementation of the risk equalisation scheme in order to support community
rating, on the other hand, has proved controversial – at least between the two insurers
who would be affected. A vigorous debate between them has continued as to the
justification for such a scheme and the need for a transfer and no transfer of funds
across insurers has yet taken place. This uncertainty may be acting as a deterrent to the
entry of further insurers to compete in the Irish market.
None the less, the entry of BUPA and potential entry of further insurers is a
fundamental change in the health insurance market. The fact that the VHI, though still
dominating the market, faces real competition from BUPA and the potential for entry by
more competitors has clearly affected behaviour in the market. This is most obvious in
the range of new insurance products which continue to appear and the efforts to market
them. Despite competition, however, the cost of insurance has continued to rise.
As well as the supply side, the prospects for the demand for health insurance are
also uncertain. Even if it were to plateau at about the current level, the dynamic effects
of recent growth in the numbers purchasing health insurance still have to work their
way through. It is not clear, from a financial or broader public policy perspective,
whether a 50/50 split between those with and without insurance, is inherently unstable.
From a public policy perspective, it is hard to see why the number taking out private
insurance should in itself be a target variable. If however public policy gave priority to
effectively improving access to, and quality of, care for public patients in public
21
hospitals this might have a significant impact on demand for private insurance, given
the apparent importance of perceptions of the public system in promoting that demand.
While health has of course become an extremely high-profile and politically
sensitive topic, health insurance itself has not come centre-stage in the public debate –
which has focused on waiting times for public hospital care and the location of those
hospitals. Some alternative structures involving “insurance for all”, either via social
insurance or subsidised private insurance, have been put forward but this discussion has
not as yet progressed very far. The slogan that “everyone should be a private patient”
amply illustrates that having 50 per cent of the population with insurance alters the
context for such a debate. However, it will clearly be difficult to move forward when
“insurance for all” means very different things to different groups advocating it – and
clarity about who would gain and lose is notably lacking. In sum, recent Irish
experience shows that a structure designed to take advantage of possible benefits for the
public system of close interaction with private care can create perverse incentives, come
to be seen as inequitable in terms of access and utilisation and potentially undermine
that public system. The numbers currently with health insurance can also be expected to
fundamentally influence the political economy of structural reform.
4. Summary and Conclusions
This paper began by illustrating the value of benchmarking the performance of
Ireland’s health-care system against other countries. This showed that performance, as
reflected in a variety of indicators, to be disappointing. Some of the difficulties in such a
benchmarking exercise were seen when we looking at a key indicator, namely the level
of health spending. This has risen very rapidly indeed in nominal terms in recent years,
outpacing even the exceptional scale of economic growth. However, in purchasing
power terms and as a percentage of GNP it was only at the UK level – which the British
government considers too low compared with other EU countries – by 2002. Re-
classification of some spending by the Department of Health by the OECD in 2003 also
significantly reduced their estimate of Ireland’s health spending, a process which may
not be applied uniformly across countries.
With primary care a central focus of official strategies we then investigated the
use of general practitioner services by people at different income levels, in particular
those with and without entitlement to free GP care.. Having controlled for other
characteristics, including health status, those with medical card cover were found to
22
have on average about 1.6 more visits each year than those with similar characteristics
but without a medical card. Even if the health status indicators available to us understate
the difference in needs between those with and without medical cards, it seems likely
that the different financial incentives they face also play a role in producing this very
substantial gap. The current substantial charges facing Irish patients without medical
cards in all probability discourage some “necessary” as well as “unnecessary” GP visits,
and this would also apply to introducing charges for medical card patients, essentially
because of the uncertainty about drawing this distinction – particularly for the layman in
deciding whether to visit.
Finally, we identified some key issues in relation to both equity and efficiency
arising from the unique role which private health care and health insurance plays in the
Irish healthcare system. The public hospital system facilitates the better-off in obtaining
more rapid access to care, and incentives for medical consultants and hospital managers
are distorted by the inter-mingling of public and private care. Health insurance
underpins this public/private mix in a highly regulated market. Open enrolment,
community rating and lifetime cover reflects the role which public policy has
traditionally assigned to insurance, but the logic that applied when insurance financed
hospital care for the top 15% now needs to be re-examined. A structure designed to take
advantage of possible benefits for the public system of close interaction with private
care has created perverse incentives, come to be seen as inequitable in terms of access
and utilisation, and could potentially undermine that public system. However, the
numbers now having health insurance also fundamentally influence the political
economy of structural reform.
23
References
Arrow, K., “Uncertainty and the welfare economics of medical care”, American
Economic Review, 53, 941-970, 1963.
Barrington, R. Health, Medicine and Politics in Ireland: 1900-1970. Dublin: Institute of
Public Administration, 1987.
Conference Board of Canada. Understanding Health Care Cost Drivers and Escalators.
Ottawa: The Conference Board of Canada, 2004.
C. Harmon and Nolan, B., “Health Insurance and Health Services Utilization in
Ireland”, Health Economics, 10 (2), 135-46, 2001.
Health Insurance Authority, The Private Health Insurance Market in Ireland. Dublin:
Health Insurance Authority, 2003.
Madden, D., Nolan, A. and Nolan, B., GP Reimbursement and Visiting Behaviour in
Ireland, mimeo, Dublin: ESRI, 2004.
Nolan, B. Charging for Public Health Services in Ireland: Why and How? Policy
Research Series Paper No. 19, Dublin: The Economic and Social Research Institute,
1993.
Nolan, A. and Nolan, B., A Cross-Sectional Analysis of the Utilisation of GP Services in
Ireland: 1987-2001. Working Paper No.1 of Research Programme on Health Services,
Health Inequalities and Health and Social Gain: ESRI, ISSC and University of Ulster,
2003.
Nolan, B. and Wiley, M., Private Practice in Irish Public Hospitals. General Research
Series 175. Dublin: ESRI, 2001.
24
Tussing, A. D., Irish Medical Care Resources: An Economic Analysis. General
Research Series Paper No. 126. Dublin: Economic and Social Research Institute, 1985.
Watson, D. and Williams, J., Perceptions of the Quality of Care in the Public and
Private Sectors in Ireland. Report to the Centre for Insurance Studies, Graduate School
of Business, UCD, 2001.
Wren, M.-A., Unhealthy State – Anatomy of a Sick Society, New Island: Dublin, 2003.
Wren, M.-A., “Health Spending and the Black Hole, in Quarterly Economic